1. Introduction
In the recent years, the International Energy Agency (IEA) and the European Union (EU) organizations provided milestone guidelines and adopted policies and incentives concerning the energy efficiency or the use of renewable energy sources [
1,
2]. At European level, a particular focus has been put on building energy consumption sector, which shows a high primary energy consumption [
3]. In fact, the 2010 Energy Performance of Buildings [
4] and the 2012 Energy Efficiency [
5] Directives highlight the policies undertaken by the European Union regarding the reduction of the energy consumption of buildings. In the building energy consumption sector, a particular category consists of sport centres structures. Typically, sport centres present a fairly high thermal demand, often matched by traditional and outdated boiler installations. Such solutions imply a significant primary energy consumption and environmental impact in terms of greenhouse gasses emission. Several projects have been funded by EU dealing with energy efficiency and the use of renewable energy sources in sport centres [
6,
7]. In general, the application of renewable energy sources to sport centre installations can lead to possible benefits in terms of primary energy saving and environmental pollution reduction [
8]. Such benefits increase in case of sport centres with swimming pools, due to the higher thermal load of such users compared to the standard sport centres without swimming activities [
8]. Different renewable energy sources can be exploited in order to match the energy demands of a sport centre, such as: solar [
9], biomass [
10] and geothermal [
11].
The open literature shows a significant attention on energy efficiency and renewable energy in sport centres [
12,
13]. Nord et al. [
14] developed a model for energy planning for an air supported sports hall, operating under cold climate conditions. A measurement campaign was performed and different energy efficiency possibilities were analysed. For the selected case study, 14.2% of the hall total cover area lacked insulation. A possible improvement consisting of the full insulation of the hall cover was investigated. The results showed that such solution does not significantly reduce the heating demand. The analysis pointed out that an energy saving of 27% could be achieved when 50% of the indoor air was recirculated by the air conditioning system. Artuso and Santiangeli [
8] developed a tool for the preliminary estimation of the sports centres’ energy demand. The integration of renewable energy sources has been taken into account in order to analyse the possibility of a self-sufficient building from the energy point of view. A case study of a sport centre located in Dubai, analysed by the developed tool, has been investigated. The analysis outlined that a 100% renewable energy system is possible, with a reduction of 6000 t/year of CO
2 emissions compared to a traditional system. Revel and Arnesano [
15] presented a monitoring methodology that includes the analysis of thermal comfort for sports facilities. The authors analysed the relation between the energy use and the level of comfort perceived by the users, in order to allow fully informed management operations. Furthermore, a simulation of a 1-year operation of a swimming pool was performed in order to simulate comfort and energy flows data. Authors assess that the methodology is suitable for the evaluation of users’ real thermal comfort and for energy saving purpose.
A particular attention is given by the recent literature to sport centres including a swimming pool. Yuce et al. [
16] investigated the consumption and thermal comfort level of an indoor swimming pool through a predictive Artificial Neural Network (ANN) approach. Several environmental and control variables were used to determine the effect on energy consumption and thermal comfort. The existing system was analysed in order to develop the approach and calibrate the simulation model. The selected algorithm (Levenberg–Marquardt) achieved good results for the selected case study of a facility located in Rome, Italy.
Kuyumcu et al. [
17] studied the performance of a swimming pool heating system based on the use of waste heat rejected from an ice rink chiller unit, subsequently stored in an underground storage tank. The optimum size of the ice rink has been calculated, taking into account for different ground, tank, chiller and heat pump characteristics. The results outline that 6–7 years of operational time is needed in order to achieve a stationary annual operation of the system.
A system including a Water Solar Assisted Heat Pump (W-SAHP) coupled with unglazed flat plate collectors was considered for a swimming pool installation by Tagliafico et al. [
18]. In particular, a model was developed and monthly-based averaged simulations were carried out. The presented calculation procedure was applied to a considerable number of locations in order to show that it is applicable to any building and location. A correlation between degree days and primary energy saving index was found. Another study dealing with heat pumps was developed by Sun et al. [
19]. Authors investigated the application of a heat pump dehumidifier as energy saving measure in an indoor swimming pool. Indoor environmental conditions were analysed and models of heat and moisture gain were developed. For the case study of Shanghai, the results showed that the operation of the heat pump dehumidifier can match the thermal demand of the pool when the air specific enthalpy overcomes 18.6 kJ/kg. The economic analysis outlined a payback period of 1.10 years.
Katsaprakakis [
20] investigated different passive and active heating systems for swimming pool facilities. In particular, swimming pools’ enclosure and the placement of floating insulating covers were analysed as passive systems, while a biomass heater, solar collectors coupled with biomass boiler and a geothermal heat pump system were considered as active systems. A simulation model was developed in order to estimate the annual swimming pool thermal demand and to perform a techno-economic analysis. The performed analysis showed that the Simple Pay-Back (
SPB) period of the analysed systems is lower than 5 years.
Kampel et al. [
21] carried out an energy benchmark for swimming facilities based on performance indicators. In the study, 43 Norwegian swimming facilities were considered for the collection of the data. The analysis revealed that the overall water usage of the facility is the main parameter that determines the energy usage, while number of visitors mainly affects the variation in the energy performance of swimming facilities.
Buonomano et al. [
22] studied the technical feasibility and energy performance of a PhotoVoltaic/Thermal (PVT) collector system for a 600 m
2 indoor/outdoor swimming pool, under the Mediterranean climatic conditions. The dynamic thermal behaviour of the swimming pool was simulated with several literature models by means of TRNSYS software. The performed analyses showed that the swimming pool thermal energy demand significantly depends on the adopted model. Moreover, authors found that the optimal PVT collector field area ranges from 200 to 300 m
2. An interesting study is performed by Chow et al. [
23]. The paper deals with the analysis of a Solar Assisted Heat Pump (SAHP) system for indoor swimming pool space/water heating purposes. The TRNSYS software was used to model system and to analyse the system performance under the winter period operation. An overall system Coefficient of Performance (
COP) of 4.5 and a relatively high energy saving compared to the conventional energy system of 79% are achieved. The economic analysis outlined also that
SPB for the analysed SAHP system is lower than 5 years.
The available literature review shows a significant number of papers dealing with energy efficiency and renewable energy application in sport centres. Furthermore, a particular attention is given to facilities with a swimming pool installation. However, comprehensive analyses regarding possible measures concerning energy efficiency or renewable energy are scarce. In fact, the few papers available dealing with such investigations are based on simple analyses and/or models. In order to cover such lack, the authors investigate the possibility to perform an energy rehabilitation of an indoor swimming pool centre by means of solar and heat pump technologies, integrated in the existing conventional thermal installation. An air-to-water heat pump and several thermal collector types (unglazed, glassed, non-selective, selective, evacuated) are considered for the system rehabilitation. The investigated case study consists of an indoor semi-Olympic swimming pool centre, operating all year long except August and located in Naples, South of Italy. In order to perform the analysis of the possible configurations, a dynamic simulation model is developed by TRNSYS software. The model takes into account the existing plant of the centre and the integration of the proposed technologies. The dynamic simulation of the building, energy losses of the pool, the thermohygrometric conditions of the swimming hall and the energy production of the hybrid plant are evaluated. An experimental investigation is also performed in order to calibrate the swimming pool thermal model and the space conditioning equipment operation. Moreover, real data concerning the thermal demand of the centre are implemented and, the dynamic behaviour of the swimming pool occupants is also considered. It is worth noting that this paper presents some relevant novelties with respect to the findings available in literature and summarized in this section. In fact, the present paper includes a comprehensive energy and economic analysis of the system configurations coupled with experimental analysis, developed by detailed dynamic simulations, aiming at determining the swimming pool real thermal behaviour and evaluating the energy and economic performance of the proposed energy saving actions. To the authors’ knowledge, such detailed analysis has never been presented elsewhere.
The proposed technical solutions are analysed from an environmental, energy and economic point of view, considering different time bases (day, week and year). The study is completed with a parametric analysis aiming at determining the influence of the capacity of the solar field on the system performance.
2. Case Study
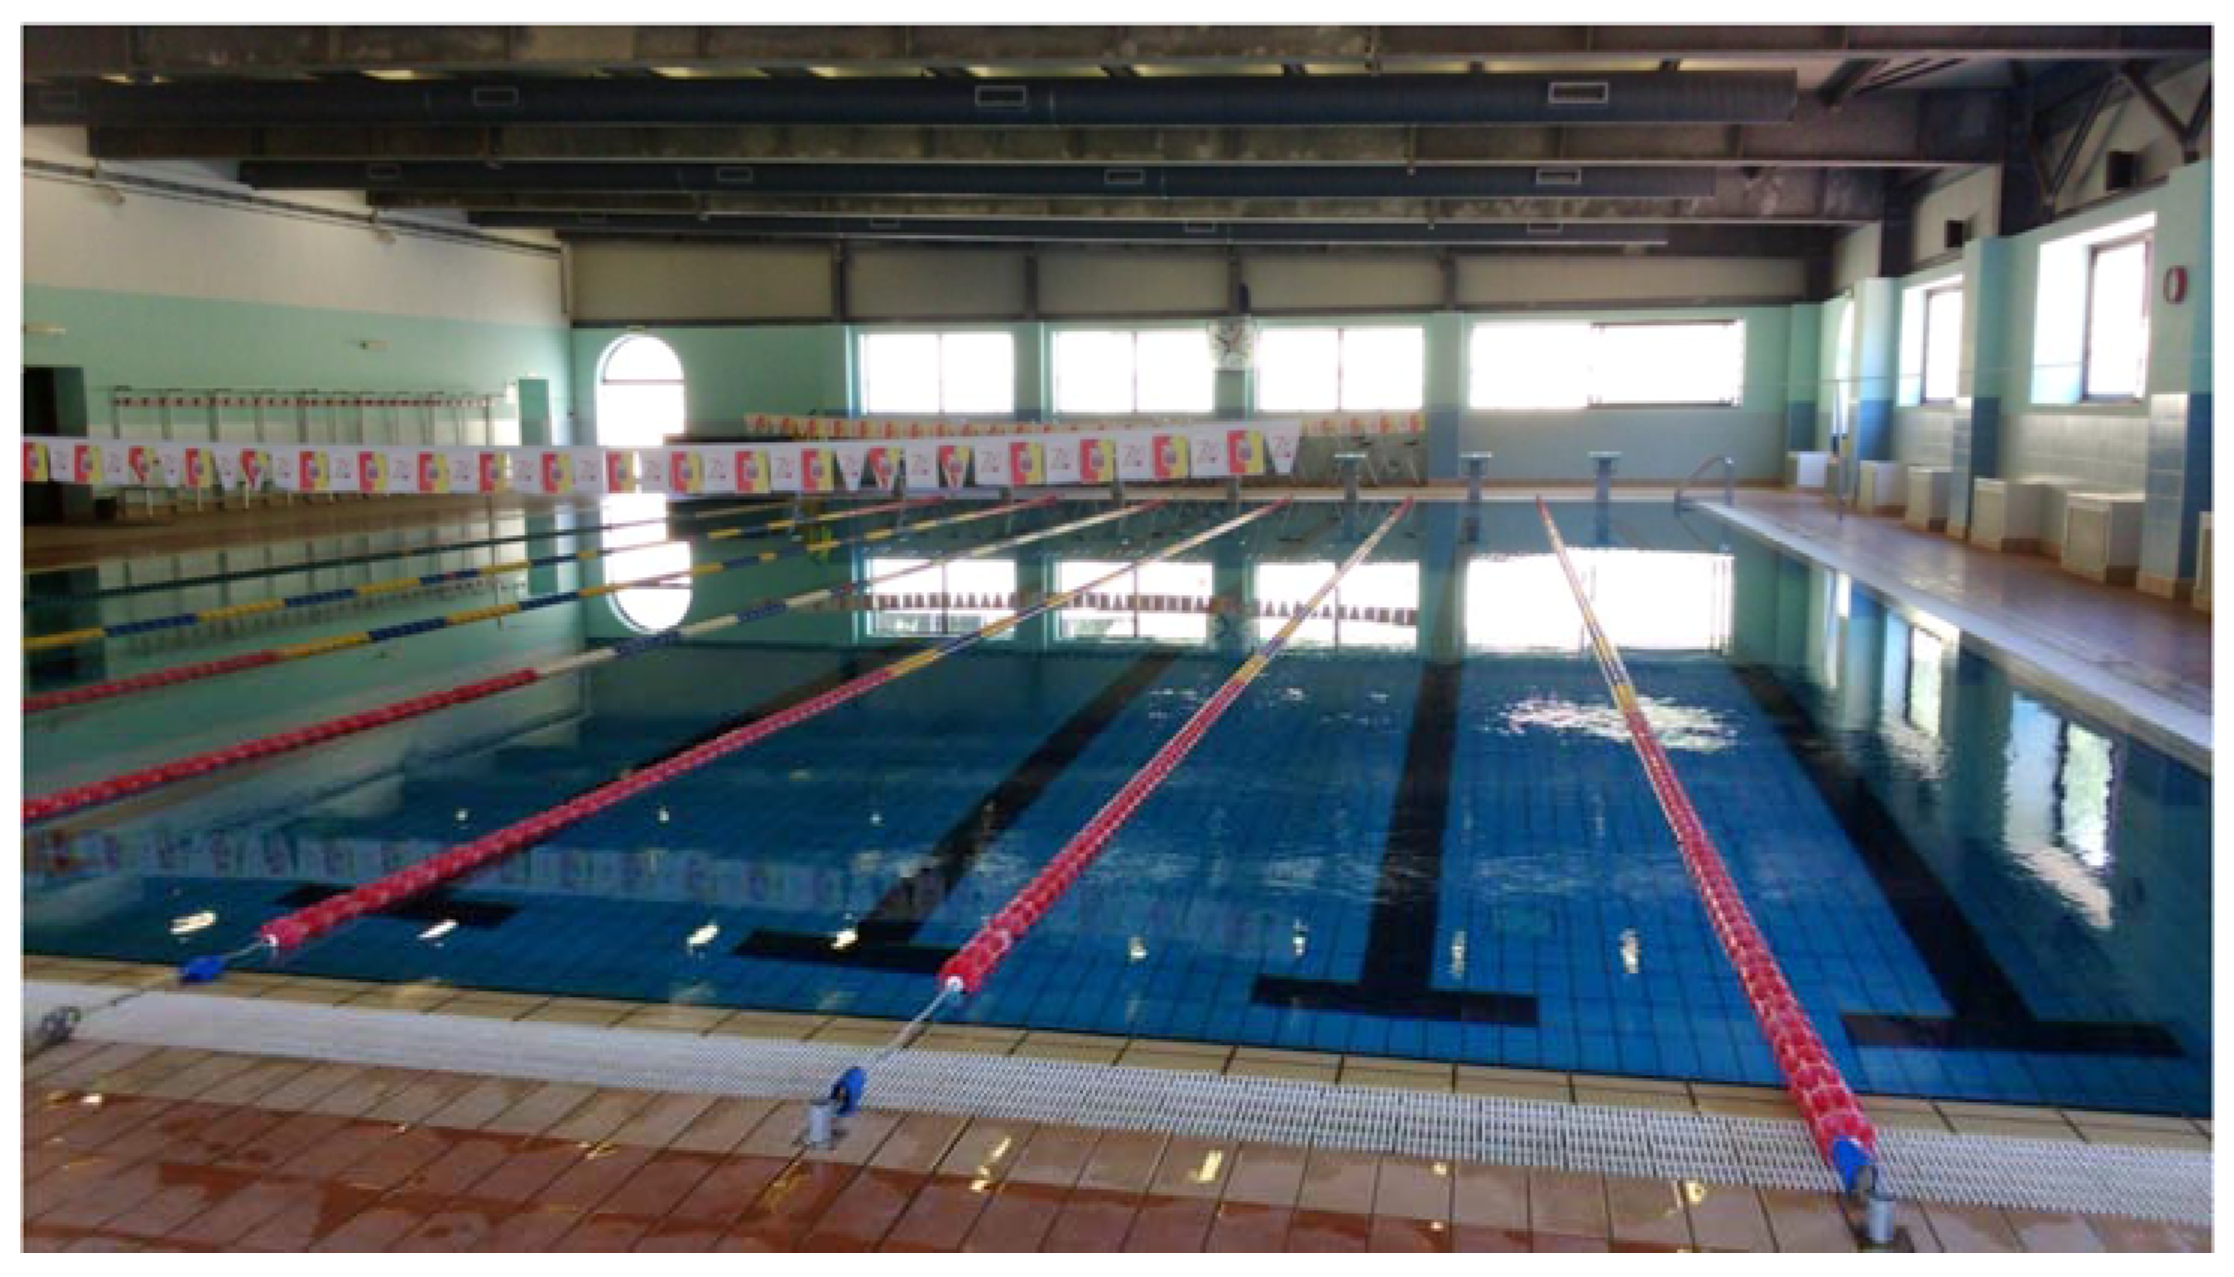
The case study consists of a university sport centre located in Naples, Southern Italy (40°48′54.6″ N 14°11′26.9″ E). The facility is a multi-purpose structure, where several sport activities are performed all year long. In particular, the study is focused on the indoor semi-Olympic swimming pool facility (
Figure 1).
The swimming pool volume is 855 m3, while the mean depth is 1.9 m. The swimming pool is equipped with a balance tank of 60 m3, installed along the shorter edge of the pool. The swimming pool hall width and length are 24.6 m and 37.3 m, respectively. The hall has a sloping roof, with a height increasing from 4.8 to 5.7 m. Several windows are installed on the external walls of the hall building, consisting of a not insulated single glass window without any shading devices.
The facility is open from Monday to Sunday from 7:00 a.m. to 10:30 p.m., with a number of subscribers of about 1000. The swimming pool hall is heated from 1 November to 16 May. The pool is emptied once a year in August, when the sport activities are stopped and the plant is closed. During the period of sport activity, the water temperature is always kept between 27 and 29 °C and it is constantly monitored by means of a real-time control system.
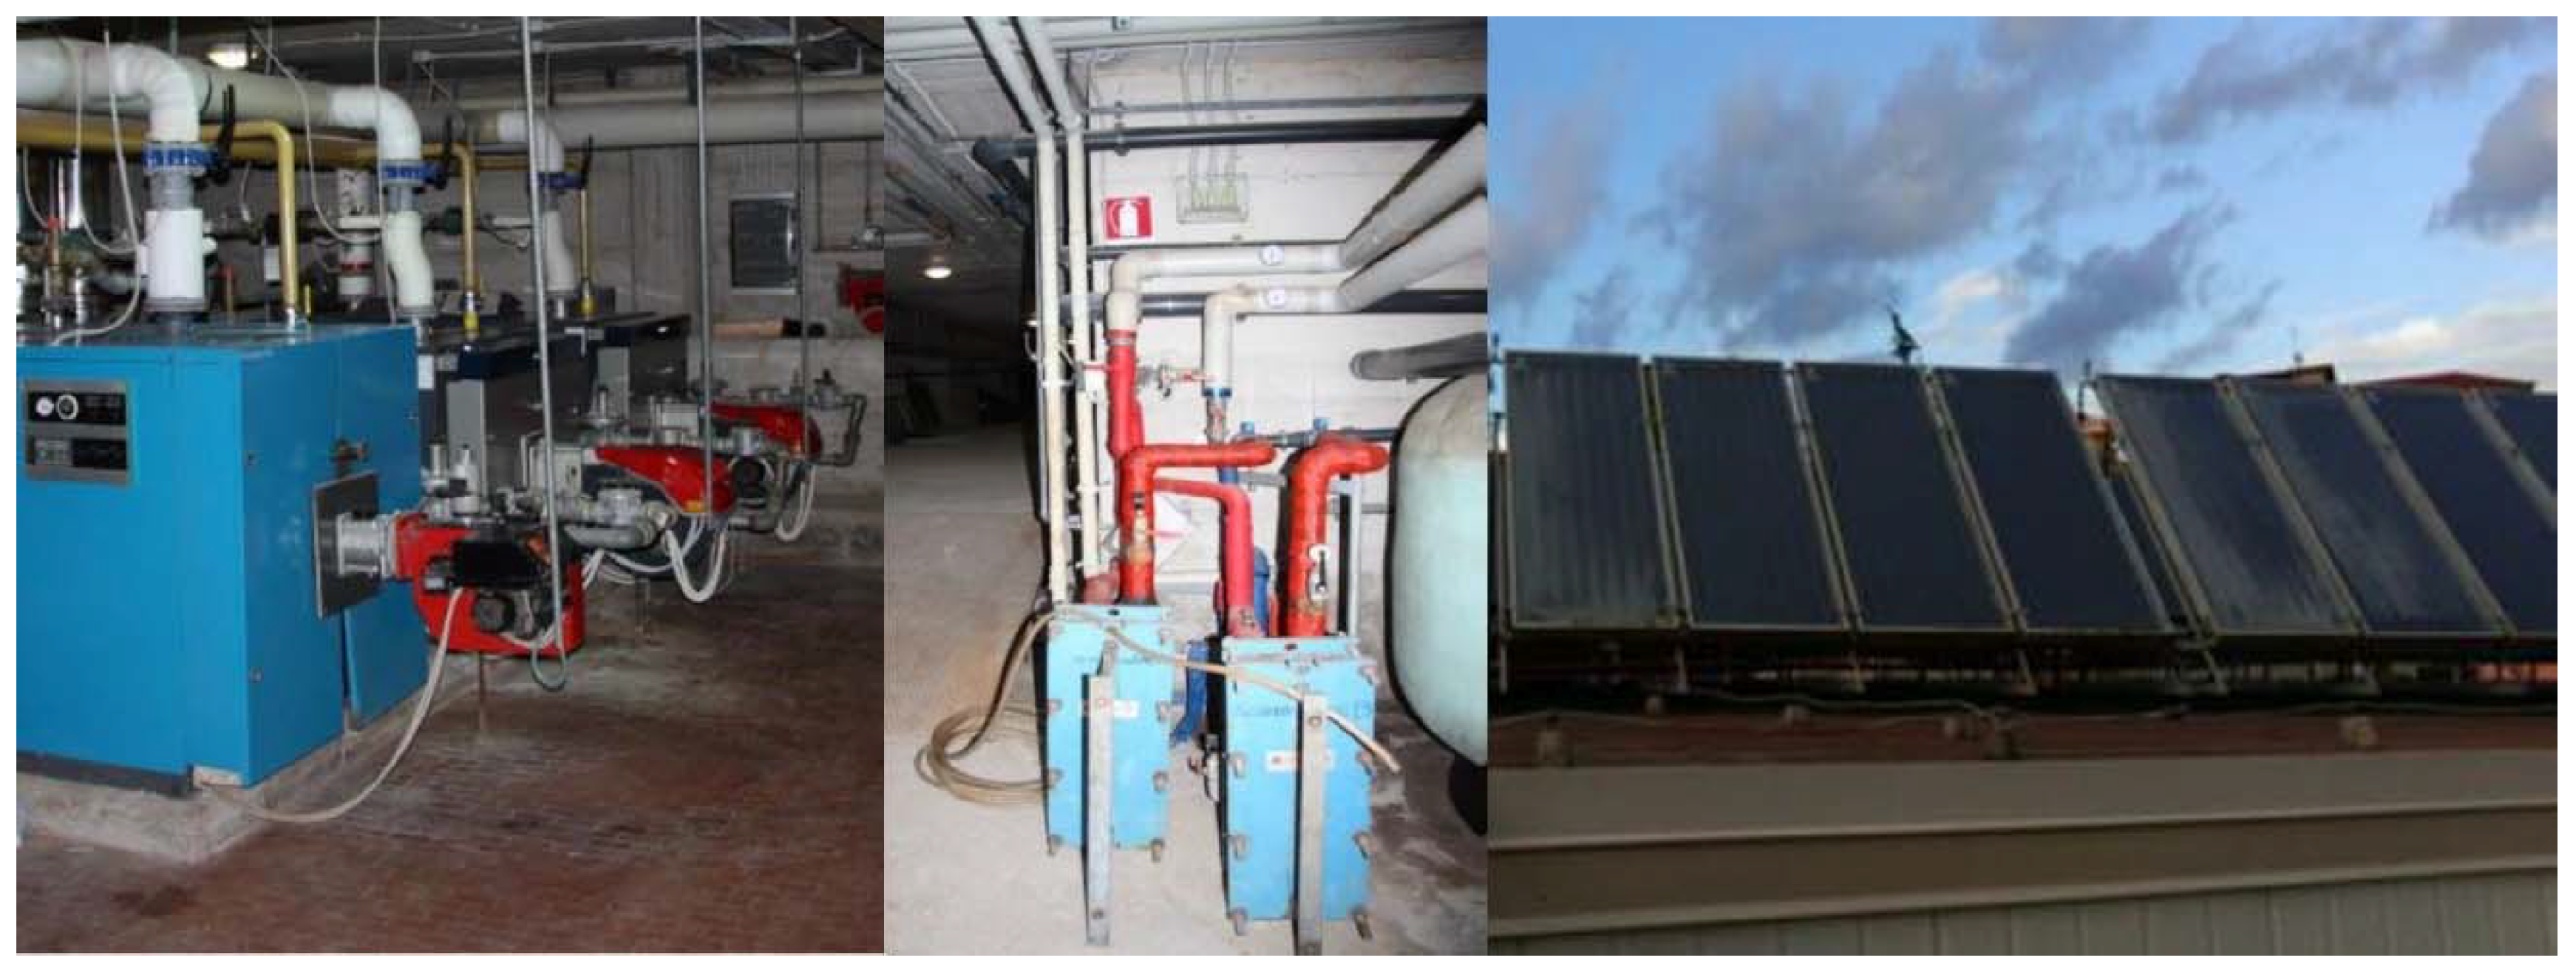
The thermal plant installed in the facility consists of several loops and components (
Figure 2). In particular, the following loops can be identified:
Solar collector fluid, SCF: water flowing within the existing solar thermal collectors field to the solar swimming pool heat exchanger and to the internal heat exchanger of the solar tank;
Preheated water, PHW: water flowing from the solar tank to the internal heat exchanger of the domestic hot water tank;
Hot water, HW: water flowing within the natural gas boilers collector and distributed to the domestic hot water preparation tank, the swimming pool heat exchanger and the air handling unit;
Aqueduct tap water, AW: fresh water used in order to produce domestic hot water and to supply new water to the swimming pool;
Domestic hot water, DHW: water supplied to the users for sanitary purposes (showers, handwashing, etc.);
Swimming pool water, PW: recirculating water of the swimming pool flowing within the filtering system to the solar and gas boiler heat exchangers.
The main components of the system are the following (some are shown in
Figure 3):
Solar collectors, SC, an existing solar thermal collectors field, consisting of obsolete flat-plate units, with an area of 64 m2 and a support structure ensuring a fixed slope angle of 30° for the collector;
Solar heat exchanger, HE1, consisting of a fin-plate cross flow heat exchanger and used in order to transfer the solar thermal energy to the swimming pool;
A thermal storage, TK1, that supplies the preheated water to the DHW tank heat exchanger, consisting of a stratified tank of 2.0 m3 equipped with two internal heat exchangers connected in series;
A thermal storage, TK2, used in order to provide DHW to the user, consisting of a 3.0 m3 stratified tank equipped with two internal heat exchangers. The first one, located in the bottom part of the tank, is supplied by PHW while the second one, located in the top part on the tank, is supplied by the natural gas boiler system;
Natural gas boiler system, GB, that provides the hot water to swimming pool heat exchanger, to the DHW internal heat exchanger and to the air handling unit. The system consists of three units, two of them with a 609 kW capacity and the remaining unit with 620 kW which rarely deactivated;
Swimming pool heat exchanger, HE2, supplied with hot water produced by GB in order to keep the swimming pool within the fixed range (27–29 °C), it consists of a fin-plate cross flow heat exchanger;
Air handling unit, AHU, consisting of a water to air conventional unit used for air heating and ventilation of the swimming pool hall. The unit includes a return fan, mixing chamber, filters, cooling/heating coil, supply fan, while it is not equipped with any heat recovery section. The AHU may operate using only fresh air, only return air or a mixture, depending on users’ needs;
Indoor swimming pool, POOL, consisting in a semi-Olympic overflow pool with rectangular shape; constant volume and uniform temperature are considered;
Pool balancing tank, BT, installed in order to receive the overflow water from the swimming pool and consisting in an enclosed tank;
Filtering system, FU, used in order to purify the recirculating swimming poll water.
The plant is also equipped with several diverters, D, mixers, M and pumps, P, used in order to manage and circulate the fluids within the loops of the installation. The technical specifications of the installation components (pumps, boilers, air handling unit, etc.) are determined by means of data sheets; however, such data are here omitted for sake of brevity. As previously mentioned, the system is already equipped with a solar collector field. Nevertheless, such installation is outdated and its thermal performance is relatively low due to the poor efficiency of the collector units.
The operating strategy of the existing installation is stated as follows. During the daytime, the SCF is pumped across the solar loop by means of P1. This pump is activated when the temperature difference between the outlet and inlet of SC rises above 10 °C, while it is deactivated when the previous difference drops to 3 °C. The SCF can be alternatively supplied to HE1 or to the internal heat exchanger of TK1 by means of the diverter valve D1. In particular, if the SC outlet temperature rises above 55 °C, SCF is supplied to the TK1 internal heat exchanger, otherwise SCF is supplied to HE1 in order to heat the swimming pool. The preheated water inside TK1 is used to produce DHW when the TK1 top side temperature is higher than the one at the bottom of TK2. The solar loop control strategy is reported in
Figure 4 (left). Furthermore, the boiler system operates 24 h/24 h in order ensure a fixed set point temperature (65 °C) on the boiler system collector. TK2 internal heat exchanger is supplied by HW when TK2 top temperature drops below 55 °C, while P3 is deactivated the temperature increases to 60 °C. DHW is supplied to the user at 45 °C by means of a tempering valve mixing the tab water with the one of the tank. In addition, the boiler system supplies HW to the air handling unit during the swimming pool hall heating period, in order to maintain a fixed air temperature of 25 °C. The thermal energy produced by the natural gas boiler system is also supplied to the swimming pool by means of HE2 and P7, when needed. In particular, the heating system of the swimming pool is activated when the water temperature falls below 27 °C, this operation continues until a swimming pool temperature of 29 °C is reached.
It is worth noting that, boiler system is also used to provide thermal energy and DHW to the other users of the sport centre (offices, other sport facilities, etc.). However, such thermal demand is significantly lower compared to one of the swimming pool and its DHW facilities. In particular, the study here presented only focuses on the swimming pool facilities and it does not take into account the thermal demand of other users. This assumption is reliable because the thermal demand of other sport centre users is relatively low and the thermal energy produced by the solar collector field is exclusively supplied to the swimming pool facility to match a certain amount of its DHW demand.
The real data concerning the attendance of the swimming pool users is used in order to evaluate the demand of DHW. In particular, the mean hourly values of the user attendance, different for each month of the year and for work/holyday day, are reported in
Table 1. Moreover, a value of 50 L per person is used to evaluate the specific DHW water consumption. This value is commonly used for technical calculations and in literature [
24], in addition it is confirmed by the maintenance technicians of the swimming pool. The estimated DHW demand of the swimming pool users is reported in
Figure 5.
In order to simulate the existing system operation, the previously described operating principle is adopted. However, in order to maximize the performance of the proposed solar installations, a modified control strategy is implemented for all the considered collector types. In particular, SC outlet temperature of is set to a fixed value of 50 °C by means of a variable speed pump and an iterative feedback controller. Obviously, during the solar system operation, SC outlet temperature may be lower/higher than the fixed set point, depending on the ongoing radiation/ambient conditions and thermal demand. In addition, the operation of P1 is managed by a control strategy that activates the pump when solar radiation is higher than 10 W/m
2 [
22] and when SC outlet temperature is higher than the inlet one. HE1 or TK1 are alternatively supplied by SCF, depending on swimming pool temperature: if the pool needs to be heated the control system supplies SCF to HE1; only if the pool temperature is within the fixed deadband does the SCF supply TK1 to the internal heat exchanger. Moreover, in order to prevent a possible cooling of the water inside TK1, or of the swimming pool water within HE1, a by-pass circuit is implemented on both TK1 internal heat exchanger and HE1. The control system by-passes SCF until the temperature is not high enough to heat the water within HE1 and TK1. The proposed control for the strategy solar loop is reported in
Figure 4 (right). The swimming pool temperature ranges between the same RS interval, which is from 27 °C to 29 °C; the solar system heats swimming pool when the temperature decreases to 28 °C, while the gas boiler is activated the temperature drops to 27 °C. Furthermore, for the proposed solution integrating the heat pump, the HW temperature is assumed ranging from 55 °C to 60 °C during the operation of the installation.
3. Materials and Methods
In order to investigate the possibility to perform an energy rehabilitation of the indoor swimming pool centre by means of solar and heat pump technologies, the existing installation and swimming pool building is modelled and simulated with TRNSYS software [
25]. The tool is a multi-purpose dynamic simulation environment which is widely used for commercial and scientific purposes and incudes a comprehensive built-in components library, as solar collectors, heat pumps, tanks, boilers, pumps, mixers, diverters, valves, controllers, etc. The majority of the components come with a proper simulation model which was previously validated vs. experimental data, as shown in TRNSYS library [
25]. Other components are based on a data lookup approach where the performance is based on operation and/or manufacturer data. Therefore, such components are intrinsically validated. However, it is important to note that the validation of the overall simulation model of the system is not possible at the moment since, in authors’ knowledge, the proposed system (or similar) has never been experimented as a whole. In summary, considering that all the sub-models of the components are previously validated versus experimental data and/or are based on manufacturer data, it may be concluded that the overall results are accurate and highly reliable due to robustness and consolidated use of the models of all the components of the system.
One of the software key-feature consists of the possibility to implement user-defined models of components. Moreover, the TRNSYS simulation environment allows one to use whatever time basis to simulate the system and to integrate the output data.
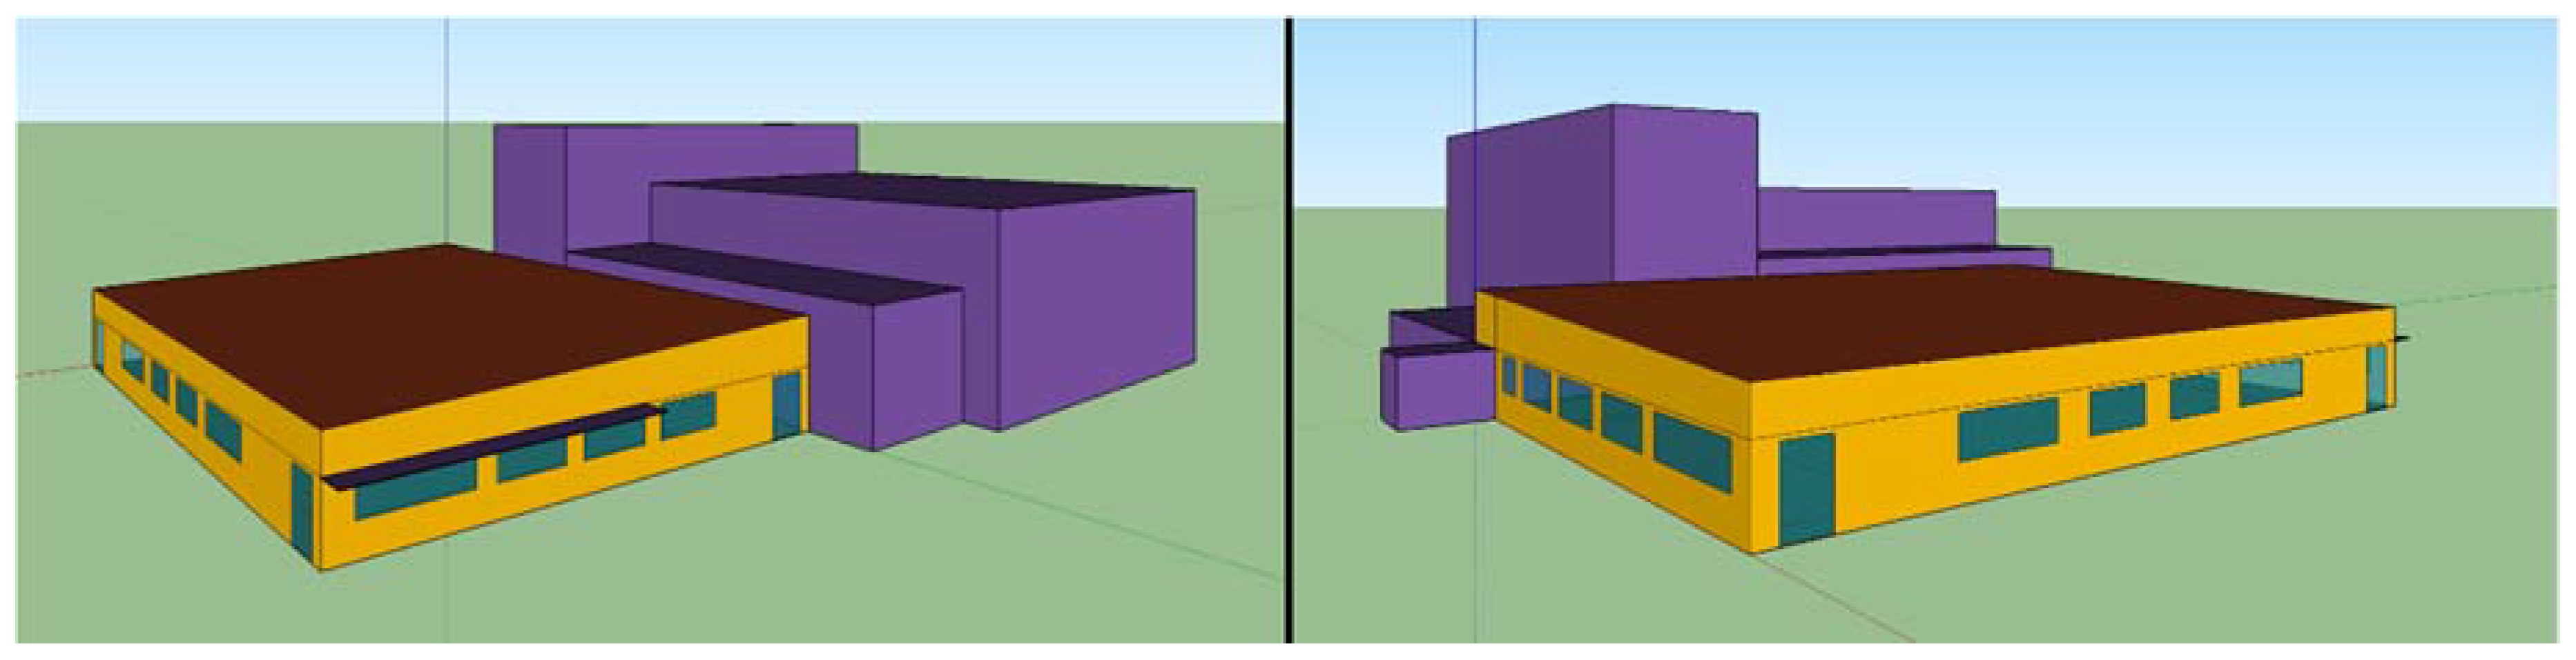
The case study building model is implemented by means of SketchUP (Google Inc., Mountain View, CA, USA) tool [
26], a software suitable for 3D buildings design. Moreover, the TRNSYS3d plug-in [
25] is used to implement the swimming pool hall 3D model in the TRNSYS software. The 3D thermal model of the swimming pool hall is shown in
Figure 6. It is worth noting that, the adjacent buildings structures are also considered in order to take into account for the shading effects. In addition, the real area and location of transparent surfaces is also taken into account. In order to simulate the hall building thermal behaviour, the existing building envelope configuration is used. The detailed layers configuration of each layer is here omitted for reasons of brevity. However, the transmittances of walls, roof, floor and transparent surfaces are reported in
Table 2. It is worth noting that, the swimming pool hall is modelled as a single thermal zone. Moreover, the implemented model of the swimming pool hall is capable to calculate only one thermo-hygrometric condition of the indoor air, because the TNSYS building thermal model is based on a uniform temperature and humidity distribution assumption for each thermal zone.
The collector types used in order to investigate the possibility of an energy rehabilitation of the swimming pool installation are: unglazed (UGL), flat plate without a selective absorber (NSL), flat plate with a selective absorber (SEL), evacuated tube (EVT) and evacuated flat-plate (EVP). In order to model the first four collectors, built-in components of TRNSYS software are used, in particular: type 1289 (unglazed), type 73 (flat plate with/without a selective absorber) and type 538 (evacuated tube). The detailed description of such components models is reported in the reference of TRNSYS software [
25]. The model of the evacuated flat-plate collectors is reported in reference [
27]. The parameters used for the simulation of the solar collectors are reported in
Table 3.
For reasons of brevity, only a brief description of the heat pump, indoor swimming pool and energy-economic model is provided in this section. For a detailed description of all component models examine the TRNSYS reference: weather data reader-type 109, iterative feedback controller-type 22, on/off controller with hysteresis-type 2, schedulers-type 519, 516 and 515, pumps-type 3 and 114, diverter and mixers-type 11, 647 and 649, pipes-type 31, natural gas boiler-type 751, air handling unit-type 754, heat exchangers-type 91.
The system model is configured selecting suitable parameters in order to simulate both existing and proposed systems. The main parameters adopted for the simulation are reported in
Table 4.
3.1. Heat Pump Model
A single-stage air-water source unit is selected for the heat pump component. In particular, the unit heats the primary liquid stream by absorbing energy from an air cooled evaporator. The component is modelled by the built-in TRNSYS type 941, based on user-supplied data files including catalogue data for the capacity and power. Performance data are supplied as a function of the air temperature and flow rate, entering water temperature and flow rate to the heat pump. The model of the heat pump interpolates the performance data with the dynamic inlet air and water conditions in order to determine the operative and outlet conditions, supported by the built-in psychometrics subroutine. In order to simulate the heat pump unit, an AERMEC® NRB2800 air-water heat pump is selected, with a heating and electrical power of 752 kW and 245 kW, respectively, under the nominal conditions of 40/45 °C of water inlet/outlet temperature and 7 °C outdoor dry bulb air temperature.
3.2. Tank Model
In order to model the tanks, the TRNSYS Type 340 stratified liquid storage tank with connections for direct charge/discharge and internal heat exchangers was selected. In particular, a storage tank with two inlets and two outlets was adopted in order to simulate both TK1 and TK2 tanks. The tank model is based on the assumption that the water-filled sensible energy storage is subject to thermal stratification and is divided into N fully-mixed equal sub-volumes. An additional assumption is done: the charging or discharging of the tank is modelled with fixed position of the inlet and outlet points of the fluid. The unsteady energy and mass balance are the basis of the mathematical formulation of the tank model, this one allows to calculate the temperature of each zone and the heat exchange of each internal heat exchanger by solving a set of differential equations. The model of the tank is described in detail in the reference of this component [
28], thus it is here omitted for sake of brevity.
3.3. Indoor Swimming Pool Model
The indoor swimming pool model is derived by a work recently presented by the authors [
22]. The model calculates the mass and energy transfer of occurring for the indoor condition of a swimming pool. In particular, the model is based on a uniform swimming pool temperature distribution and a constant water volume. The first assumption is adopted since the swimming pool is equipped with a recirculation system and users produce a significant mixing effect, while the second one is due to the continuous refill of the pool water. Moreover, the swimming model neglects the solar radiation since the amount of entering radiation impacting on the water surface is extremely small, due to the geometrical configuration of the building.
The heat balance equation of the indoor swimming pool is defined as follows:
The thermal gains and losses are given by:
The thermal gains of swimming pool are only due to the operation of solar and gas boilers heat exchangers, while the thermal losses are due to evaporation, radiation, convection, conduction phenomena and water refill operation. In particular, thermal energy transferred to the swimming pool by HE1 and HE2 is calculated by the heat exchanger models. The evaporation heat loss is calculated as follows [
29]:
The radiative thermal loss is defined by the following equation:
The convective heat exchange between the swimming pool water and the indoor air is given by:
The convective heat transfer coefficient is calculated using the Newton formula and the following equation [
30]:
The conductive heat transfer is defined as follows [
30]:
Finally, the thermal losses due to the fresh water supplied to the swimming pool is given by:
It is worth noting that, the hall mean radiant and air temperatures are dynamically calculated by the building model, while a constant soil and water temperature of 15 °C is assumed [
22].
3.4. Energy-Economic Model
The proposed rehabilitation measures are evaluated in terms of energy and economic performance.
The performance of the solar collectors is evaluated calculating its thermal efficiency as follows:
In addition, the solar factor is introduced, defined as the ratio between the thermal energy supplied by SC to a specific user/component and the total demanded one:
Obviously, a comparison between the Proposed Systems (PS) and the existing reference one (RS) must be performed. RS consists of the existing installation previously described in the case study section, while PS consists of: (i) replacement of the existing solar collector field with several new collector types, (ii) installation of a heat pump, replacing the existing natural gas boiler system.
In order to perform the analysis, it is assumed that both RS and PS systems must provide the same amount of thermal energy to the user. In particular, user demand is always matched thanks to the auxiliary systems, namely gas boiler or heat pump, depending on the specific proposed system considered.
RS and PS primary energy consumptions are evaluated, considering an average boiler system efficiency of 0.90 [
31] and a national electric grid efficiency of 0.46 [
32]. The primary energy consumed by RS and PS are calculated as follows:
The primary energy consumption of the reference system is due to the natural gas and electrical energy consumption of the reference collectors-boiler system and auxiliary components, respectively. In case of solar field replacement, the primary energy consumption of the proposed system is due to the natural gas consumption of the collector assisted-boiler system and to the electrical energy consumption of auxiliaries. In case of heat pump integration, PS primary energy consumption is due to the electrical energy used by the compressor of the heat pump and by the circulation pumps.
The primary energy saving and the primary energy saving ratio achieved by the considered PS with respect to RS are defined respectively as follows:
In order to evaluate the economic performance of the proposed systems, an economic model calculating the investment costs and the operating cost is implemented. The capital cost of the components included in the proposed solutions is evaluated with manufacturer data, according to the methodology presented in [
22,
33]. In particular, the following specific costs are adopted for the proposed solar collectors: unglazed-92 €/m
2, flat-plate without selective absorber-235 €/m
2, flat-plate with selective absorber-343 €/m
2, evacuated tube-400 €/m
2, evacuated flat plate-650 €/m
2. Moreover, the above mentioned cost of solar systems also includes the costs of the Balance of Plant components, including variable speed pump and control system. Furthermore, the proposed heat pump capacity is selected in order to match the thermal demand of the swimming pool facility. The analysis of manufacturer cost data outlined a cost of 128 k€ for a unit suitable for the case study installation.
RS operating costs are due to the electrical energy consumption of auxiliary components and to the natural gas consumption. Such consumptions also occur for PS in case of solar collectors’ replacement. In case of heat pump installation, the operation costs are only due to the electrical energy consumption of the heat pump and auxiliary equipment. Natural gas cost is assumed equal to 0.70 €/m
3 [
32], with a reference Low Heating Value of 9.59 kWh/m
3 [
33], while a two-level electrical energy tariff is adopted [
32]. The operational cost of PS and RS are calculated as follows:
The saving achievable by PS with respect to RS are defined as follows:
The developed economic model calculates also the Simple Pay Back (
SPB) and the Profitability Index (
PI), allowing to evaluate the economic profitability of PS:
The Net Present Value (
NPV) of PS is calculated with an annuity factor and lifetime of 0.05 and 20 years, respectively. In addition, PS economic profitability is also determined considering the Italian new thermal incentive policy [
34]. The incentive consists of a capital investment subsidy, amounting to maximum of 65% of the total capital cost for the proposed systems. In particular, for solar installations, the incentive is calculated on the basis of normalized thermal energy production of the installed collector type and the field area, while in case of heat pumps, the magnitude of the incentive depends on the climatic zone of the installation and on the nominal Coefficient of Performance (
COP) of the installed unit. The calculation methodology is reported in reference [
34], thus is here omitted for sake of brevity.
4. Experimental Measurements and Model Calibration
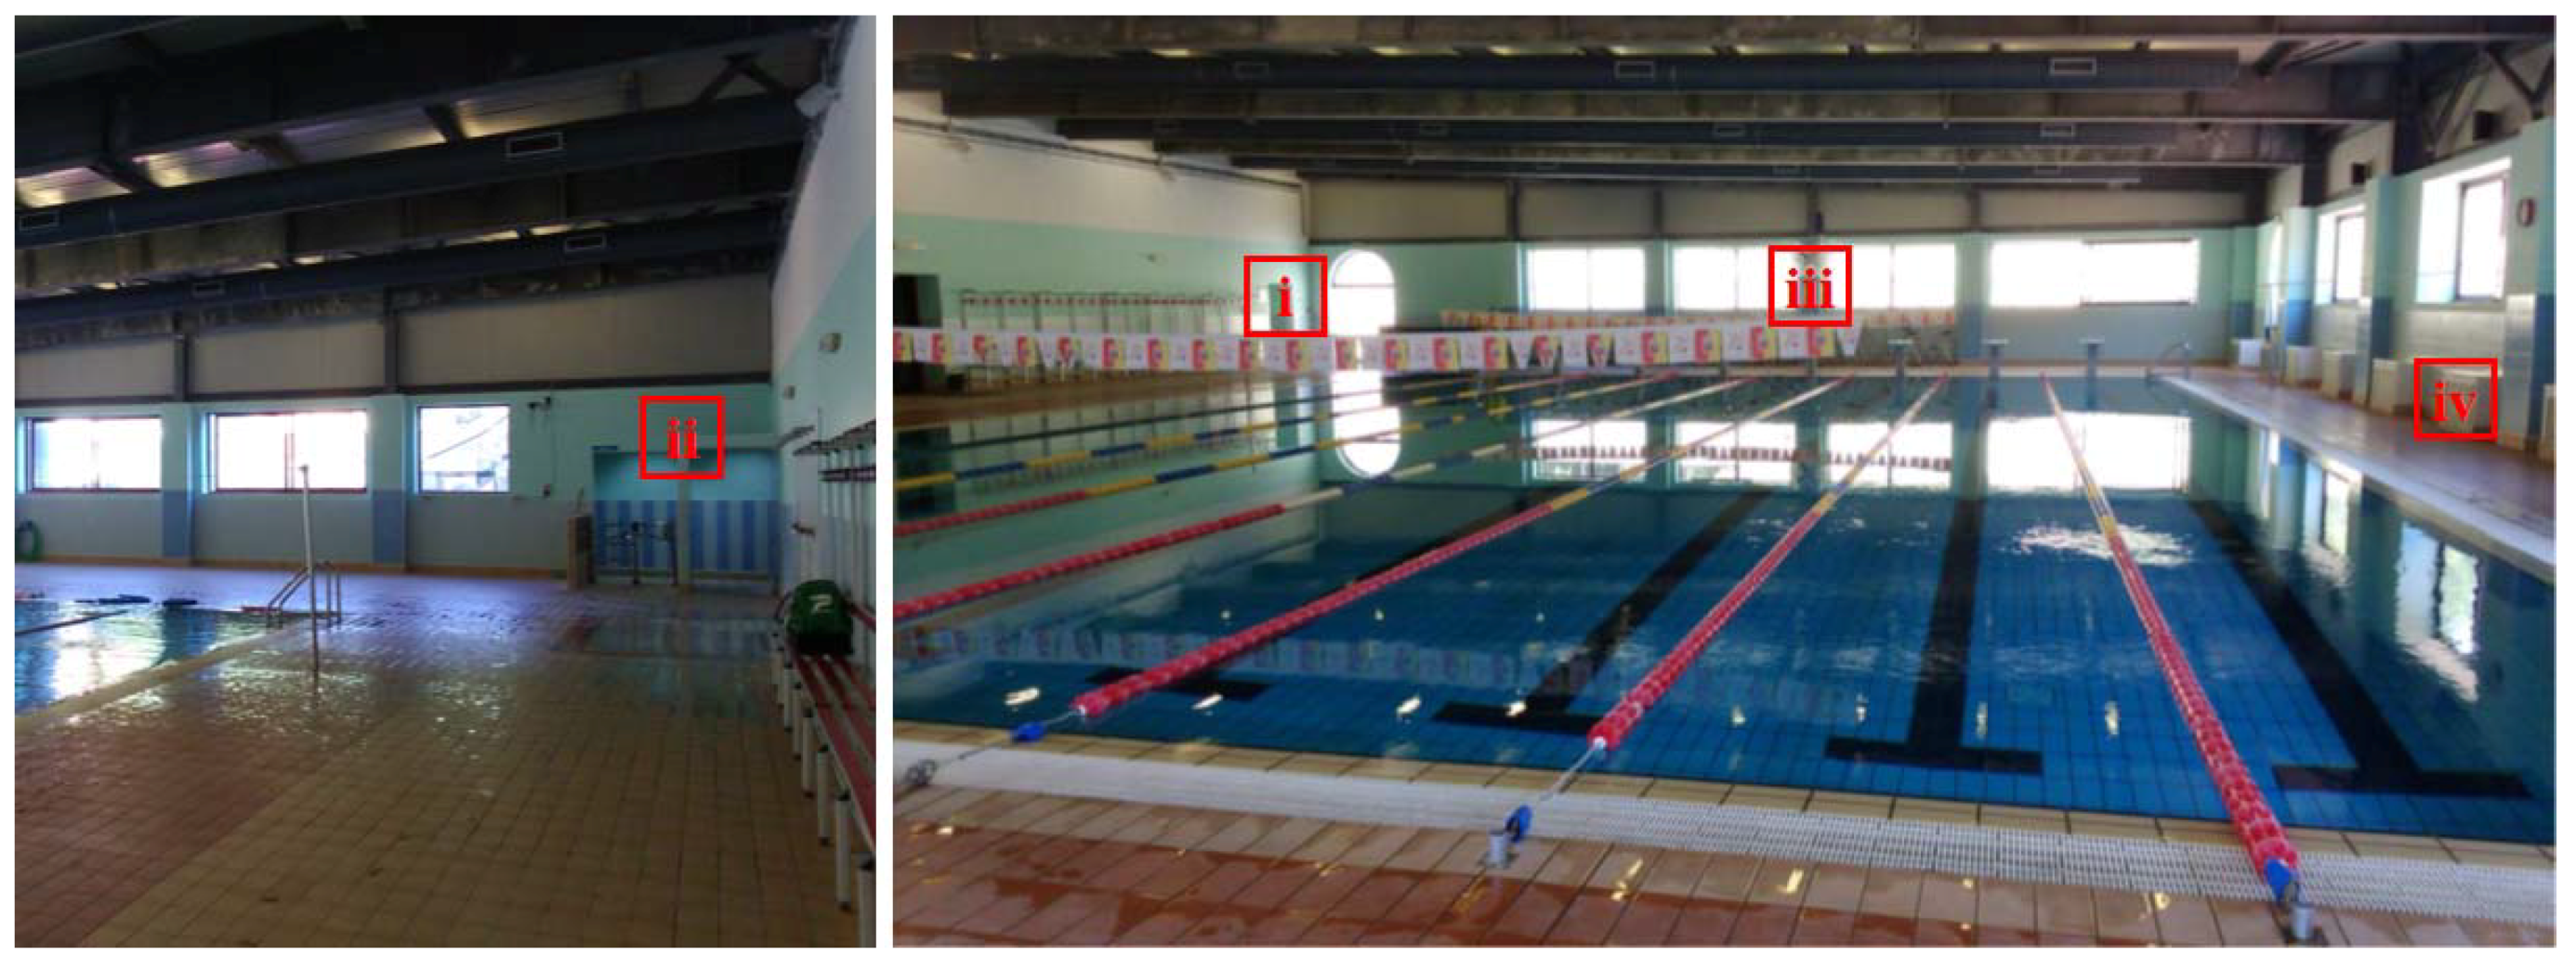
An experimental measurement campaign is performed in order to investigate the existing system installation operation and the swimming pool indoor air conditions. In particular, the air flowrate supplied by the air handling unit ventilation system to the swimming pool hall and the water flowrate of the main installation water loops are measured. In addition, air temperature and humidity inside the swimming hall are also measured. Air flowrate and indoor hygrometric conditions measure is performed in order to determine the operation condition of the air handing unit and to calibrate the swimming pool evaporative model, while the water flowrates are measured in order to verify the data sheet flowrate of the circulation pumps. The measurement of the flowrates is performed for several minutes, suitable to assess a reliable measured data during the operation of the installation. In fact, such flow rates are constant during system operation since only fixed speed pumps are used. Conversely, the indoor air conditions are measured for a period of time of 91 hours, from 4.30 p.m. of 14 October 2016 (Friday) to 11:30 a.m. of 18 October 2016 (Tuesday). The selected period of time allowed one to measure the indoor conditions during both workdays and holydays. Moreover, during such period of time, air temperature and humidity are measured in four different locations of the swimming pool hall, as shown in
Figure 7: (i) at the edge of the swimming pool at a height of about 2 m; (ii) above the entrance of the dressing/bath zone located in a corner of the hall; (iii) on the shorter wall of the swimming pool hall; (iv) on one of the return air ventilation crates. It is worth noting that the swimming pool temperature has not been directly measured during the experimental activity since this temperature is measured by the swimming pool control system. Such temperature is set at 28 °C and the control system manage the swimming pool heating system in order to achieve stably this temperature. The variation of the swimming pool temperature is small due to the small dead bands used by the control system and such negligible variation determines a scarce effect on the evaporation phenomena. Unfortunately, the swimming pool control system does not allow one to register the pool temperature over time, this data is only displayed on the screen of the control system where it is stably close to the set point. Therefore, only the initial swimming pool temperature was registered in order to set the initial conditions of the simulation performed to calibrate the swimming pool-hall model.
The following equipment is used to perform the measure:
flowmeter FUP Siemens Sitrans F, ultrasonic flowmeter used to measure the main loops flowrate;
air velocity meter testo 480 with hot wire anemometer, used to measure the air velocity on the return ventilation crates;
air temperature and humidity meter testo 174H, used to measure the indoor psychrometric conditions of the swimming pool hall.
The specification of the measurement equipment is reported in
Table 5.
The ultrasonic flowmeter FUP Siemens Sitrans F allowed one to measure the mean flowrates reported in
Table 6. Such values resulted consistent with the flowrates reported on the data sheets of the circulation pumps. Furthermore, the measures of the velocity on the return ventilation system allowed one to estimate the volumetric flow rate of the ventilation air to 9000 m
3/h.
As above mentioned, the air temperature and humidity measurements are used to calibrate the operation of the ventilation equipment and the evaporative heat/mass transfer of the swimming pool. For the experimental investigation, temperature and humidity measures were performed with a sampling time of 1.0 min. In particular, the data are used to determine the ratio between the fresh air and return air flowrate of the air handling unit and the correction factor of the evaporative thermal losses, thus also of the evaporated water from the swimming pool, which determine the lowest difference between measured and simulated air temperature and relative humidity. The measured temperature and humidity data on the return of the ventilation system is used as input to the model of the air handling system, while the Meteonorm weather data of the same measurement time period is used for the fresh air conditions.
The simulated temperature and relative humidity of the swimming pool hall air are compared to the ones measured during the experimental campaign, for each previously mentioned position of the meter unit. It is important note that the calibration procedure is performed assuming as return air flowrate the previously mentioned measured value of 9000 m3/h.
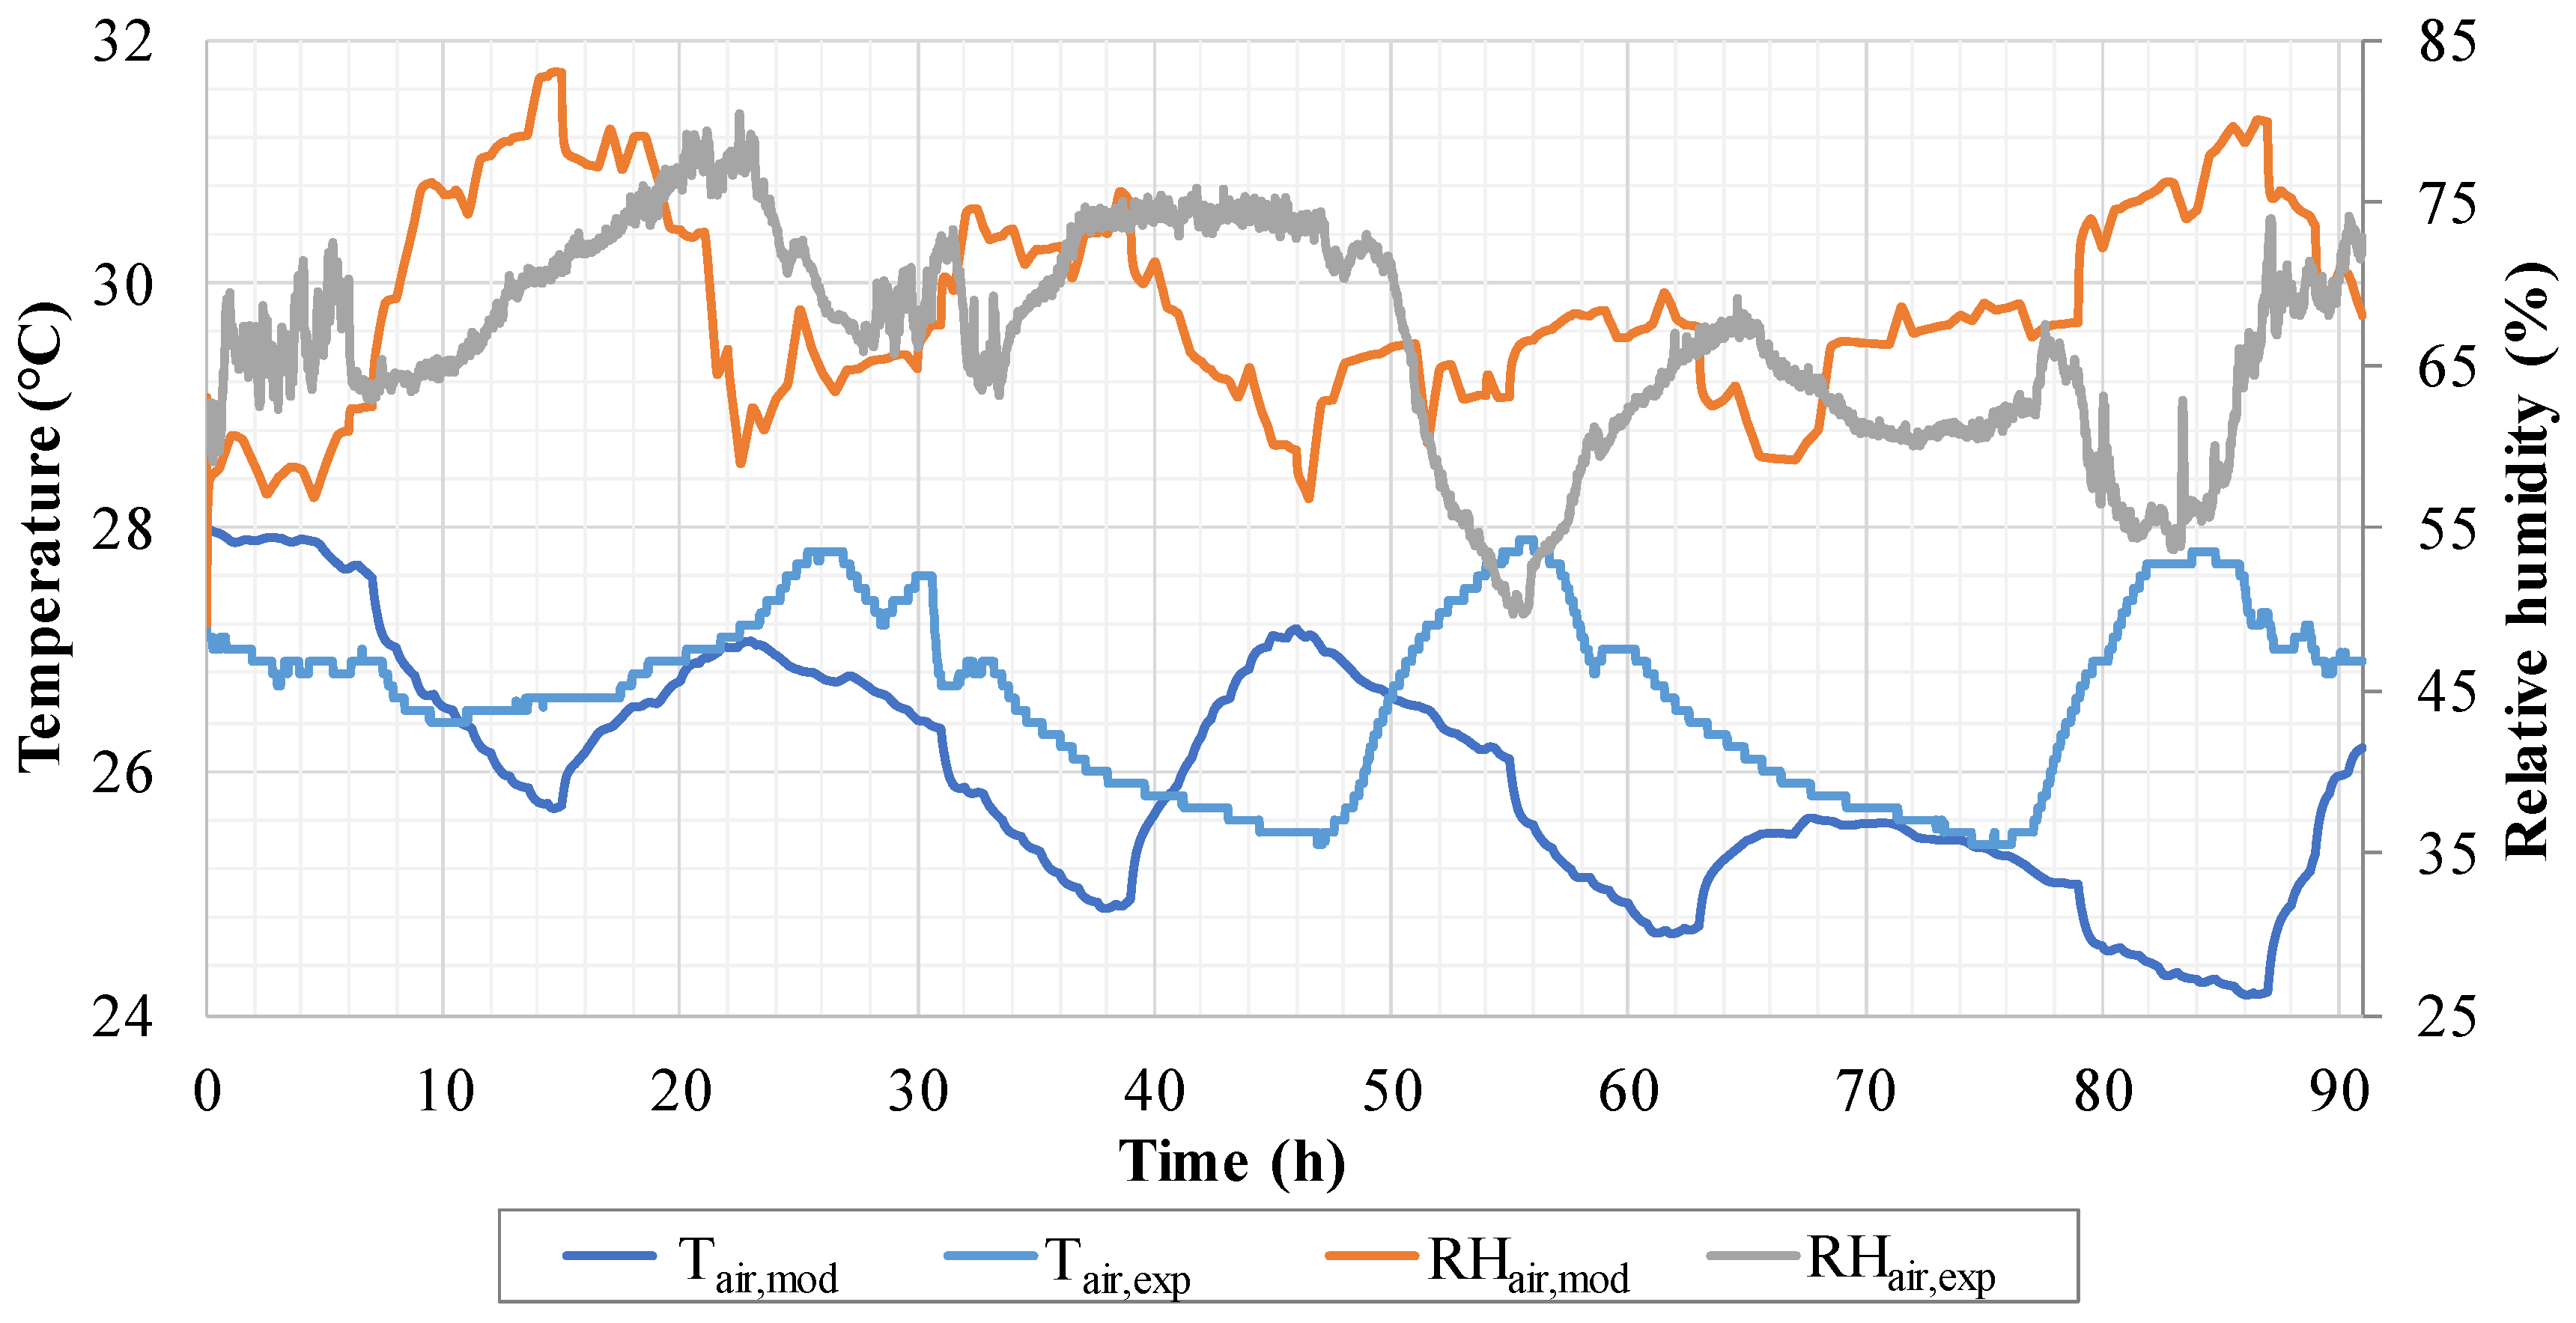
The analysis outlined that the best values of fresh/return air ratio and evaporation correction factor are 0.20 and 0.10, respectively. The last value shows that only 10% of the evaporation thermal loss, thus also 10% of the evaporation mass, estimated by Equation (4) is used to simulate the thermal behaviour of the swimming pool under investigation. For such calibration factors, the mean relative error of the simulated air temperature and humidity for the four measurement points are approximatively 3% and 8%, respectively. For sake of brevity only the comparison between the measured air conditions on the swimming pool edge and the ones simulated by the lumped model is here reported (
Figure 8). In such figure, some differences between measured and simulated data are detectable. In particular, for the selected data set, the mean relative error of the simulated air temperature is equal to 1.1%, while the error is 4.6% for the relative humidity. The delay between the model and the experimental profiles can be justified by two different circumstances. First, the simulations were performed using hourly data of air temperature and humidity collected by the closest weather station of Capodichino (40°53′03.72″ N, 14°17′00.99″ E). Second, in the performed simulation, the hourly swimming pool occupancy consisting of the number of swimmers is based on historical data given by swimming pool owners. This value could be slightly different from the real number of swimmers actually present during the measurement campaign. However, the reliability of the simulations is satisfactory because only a slight mean difference between the model and experimental results is achieved and the trends of the simulated indoor conditions are very similar.
5. Results and Discussion
The output of the developed simulation model consists of dynamic data, concerning temperature and power profiles and integrated variables. The simulation is performed for a 1-year time basis setting a time step of 0.04 h. In order to perform the comparison of the considered system, the same collector area considered for the RS case (64 m
2) is selected for all PS collector types. The dynamic system operation is analysed by the authors for RS and for each PS. However, the profiles of temperatures and powers are here omitted because are similar to the ones reported in previous papers [
22,
33,
35]. The dynamic operation along the year is carried out with a weekly integration, nevertheless only the case study of PS with evacuated tube collectors is reported and commented, for sake of brevity. The energy and economic performance of the installation is evaluated for RS and PS cases, with an annual integration of the dynamic data. Finally, a parametric analysis is performed for all PS cases including the replacement of the solar collectors. In particular, the analysis is performed in order to evaluate the influence of the collector field area on the economic performance of the proposed solar solutions.
5.1. Weekly Analysis
The thermal energy produced by the evacuated tube thermal collectors and the ones transferred by HE1 and to TK1 are shown in
Figure 9. The trends show that the thermal energy produced during the years is significantly higher during the central weeks compared to the firsts and lasts ones, due to the higher solar energy availability occurring in the summer period. Moreover, the thermal energy produced by the solar collectors is mainly supplied to the swimming pool by means of HE1. This is consistent with the adopted control strategy, ensuring that the solar thermal energy is supplied primarily to the swimming pool.
Conversely, the thermal energy produced by the GB system is higher in the winter period with respect to the summer one (
Figure 10). This occurs because the thermal demand of the swimming facility is greater during such period, due to the higher thermal losses of the swimming pool/hall and to the higher thermal energy demand of the air handling unit. It is interesting note that, the thermal energy supplied by GB to TK2 in order to produce domestic hot water is almost null during the central summer weeks. Such trend is achieved because the DHW demand occurring during the summer period is relatively low (
Figure 5), along with a relatively high solar thermal energy supplied to TK2 (
Figure 9). In fact, the thermal energy produced by GB is almost fully supplied to the swimming pool during the summer time.
The efficiency of the solar collectors and the solar factor of the swimming pool, DHW tank and total demand are shown in
Figure 11.
As expected, the efficiency achieved by the evacuated tube collectors is higher during summer with respect to the winter case. In fact, the higher the solar radiation and the mean ambient temperature, the higher the collector thermal performance. In particular, for the majority of the collector field operation period, the efficiency is above 30%. The solar factor of the swimming pool is almost null during the winter period, due to the significant thermal demand of the swimming pool and to the scarce thermal energy production by the solar collectors. However, during the central weeks of the year, the solar contribution to the heating of the swimming pool increases, resulting above 10%. DHW solar factor significantly varies during the year, due to the increase of SC thermal energy supplied to TK2 and to the lower DHW demand occurring during the summer period. In fact, during the winter weeks, such solar factor is about 20%, while during the summer ones it is often higher than 70%. As regards the solar factor of total thermal demand, the trend is similar to the swimming pool factor since the DHW demand is significantly lower than the one of the pool. During the winter weeks, the difference between the total factor and the total one is lower due to the scarce thermal energy supplied to the DHW tank. The trends of
Figure 11 are similar to the ones achieved in Reference [
36]. However, in such study a higher solar factor is achieved due to a higher solar field area per unit of swimming pool area with respect to the present case study. In fact, the area ratio is about 2 for the mentioned study while here the ratio is about 0.14.
5.2. Yearly Analysis
The thermal energies of the main system components for RS and all PS cases are reported in
Table 7. For the systems including the existent solar collectors (RS and PS-HP), solar thermal energy supplied to TK1 and thus to TK2, is null. This result is in accordance with the detected real operation of the existing collector installation. For all the systems, the thermal energy produced by the solar collector field is one order of magnitude lower than the one produced by the gas boiler system or the heat pump. The relatively low produced solar thermal energy is due to the limited extension of the collector field (64 m
2). It is interesting to note that the thermal energy produced by the unglazed collectors (UGL) is slightly lower than the one of the reference obsolete units. Such result is due to the absence of thermal insulation of unglazed collectors and to the deteriorated conditions of the reference units. However, the thermal energy supplied to TK1 is not null due to the implemented PS control strategy. Moreover, the thermal energy produced by the collectors increases from the unglazed units to the evacuated flat plate (EVP) ones. In particular, the produced thermal energy increases of about 23% passing from collectors with selective absorber (SEL) to the evacuated tube (EVT) ones. Obviously, this trend occurs because the performance of the collectors increases from the low-cost systems (UGL) to the high-tech ones (EVT or EVP). As a consequence, the thermal energy produced by GB decreases for the same system. Furthermore, as expected, the results also show that the operation of the air-handling unit is not affected by the considered system proposal.
The primary energy consumption and saving are also reported in
Table 7. The saving of primary energy in case of unglazed solar collectors (UGL) is two orders of magnitude lower compared to both evacuated collector systems. In general, the same trend of the solar thermal energy production is shown by the primary energy saving. This occurs because the electrical energy consumption of the auxiliary components, as pumps, air-handling unit, is almost the same for all the proposed systems, while the collector field energy output increases. The energy and economic performance parameters are shown in
Table 8.
The collector efficiencies increase considering as a function of the technological level of the selected collector. In fact, the efficiency of evacuated flat plate collectors (EVP) is almost three times higher compared to the unglazed ones (UGL), while for the evacuated tube (EVT) ones, the same increase is about 2.1 times. The COP of the heat pump is relatively low (about 2.5) due the fact that this device must supply high temperature water (50–53 °C). The utilization factors of solar collectors referred to HE1 and TK1, defined in the same way as the solar factors, shows that a higher thermal efficiency implies a higher amount of produced solar thermal energy supplied to HE1, thus to the swimming pool. This trend is also underlined by the solar factors of the swimming pool for the considered PS cases with collector replacement. Conversely, the utilization factor of TK1 decreases. It is interesting note that, the solar factor for DHW production increases when high tech-level collectors are considered, due to the increase of the produced solar thermal energy. In particular, in the case of both evacuated collector types, more than 40% of the DHW demand is matched by solar energy. Furthermore, when collectors’ replacement is considered, the primary energy saving ratio ranges from 1% to about 7% due the relatively small solar collector field area and to the significant thermal demand of the swimming pool facility.
The economic savings achievable by the collectors’ replacement follow the previously described efficiency trend. The higher the produced solar thermal energy, the higher the achievable savings. This occurs also because the electrical energy consumption of auxiliaries does not noticeably increase with an increase of the collectors’ energy output. The negligible economic saving achievable by the unglazed collectors implies an extremely unfeasible SPB period, though the investment cost of such system is relatively low since it is below 6 k€. Significantly lower SPB periods are achieved in case of other collector types. However, the calculated values show that the proposed solutions are not profitable from an economic point of view, since a SPB higher than 14 years is achieved. This result is also achieved by the heat pump system. Moreover, the same economic results are confirmed by PI values, which are negative for all the PS cases.
It is important to note that the relatively high
SPB values are due to the fact that the existing system is already equipped with a solar collector system, even if obsolete. According to literature papers, the application of unglazed solar thermal collectors in swimming pool facilities allows one to achieve
SPB of about 2 years [
35], while the hybridization with biomass boilers leads to a
SPB of about 3 years [
20]. If the existing system was not equipped with solar collectors, the
SPB for unglazed units would be slightly higher than 3 years for a collector area of 64 m
2. Nevertheless, for the other collector types the
SPB would range between 7 and 9 years.
The economic performance of the proposed rehabilitation systems significantly increases in case of the thermal incentive policy, except the one including the unglazed collectors. In particular, the SPB ranges between 5 and 6 years for selective absorber and evacuated tubes/flat-plate collectors. Under the considered incentive policy, also the proposed system including HP installation is interesting from the economic point of view due to a SPB of about 5 years. The best economic profitability is achieved by the selective absorber collectors, due to a relatively low capital investment cost and a satisfactory energy performance.
5.3. Parametric Analysis
The analysis of PS cases including solar collector replacement is completed by a parametric analysis, performed in order to investigate the energy performance and economic profitability of PS as a function of the solar collector field area. The analysis is performed considering a solar collector area ranging between 50 m2 and 500 m2, which is the maximum possible extension of the collector field suitable for the roof area of the swimming pool centre.
The
PESr parameter is plotted against the solar collector area in
Figure 12. Here, the evacuated flat plate collector solution is investigated for a field area up to 200 m
2, due to the overheating issues occurring for a higher area value. The trends show that
PESr is almost a linear function of the solar field area, especially in case of the unglazed, not selective (NSL) and selective (SEL) collectors. The highest energy saving is achieved by the evacuated plate units (EVP). In fact, for an area of 200 m
2,
PESr is about 25%, while for evacuated tube units (EVT) it is roughly 18%. It is worth noting that the primary energy saving in case of unglazed collectors (UGL) and field area of 50 m
2 is negative. This occurs because the thermal energy production of the evacuated units is lower compared to the one of achieved by the existing field, due to a lower field area (50 vs. 64 m
2) and to a relatively scarce thermal performance of the low-cost units. The plots also show that the difference between the selected technologies increases for higher solar field area values. Moreover, for an area higher than 300 m
2, the differences are higher among unglazed, not selective and selective solar collectors, while the variation between selective and evacuated tube units is significantly lower.
SPB periods without incentive are reported in
Figure 13. Here, only the values lower than 20 years, which is the technical lifetime of the proposed solutions, are plotted.
SPB profiles are significantly different for the different considered systems, due to the diverse performance and cost of collectors. For relatively low values of collector area, both types of evacuated collectors achieve a better economic performance compared to the other collector solutions. The lowest
SPB value for evacuated units is achieved for a collector area of 150 m
2. In fact, for higher values the
SPB increases. The unglazed and flat plate (with/without selective absorber) collectors are more profitable compared to the evacuated ones when the solar collector increases above 300 m
2. It is interesting to note that the unglazed collectors’ economic performance is scarce for a relatively low field area of 50–100 m
2, while the
SPB significantly decreases for a field extension over 150 m
2. As a consequence, for such area values, the solution with unglazed units is economically viable even without incentive, because the
SPB is about 5 years. It is worth noting that the for a relatively low solar field area
SPB is high, this is due to the existing solar loop layout and to its control strategy. The solar thermal energy not supplied to the swimming pool is firstly supplied to the solar tank TK1, thus only when it reaches an adequate temperature to heat the domestic hot water tank TK2, solar thermal energy is used to produce DHW. Therefore, in case of lower solar field area the heating of TK1 is limited as well as the production of DHW with solar energy. Furthermore, the trends of
SPB values are fairly flat for a higher solar field area. Such result is achieved because the increase of the area and cost is balanced with the increase of solar energy production and possible savings. Moreover, it is worth noting that no economies of scale are considered for the cost of the solar collectors, since the variation of the solar collector field area is limited, thus the cost of the solar field is only a function of the area.
Furthermore, the economic profitability of the evacuated tube collectors decreases over 150 m
2, due to the increasing capital costs not counterbalanced by adequate savings. In fact, for large solar field areas, average solar collector increases negatively affecting the overall system performance.
SPB profiles with incentive (
Figure 14) are similar to the ones reported without any public founding. The evacuated flat plate collectors achieve the worst economic profitability along the considered solutions. Moreover, for collector field area above 200 m
2, the unglazed and flat plate collectors achieve an approximatively constant
SPB value. This trend occurs because the variation of marginal cost of the produced thermal energy is negligible. The reduction of
SPB with incentive is significant in case of conventional flat plate collectors with/without selective absorber. In fact, the investment return periods are about two times lower compared to the ones achieved without any funding policy. Finally, the Profitability Index with incentive is reported in
Figure 15. Here, once again, the profiles highlight that the systems integrating unglazed and conventional flat plate units are more profitable compared to the other ones, especially in case of high field areas (150–500 m
2). In general, the analysed results show that unglazed collectors, for a field area of 400 m
2, achieve the best economic performance. Similar results are obtained for a photovoltaic/thermal solar collector system in previous paper of the authors [
22], where an energy-economic analysis is performed for an indoor/outdoor swimming pool facility. For a 600 m
2 swimming pool, the best economic profitability of the PVT system is achieved for a collector area of 200–300 m
2. In the present case of a 450 m
2 swimming pool, the best configuration for evacuated collectors ranges between 150 and 200 m
2. For the other collectors, the situation is slightly different since the best configuration is achieved for higher area values.
6. Conclusions
The possibility to perform an energy rehabilitation of an indoor swimming pool centre by means of solar and heat pump technologies is investigated. Several solar thermal collector technologies, such as unglazed, glazed, non-selective, selective, evacuated and an air-to-water heat pump are considered as possible energy saving actions. A case study is presented, consisting of a university indoor swimming pool centre located in Naples, South of Italy. Experimental activities are performed in order to determine the existing equipment operation and to calibrate the swimming pool thermal model. A dynamic simulation model of the swimming pool facility is developed and used to evaluate the proposed rehabilitation solutions. The results show that:
The correction factor of the swimming pool evaporative losses and thus of the evaporated water is 0.1. This result is carried out by the comparison of experimental and numerical data regarding the dynamic behaviour of swimming pool and it highlights that there is a significant difference between the evaporative losses estimated by literature formulas and the one really occurring in the swimming pool under investigation.
The thermal energy produced by the collectors increases from the unglazed units to the evacuated flat plate ones. This is due to the significant improvement of the performance from low to high cost units. In particular, the produced thermal energy increases of about 23% passing from collectors with selective absorber to the evacuated tube ones and this increase is higher when the solar field area increases.
For the same collector area of the existing installation (64 m2), both evacuated collector types match more than 40% of the DHW demand. Such results are achieved because of a relatively high solar energy availability during summer coupled with a reduced thermal demand of the swimming pool in that time.
For the same reference area of 64 m2, the proposed systems are not profitable from an economic point of view without incentives, since SPB higher than 14 years. This is due to the fact that the for the existing solar thermal collectors, even if obsolete, produce a remarkable amount of thermal energy and the installation of new units does not a significant increase of the produced thermal energy that balance the cost of the investment. Conversely, in case of thermal incentive policy, SPB ranges between 5 and 6 years for selective absorber and evacuated tubes/flat-plate collectors. Moreover, similar values are achieved in case of heat pump. This result is achieved due to a significant reduction of the costs of the proposed systems.
The highest energy saving is achieved by the evacuated plate units. In fact, for an area of 200 m2, PESr is about 25%, while for evacuated units it is roughly 18%. This result points out that the performance of such units is significantly higher compared to the other solar thermal collectors.
Without incentive, the unglazed and flat plate with/without selective absorber collectors are more profitable compared to the evacuated ones when the solar collector increases above 300 m2. Moreover, the system including unglazed units is particularly interesting, because the SPB is about 5 years. This condition is achieved since the cost of the unglazed unit is relatively low and this balances their scarce performance. In addition, with incentives, all the proposed systems, except evacuated flat plate, are economically viable, because the SPB ranges between 4 and 6 years.
Further investigations for the present case study will include:
Additional experimental campaigns, with simultaneous measurement of external and indoor conditions, in order to achieve a better fitting of simulated/measured data.
Analysis of the effect of different control strategies concerning temperature set points and components’ deadbands on the energy and economic performance of the proposed systems.
The system under investigation could be further improved from the energy performance point of view integrating a heat recovery unit in the air handling system, or a recovery heat exchanger on the water disposed to the sewer, which temperature is higher than the fresh water supplied by the aqueduct to the swimming pool system. Other energy requalification action could be the enhancement of the building thermal insulation in order to decrease the thermal losses during the winter period and, thus, the space heating demand.
Furthermore, it is important to notice that the developed simulation model can be easily modified in order to perform simulations for whatever swimming pool system. In this way, the simulation could be carried out for different case studies showing the performance of the system a function of the user. In this way, the generalization of the results could be performed in order to provide some guidelines and key parameters for the application of different solar collector technologies in swimming pool installations.


