Article

Hydrothermal Carbonization of Biosolids from Waste Water Treatment Plant

1
Department of Mechanical Engineering, Dalhousie University, P.O. Box 15000, Halifax, NS B3H 4R2, Canada
2
Faculty of Sustainable Design Engineering, University of Prince Edward Island, 550 University Ave, Charlottetown, PE C1A 4P3, Canada
3
City of Charlottetown, 199 Queen Street, Charlottetown, PE C1A 7K2, Canada
*
Author to whom correspondence should be addressed.
Energies 2018, 11(9), 2286; https://doi.org/10.3390/en11092286
Submission received: 9 July 2018 / Revised: 25 August 2018 / Accepted: 28 August 2018 / Published: 30 August 2018
(This article belongs to the Section I: Energy Fundamentals and Conversion)

Abstract

:
The high moisture content of biosolid from a wastewater treatment plant limits its use for agriculture and energy applications. This limitation could be obviated by hydrothermal carbonization, which requires less energy compared to other thermochemical treatment processes, and results in stabilized solid hydrochar product. The present study examined this option by hydrothermally treating the biosolid at three temperatures (180, 200 and 220 °C) for 30 min, and at 200 °C for 15, 30 and 60 min. An increase of 50% in the heating value of the biosolid was obtained after this carbonization. A reduction in the nitrogen concentration in hydrochar was noted with an increase in phosphorus concentration, but potassium concentration remained largely unchanged. Additionally, the carbon to nitrogen ratio in the hydrochar product was higher than the biosolid that makes it suitable for agriculture applications. The chemical oxygen demand of the process water was in the range of 83,000 to 96,000 mg/L. The study thus provides insight into high-value products that can be generated by the hydrothermal carbonization of biosolids.

1. Introduction

The terms sewage sludge and biosolids represent the same semi-liquid end product of wastewater treatment. Biosolid (or sewage sludge) is treated to make it suitable for land applications [1]. In Canada, 660,000 metric tons of dry biosolid is produced annually [2]. Its management represents 50% of the overall operating cost of a wastewater treatment plant. Only half of the total biosolid is utilized in land while another half is disposed of. Disposal or management options for biosolids include incineration and landfills. These options do not facilitate recovery of the valuable organics in biosolid and adversely affect the environment and human health [3]. Concerns about contamination of land with harmful biological and chemical species in biosolids and other practical limitations prevent wide scale use of biosolids in agriculture. One of the practical issues is its high moisture content, which makes transportation difficult [4]. Such is the case of the wastewater treatment plant of Charlottetown in the province of Prince Edward Island, Canada. This plant treats approximately 7 million cubic meters of wastewater annually producing roughly 3700 tonnes of biosolid. Presently, the sewage sludge is pre-pasteurized, anaerobically digested and dewatered producing biogas and class-A biosolid. The biosolid is then taken away with a tipping fee of $35/ton for disposal. Drying could be an option to increase the dry matter content, but it is an energy intensive process. For biomass with such high moisture, hydrothermal carbonization could be a preferable option. Subcritical hydrothermal carbonization (HTC) is typically carried out at a temperature of 180–220 °C, with pressure in the range of 2.5–5 MPa, and for a residence time of 15–120 min in an inert or oxygen-free environment [5]. Since the hydrothermal treatment process does not involve evaporation of water, the energy required for the process is low [6,7]. Lucian et al. [8] found the temperature of 220 °C and 1 h residence time to be the most favorable condition for hydrothermal carbonization of waste biomass (grape marc). For that condition, they found the plant efficiency to be 78%, with a specific thermal energy consumption of 1.17 kWh per kilogram of hydrochar and specific electric consumption of 0.16 kWh per kilogram of hydrochar. They found the production cost of pelletized hydrochar to be 157 €/ton hydrochar and 200 €/ton hydrochar was the break-even value for a plant with a payback period of 10 years. Additionally, this process could produce a more stable hydrochar from which it is easier to remove water [7]. The process also produces process water containing organic compounds with higher chemical oxygen demand, which can be anaerobically digested to produce biogas. Biogas, thus produced, could supplement the energy required for the process. Apart from anaerobic digestion, process water can be used as a liquid fertilizer. Sun et al. [9] carried out the hydrothermal process at 180, 200 and 220 °C to extract the nutrients from sewage sludge and studied nitrogen, potassium, phosphorus and heavy metal content in the liquid products obtained after hydrothermal process. The extracted liquid products were experimented as a potential fertilizer in Komatsuna plant cultivation in a small-scale Results showed improvement in the crop yield. In recent times, only a few experiments have been performed on hydrothermal carbonization (HTC) of sewage sludge. For example, in one HTC at 200 °C, 2.1 MPa for 1–6 h, the hydrochar yield was 74–81% and depended on the carbonization time [10]. Another HTC on sewage sludge was carried out at 200 °C, 1.5 MPa and residence time of 4, 7, 10, and 12 h [11]. The higher heating value of the product was 14.73 MJ/kg for residence time of 10 h [10]. Most of the works on HTC has been carried out for longer residence times. Parshetti et al. [12] studied the co-combustion of sludge char from urban sewage sludge with low rank Indonesian coal as well as hydrothermally upgraded coal at 250 °C, 8–10 MPa and 15 min reaction time. The results showed that combining sludge char with low rank Indonesian coal and hydrothermally upgraded coal improved the quality of combustion emission and the HTC process is suitable for energy generation as well as co-combustion.
A feasibility study to compare hydrothermal carbonization (HTC) with conventional drying methods for sewage sludge found that HTC required less input energy and it is dependent on the dry mass content of the product [6]. Similar results were obtained for hydrothermal carbonization of sewage sludge with waste biomass as the energy balance shows low energy input as compared to the output energy [13]. There is thus a need for systematic study of this promising option for biosolid treatment. The present work investigated HTC of biosolids from a commercial sewage treatment plant and analyzed the overall system efficiency based on the first law of thermodynamics. The results of hydrothermal carbonization of biosolids at different operating conditions are presented and discussed in this paper.

2. Materials and Methods

2.1. Material (Feedstock)

The biosolid was collected from the Charlottetown wastewater treatment plant in Prince Edward Island, Canada, where it is produced by treating the sewage sludge by pasteurizing it at 70 °C for 30 min, then anaerobically digesting it. The digestate is dewatered with centrifuge, decreasing its moisture content to 75–80%. The initial moisture content of the biosolid tested was 77.2%. The biosolid used for the experiment is of grade A and is certified for soil application. The physiochemical properties on a dry basis are shown in Table 1.

2.2. Method

Hydrothermal carbonization was carried out in a high-pressure high-temperature batch reactor with a magnetic stirrer (Parr 4571HP/HT, Parr Instrument Company, Moline, IL, USA). This instrument can handle up to 5000 psi and 500 °C The raw biosolid was blended in a mixer to obtain homogenous slurry. Each experiment used 250 mL of the biosolid slurry. The slurry was weighed before pouring it into the reactor. The reactor was then sealed with a top cover and purged with nitrogen to remove any air present inside the reactor. The heater was then turned on and the controller was set to the desired temperature. The temperature inside the reactor was continuously monitored. The process residence time was measured from the instant when the temperature inside the reactor reached the desired value. The time required to reach the set point temperature of 180–220 °C is 60–90 min.
Experiments were conducted at 180 °C, 200 °C and 220 °C for 30 min residence time to study the effect of treatment temperature. Further, the effect of residence time was studied by conducting tests at 15, 30 and 60 min at a fixed temperature of 200 °C. Two sets of experiments were performed, and the average value of the results was taken for analysis. After the treatment was carried out at the desired temperature and residence time, the heater was turned off. The cooling loop of the reactor then started to quickly cool the reactor and thereby prevent any further chemical reaction. After the reactor was sufficiently cooled, its cover was opened, and the product was transferred into a beaker. The weight of the final product was then recorded. A cotton cloth filter was used to separate the solid product from the process water. The weight of the product was recorded. The solid yield and liquid yield were calculated by taking the ratio of weight of solid and liquid in the final product with initial weight of biosolid slurry. Gas yield was calculated by difference.
Solid   Yield = W e i g h t   o f   s o l i d   a f t e r   f i l t r a t i o n w e i g h t   o f   r a w   s l u r r y
Liquid   Yield = W e i g h t   o f   l i q u i d   a f t e r   f i l t r a t i o n W e i g h t   o f   r a w   s l u r r y
Mass   Yield = W e i g h t   o f   d r y   m a t t e r   i n   s o l i d   a f t e r   t r e a t m e n t W e i g h t   o f   d r y   s o l i d   m a t t e r   i n   r a w   s l u r r y
The hydrochar was analyzed by conducting proximate, ultimate and heating value analysis. The proximate analysis followed the American Society for Testing and Materials (ASTM) D3174 for ash analysis and ASTM D3175-89a for the volatile matter. The CHNSO analysis was carried out using Organic Elemental Analysis Equipment (Flash 2000 CHNS-O, (Thermo Fisher Scientific, Waltham, MA, USA) and heating value with bomb calorimeter (Parr 6100 Calorimeter, Parr Instrument Company, Moline, IL, USA). The pH value of the process water was obtained using Accumet AB200. The mineral analysis of the hydrochar and the analysis of process water were carried out at the Prince Edward Island Analytical Laboratories following standard analytical procedures. The chemical composition was obtained using atomic absorption spectrophotometry following the Association of Official Analytical Chemists (AOAC) 968.08 procedure. Liquid analysis was carried out using United States Environmental Protection Agency (EPA) 200.7 method.

3. Results and Discussion

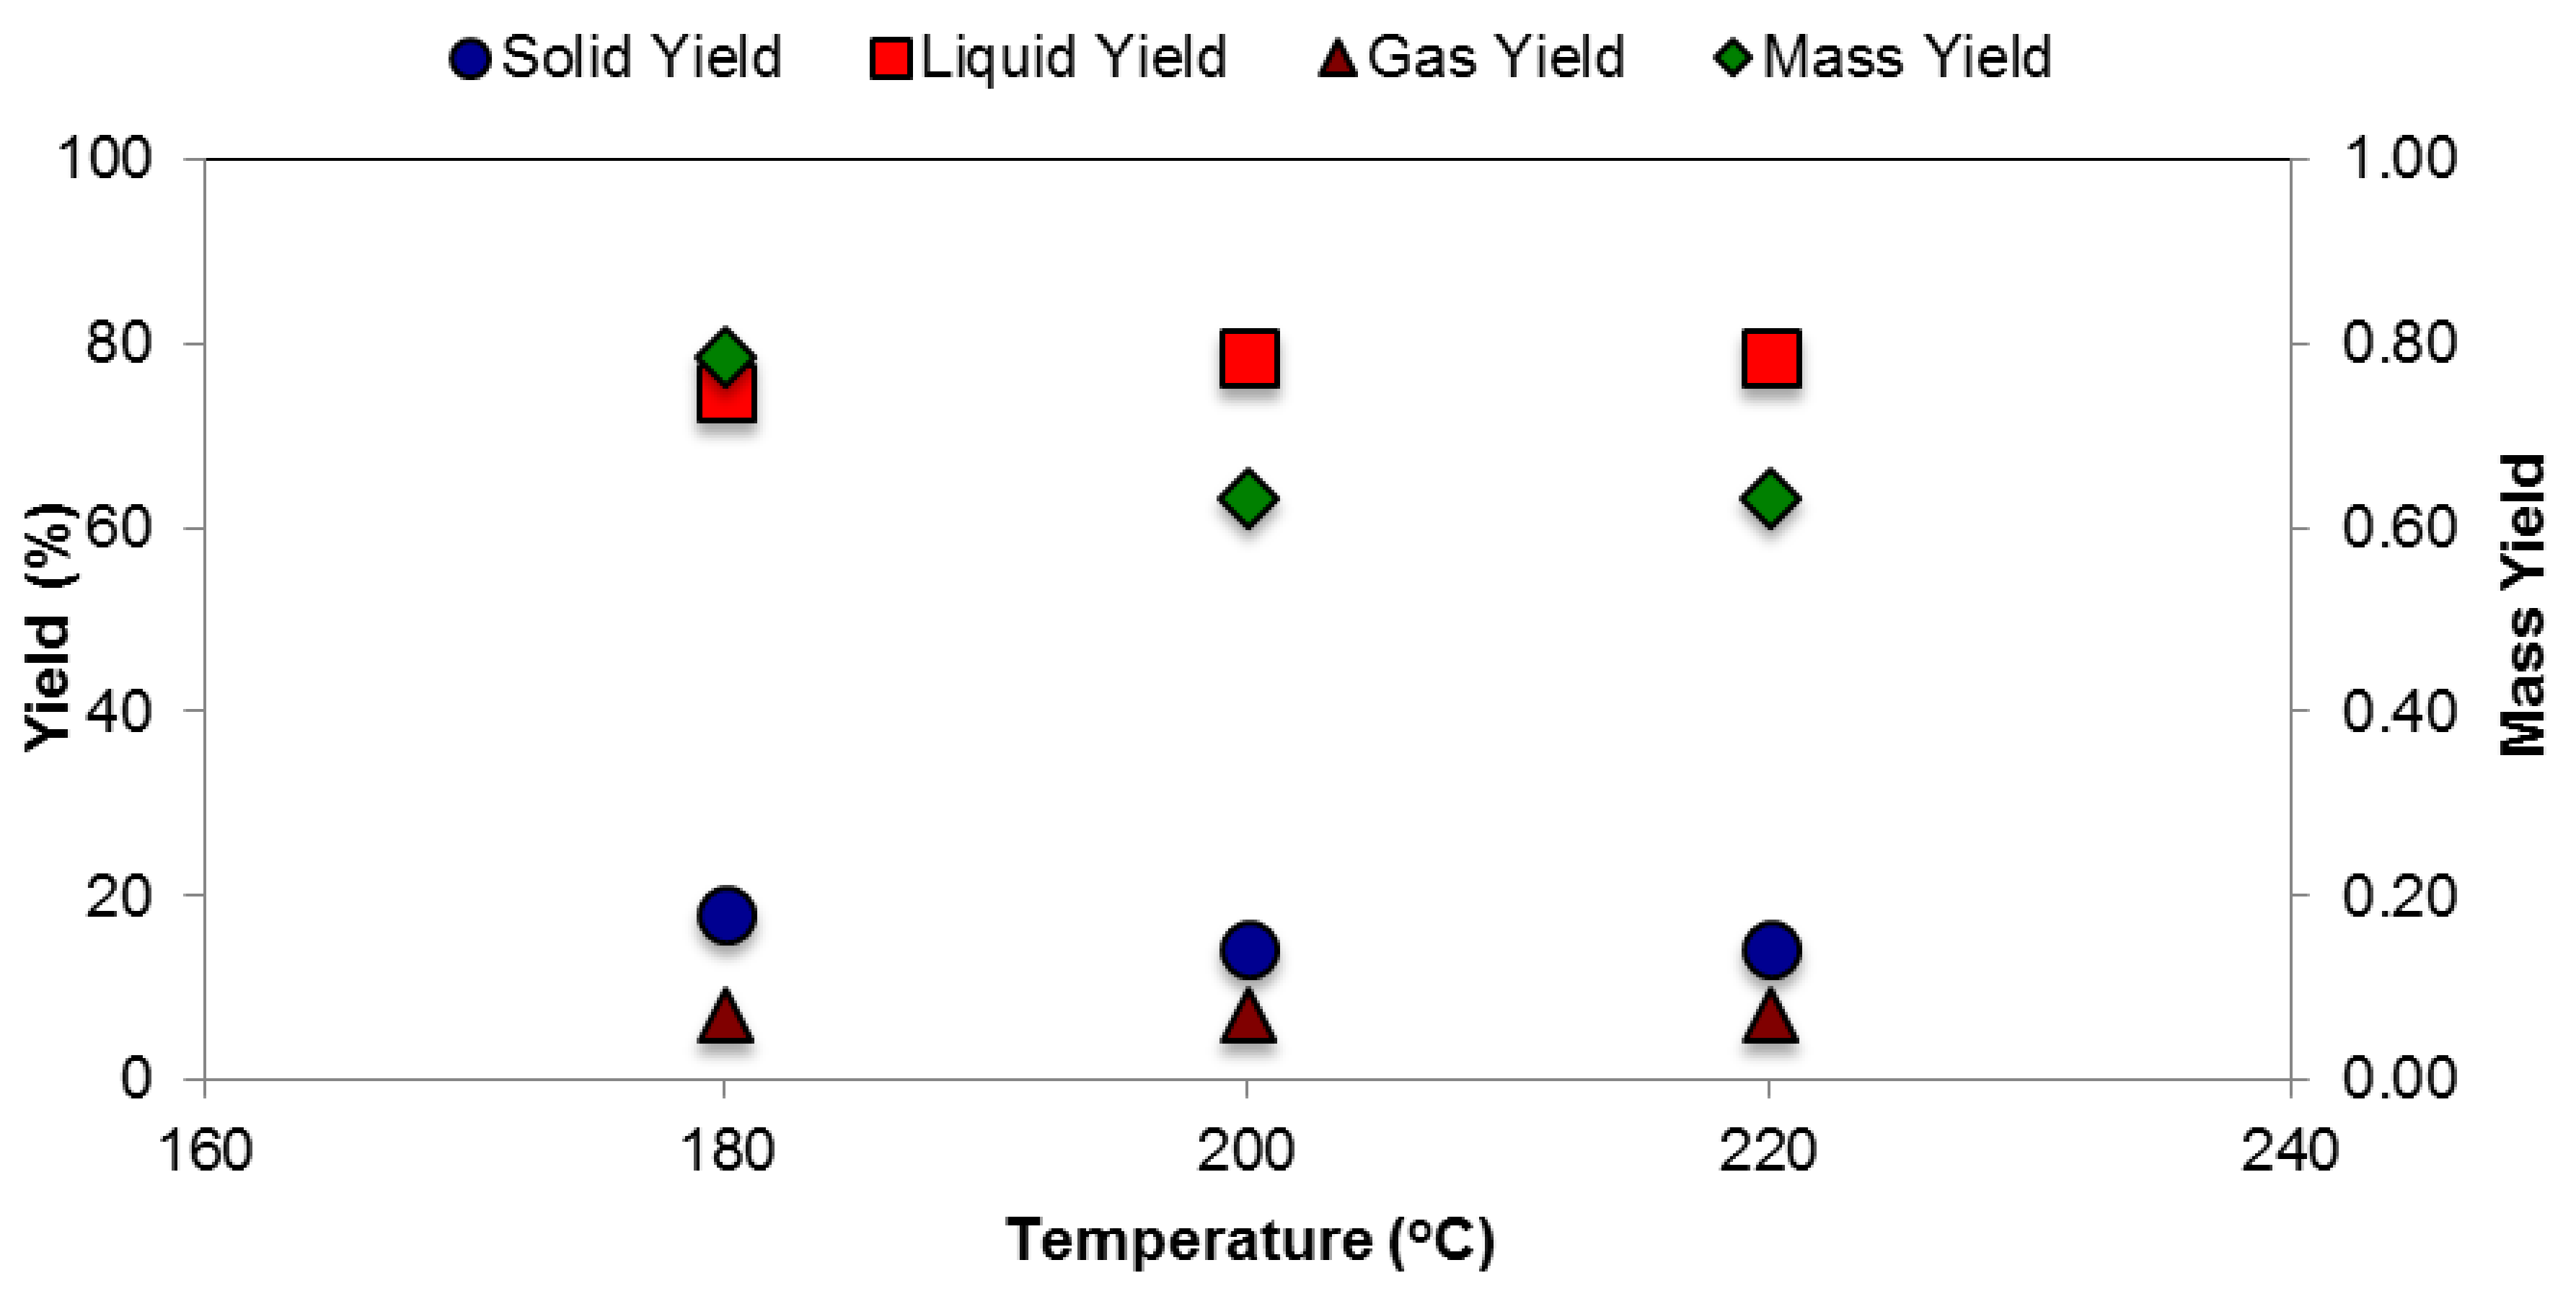
3.1. Product Distribution

The final products after hydrothermal treatment can be categorized into solid-hydrochar, liquid-process water and gas. Figure 1 and Figure 2 show the effects of temperature and residence time on product yields respectively.
The yield of solid product reduced from 18 to 14% with an increase in temperature from 180 °C to 200 °C. No difference was observed by increasing the temperature above 200 °C. The liquid yield increased from 75% at 180 °C to 78% at 200 °C. Gas yield percentage (calculated by subtracting solid and liquid yields from 100) remained constant at all temperatures. Higher temperature resulted in lower mass yield [14,15,16]. Higher temperature appeared to cause greater decomposition of organic material into liquid phase resulting in lower solid yield. Similar decline in solid yield was observed with increase in residence time. Longer residence time appears to allow more time for hydrothermal reaction resulting in decreased solid yield, which may be the reason for decrease in mass yield from 91% at 15 min to 63% at 30 min residence time. Reaction temperature, residence time and type of feedstock are the primary factors that affect the hydrothermal carbonization process [15].

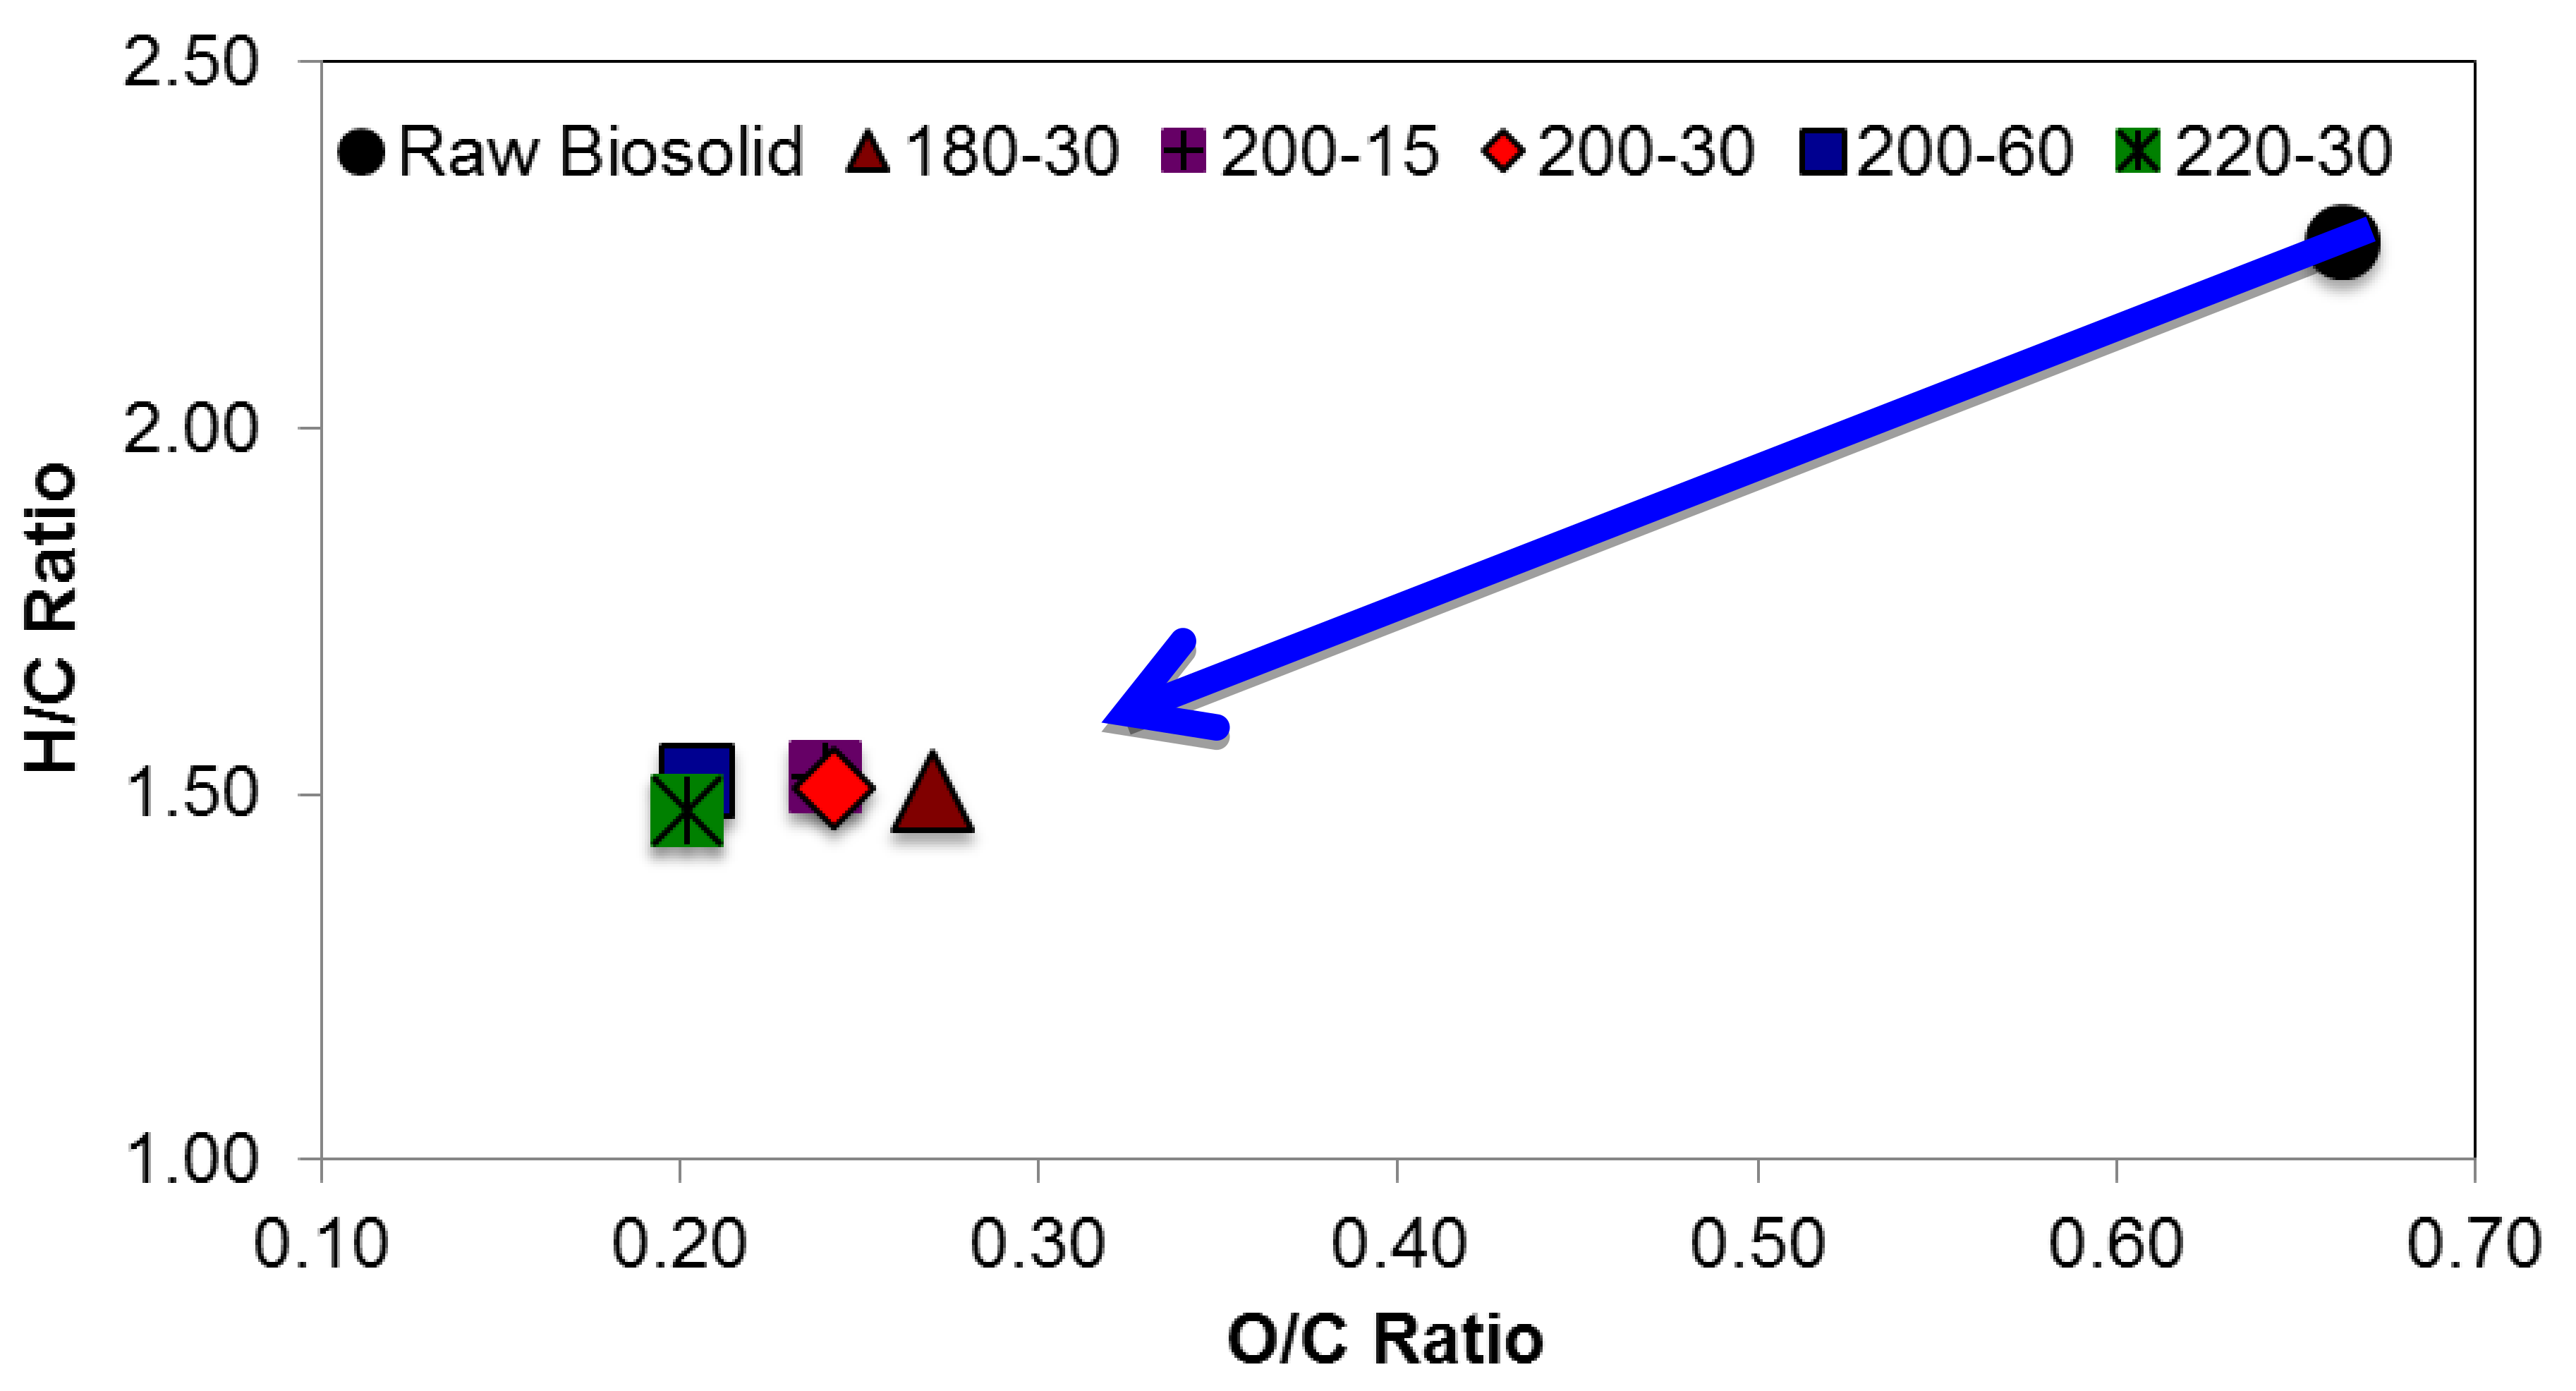
3.2. Physiochemical Properties of Hydrochar

The solid hydrochar obtained after hydrothermal treatment was analyzed for its physical, chemical and heating value and the results are presented in Table 2.
The proximate analysis shows an increase in fixed carbon and ash content with a corresponding decrease in volatile matter; this is expected as during the process the volatile matter dissolves into water, thereby increasing the fixed carbon and ash content in the solid hydrochar. Similarly, an increase in carbon content is observed with a decrease in hydrogen and oxygen from ultimate analysis. The heating value of hydrochar is in the range of 19.9 to 20.16 MJ/kg compared to 13.23 MJ/kg in raw biosolid. This represents an energy densification factor of 1.5 i.e., heating value increased by 50% in solid hydrochar. The heating value of hydrochar enhances with increases in hydrothermal carbonization temperature [16,17]. Van Krevelen diagram in Figure 3 shows the atomic ratio of hydrogen and carbon (H/C Ratio) plotted against the atomic ratio of oxygen and carbon (O/C Ratio).
The Van Krevelen diagram (Figure 3) shows that both H/C ratio and O/C ratio were lower for hydrochar compared to those for raw biosolid. This is due to rises in carbon fraction in solids after HTC which also results in an increased heating value. A similar decrease in the H/C and O/C ratios after hydrothermal carbonization of waste biomass was observed by Liu et al. [18]. Escala et al. [6] obtained reductions in the H/C and O/C ratios from 2.30 and 1, to 1.87 and 0.80 after HTC treatment of raw sludge, respectively. The HTC process is thus characterized by a decrease in the H/C and O/C ratios, which in turn improves the energy density of biochar produced. The range of H/C and O/C ratios obtained in the present results is similar to that of lignite [19]. Solid hydrochar with coal-like properties can be substituted in combustion systems [20].

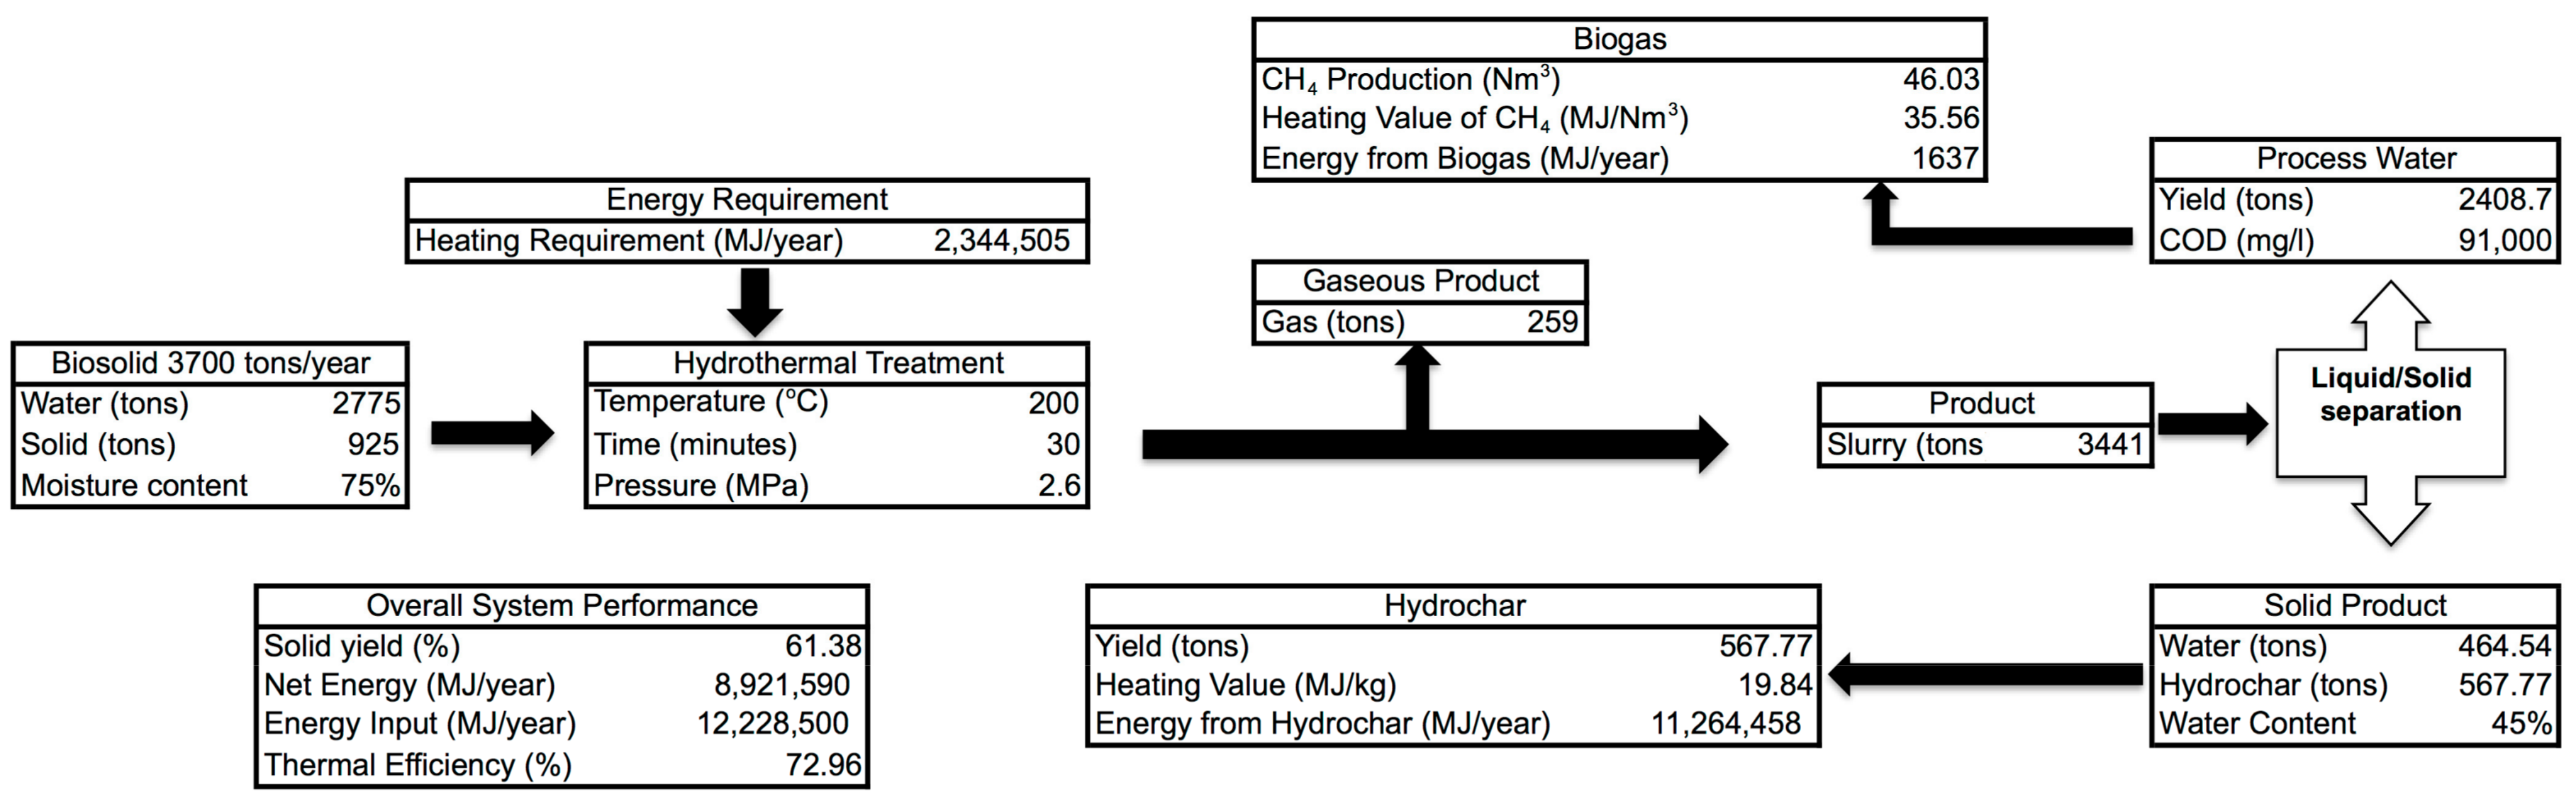
3.3. Mass and Energy Balance

Figure 4 shows the mass and energy balances for hydrothermal treatment of biosolid produced in the Charlottetown wastewater treatment plant that produces 3700 tons of biosolid (20–25% dry matter) annually. The figure also shows that with 25% dry matter, when 925 tons of dry biosolid is treated at 200 °C for 30 min residence time, 567.77 tons of hydrochar (dry) and 46.03 Nm3 of methane will be produced. The data are based on the actual production. Taking the higher heating value of raw biosolid, hydrochar and methane to be 13.23 MJ/kg, 19.84 MJ/kg and 35.56 MJ/Nm3 respectively, the thermal efficiency of the overall process is obtained to be 72.96%. The efficiency is calculated by taking the ratio of the net energy (energy from hydrochar + energy from methane − energy required for hydrothermal process) with input chemical energy with biosolid. The calculation of efficiency does not consider the potential heat recovery during cooling process of treated slurry, which will further increase the efficiency.

3.4. Mineral Analysis of Solid Hydrochar

Figure 5 shows the nitrogen (N), potassium (K) and phosphorus (P) in hydrochar obtained at various treatment conditions. The nitrogen concentration decreased after hydrothermal treatment of raw sewage (Figure 5), and it decreases with increases in treatment temperature. The residence time does not have much effect on the nitrogen concentration in hydrochar. The result for the nitrogen in hydrochar is similar to that observed in other hydrothermal carbonization studies [5,19,21,22] of biomass. Potassium concentration remained unchanged with the treatment, but the phosphorus in biochar increased after hydrothermal treatment (Figure 5); this is also evident with reduced phosphorus concentration in process water (Table 3). A similar trend is reported by Volpe et al. [23] for potassium concentration after hydrothermal carbonization. In the present hydrothermal experiment, the biosolid was blended for homogeneity and no distilled water was added because that requirement would adversely affect the feasibility of the process whose goal was to study the changes in biosolid as it is produced in the plant. Also, the water to biomass ratio in the present case was 3.0, which is in the lower range of water to biomass ratios normally used in hydrothermal carbonization. Furthermore, the water in biosolid itself contains minerals. Consequently, during the process, instead of being dissolved, the minerals from water could have deposited in the hydrochar. These could be the reasons for the increase in the concentration of phosphorus. Wang et al. [24] reported significant accumulation of phosphorus in hydrochar obtained from HTC of sewage sludge.
The carbon to nitrogen ratio (C/N) was found to increase with an increase in temperature, with a maximum of 13.1 obtained for hydrochar obtained from treatment at 220 °C and 30 min residence time, which represents an increase of 60% as compared to raw biosolid. The reduction in nitrogen concentration makes the hydrochar suitable for energy applications as it lowers the risk of corrosion and fouling issues in boilers [25]. Furthermore, a higher C/N ratio and higher mineral content make hydrochar suitable for soil remediation applications. A suitable C/N ratio for bioremediation is 10.0 [26]. Fang et al. [27] have reviewed the application of hydrochar derived from hydrothermal carbonization of biomass and state that hydrochar enhances the effects of fertilizer in soil by reducing the amount of fertilizer that is lost through surface run-off.

3.5. Process Water

Process water is an important product of hydrothermal carbonization. It is produced after solid–liquid separation of hydrothermally treated biosolids. Chemical oxygen demand (COD) is the amount of oxygen required to oxidize the organic material in the water. It is thus a measure of potential biogas production. Since a part of the volatiles in biosolid gets dissolved in the water the amount of hydrocarbon in process water produced increases that in turn increases COD as we see from Table 3. In anaerobic digestion, microbial activities convert the organic compound into biogas. The pH, chemical oxygen demand and the theoretical biogas production from the process water are shown in Table 3.
The pH of the process water is in the range of 6.04 to 7.57, which is within an appropriate range for the anaerobic digestion process. The COD values of process water are even higher than those of sewage sludge, which could be anaerobically digested to produce biogas. COD for this ranges from 6000 to 90,000 mg/L [28]. Considering theoretical methane production of 0.35 L/g-of-COD [29], an average methane production of 0.03 Nm3/L of process water could be obtained which can supplement the energy needed for the hydrothermal process.

4. Conclusions

Hydrothermal treatment could recover value in biosolid in the form of solid hydrochar and liquid process water. The heating values of solid produced from raw biosolid increased by 50% after hydrothermal carbonization. The thermal efficiency of the hydrothermal treatment system was 73% without heat recovery. The C/N ratio and mineral content were higher in the hydrochar, making it suitable for soil remediation applications. Hydrochar could also be used for energy applications provided there are provisions for flue gas scrubbing and multi-stage combustion. The process water contained high COD value in the range of 83,000 to 96,000 mg/L and a pH in the range 6.04 to 7.57, which is suitable for anaerobic digestion to produce methane to supplement the energy required for the process.

Author Contributions

Conceptualization, B.A. and R.M.; Methodology, D.B., R.K.D., B.A. and P.B.; Formal Analysis, A.S., D.B., R.K.D., and B.A.; Writing-original draft preparation, A.S., and B.A.; Supervision, B.A. and P.B.; Funding acquisition, B.A. and R.M.

Funding

This project was funded by NSERC–Engage Grant (513321-17).

Acknowledgments

We acknowledge the Charlottetown Pollution Control Plant for their support for the research.

Conflicts of Interest

The authors declare no conflict of interest.

References

  1. North East Biosolids and Residuals Association (NEBRA), 2007. A National Biosolids Regulation, Quality, End Use and Disposal Survey. Available online: https://static1.squarespace.com/static/54806478e4b0dc44e1698e88/t/5488541fe4b03c0a9b8ee09b/1418220575693/NtlBiosolidsReport-20July07.pdf (accessed on 12 March 2018).
  2. Canadian Council of Ministers of the Environment (CCME), Canada-wide Approach for the Management of Wastewater Biosolids. Available online: https://www.ccme.ca/files/Resources/waste/biosolids/pn_1477_biosolids_cw_approach_e.pdf (accessed on 15 May 2018).
  3. Risks Associated with Application of Municipal Biosolids to Agricultural Lands in a Canadian Context. Available online: http://www.cwn-rce.ca/assets/resources/pdf/McCarthy-Risks-Biosolids-2015.pdf (accessed on 15 April 2018).
  4. Capareda, S.C. Introduction to Biomass Energy Conversion, 1st ed.; CRC Press: Boca Raton, FL, USA, 2013. [Google Scholar]
  5. Kambo, H.S.; Dutta, A. Strength, storage, and combustion characteristics of densified lignocellulosic biomass produced via torrefaction and hydrothermal carbonization. Appl. Energy 2014, 135, 182–191. [Google Scholar] [CrossRef]
  6. Escala, M.; Zumbühl, T.; Koller, C.; Junge, R.; Krebs, R. Hydrothermal carbonization as an energy-efficient alternative to established drying technologies for sewage sludge: A feasibility study on a laboratory scale. Energy Fuels 2013, 27, 454–460. [Google Scholar] [CrossRef]
  7. Xue, X.; Chen, D.; Song, X.; Dai, X. Hydrothermal and pyrolysis treatment for sewage sludge: Choice from product and from energy benefit1. Energy Procedia 2015, 66, 301–304. [Google Scholar] [CrossRef]
  8. Lucian, M.; Fiori, L. Hydrothermal carbonization of waste biomass: Process design, modeling, energy efficiency and cost analysis. Energies 2017, 10, 211. [Google Scholar] [CrossRef]
  9. Sun, X.; Sumida, H.; Yoshikawa, K. Effects of liquid fertilizer produced from sewage sludge by the hydrothermal process on the growth of komatsuna. Br. J. Environ. Clim. Chang. 2014, 4, 261–278. [Google Scholar] [CrossRef]
  10. Saetae, P.; Tippayawong, N. Recovery of Value-Added Products from Hydrothermal Carbonization of Sewage Sludge. ISRN Chem. Eng. 2013, 2013. [Google Scholar] [CrossRef]
  11. Wilk, M. A novel method of sewage sludge pre-treatment-HTC. In E3S Web of Conferences; EDP Sciences Reyulis: Paris, France, 2016; Volume 10. [Google Scholar] [CrossRef]
  12. Parshetti, G.K.; Liu, Z.; Jain, A.; Srinivasan, M.P.; Balasubramanian, R. Hydrothermal carbonization of sewage sludge for energy production with coal. Fuel 2013, 111, 201–210. [Google Scholar] [CrossRef]
  13. Zhai, Y.; Peng, C.; Xu, B.; Wang, T.; Li, C.; Zeng, G.; Zhu, Y. Hydrothermal carbonization of sewage sludge for char production with different waste biomass: Effects of reaction temperature and energy recycling. Energy 2017, 127, 167–174. [Google Scholar] [CrossRef]
  14. Pruksakit, W.; Patumsawad, S. Hydrothermal carbonization (htc) of sugarcane stranded: Effect of operation condition to hydrochar production. Energy Procedia 2016, 100, 223–226. [Google Scholar] [CrossRef]
  15. Nizamuddin, S.; Baloch, H.A.; Griffin, G.J.; Mubarak, N.M.; Bhutto, A.W.; Abro, R.; Mazari, S.A.; Ali, B.S. An overview of effect of process parameters on hydrothermal carbonization of biomass. Renew. Sustain. Energy Rev. 2017, 73, 1289–1299. [Google Scholar] [CrossRef]
  16. Román, S.; Libra, J.; Berge, N.; Sabio, E.; Ro, K.; Li, L.; Ledesma, B.; Álvarez, A.; Bae, S. Hydrothermal Carbonization: Modeling, Final Properties Design and Applications: A Review. Energies 2018, 11, 216. [Google Scholar] [CrossRef]
  17. Li, H.; Wang, S.; Yuan, X.; Xi, Y.; Huang, Z.; Tan, M.; Li, C. The effects of temperature and color value on hydrochars’ properties in hydrothermal carbonization. Bioresour. Technol. 2018, 249, 574–581. [Google Scholar] [CrossRef] [PubMed]
  18. Liu, Z.; Quek, A.; Kent Hoekman, S.; Balasubramanian, R. Production of solid biochar fuel from waste biomass by hydrothermal carbonization. Fuel 2013, 103, 943–949. [Google Scholar] [CrossRef]
  19. Hustad, J.; Barrio, M. Biomass. IFRF Online Combustion Handbook. 2000. Available online: http://www.handbook.ifrf.net/handbook/cf.html?id=23 (accessed on 20 April 2018).
  20. Reza, M.T.; Lynam, J.; Uddin, M.H.; Coronella, C. Hydrothermal carbonization: Fate of inorganics. Biomass Bioenergy 2013, 49, 86–94. [Google Scholar] [CrossRef]
  21. Pala, M.; Kantarli, I.C.; Buyukisik, H.B.; Yanik, J. Hydrothermal carbonization and torrefaction of grape pomace: A comparative evaluation. Bioresour. Technol. 2014, 161, 255–262. [Google Scholar] [CrossRef] [PubMed]
  22. Jan, R.P.; Lucas, P.J.B.; Mark, N.W.N.; Marcel, H.Z.; Mariusz, K.C. Conversion of water plant to biomass fuel using TORRWASH. In Proceedings of the 22nd European Biomass Conference and Exhibition, Hamburg, Germany, 23–26 June 2014. [Google Scholar]
  23. Volpe, M.; Goldfarb, J.L.; Fiori, L. Hydrothermal carbonization of Opuntia ficus-indica cladodes: Role of process parameters on hydrochar properties. Bioresour. Technol. 2018, 247, 310–318. [Google Scholar] [CrossRef] [PubMed]
  24. Wang, T.; Zhai, Y.; Zhu, Y.; Peng, C.; Wang, T.; Xu, B.; Li, C.; Zeng, G. Feedwater pH affects phosphorus transformation during hydrothermal carbonization of sewage sludge. Bioresour. Technol. 2017, 245, 182–187. [Google Scholar] [CrossRef] [PubMed]
  25. Gamgoum, R.; Dutta, A.; Santos, R.; Chiang, Y. Hydrothermal conversion of neutral sulfite semi-chemical red liquor into hydrochar. Energies 2016, 9, 435. [Google Scholar] [CrossRef]
  26. Galdames, A.; Mendoza, A.; Orueta, M.; García, I.S.d.S.; Sánchez, M.; Virto, I.; Vilas, J.L. Development of new remediation technologies for contaminated soils based on the application of zero-valent iron nanoparticles and bioremediation with compost. Resour.-Effic. Technol. 2017, 3, 166–176. [Google Scholar] [CrossRef]
  27. Fang, J.; Zhan, L.; Ok, Y.S.; Gao, B. Minireview of potential applications of hydrochar derived from hydrothermal carbonization of biomass. J. Ind. Eng. Chem. 2018, 57, 15–21. [Google Scholar] [CrossRef]
  28. Henze, M.; Loosdrecht, M.C.M.; Ekama, G.A.; Brdjanovic, D. Biological Wastewater Treatment: Principles, Modelling and Design; IWA Publishing: London, UK, 2008; ISBN 9781843391883. [Google Scholar]
  29. Prabhudessai, V.; Ganguly, A.; Mutnuri, S. Biochemical Methane Potential of Agro Wastes. J. Energy 2013, 2013. [Google Scholar] [CrossRef]
Figure 1. Effect of temperature on the products distribution.
Energies 11 02286 g001
Figure 2. Effect of residence time on the products distribution.
Energies 11 02286 g002
Figure 3. Van Krevelen diagram for raw and solid hydrochar.
Energies 11 02286 g003
Figure 4. Mass and energy balance for hydrothermal treatment of biosolid.
Energies 11 02286 g004
Figure 5. Nitrogen, phosphorus and potassium in hydrochar with carbon to nitrogen (C/N) ratio (dry basis).
Energies 11 02286 g005
Table 1. Proximate, ultimate and heating value analyses of biosolid (dry basis).
Proximate Analysis (%)Ultimate Analysis (%)Higher Heating Value
Fixed CarbonAsh ContentVolatile MatterCHONSMJ/kg
6.8824.2068.9234.236.4230.284.160.7113.3
Table 2. Proximate, ultimate and heating value of solid hydrochar (dry basis). Product designations indicate temperature (°C) and time (min).
Analysis Raw180-30200-15200-30200-60220-30
Proximate analysis (%)
Moisture77.1642.1947.4446.9753.6347.44
Ash24.2032.0632.8133.8633.1233.9
Volatile Matter68.9254.2254.4953.5653.3752.67
Fixed Carbon6.8813.7212.7112.5813.5113.43
Ultimate analysis (%)
Carbon34.2342.2743.1142.1543.9843.94
Hydrogen6.425.35.475.35.555.41
Nitrogen4.164.13.743.984.223.79
Oxygen30.2815.2213.8313.6512.0411.83
Sulphur0.711.051.041.061.091.13
HHV (MJ/kg)13.2319.9419.9019.8520.1220.16
Energy Densification-1.511.501.501.521.52
Table 3. Chemical Oxygen Demand and pH of process water.
Analysis180-30200-15200-30200-60220-30
Phosphorus (ppm)207.3192154.4136.386.16
COD (mg/L)83,00091,00091,00096,00091,000
pH6.567.576.116.046.49
Methane Production (Nm3/L)0.0290.03180.03180.03360.0318

