Article

A Study on the Open Circuit Voltage and State of Charge Characterization of High Capacity Lithium-Ion Battery Under Different Temperature

1
Graduate School at Shenzhen, Tsinghua University, Shenzhen 518055, China
2
College of Mechanical and Vehicle Engineering, Hunan University, Changsha 410082, China
3
Sunwoda Electronic Co. Ltd., Shenzhen 518108, China
*
Author to whom correspondence should be addressed.
Energies 2018, 11(9), 2408; https://doi.org/10.3390/en11092408
Submission received: 16 August 2018 / Revised: 6 September 2018 / Accepted: 10 September 2018 / Published: 12 September 2018

Abstract

:
Open circuit voltage (OCV) is an important characteristic parameter of lithium-ion batteries, which is used to analyze the changes of electronic energy in electrode materials, and to estimate battery state of charge (SOC) and manage the battery pack. Therefore, accurate OCV modeling is a great significance for lithium-ion battery management. In this paper, the characteristics of high-capacity lithium-ion batteries at different temperatures were considered, and the OCV-SOC characteristic curves at different temperatures were studied by modeling, exponential, polynomial, sum of sin functions, and Gaussian model fitting method with pulse test data. The parameters of fitting OCV-SOC curves by exponential model (n = 2), polynomial model (n = 3~7), sum of sin functions model (n = 3), and Gaussian model (n = 4) at temperatures of 45 °C, 25 °C, 0 °C, and −20°C are obtained, and the errors are analyzed. The experimental results show that the operating temperature of the battery influences the OCV-SOC characteristic significantly. Therefore, these factors need to be considered in order to increase the accuracy of the model and improve the accuracy of battery state estimation.

1. Introduction

The battery system is the most prominent energy storage source in electric vehicles (EVs) [1]. Lithium-ion batteries are a promising candidate for EVs due to their high power density, lightweight, long lifespan, and thermal stability. The use of high-capacity lithium-ion batteries as the battery system of EVs is the current development trend [2]. To prolong lifespan and increase safety of the batteries, real-time monitoring of the state of charge (SOC) is indispensable. Since the SOC cannot be measured directly, many approaches have been proposed to estimate the SOC of the battery [3,4,5,6]. Among them, the model-based method is widely used in the application for its high accuracy and self-corrective ability [7,8,9]. These methods commonly used impose or are coupled with a nonlinear curve characterization of the open circuit voltage (OCV) [10,11,12]. As an important characteristic parameter of the battery, the relationship between SOC and OCV is of great significance for many techniques such as analytical electrode materials, accurate battery modeling, and reliable SOC estimation [13].
Caihao et al [14] think that open circuit voltage data is widely used for characterizing battery properties under different conditions. It contains important information that can help to estimate battery SOC and the state of health (SOH). According to the Roscher et al. [15] study, battery cell OCV curve changes can reflect battery aging and performance degradation. Rui Xiong et al. [1] indicate that the OCV of each electrode depends on temperature and the concentration of lithium-ions in the electrode that is normalized by the SOC of the respective electrode. The estimation of SOC is quite complicated, as it depends on the type of cell, ambient temperature, internal temperature, and the application [16]. Zuchang Gao et al. [17] believe that estimating the SOC of a single cell and terminal voltage estimation without considering the SOC and temperature differences is not enough and studied the LiFePO4 battery terminal voltage and SOC errors at various temperatures. Seyed Saeed Madani et al. [18] proposed a battery equivalent electrical circuit model (ECM) with the constant phase element (CPE) includes the temperature dependency.
To enhance the efficiency of the OCV measurement, Iryna Snihir et al. [19] has been proposed a statistical analysis based on a limit of voltage curves corresponding to the discharge-charge sequence of currents in laboratory. Thus, the relationship between OCV and SOC can be obtained by an offline test. The incremental and the low-current typical OCV test are widely used in the literature [20]. The results reveal that the incremental OCV test to be more reliable for determining the OCV-SOC relationship than the low-current OCV test, according to the comparison of them in Reference [21,22]. Satyam Panchal et al. [23] has studied the battery OCV-SOC relationship at various discharge rates (1 C, 2 C, 3 C, and 4 C) and different cooling bath temperatures (5 °C, 15 °C, 25 °C, and 35 °C) via experiments. The obtained OCV may not equal the battery voltage in equilibrium state as it consists of overvoltage referring to time constants in the range of some hours. Notably, the average value of charge OCV and discharge OCV are commonly treated as the true or reference OCV due to the pronounced hysteresis effect, which usually takes several days to obtain an accurate OCV–SOC relationship for both the incremental OCV test and the low-current OCV test [20]. The direct measurement of the OCV is difficult for online applications due to the long waiting time for the batteries to reach a steady state [24].
The OCV-SOC modeling is one of the key factors for the OCV-based SOC estimation methods, such as the Shepherd model [7], Nernst model [25], Unnewehr universal model [7], combined model [7], exponential model [26], polynomial model [27], and ECMs model [28]. Besides, open circuit voltage is used to correct the estimated SOC, the OCV-SOC modeling is very important not only in OCV-based estimation but also in model-based estimation [29]. In order to accurately obtain the battery OCV model, according to the different modeling mechanism, it is mainly divided into a simplified electrochemical OCV model and polynomial OCV model. The simplified electrochemical OCV model is a simplified mathematical model based on the principle of charge transfer inside the battery. The corresponding relationship between OCV and SOC is characterized by the basic electrochemical principle. The modeling accuracy is high, but the calculation process is complex and the modeling is difficult. The polynomial OCV model uses the polynomial function to establish the relationship between OCV and SOC mapping. The model is clear and simple in modeling, but the model uses the least square method to fit the OCV curve, the local precision of the curve is not high, and the robustness is poor. The OCV is of essential importance for the accurate estimation of the SOC in lithium-ion battery. The OCV-SOC relationship is typically predetermined by fitting offline OCV data [30]. Thus Kalman family filtering techniques based on state-space models are utilized to enhance SOC estimation through combining OCV and coulomb counting [20].
While the OCV-SOC curve of lithium-ion batteries is relatively stable, it will change according to the charging/discharging rate, battery temperature, cell variation, and cycle life of the battery, and so on [1,31]. S. Panchal [32] has studied EV battery system four drive cycle actual conditions at various ambient temperatures. When the temperature rises, the chemical reactions in the battery will intensify, the utilization ratio of active substances will increase, the lithium ion transfer capacity will be strengthened, the actual available electricity will increase, but when the temperature is too high, the reaction will be restrained, the performance will be reduced, and serious explosion will occur; otherwise, when the temperature is lower, the utilization ratio of active substances will be increased. Additionally, actual electricity consumption will be reduced. With the increase of lithium battery cycle times, the internal chemicals will age and deteriorate, resulting in increased internal resistance and decreased capacity. Besides, there is an OCV hysteresis phenomena [33] and a big challenge for OCV-based SOC estimation that the flat area of OCV-SOC curve for lithium-ion power battery enlarges the measurement errors of OCV [34]. Alexander Farmann [11] used a simplified OCV-model by considering a temperature correction term. The OCV-SOC is only dependent on ambient temperature, which can also result in errors in battery SOC estimation [35]. Lavigne et al. [10] proposed through some hypotheses and an appropriate definition of the cell state of charge, and proposed a two stage lithium-ion OCV curve model to estimate battery SOC. Xuanju Dang et al. [28] motivated by the structure of the battery ECMs, proposed a linear neural network battery model and its structure, in which the OCV is represented by using the weighting coefficient.
Therefore, it is very important to understand the OCV-SOC relationship of the battery for battery state estimation and battery management system development. This paper focuses on the OCV-SOC relationship of a high capacity lithium-ion battery. In 
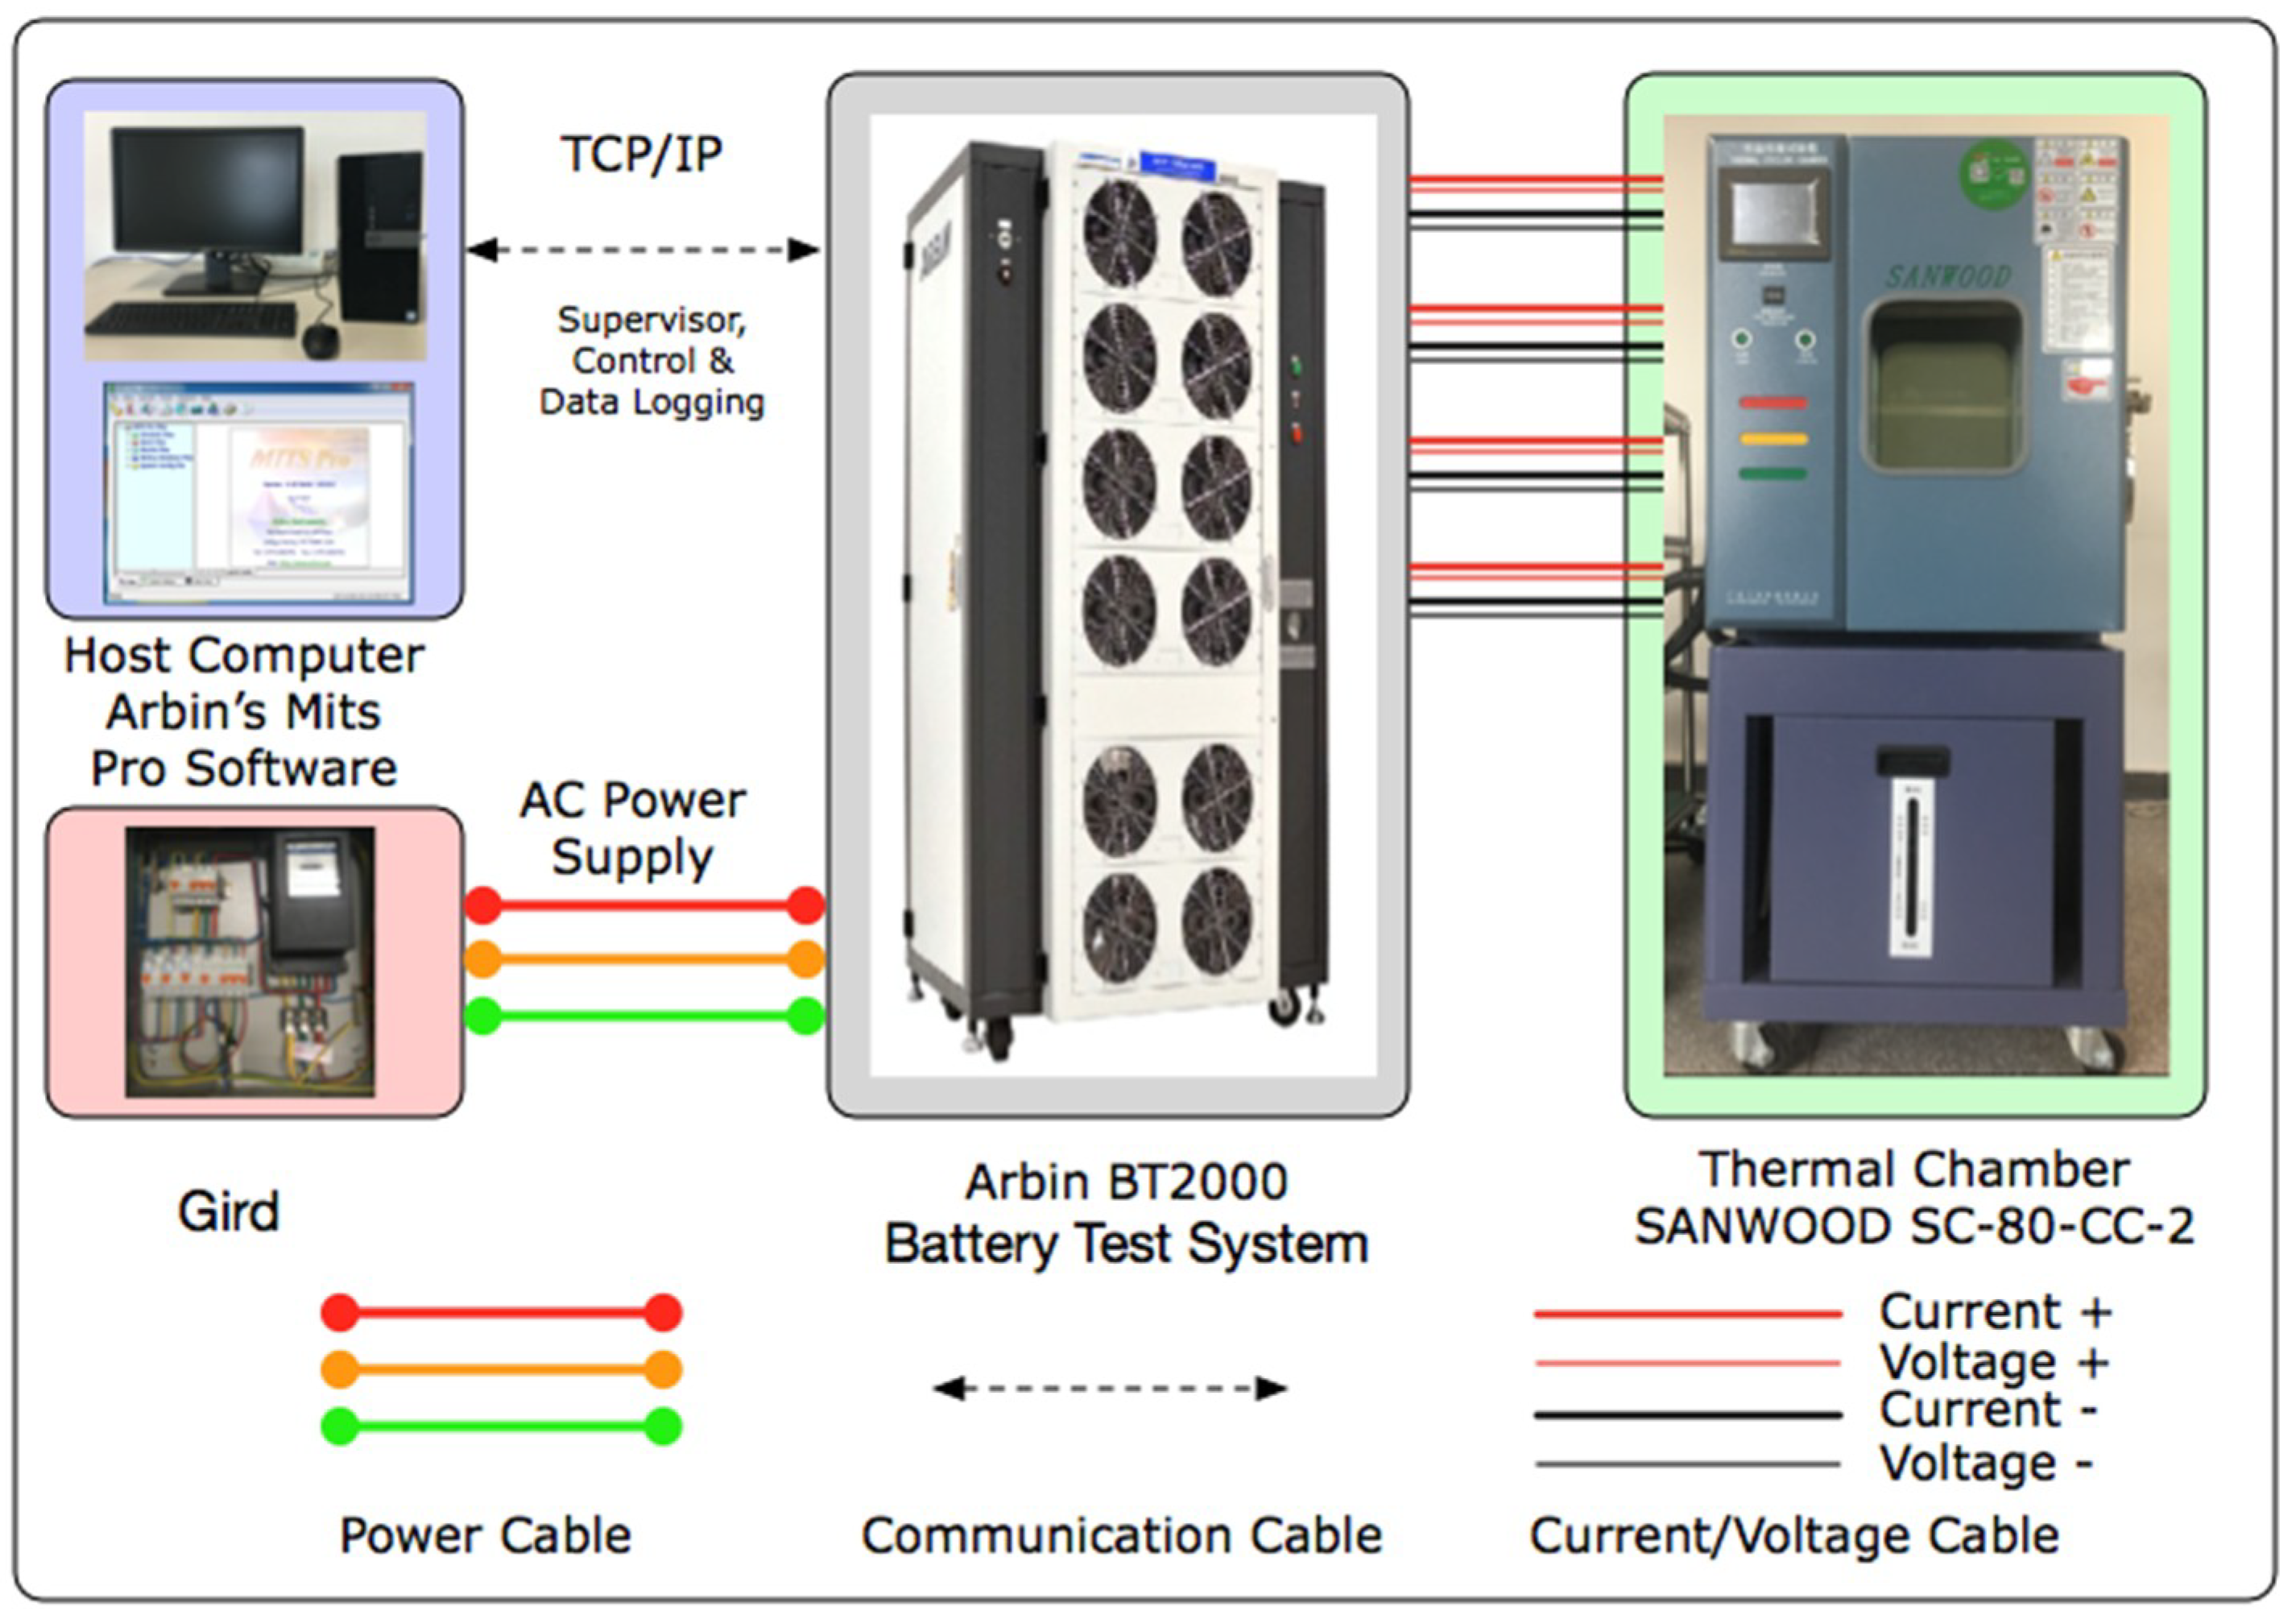
Section 2, the test bench and the test plan of the battery is designed and carried out, and the OCV-SOC relationship models are given. In Section 3, the OCV-SOC relationship of the battery is obtained, exponential, polynomial, sum of sin functions model, and Gaussian model four types model-fitting results are compared and analyzed. In Section 4, the advantages and disadvantages of several fitting methods are discussed, and the direction of improvement is discussed. At last, this paper gives the OCV-SOC relationship conclusion of high capacity lithium-ion battery. This research will be important for future research and development in battery model online identification and state estimation.

2. Method

2.1. Experiments and Tests

2.1.1. Test Bench

The schematic of the battery test bench is shown in Figure 1. It consists of an Arbin BT2000 battery test system, a host computer with MITS Pro soft for programming the BT2000 and a SANWOOD SC-80-CC-2 thermal chamber for environmental control. The gird is providing the power for the BT2000 battery test system through the power cable, the battery test system can charge/discharge a battery according to the designed program with maximum voltage of 60 V and maximum charge/discharge current of 300 A with three range (5 A/50 A/300 A), and its recorded data includes current, voltage, temperature, charge/discharge Amp-hours (Ah), and Watt-hours (Wh) etc. The measured data is transmitted to the host computer through TCP/IP ports. The measurement error of the current and voltage sensors inside the Arbin BT2000 cycler is less than ±0.1%. The test was carried out under the conditions of standard temperature (25 ± 2 °C) and specific temperature, standard humidity (65 ± 20% RH), and atmospheric pressure (86~106 kPa). All tests were carried out in a clamping fixture with a clamping force of 100 ± 10 kgf/pcs.
In these tests, the 75 Ah fresh prismatic lithium-ion battery cells that left the factory not more than one month and the recharge cycle not more than five times are chosen, the cathode material for the lithium-ion battery cell is nickel manganese cobalt oxide (NMC). The specification parameters of the lithium-ion battery cell supplied by the manufacturer are listed in Table 1.

2.1.2. Pulse Test

The hybrid pulse power characterization (HPPC) test is a typical test method to conduct pulse tests. The pulse test is carried out in reference to HPPC test. The pulse discharge test characterizes the battery cell voltage response (cell dynamics) at various SOCs and temperatures.
The test using a normal constant current-constant voltage (CC-CV) charging procedure is as follows: First, battery cells were used the constant current-constant voltage (CC-CV) charging protocol, a cell would be considered fully recharged to 100% SOC upon the completion of the CC-CV charge regime and put them statically for about one hour for the steady state, and then, battery cells were discharged with constant current (CC) and ensure the decrease of SOC with 5%, measure of the OCV after one hour[36]. The data points in the range of 100%–0% SOC were collected in 5% intervals. During battery test operation, the sampling time of current and voltage was 1 s. The battery ambient temperatures were set to 45 °C, 25 °C, 0 °C, and −20 °C. The battery pulse test profile is shown in Figure 2. In the pulsed constant current discharge procedure, 1 C (75 Ah) current was chosen for a pulse discharge test. C rate refers to the output value of the battery within the specified time, and the output value is equal to the multiple of the rated capacity.

2.2. Lithium-Ion Battery OCV-SOC Model

The battery open circuit voltage has a strong nonlinear relationship with the SOC. The relationship between OCV and SOC of lithium-ion batteries is essentially a functional relationship. According to the monotonic increasing relationship between OCV and SOC, the OCV-SOC curves are obtained by fitting several test points of OCV in SOC interval and corresponding models. Thus, OCV modeling is the key step to obtain OCV curve, and the quality of the OCV model directly affects the practicability and accuracy of the OCV curve. Therefore, in order to obtain a reliable OCV-SOC curve, it is necessary to establish an accurate OCV model for the battery.

2.2.1. Exponential Model

Considering the influence factors of temperature, the fitting precision and the complexity of fitting function. The OCV-SOC relationship corresponding to each temperature point can be obtained by the following function:
V o c = a 1 e b 1 S + a 2 e b 1 S + cS 2
where, a 1 , b 1 , a 2 , b 2 , and   c are the coefficients with the temperature, V o c is the battery open circuit voltage under different operating temperature, and S is the SOC value.

2.2.2. Polynomial Fitting Model

The open circuit voltage of the battery as a function of SOC can be represented as a polynomial equation [37].
V o c = a 1 S n + a 2 S n 1 + + a n S + a n + 1
where, a 1 ~ a n + 1 are the coefficients obtained by the least square method curve fitting, V o c is the open circuit voltage, and S is the SOC value.

2.2.3. Sum of Sin Functions Model

The battery OCV-SOC function relationship can be represented as a sum of sin functions model equation as follows:
  V o c = i = 1 n a n s i n ( b n S + c n )
where, a n , b n , and   c n are the coefficients, i is the term, n is the number of terms, V o c is the open circuit voltage, and S is the SOC value.

2.2.4. Gaussian Model

The OCV-SOC Gaussian model equation as follow:
V o c = i = 1 n a n e ( S b n c n ) 2
where, a n , b n , and   c n are the coefficients, i is the term, n is the number of terms, V o c is the open circuit voltage, and S is the SOC value.

2.2.5. Root Mean Square Error

Definition of root mean square error (RMSE) estimation function:
RMSE = 1 n ( V o c ( i ) V a c t u a l ( i ) ) 2
where, i is the point recorded in the SOC value of the experiment, n is the total number of points recorded in experiments, V a c t u a l ( i ) is the actual OCV value, and V o c ( i ) is the estimated OCV value.

3. Results

3.1. Battery OCV-SOC Curve

For the battery discharge data, the battery OCV-SOC curve at temperatures of 45 °C, 25 °C, 0 °C, and −20 °C is shown in Figure 3. The OCV-SOC curve is very different, especially under the influence of high and low temperature. Achieving an accurate OCV is the key issue for model-based estimation.
It can be seen from the diagram that the higher the ambient temperature is, the lower discharge cut-off voltage of the battery is, the greater discharge capacity of the battery is, and the OCV-SOC characteristic curve shows a whole downward shift. On the contrary, the lower the ambient temperature is, the higher the discharge cut-off voltage of the battery is, resulting in a lot of battery power that cannot be released. It is worth noting that in the low SOC interval, different OCV-SOC curves are very different.

3.2. Exponential Model Result

The OCV-SOC measured points and exponential model fitting curves under different temperatures are shown in Figure 4. Figure 4a–d is a comparison of the measured values and the fitting curves of two order exponential model at temperatures of 45 °C, 25 °C, 0 °C, and −20 °C values. While the fitting curve of the OCV-SOC is in good agreement with the experimental data, it can be seen from the graph that the error in the low SOC range is larger.
The coefficients of OCV-SOC exponential model at different temperatures are shown in Table 2. The exponential model (n = 2) coefficient parameter values can be obtained quickly through this table.

3.3. Polynomial Fitting Model Result

The OCV-SOC curves are fitted by the established OCV polynomial fitting model at OCV test points obtained by the pulse discharge experiments at different temperatures. The OCV-SOC relation curve and polynomial fitting curves at different orders and different temperatures are shown in the Figure 5. Figure 5a–d is a comparison of measured values and the fitting curves of 3~7 order polynomials at temperatures of 45 °C, 25 °C, 0 °C, and −20 °C values. It can be seen from Figure 5 that a different order fitting is different from the true value, and the fitting curve cannot fully reflect the true value. Especially in the relatively low interval of SOC, there is more error. At different temperatures, the shape and trend of OCV-SOC curves are obviously different, so one fitting result cannot be used to reflect all the relationship characteristics of OCV-SOC curves.
The coefficients of OCV-SOC polynomials fitting at different temperatures and orders are shown in Table 3. In the table, the coefficient values of the 3~7 order polynomial fitting curve are given for 45 °C, 25 °C, 0 °C, and −20 °C. Through this table, the polynomial coefficient parameter values can be obtained quickly according to the requirements of the project by using the battery estimation method based on OCV-SOC modeling.
The RMSE values of polynomial fitting with different orders and different temperatures are shown in Table 4. RMSE of polynomial fitting with different orders and different temperatures as shown in Figure 6. The lower the order is, the greater error is, and the higher temperature is, and the greater error is. The error from three-to-four-order and from four-to-five-order decreases very fast, the maximum is 42.1%, while the error from six to seven order decreases slowly, the minimum is 4.16%.
Figure 7a–d shows the error and percentage error comparison with the six order polynomial fitting curve and the measured value. As we can be seen from the figure, under the same conditions, when the operating temperature is 45 °C and the SOC is 10%, the OCV maximum absolute error is 58.28 mV and the percentage error is 1.7%. When the operating temperature is 25 °C and the SOC is 60%, the OCV maximum absolute error is 6.5 mV and the percentage error is 0.17%. When the operating temperature is 0 °C and the SOC is 45%, the OCV maximum absolute error is 5.35 mV and the percentage error is 0.14%. When the operating temperature is −20 °C and the SOC is 50%, the OCV maximum absolute error is 4.5 mV and the percentage error is 0.12%.

3.4. Sum of Sin Functions Model Result

The OCV-SOC measured points and sum of sin functions model fitting curves under different temperatures are shown in Figure 8. In sum of sin functions model fitting, high fidelity fitting will lead to distortion.
The coefficients of OCV-SOC sum of sin functions model at different temperatures are shown in Table 5. The values of coefficient parameter of OCV-SOC curve fitting by the sum of sin functions model (n = 3) can be obtained in this table.

3.5. Gaussian Model Result

The OCV-SOC measured points and Gaussian model fitting curves under different temperatures are shown in the Figure 9. In the Gaussian model fitting, four order fitting is selected. This method has achieved an ideal fitting result in the fitting process.
The coefficients of OCV-SOC Gaussian model at different temperatures are shown in Table 6. Through this table, the Gaussian model (n = 4) coefficient parameter values can be obtained quickly according to the requirements of the project by using the battery estimation method based on OCV-SOC modeling.
In these four fitting models, the choice of different order will have a significant impact on the fitting accuracy. In this paper, exponential model chooses two order, polynomial chooses six order, sum of sin functions model chooses three order, and Gaussian model chooses four order. The comparison of the exponential, polynomial, sum of sin functions model, and Gaussian model four types fitting model RMSE are shown in the Figure 10. From this graph we can see that the fitting effect of four order Gaussian model is better than other results. However, polynomial fitting is a commonly used method, which can get more accurate results by increasing the order of its fitting. In addition, it can be seen that the fitting accuracy of high temperature and low temperature is less than that of normal temperature.

4. Discussion

In previous studies, SOC estimation algorithm was carried out at room temperature. Most of the battery modeling used the mean OCV-SOC characteristic curve of charge-discharge as the unique curve, and fixed battery parameters were used. The disadvantage of this model is that the precision of the model is poor, and a large number of circuit-based battery model fail to predict battery performance at lower temperatures. In addition, temperature characteristic is an important factor that should be verified at any battery operating temperature. The open circuit voltage of lithium-ion battery has a nonlinear relationship with SOC. In practice, the battery OCV characteristic curve will be affected by many factors, such as SOC, ambient temperature, and so on. Since ambient temperature has a significant effect on the characteristics of lithium-ion batteries, researchers need to describe the effect of this effect on the OCV-SOC relationship in order to increase the accuracy of the model and SOC estimation.
The pulse tests of the battery at different temperatures are carried out in this paper and the temperature dependency of the OCV-SOC relationship is investigated and its influence on SOC estimation results are discussed. The SOC-OCV curve performance is very different under different temperature conditions. In this paper, the polynomial OCV model uses polynomial function to establish the relationship between OCV and SOC mapping. The principle of the model is clear and the modeling is simple. However, the model fits the OCV curve with the least square method, the local accuracy of the curve is not high. In the sixth order polynomial fitting, the absolute error value of OCV reaches 58.28 mV. But the accuracy of the model can be improved by increasing the order of polynomial fitting at the expense of computing speed. Generally speaking, the higher order of the model fitting, the better fitting effect, but it is not the higher order fitting the batter, not only will it increase the computational burden, but may also cause over-fitting. When the battery is at high or low temperature, the fitting of the OCV-SOC curve in the lower SOC section is relatively difficult, and the error increases. Accurate fitting of OCV-SOC curve in 0–20% SOC interval is a key and difficult point in battery state estimation, which has a great influence on the accuracy of estimation.
In addition to the effect of temperature, researchers also found that the hysteresis phenomenon cannot be ignored, which effects battery modeling and battery SOC estimation accuracy. Anup Barai et al. [38] believe that it is important that the ECM used by BMS should incorporate any cell hysteresis accurately. Letao Zhu et al. [13] believe that more and more attention being paid to the OCV hysteresis by researchers recently, some possible explanations of OCV hysteresis origin have been proposed. M. García-Plaza et al. [39] considered the hysteresis phenomenon and the model parameters dynamic response for SOC estimation. Due to the different chemical materials and electrochemical reaction mechanism, the charge-discharge process of the battery is not completely reversible, which is reflected in the OCV-SOC relationship of the battery, which is not completely a coincident with the charge and discharge process curves. Under the condition of frequent charging and discharging transformation, the accurate battery characteristics cannot be simulated. In addition, as regenerative braking is widely used in electric vehicles, frequent changes between charging and discharging are common during vehicle operation. Therefore, hysteresis should be considered in future battery modeling.

5. Conclusions

This paper focuses on the study of the OCV-SOC characteristics of high capacity batteries under the influence of different temperatures. The result shows the OCV-SOC characteristic curve is greatly influenced by the temperature change. The polynomial fitting of the model is clear and simple so that it is widely applied in engineering. In the battery modeling, exponential, polynomial, sum of sin functions model, and Gaussian model are compared. In these models, accurate fitting of OCV-SOC curves in low SOC interval is a key and difficult point in battery state estimation, which has a great influence on the accuracy of battery state estimation. Besides, it is meaningful to consider the temperature factor when modeling the battery, because the temperature of the battery has a great influence on the performance and life degeneration of the lithium-ion battery, and it will lead to incorrect estimation of the battery state, thus the battery management system cannot accurately control the battery and this process will also accelerate the battery life degeneration and bring potential safety risks. In future study, the OCV-SOC curve adjustment method needs to be consider as a parameter in order to get the model parameter that is robust versus temperature.

Author Contributions

R.Z. studied scientific and technical literature, designed the test experiment and carried on the test, and wrote the technical paper; Y.L., W.Z., H.W., W.W. and M.W. provided the necessary materials and equipment support; B.L., B.X. and L.C. gave paper guidance.

Funding

This work was sponsored by the China Postdoctoral Science Foundation (Grant No. 2017M622799), Shenzhen Economic, Trade and Information Commission “Innovation Chain + Industrial Chain” Project (2017), the National Natural Science Foundation of China (Grant No. 51877120), and The State Key Laboratory of Advanced Design and Manufacturing for Vehicle Body Open Fund (Grant No. 31715013).

Acknowledgments

The authors thank the anonymous reviewers for providing useful comments and suggestions that resulted in the improved quality of this paper. The authors would like to thank the National Natural Science Foundation of China, Shenzhen Economic, Trade and Information Commission, China Postdoctoral Science, The State Key Laboratory of Advanced Design and Manufacturing for Vehicle Body Open Fund, Qihay and Tan, for their technical and spirit support.

Conflicts of Interest

The authors declare no conflict of interest.

Nomenclature

AAmpere
AhAmpere-hour
BMSBattery management system
CCConstant current
CCCVConstant current-constant voltage
CVConstant voltage
ECMEquivalent circuit model
EVElectric vehicle
HPPCHybrid pulse power characterization
NMCNickel manganese cobalt
OCVOpen circuit voltage
RMSERoot mean square error
SOCState of charge
SOHState of health
VVolt
a i Coefficients
b i Coefficients
c i Coefficients
N Cycle times
tTime
S SOC value
T Temperature
V o c Open circuit voltage
minMinimum value
max Maximum value

References

  1. Xiong, R.; Yu, Q.; Wang, L.Y.; Lin, C. A novel method to obtain the open circuit voltage for the state of charge of lithium ion batteries in electric vehicles by using H infinity filter. Appl. Energy 2017, 207, 346–353. [Google Scholar] [CrossRef]
  2. Zhang, R.; Xia, B.; Li, B.; Lai, Y.; Zheng, W.; Wang, H.; Wang, W.; Wang, M. Study on the Characteristics of a High Capacity Nickel Manganese Cobalt Oxide (NMC) Lithium-Ion Battery—An Experimental Investigation. Energies 2018, 11, 2275. [Google Scholar] [CrossRef]
  3. Zou, C.; Manzie, C.; Nešić, D.; Kallapur, A.G. Multi-time-scale observer design for state-of-charge and state-of-health of a lithium-ion battery. J. Power Source 2016, 335, 121–130. [Google Scholar] [CrossRef]
  4. Ting, T.O.; Man, K.L.; Lim, E.G.; Leach, M. Tuning of Kalman filter parameters via genetic algorithm for state-of-charge estimation in battery management system. Sci. World J. 2014, 2014, 176052. [Google Scholar] [CrossRef] [PubMed]
  5. Yatsui, M.W.; Bai, H. Kalman filter based state-of-charge estimation for lithium-ion batteries in hybrid electric vehicles using pulse charging. In Proceedings of the 2011 IEEE Vehicle Power and Propulsion Conference, Chicago, IL, USA, 6–9 September 2011; pp. 1–5. [Google Scholar]
  6. He, H.; Xiong, R.; Guo, H. Online estimation of model parameters and state-of-charge of LiFePO4 batteries in electric vehicles. Appl. Energy 2012, 89, 413–420. [Google Scholar] [CrossRef]
  7. Nejad, S.; Gladwin, D.T.; Stone, D.A. A systematic review of lumped-parameter equivalent circuit models for real-time estimation of lithium-ion battery states. J. Power Source 2016, 316, 183–196. [Google Scholar] [CrossRef] [Green Version]
  8. He, H.; Xiong, R.; Fan, J. Evaluation of lithium-ion battery equivalent circuit models for state of charge estimation by an experimental approach. Energies 2011, 4, 582–598. [Google Scholar] [CrossRef]
  9. Lin, C. Comparison of current input equvialent circuit models of electrical vehicle battery. Chin. J. Mech. Eng. 2005, 41, 76–81. [Google Scholar] [CrossRef]
  10. Lavigne, L.; Sabatier, J.; Francisco, J.M.; Guillemard, F.; Noury, A. Lithium-ion open circuit voltage (OCV) curve modelling and its ageing adjustment. J. Power Source 2016, 324, 694–703. [Google Scholar] [CrossRef]
  11. Farmann, A.; Sauer, D.U. A study on the dependency of the open-circuit voltage on temperature and actual aging state of lithium-ion batteries. J. Power Source 2017, 347, 1–13. [Google Scholar] [CrossRef]
  12. Pattipati, B.; Balasingam, B.; Avvari, G.V.; Pattipati, K.R.; Bar-Shalom, Y. Open circuit voltage characterization of lithium-ion batteries. J. Power Source 2014, 269, 317–333. [Google Scholar] [CrossRef]
  13. Zhu, L.; Sun, Z.; Dai, H.; Wei, X. A novel modeling methodology of open circuit voltage hysteresis for LiFePO4 batteries based on an adaptive discrete Preisach model. Appl. Energy 2015, 155, 91–109. [Google Scholar] [CrossRef]
  14. Weng, C.; Sun, J.; Peng, H. A unified open-circuit-voltage model of lithium-ion batteries for state-of-charge estimation and state-of-health monitoring. J. Power Source 2014, 258, 228–237. [Google Scholar] [CrossRef]
  15. Roscher, M.A.; Assfalg, J.; Bohlen, O.S. Detection of Utilizable Capacity Deterioration in Battery Systems. IEEE Trans. Veh. Technol. 2011, 60, 98–103. [Google Scholar] [CrossRef]
  16. Chin, C.; Gao, Z. State-of-Charge Estimation of Battery Pack under Varying Ambient Temperature Using an Adaptive Sequential Extreme Learning Machine. Energies 2018, 11, 711. [Google Scholar] [CrossRef]
  17. Gao, Z.; Chin, C.; Woo, W.; Jia, J. Integrated equivalent circuit and thermal model for simulation of temperature-dependent LiFePO4 battery in actual embedded application. Energies 2017, 10, 85. [Google Scholar] [CrossRef]
  18. Madani, S.; Schaltz, E.; Kær, S.K. Review of parameter determination for thermal modeling of lithium ion batteries. Batteries 2018, 4, 20. [Google Scholar] [CrossRef]
  19. Snihir, I.; Rey, W.; Verbitskiy, E.; Belfadhel-Ayeb, A.; Notten, P.H.L. Battery open-circuit voltage estimation by a method of statistical analysis. J. Power Source 2006, 159, 1484–1487. [Google Scholar] [CrossRef] [Green Version]
  20. Zheng, F.; Xing, Y.; Jiang, J.; Sun, B.; Kim, J.; Pecht, M. Influence of different open circuit voltage tests on state of charge online estimation for lithium-ion batteries. Appl. Energy 2016, 183, 513–525. [Google Scholar] [CrossRef]
  21. Yang, F.; Xing, Y.; Wang, D.; Tsui, K.-L. A comparative study of three model-based algorithms for estimating state-of-charge of lithium-ion batteries under a new combined dynamic loading profile. Appl. Energy 2016, 164, 387–399. [Google Scholar] [CrossRef]
  22. Plett, G.L. Extended Kalman filtering for battery management systems of LiPB-based HEV battery packs: Part 2. Modeling and identification. J. Power Source 2004, 134, 262–276. [Google Scholar] [CrossRef]
  23. Panchal, S. Impact of Vehicle Charge and Discharge Cycles on the Thermal Characteristics of Lithium-Ion Batteries. 2014. Available online: http://hdl.handle.net/10012/8423 (accessed on 7 May 2014).
  24. He, H.; Zhang, X.; Xiong, R.; Xu, Y.; Guo, H. Online model-based estimation of state-of-charge and open-circuit voltage of lithium-ion batteries in electric vehicles. Energy 2012, 39, 310–318. [Google Scholar] [CrossRef]
  25. Xiong, R.; He, H.; Guo, H.; Ding, Y. Modeling for Lithium-Ion Battery used in Electric Vehicles. Procedia Eng. 2011, 15, 2869–2874. [Google Scholar] [CrossRef]
  26. García-Plaza, M.; Eloy-García, C.J.; Peña-Asensio, A.; Alonso-Martínez, J.; Arnaltes, G.S. Hysteresis effect influence on electrochemical battery modeling. Electr. Power Syst. Res. 2017, 152, 27–35. [Google Scholar] [CrossRef]
  27. Allafi, W.; Uddin, K.; Zhang, C.; Mazuir, R.A.S.R.; Marco, J. On-line scheme for parameter estimation of nonlinear lithium ion battery equivalent circuit models using the simplified refined instrumental variable method for a modified Wiener continuous-time model. Appl. Energy 2017, 204, 497–508. [Google Scholar] [CrossRef]
  28. Dang, X.; Yan, L.; Xu, K.; Wu, X.; Jiang, H.; Sun, H. Open-circuit voltage-based state of charge estimation of lithium-ion battery using dual neural network fusion battery model. Electrochim. Acta 2016, 188, 356–366. [Google Scholar] [CrossRef]
  29. Zheng, Y.; Ouyang, M.; Han, X.; Lu, L.; Li, J. Investigating the error sources of the online state of charge estimation methods for lithium-ion batteries in electric vehicles. J. Power Source 2018, 377, 161–188. [Google Scholar] [CrossRef]
  30. Lin, C.; Yu, Q.; Xiong, R.; Wang, L.Y. A study on the impact of open circuit voltage tests on state of charge estimation for lithium-ion batteries. Appl. Energy 2017, 205, 892–902. [Google Scholar] [CrossRef]
  31. Zhang, R.; Xia, B.; Li, B.; Cao, L.; Lai, Y.; Zheng, W.; Wang, H.; Wang, W. State of the Art of Lithium-Ion Battery SOC Estimation for Electrical Vehicles. Energies 2018, 11, 1820. [Google Scholar] [CrossRef]
  32. Panchal, S.; Mcgrory, J.; Kong, J.; Fraser, R.; Fowler, M.; Dincer, I.; Agelin-Chaab, M. Cycling degradation testing and analysis of a LiFePO4 battery at actual conditions. Int. J. Energy Res. 2017, 41. [Google Scholar] [CrossRef]
  33. Dong, G.; Wei, J.; Zhang, C.; Chen, Z. Online state of charge estimation and open circuit voltage hysteresis modeling of LiFePO4 battery using invariant imbedding method. Appl. Energy 2016, 162, 163–171. [Google Scholar] [CrossRef]
  34. Dang, X.; Yan, L.; Jiang, H.; Wu, X.; Sun, H. Open-circuit voltage-based state of charge estimation of lithium-ion power battery by combining controlled auto-regressive and moving average modeling with feedforward-feedback compensation method. Int. J. Electr. Power Energy Syst. 2017, 90, 27–36. [Google Scholar] [CrossRef]
  35. Xing, Y.; He, W.; Pecht, M.; Tsui, K.L. State of charge estimation of lithium-ion batteries using the open-circuit voltage at various ambient temperatures. Appl. Energy 2014, 113, 106–115. [Google Scholar] [CrossRef]
  36. Sun, B.; Jiang, J.; Zheng, F.; Zhao, W.; Liaw, B.Y.; Ruan, H.; Han, Z.; Zhang, W. Practical state of health estimation of power batteries based on Delphi method and grey relational grade analysis. J. Power Source 2015, 282, 146–157. [Google Scholar] [CrossRef]
  37. Chen, Z.; Fu, Y.; Mi, C.C. State of charge estimation of lithium-ion batteries in electric drive vehicles using extended kalman filtering. IEEE Trans. Veh. Technol. 2013, 62, 1020–1030. [Google Scholar] [CrossRef]
  38. Barai, A.; Widanage, W.D.; Marco, J.; McGordon, A.; Jennings, P. A study of the open circuit voltage characterization technique and hysteresis assessment of lithium-ion cells. J. Power Source 2015, 295, 99–107. [Google Scholar] [CrossRef] [Green Version]
  39. García-Plaza, M.; Serrano-Jiménez, D.; Eloy-García, C.J.; Alonso-Martínez, J. A Ni–Cd battery model considering state of charge and hysteresis effects. J. Power Source 2015, 275, 595–604. [Google Scholar] [CrossRef]
Figure 1. The schematic of the battery test bench.
Energies 11 02408 g001
Figure 2. The battery pulse test profile.
Energies 11 02408 g002
Figure 3. The battery OCV-SOC relationship at different temperatures.
Energies 11 02408 g003
Figure 4. OCV-SOC measured points and exponential model fitting curves for (a) 45 °C; (b) 25 °C; (c) 0 °C; and (d) −20 °C.
Energies 11 02408 g004
Figure 5. OCV-SOC measured points and different orders polynomial fitting curves for; (a) 45 °C; (b) 25 °C; (c) 0 °C; and (d) −20 °C temperatures.
Energies 11 02408 g005
Figure 6. RMSE of polynomial fitting with different orders and different temperatures.
Energies 11 02408 g006
Figure 7. OCV-SOC error by six order polynomial fitting. (a) 45 °C; (b) 25 °C; (c) 0 °C; (d) −20 °C.
Energies 11 02408 g007aEnergies 11 02408 g007b
Figure 8. OCV-SOC measured points and sum of sin functions model fitting curves for (a) 45 °C; (b) 25 °C; (c) 0 °C; (d) −20 °C temperatures.
Energies 11 02408 g008
Figure 9. OCV-SOC measured points and Gaussian model fitting curves for (a) 45 °C; (b) 25 °C; (c) 0 °C; (d) −20 °C temperatures.
Energies 11 02408 g009
Figure 10. Compare of the 4 types fitting model RMSE.
Energies 11 02408 g010
Table 1. The prismatic lithium-ion battery cell specifications.
ItemSpecification Parameter
Battery DimensionL/mm: 148.40 ± 0.30
W/mm: 39.70 ± 0.30
H/mm: 95.00 ± 0.30
Nominal Capacity76.5 Ah (1/3 C)
75.0 Ah (1 C)
Nominal Voltage3.70 V (1/3 C)
3.65 V (1 C)
Upper Charge Cut-Off Voltage4.25 V
Lower Discharge Cut-Off Voltage2.80 V (T > −10 °C)
2.50 V (−20 °C ≤ T ≤ −10 °C)
2.10 V (T ≤ −20°C)
Continuous Discharge Current75 A (25 °C)
Continuous Charging Current75 A (25 °C)
Charge Upper Limit Protection Voltage4.30 V
Charge Lower Limit Protection Voltage2.5 V (25 °C)
Working TemperatureDischarge temperature range: −30 °C~55 °C
Charge temperature range: −20 °C~55 °C
Table 2. The coefficient value of OCV-SOC exponential model (n = 2) fitting under different temperatures.
T (℃)a1b1a2b2c
45−0.3973−19.093.549−0.027690.7638
253.679−0.1101−0.2528−6.8290.9386
0−0.1199−20.733.588−0.017930.7077
−20−0.03131−3463.5870.023840.5579
Table 3. The coefficient value of OCV-SOC polynomials fitting with different orders and different temperatures.
T (°C)Na1a2a3a4a5a6a7a8
45n = 7125.83−462.14682.10−519.86220.03−51.546.663.16
n = 6−21.7475.69−104.8673.74−26.905.123.17
n = 510.48−31.3235.35−17.784.323.18
n = 4−5.1212.31−9.413.233.20
n = 32.06−2.931.873.26
25n = 7−33.19133.84−212.24165.57−63.6710.280.203.44
n = 617.69−52.3056.11−25.093.790.613.43
n = 50.76−3.726.15−3.641.263.42
n = 4−1.834.48−3.031.183.43
n = 30.82−0.720.693.45
0n = 7−6.6520.76−18.25−4.3915.29−7.691.683.47
n = 6−2.5113.79−26.3223.02−8.991.763.47
n = 56.27−17.8318.59−7.941.673.47
n = 4−2.174.82−2.941.023.49
n = 30.48−0.190.443.51
−20n = 78.77−39.1072.08−69.5236.41−9.141.163.56
n = 6−8.3929.80−40.5926.21−7.421.063.56
n = 54.63−12.2111.40−3.900.753.56
n = 4−0.631.22-0.200.273.57
n = 3−0.050.600.103.58
Table 4. RMSE values of polynomial fitting with different orders and different temperatures.
T (°C)n = 7n = 6n = 5n = 4n = 3
45 0.01370.01770.01940.02450.0377
25 0.00160.00340.00720.00730.0126
0 0.00230.00240.00260.00930.0153
−20 0.00170.00190.00360.00750.0083
Table 5. The coefficient value of OCV-SOC sum of sin functions model (n = 3) fitting under different temperatures.
T (°C)a1b1c1a2b2c2a3b3c3
458.3573.125−0.16147.55.7351.629142.95.7794.748
254.8481.5120.58417.7154.7561.996.6554.9285.038
026.762.483−0.0355723.372.7762.9330.45965.5954.312
−2010.52.6860.0648821.654.2712.37114.964.6155.327
Table 6. The coefficient value of OCV-SOC Gaussian model (n = 4) fitting under different temperatures.
T (°C)a1b1c1a2b2c2a3b3c3a4b4c4
455.0671.6350.74712.7440.59840.59982.0270.015930.41120.16330.050280.0529
255.1631.7941.6650.32960.64050.32741.590.064750.44065.184−0.5310.3059
04.3291.3050.80532.0430.39760.49871.762−0.010620.33610.472−0.10530.1652
−204.1841.3270.70562.2640.48360.51932.744−0.15240.4858−0.0039110.36110.05306

