Article

Evaluation of the Vertical Producing Degree of Commingled Production via Waterflooding for Multilayer Offshore Heavy Oil Reservoirs

1
College of Petroleum Engineering, China University of Petroleum, Beijing 102249, China
2
Research Institute of Petroleum Exploration and Development, Zhongyuan Oil Field, Sinopec, Zhengzhou 450046, China
3
Tianjin Branch of CNOOC Ltd., Tianjin 300452, China
*
Author to whom correspondence should be addressed.
Energies 2018, 11(9), 2428; https://doi.org/10.3390/en11092428
Submission received: 15 July 2018 / Revised: 28 August 2018 / Accepted: 10 September 2018 / Published: 13 September 2018

Abstract

:
Recently, commingling production has been widely used for the development of offshore heavy oil reservoirs with multilayers. However, the differences between layers in terms of reservoir physical properties, oil properties and pressure have always resulted in interlayer interference, which makes it more difficult to evaluate the producing degree of commingled production. Based on the Buckley–Leverett theory, this paper presents two theoretical models, a one-dimensional linear flow model and a planar radial flow model, for water-flooded multilayer reservoirs. Through the models, this paper establishes a dynamic method to evaluate seepage resistance, sweep efficiency and recovery percent and then conducts an analysis with field data. The result indicates the following: (1) the dynamic difference in seepage resistance is an important form of interlayer interference during the commingled production of an offshore multilayer reservoir; (2) the difference between commingled production and separated production is small within a certain range of permeability ratio or viscosity ratio, but separated production should be adopted when the ratio exceeds a certain value.

1. Introduction

As we know, waterflooding is the most widely and effectively used method in secondary recovery. For offshore conventional heavy oil reservoirs, with a viscosity of 50–200 mPa·s, waterflooding is still the best process available to produce crude oil. However, because of the variation in the depositional environment, the formational rocks may exhibit huge variations in their petrophysical properties, especially permeability. In order to increase the optimum oil production rates in offshore reservoirs, commingling techniques have been used in many oilfields. As the rock petrophysical properties and fluid parameters change in multilayers, earlier water breakthrough occurred in layers of higher permeability during commingling production, which may be called thief zones. Thus, the interlayer contradictions become prominent and the oilfield development is seriously affected. Many cases on the developmental laws of waterflooding performance via commingling production in multilayer reservoirs have been recorded in different oilfields in the U.S. [1,2,3], China [4,5,6,7,8,9,10,11], Canada [12,13] and Australia [14].
At present, there are few evaluative studies of the vertical producing degree of multilayer reservoirs from the perspective of reservoir engineering. In this case, the traditional frontal advance theory of Buckley–Leverett cannot be easily used for multilayers [15]. Stiles assumed the displacement velocity in a layer to be proportional to its absolute permeability, neglecting the effect of the mobility ratio [16]. Dykstra and Parsons developed a model (the D-P method) for non-communicating layers without crossflow between layers [17], whereas Hiatt presented a model for communicating layers with complete crossflow [18]. Based on the piston waterflooding theory, Osman and Dyes et al. studied the influence of the mobility ratio of vertical heterogeneous reservoirs on the development performance, but the deviation between the piston waterflooding theory and actual situations was large [19,20]. Johnson simplified the D-P method using graphic treatment to predict waterflooding recovery [21]. For multilayer disconnected reservoirs, Lefkovits [22] studied the dynamic changes in oil wells in multilayer disconnected reservoirs, mainly studying the influence of the different layer properties on the bottom hole pressure, and the influence of different pressure drops on the pressure buildup curve. Lefkovits and Kucuk [23] used analytical methods to study the pressure changes in a commingling system under the condition of no crossflow.
Bourdet [24] calculated the pressure curves and the pressure derivative of multilayer oil reservoirs with the skin effect and wellbore storage. Tompang et al. [25] analyzed the change in crossflow in multilayer reservoirs through mathematical derivation, and the crossflow index was mainly related to the effective length-to-height ratio and vertical-to-horizontal pressure gradient ratio. Tian et al. [26] studied the influence of strata pinch out and lens on vertical interlayer interference tests by establishing a three-layer model. Using the theory of B-L displacement mathematical model, Noaman et al. [27,28,29] analyzed the influence of gravity number, mobility ratio, permeability variation coefficient and liquidity on waterflooding performance in inclined multilayer reservoirs, and compared the finding with the D-P method. Guo [30] established the low permeability gas reservoir model for multilayer commingling production, considering the Darcy flow and the starting pressure gradient in both cases. The average pressure, bottom hole pressure and speed of the oil production rate of each layer were derived.
According to the theory of oil and water two-phase seepage, Li et al. concluded that the essence of the interlayer contradiction was the difference in the velocity of water displacing oil in each layer [31]. Through the establishment of a one-dimensional multilayer reservoir non-piston waterflood model, Zhou and An studied the influence of the multilayer reservoir heterogeneity on production indexes, such as the recovery percent, liquid producing rate and water cut [32,33]; however, the research was limited because the model could only calculate the development index of the water breakthrough time in each layer. With the establishment of a one-dimensional multilayer reservoir waterflood model, Zhang et al. studied the variation in the vertical sweep efficiency of water flooding in multilayer commingling production. This implicit method is not widely applicable because this model used a step length with the increase in the average water saturation of the layer after the water breakthrough in each layer [34].
Although many studies have been conducted on the production performance of multilayer heavy oil reservoirs with commingling production, some research was limited to the calculation of development parameters at the water breakthrough time, or some models were difficult to solve for widespread use because of the choice of an average water saturation increase rate as the step length. In order to simplify the calculation, this paper establishes a non-piston multilayer reservoir water flooding model with two-phase oil and water based on the Buckley–Leverett theory, which sets the time microelement, ∆t, as the step length to calculate the seepage resistance, liquid production rate and position of the water flooding front of each layer. Then, through a circular iterative solution, the production performance and vertical producing degree were obtained. In addition, this model is successfully validated using the previous model, showing that this calculation model is feasible and reliable. Later, through case analysis from the perspective of permeability and viscosity, the root cause of interlayer contradiction is highlighted, which also reflects the results of the synergistic effects of the reservoir properties and fluid parameters. Finally, comparing the ratio of liquid production in different water cut stages, the best time for adjustment measures to be undertaken is obtained. Overall, the calculated results of the model can be used to determine the separated production boundary, which also provides theoretical and technological support for the subdivision of multilayer offshore heavy oil reservoirs.

2. Multilayer Reservoir Commingling Production Waterflood Model

2.1. Multilayer Water Flooding Model under One-Dimensional Linear Seepage Flow

2.1.1. Assumptions

With the linear rowed well pattern, the seepage flow follows the linear flow method [35]; a schematic diagram of the water flooding model is shown in Figure 1. The following assumptions are made:
  • The left boundary is the supply boundary with constant injection, and the right boundary is the production ends, which creates a balance between injection and production.
  • The media is rigid and porous, and the fluid is incompressible.
  • There are stable interlayers between layers, regardless of inter-layer cross flow.
  • Non-piston water displacement oil is present, and there are two phases of oil and water.

2.1.2. Modeling

Suppose that the water breaks through vertically from the first layer to the N layer in turn, where M is the number of water-breakthrough layers (0 ≤ MN), and the physical properties of the reservoir and fluid parameters of each layer are different. Based on the Buckley–Leverett theory [35], for planar radial flow, the isosaturation level movement equation of the waterflood front of layer i (M < iN) can be expressed as
x f i = f w ( s w f i ) ϕ i w h i 0 t Q i d t  
Correspondingly, the liquid production rate in layer i can be expressed as
Q i = k i w h i Δ P 0 x f i 1 k r o μ o + k r w μ w d x + μ o i ( L x f i )  
The seepage resistance of layer i is
R i = [ 0 x f i 1 k r o μ o i + k r w μ w d x + μ o i ( L x f i ) ] / ( k i w h i )  
In particular, when the water breakthrough happens in the layer i, the liquid production rate becomes
Q i = k i w h i Δ P 0 L 1 k r o μ o + k r w μ w d x  
The total fluid production rate of the multilayer commingling production is
Q i = i = 1 M k i w h i Δ P 0 L 1 k r o μ o i + k r w μ w d r + j = M + 1 N k i w h i Δ P 0 x f i 1 k r o μ o i + k r w μ w d x + μ o i ( L x f i )  
The sweep efficiency of the multilayer commingling production is as follows:
E v = i = 1 M w h i ϕ i L + j = M + 1 N w h i ϕ i x f i i = 1 N w h i ϕ i L  
The reservoir recovery percent of the multilayer commingling production is as follows:
η = i = 1 M w h i L ϕ i ( s ¯ w i s w c i ) + j = M + 1 N o t Q i d t i = 1 N w h i L ϕ i ( 1 s w c i )  
where the following formula can be used to solve s ¯ w :
s ¯ w = 0 L s w d x L = i = 1 N s w Δ x L  
In order to facilitate derivation calculation, the relative permeability needs to be processed as the Corey type.

2.2. Multilayer Water Flooding Model under Planar Radial Flow

2.2.1. Assumptions

For the common inverted nine-spot area well pattern, the seepage flow follows the planar radial flow method [35], and the schematic diagram of the water flooding model is shown in Figure 2. The following assumptions are made:
  • The boundary is the supply boundary with constant injection and creates a balance between injection and production.
  • The media is rigid and porous, and the fluid is incompressible.
  • There are stable interlayers between layers, regardless of inter-layer cross flow.
  • Non-piston water displacement oil is present, and there are two phases of oil and water.

2.2.2. Modeling

Suppose that the water breaks through vertically from the first layer to the N layer in turn, where M is the number of water-breakthrough layers (0 ≤ MN), and the physical properties of the reservoir and fluid parameters of each layer are different. Based on the Buckley–Leverett theory [34], for planar radial flow, the isosaturation level movement equation of the waterflood front of layer i (M < iN) can be expressed as
d r d t = Q i ϕ i 2 π r h i f w ( s w f i )  
Integral to get
R o r 2 π ϕ i h i r d r = f w ( s w f i ) 0 t Q i d t  
R o 2 r f i 2 = f w ( s w f i ) π ϕ i h i 0 t Q i d t  
Correspondingly, the liquid production rate in layer i can be expressed as
Q i = 2 π k i h i Δ P r f R o 1 ( k r o μ o + k r w μ w ) r d r + μ o i ln ( r f i r w )  
The seepage resistance of layer i is
R i = [ r f i R o 1 ( k r o μ o i + k r w μ w ) r d r + μ o i ln r f i r w ] / ( 2 π k i h i )  
The total fluid production rate of the multilayer commingling production is
Q i = i = 1 M 2 π k i h i Δ P r f i R o 1 ( k r o μ o i + k r w μ w ) r d r + j = M + 1 N 2 π k i h i Δ P r f R o 1 ( k r o μ o i + k r w μ w ) r d r + μ o i ln ( r f i r w )  
The sweep efficiency of the multilayer commingling production is as follows:
E v = i = 1 M π R o 2 h i ϕ i + j = M + 1 N π ( R o 2 r f i 2 ) h i ϕ i i = 1 N π R o 2 h i ϕ i  
The reservoir recovery percent of the multilayer commingling production is as follows:
η = i = 1 M π R o 2 h i ϕ i ( s ¯ w i s w c i ) + j = M + 1 N o t Q i d t i = 1 N π R o 2 h i ϕ i ( 1 s w c i )  
Of these, the pressure drop of near borehole zones under planar radial flow is very large [35], so the seepage resistance changes greatly. When calculating the seepage resistance it is necessary to convert the radial coordinate r of unequal distance to the x-coordinate of equal distance [36]; thus, Δ x = ln ( R o r f ) / n , and r = r f e i Δ x = r f e x .
Equation (3) can be converted to the following summation formula:
R = ( i = 1 n Δ x k r o μ o + k r w μ w + μ o ln r f r w ) / ( 2 π k h )  
The method for solving the average water saturation after water breakthrough in the layers is as follows:
s ¯ w = 0 V p s w d v π h ϕ ( R o 2 r w 2 ) = π h ϕ r w R o 2 r s w d r π h ϕ ( R o 2 r w 2 ) = i = 0 n f w ( s w ) s w Δ s w π h ϕ ( R o 2 r w 2 ) 0 t Q d t  
where V p is the total pore volume of the reservoir, m3, and
Δ s w = ( 1 s o r s w e ) / n  
For the convenience of the derivation calculation, the relative permeability curve should be copied with a Corey type relative permeability curve [37].

3. Model Solving

The mathematical model established on the basis of the reservoir engineering method, using the time microelement ∆t as a step length, could be solved to obtain the parameters such as seepage resistance, recovery degree and sweep efficiency at different times through iterative calculation. In the previous mathematical model, the increase of average water saturation was used as the step length, and the solution method was much too complex. However, in this derivation the time step length is used, which was relatively easier to solve than before, and it was convenient to calculate the injection pore volume and water cut. The iteration steps are described as follows: First, the seepage resistance of each layer at the initial time t0 was calculated, and the liquid production rate and position of the water flooding front of each layer were obtained. Second, the seepage resistance was calculated by integrating the position of the water flooding front, and the liquid production rate at t1 was obtained by the seepage resistance of each layer. Third, this liquid production rate was added to that in the last time step. Thus, the cumulative amount of liquid production was obtained. Then, the position of the later water flooding front was obtained again. This process was iteratively repeated until the first layer water broke through.
The solution flow diagram is as in Figure 3:

4. Model Validation

To demonstrate the accuracy of the model for multilayer water flooding, combined with detailed reservoir data from the model in Zhang [34], the model was calculated and the calculation results were compared with the calculation results from the reference. The results are shown in Figure 4. It can be seen that the daily oil production (Model X) of different permeability layers coincided with the data provided by Zhang’s model, and the results of the two calculations were basically consistent. The figure also showed that the model results presented in this paper are reliable.
Due to differences in the physical properties, it can be seen from the calculation results that the production rate curve at the output end presented characteristics with more obvious periodic changes, which reflected the interlayer interference between the layers before and after the water breakthrough.

5. Model Application and Discussion

According to the specific data of reservoir Q in the Bohai oilfield, an example is provided to establish a multilayer water-flooding model with planar radial flow, and the calculation and analysis of the waterflooding performance in the multilayer reservoir are conducted. This model only considers the difference of the horizontal permeability in layers, and the other physical parameters are the same. The parameters are shown in Table 1.
This model is suitable for the calculation of constant liquid production and a balance state of injection and production. It is used for the black oil model calculation, and the layers are composed of rigid and porous rock, which is not suitable for condensate oil or gas reservoirs. To simplify the solving, there is no fluid flowing from one layer to another except the wells. The water flooding feature in the media is non-piston-like displacement, and there are two-phase regions for oil and water together.
When the multilayer heavy oil reservoir produced with general water injection and commingling production, the difference in the seepage resistance of each layer constantly changes, as shown in Figure 5. The difference in the seepage resistance between layers is an important cause of interlayer interference. For the multilayer water flooding model with planar radial flow, the seepage resistance in the near borehole zones was relatively large, thus the seepage resistance of each layer rapidly decreases before the water breakthrough but slowly decreases after the water breakthrough.
As shown in Figure 6, the total recovery degree of the reservoir rises like stairs with the increase of the injection pore volume, and the rising speed slows down when the water breaks through in each oil layer. The recovery degree of each layer rises quite fast before the water breakthrough, while the rising speed slows down after the water breakthrough. The difference between layers is mainly reflected in the performance of the low permeability layer, which is shown in Figure 6b. The solid line represents the commingling production, while the dotted line represents the separated production. Commingling production has a great influence on the recovery degree of the low permeability layer. Especially in the stage of the first pore volume (PV), in which there is no water produced in the low permeability layer, the gap between the separated and the commingling production is the largest. At this time, the water had broken through in the high permeability layer, which is reflected in the curves and belongs to the stage of rapid water rise. Therefore, at this time, if separated production measures are taken, the low permeability layer will be better used.
As shown in Figure 7, from the perspective of fluid production, the differences between layers is reflected in the following aspects: (a) when the reservoir exhibits commingling production, the difference of interlayer use caused by the permeability ratio first rises and then decreases with the increase of the water injection pore volume and water cut; (b) the liquid production difference between layers is always greater than the initial one; and (c) the largest difference between layers caused by permeability occurs in the production middle and later stages, thus the middle and later stages of development are the best time for measure adjustment.
With the changing model parameters in Table 1, commingling production and separated production can be compared in terms of the recovery degree calculated for the different permeability ratio or different viscosity ratio models. The parameters are showed in Table 2.
Another example is provided to compare the previous model that was affected by the permeability ratios. Thus this model only considers the difference in the viscosity, and the other physical parameters remain unchanged. In order to compare the effect of the permeability ratio and viscosity ratio, the permeability and viscosity in the middle layer were set as the standard model, and the viscosity was changed in the first and third layers.
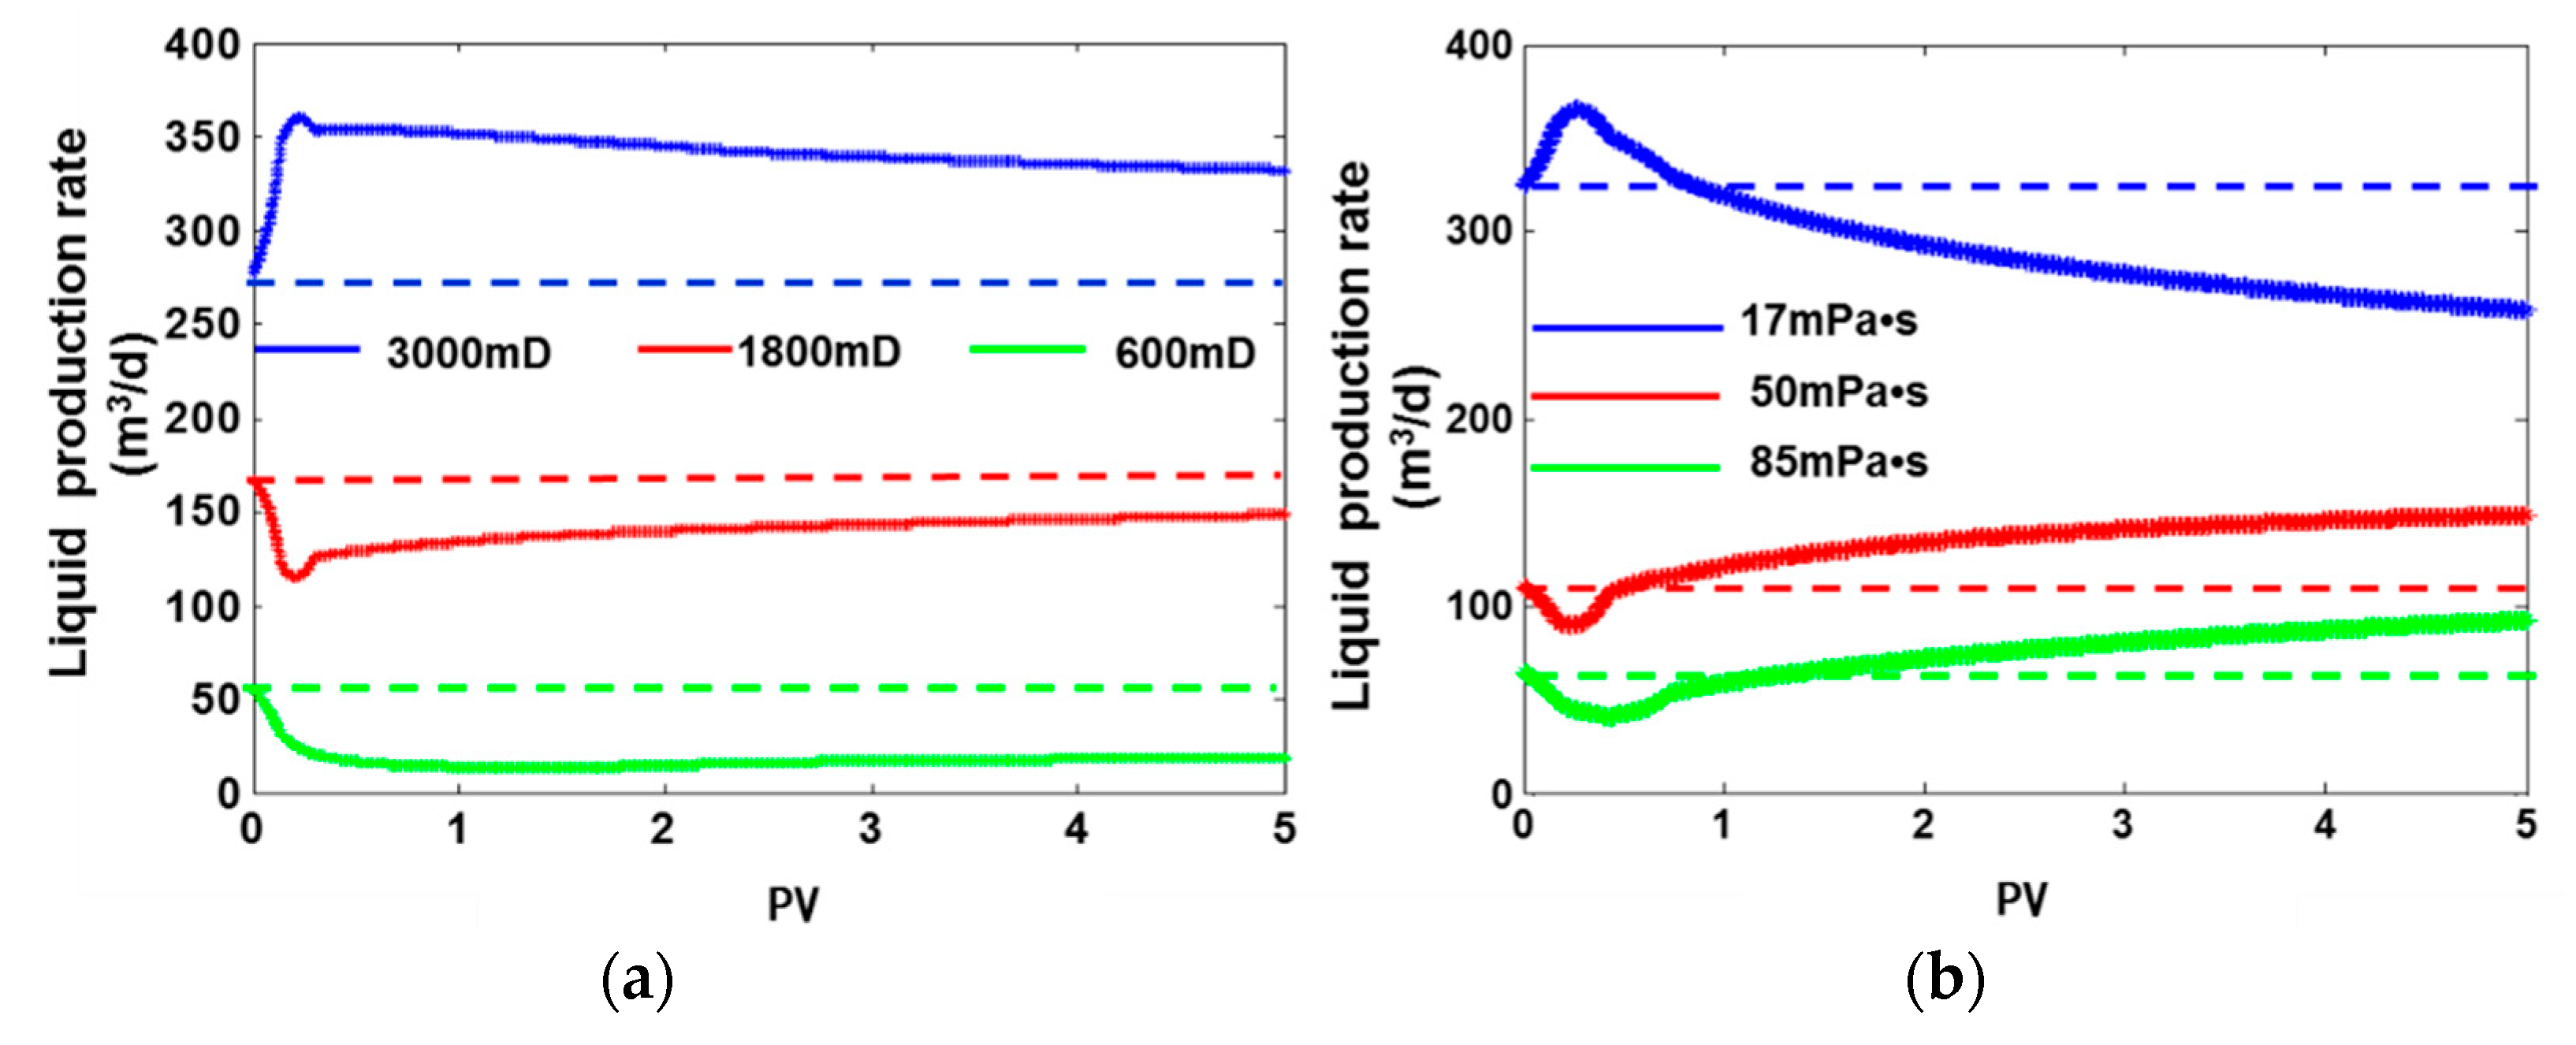
As shown in Figure 8, taking the daily liquid production rate as an example, the comingling production dynamic differences between layers were considerably different from the permeability-to-viscosity ratios. Compared to the viscosity ratios, the interlayer interference caused by the permeability ratios was more serious, and the interference lasted much longer. The fundamental reason for this is that the interference caused by permeability comes from the physical properties of the layers, whereas the interference caused by fluid viscosity changes with changes in the water cut. Thus, when measure adjustment is implemented, the interference caused by these two reasons requires different coping mechanisms.
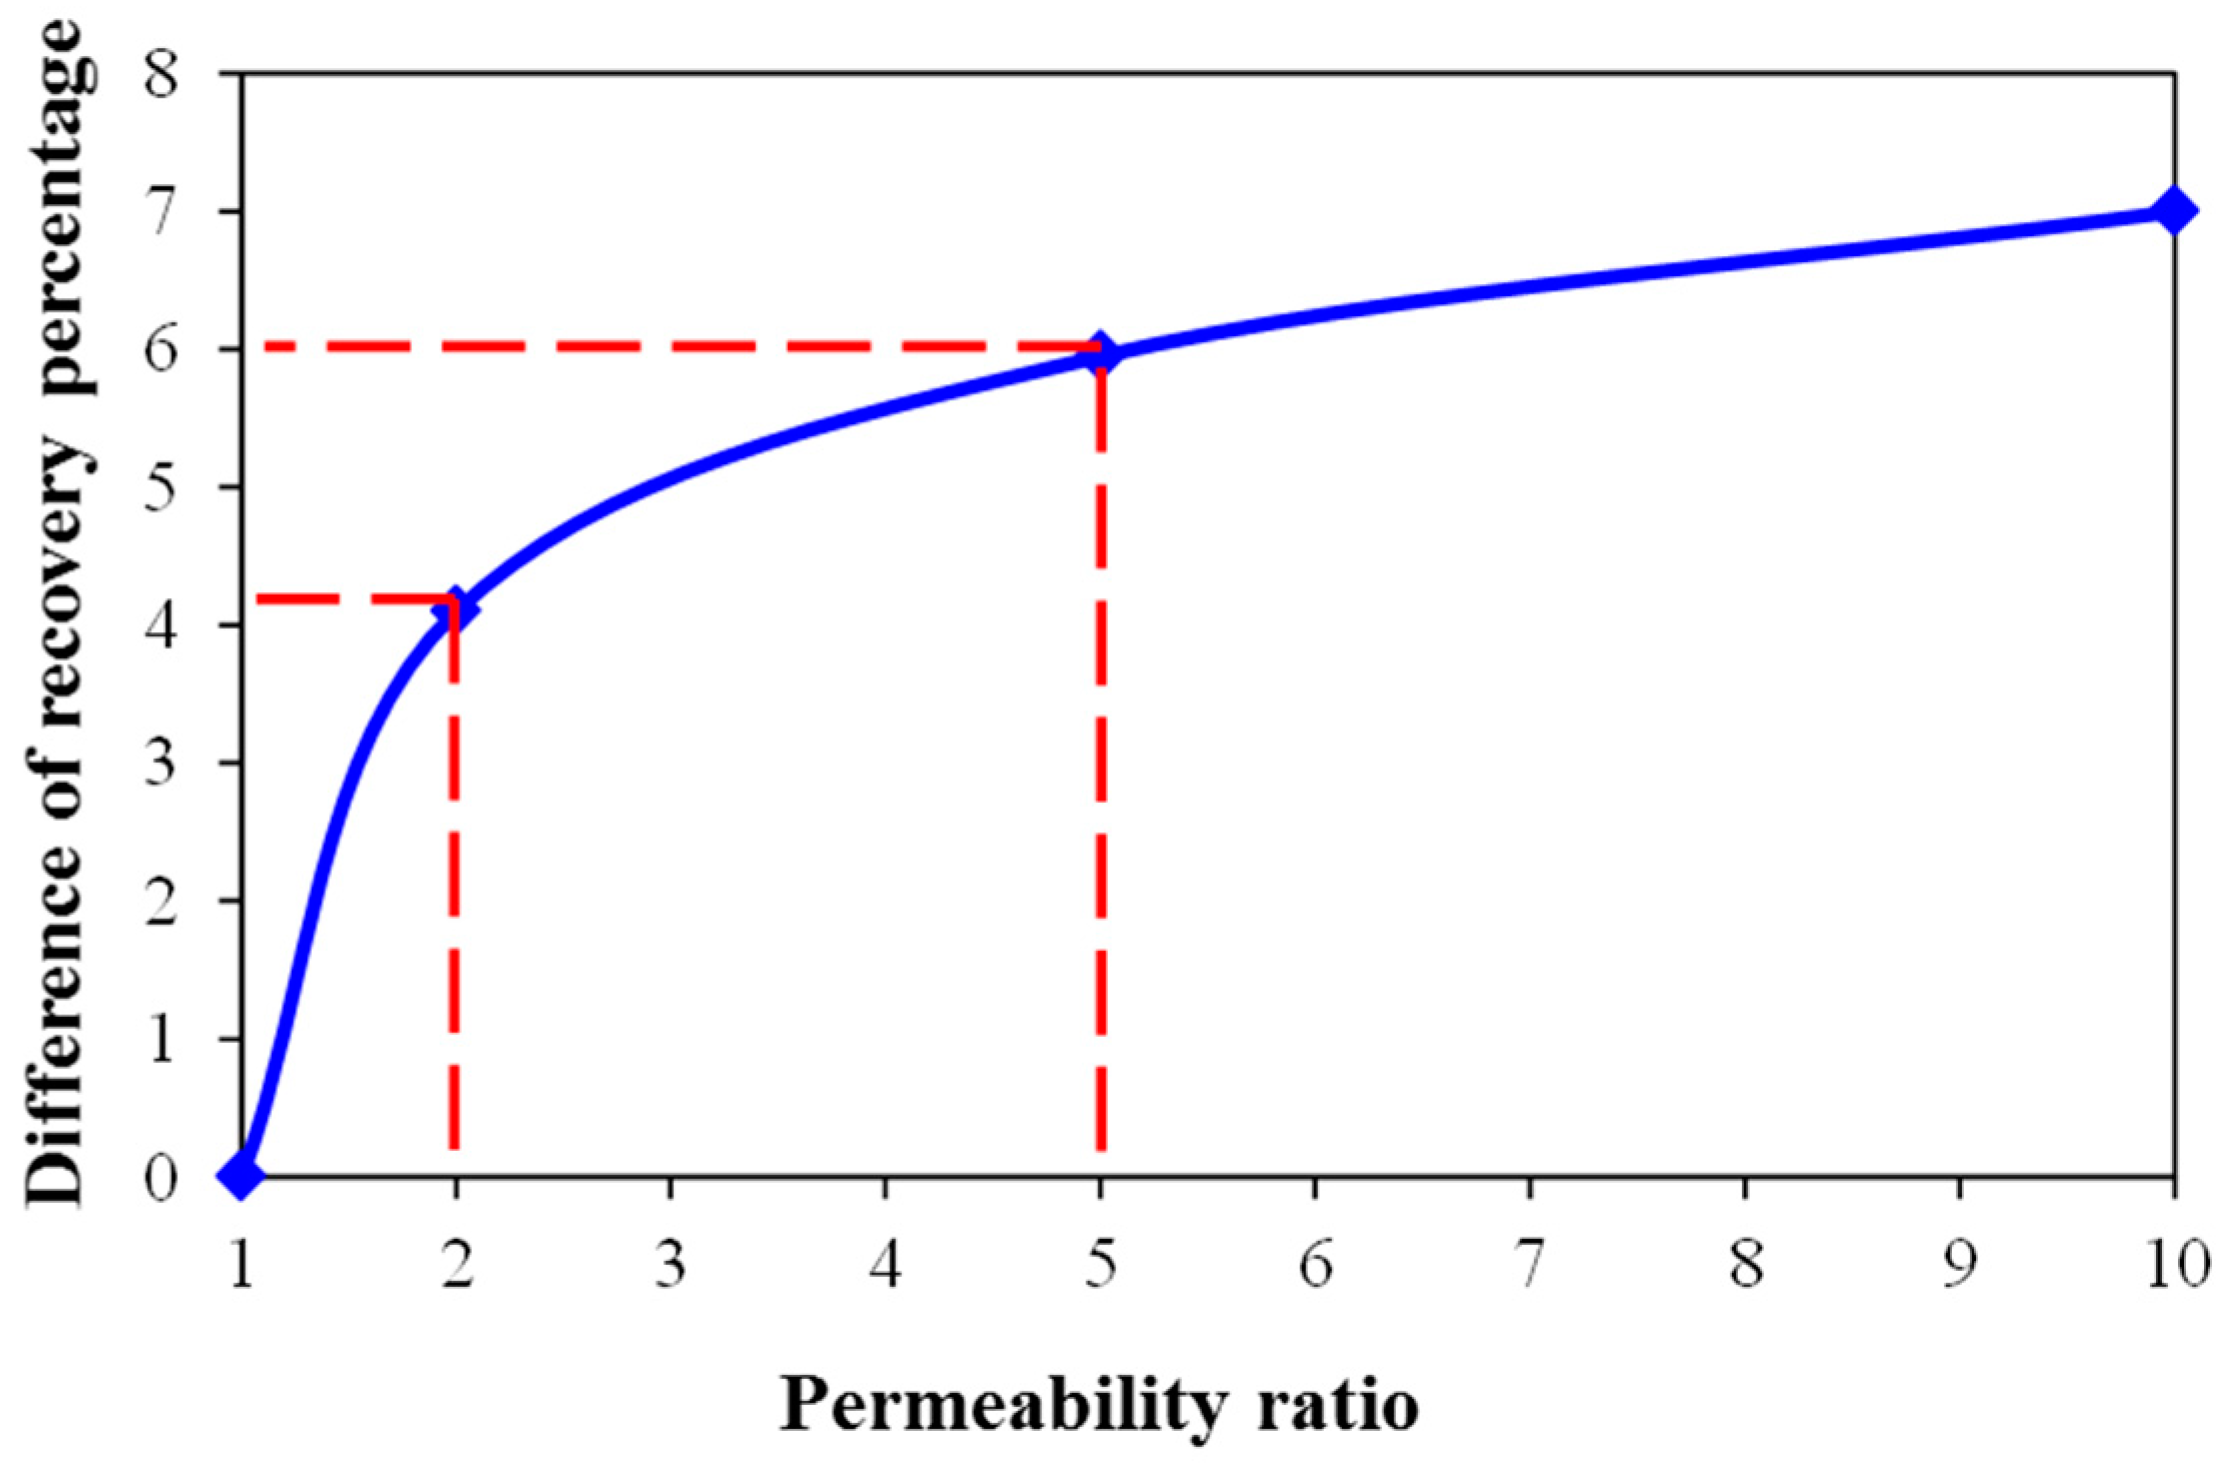
Taking the permeability ratio as an example, the variation graph of the difference in the value of the recovery degree between the separated production and the commingling production with the permeability ratio rising was obtained using the model calculation. As shown in Figure 9, we found that there was little difference between the separated production and the commingling production when the permeability ratio was less than three. However, when the permeability ratio was greater than three, the total recovery of the commingling production significantly worsened, thus separated production should be adopted. The larger the permeability ratio, the better the effect obtained by separated production. In terms of an increase in the recovery degree rate by 5% after the implementation of separated production measures, the limiting line should be approximately three.
For the multilayer oil reservoir with waterflooding development, the root cause of the interlayer interference is the difference between the reservoir properties and fluid parameters. The internal causes of the performance change in the interlayer interference are the viscosity differences between oil and water, displacement performance, the distance to the waterflood front, and the seepage resistance change affected by the oil–water transition zone. For heavy oil reservoirs, the most rapid increase in the water cut was approximately 20–80%, and the total water cut with commingling production was most affected by the high permeability layer. Therefore, suppressing the water production rate in the high permeability layer can further improve the interference between layers and improve the development effect.
In the water injection well group in the Dongying Formation multilayer reservoir of oilfield A in Bohai Bay, which has an inverted nine-spot area well pattern, the average permeability ratio of the multilayer was approximately 4.39. A field test of the subdivision of the layer series was carried out in August 2013, which means that commingling production turned into separated production. After nine months, as shown in Figure 10, the average daily liquid production rate of the single well in the well group was reduced by 17%, the average daily oil production rate of the single well was rated at 22%, and the average water cut was reduced by 9%. The production situation obviously improved.

6. Conclusions

Four conclusions can be drawn from this study. Firstly, based on the Buckley–Leverett theory, two theoretical models from the one-dimensional linear flow and planar radial flow aspects were established in this paper for waterflood multilayer reservoirs. With model validation, the models were showed to be reliable and accurate.
Secondly, the models can be used to solve and analyze the liquid or oil production rate, the liquid or oil production index and the seepage resistance, sweep efficiency and recovery percentages in each layer under different development stages. The conditions of separated and commingling production were obtained.
Thirdly, with the help of the model, the performance of water flooding with different fluid parameters and reservoir properties was also studied. During commingling production, the interlayer interference caused by permeability and viscosity were quite different. They interacted with each other, leading to dynamic differences in seepage resistance and then resulting in interlayer contradictions.
Lastly, for conventional heavy oil reservoirs, when the water cut was approximately between 40% and 80%, separated production measures were carried out. At this point, the water cut increased the most. Suppressing the water production rate in the high permeability layer can further improve the interference between layers and improve the development effect.

Author Contributions

The research study was carried out successfully with contribution from all authors. F.S. contributed the main research idea and established the numerical model; Q.S. and F.S. wrote the original manuscript, performed the correlative simulation and studied the applicability of the simulation method; Q.S. implemented the model validation and data correction; L.C. and S.H. gave several suggestions from the on-site production perspectives. All authors revised and approved the publication of the paper.

Funding

This research was funded by [National Science and Technology Major Projects of China] grant number [2011ZX05024-002-006].

Acknowledgments

The technical support from the CNOOC Research Institute, CNOOC are gratefully acknowledged.

Conflicts of Interest

The authors declare no conflict of interest.

Nomenclature

r f i position of waterflood front in layer i, m;
R o initial oil edge radius, m;
h i thickness of layer i, m;
ϕ i porosity of layer i, dimensionless;
s w f i water saturation of the waterflood front of layer i, dimensionless;
f w ( s w f i ) the derivative of the fractional flow corresponding to the water saturation of the waterflood front in layer i, dimensionless;
Q i liquid production rate in layer i, m3/d;
Q l total liquid production rate, m3/d;
K i the permeability of layer i, 10−3µm2;
K r o relative permeability of oil, fraction;
K r w relative permeability of water, fraction;
r w wellbore radius, m;
Δ P displacement pressure in layer i, MPa;
μ o i oil viscosity in layer i, mPa·s;
V p total pore volume of the reservoir, m3;
R i resistance of layer i, mPa·s/(d·m);
η reservoir recovery percent of the multilayer commingling production, dimensionless;
E v sweep efficiency of the multilayer commingling production, dimensionless;
s ¯ w average water saturation in two-phase region, fraction;
s w c irreducible water saturation, fraction;
Mnumber of water-breakthrough layers, dimensionless;
Ntotal number of model layers, dimensionless;
i, jserial number of layers.

References

  1. Warner, G.E. Waterflooding a Highly Stratified Reservoir. J. Pet. Technol. 1968, 10, 1179–1186. [Google Scholar] [CrossRef]
  2. Hatzignatiou, D.G.; Ogbe, D.O.; Dehghani, K.; Economides, M.J. Interference Pressure Behavior in Multilayered Composite Reservoirs. In Proceedings of the SPE Annual Technical Conference and Exhibition, Dallas, TX, USA, 27–30 September 1987; pp. 245–260. [Google Scholar]
  3. Pan, Y.; Kamal, M.; Kikani, J. Field Applications of a Semianalytical Model of Multilateral Wells in Multilayer Reservoirs. SPE Reserv. Eval. Eng. 2010, 13, 861–872. [Google Scholar]
  4. Tang, Z.X.; Liu, H.; Jiang, C.Z. Technical Measures for Improving Oilfield Development by Waterflooding in a Large Multi-Layered Heterogeneous Sandstone Reservoir. In Proceedings of the International Meeting on Petroleum Engineering, Beijing, China, 17–25 March 1986; pp. 287–298. [Google Scholar]
  5. Hong, L.; Jin, P.; Xiaolu, W.; Xinan, Y.; Qing, L. Analysis of Interlayer Interference and Research of Development Strategy of Multilayer Commingled Production Gas Reservoir. Energy Procedia 2012, 16, 1341–1347. [Google Scholar] [CrossRef]
  6. Du, Q.L.; Zhao, Y.; Lu, Y.; Zhu, L. Study on Genetic Type and Potential Tapping Measures of the Remaining Oil in Multi-layered and Heterogeneous Sandstone Reservoir. J. Dermatol. Surg. Oncol. 1999, 17, 865–868. [Google Scholar]
  7. Huang, S.J.; Kang, B.T.; Cheng, L.S.; Zhou, W.S.; Chang, S.P. Quantitative Characterization of Interlayer Interference and Productivity Prediction of Directional Wells in the Multilayer Commingled Production of Ordinary Offshore Heavy Oil Reservoirs. Pet. Explor. Dev. 2015, 42, 533–540. [Google Scholar] [CrossRef]
  8. Su, Y.C. A Set of Techniques to Describe Quantitatively Remaining Oil in Offshore Heavy Oilfields under Commingling Production in Large Well Spacing. China Offshore Oil Gas 2012, 24, 82–85. [Google Scholar]
  9. Wang, F.Y.; Liu, Z.C.; Jiao, L.; Wang, C.L.; Guo, H. A Fractal Permeability Model Coupling Boundary-layer Effect for Tight Oil Reservoirs. Fract. Complex Geom. Patterns Scaling Nat. Soc. 2017, 25, 1750042. [Google Scholar] [CrossRef]
  10. Li, C.X.; Shen, Y.H.; Ge, H.K.; Su, S.; Yang, Z. Analysis of Spontaneous Imbibition in Fractal Tree-like Network System. Fract. Complex Geom. Patterns Scaling Nat. Soc. 2016, 24, 1650035. [Google Scholar] [CrossRef]
  11. Qiu, L.; Yang, S.; Qu, C.; Xu, N.; Gao, Q.; Zhang, X.; Liu, X.; Wang, D. A Comprehensive Porosity Prediction Model for the Upper Paleozoic Tight Sandstone Reservoir in the Daniudi Gas Field, Ordos Basin. J. Earth Sci. 2017, 28, 1086–1096. [Google Scholar] [CrossRef]
  12. Brice, B.W.; Renouf, G. Increasing Oil Recovery from Heavy Oil Waterfloods. In Proceedings of the SPE International Thermal Operations and Heavy Oil Symposium, Calgary, AB, Canada, 20–23 October 2008; pp. 1–13. [Google Scholar]
  13. Miller, K.A. Improving the State of the Art of Western Canadian Heavy Oil Waterflood Technology. J. Can. Pet. Technol. 2006, 45, 7–11. [Google Scholar] [CrossRef]
  14. Pari, M.N.; Kabir, A. Viability Study of Implementing Smart/Intelligent Completion in Commingled Wells in an Australian Offshore Oil Field. Soc. Pet. Eng. 2009, 49, 441. [Google Scholar]
  15. Buckley, S.E.; Leverett, M.C. Mechanism of Fluid Displacement in Sands. Trans. AIME 1942, 146, 107–116. [Google Scholar] [CrossRef]
  16. Stiles, W.E. Use of Permeability Distribution in Water-flood Calculations. Trans. AIME 1949, 186, 9–13. [Google Scholar] [CrossRef]
  17. Dykstra, H.; Parsons, R.L. The Prediction of Oil Recovery by Waterflooding in Secondary Recovery of Oil in the United States, 2nd ed.; API: Washington, DC, USA, 1950; pp. 160–174. [Google Scholar]
  18. Hiatt, N.W. Injected–fluid Coverage of Multi–well Reservoirs with Permeability Stratification. Drill Prod. Prac. 1958, 165, 165–194. [Google Scholar]
  19. Dyes, A.B.; Caudle, B.H. Oil Production after Breakthrough as Influenced by Mobility Ratio. AIME 1954, 201, 81–86. [Google Scholar] [CrossRef]
  20. Osman, M.E.; Tiab, D. Waterflooding Performance and Pressure Analysis of Heterogeneous Reservoirs. In Proceedings of the Middle East Technical Conference and Exhibition, Manama, Bahrain, 9–12 March 1981; pp. 773–779. [Google Scholar]
  21. Johnson, C.E. Prediction of Oil Recovery by Waterflood—A Simplified Graphical Treatment of the Dykstra-Parsons Method. J. Pet. Technol. 2013, 8, 55–56. [Google Scholar] [CrossRef]
  22. Lefkovits, H.C.; Hazebroek, P.; Allen, E.; Matthews, C.S. A Study of the Behavior of Bounded Reservoirs Composed of Stratified Layers. Soc. Pet. Eng. J. 1961, 1, 43–58. [Google Scholar] [CrossRef]
  23. Kucuk, F.; Ayestaran, L. Well Testing and Analysis Techniques for Layered Reservoirs. SPE Form. Eval. 1984, 8, 342–354. [Google Scholar] [CrossRef]
  24. Bourdet, D. Pressure Behavior of Layered Reservoirs with Crossflow. In Proceedings of the SPE California Regional Meeting, Bakersfield, CA, USA, 27–29 March 1985; pp. 405–412. [Google Scholar]
  25. Tompang, R.; Kelkar, B.G. Prediction of Waterflood Performance in Stratified Reservoirs. Chest 1988, 92, 657–662. [Google Scholar]
  26. Tang, X.; Liu, S. A New Vertical Interference Test Method in a Three Layer Reservoir with an Unstable Impermeable Interlayer. In Proceedings of the SPE Annual Technical Conference and Exhibition, Denver, CO, USA, 6–9 October 1996; pp. 725–736. [Google Scholar]
  27. El-Khatib, N.A.F. The Application of Buckley-Leverett Displacement to Waterflooding in Non-Communicating Stratified Reservoirs. In Proceedings of the SPE Middle East Oil Show, Manama, Bahrain, 17–20 March 2001; pp. 1–12. [Google Scholar]
  28. El-Khatib, N.A.F. Waterflooding Performance in Inclined Communicating Stratified Reservoirs. SPE J. 2012, 17, 31–42. [Google Scholar] [CrossRef]
  29. El-Khatib, N.A.F. The Modification of the Dykstra-Parsons Method for Inclined Stratified Reservoirs. SPE J. 2012, 17, 1029–1040. [Google Scholar] [CrossRef]
  30. Guo, P.; Wang, J.; Liu, Q.; Zhang, M. Study on Development Mechanism of Commingling Production in Low-Permeability Gas Reservoirs. In Proceedings of the International Oil and Gas Conference and Exhibition in China, Beijing, China, 8–10 June 2010; pp. 1–20. [Google Scholar]
  31. Li, L.R.; Yuan, S.Y.; Hu, Y.L. Quantitative Rules for the Subdivision and Recombination of Layer Series in Water-displacement Reservoirs, The Innovation and Practice of Seepage Mechanics and Engineering. In Proceedings of the 11th National Conference on Seepage Mechanics, Chongqing, China, 28–30 April 2011; pp. 216–222. [Google Scholar]
  32. Zhou, Y.F.; Fang, Y.J.; Wang, X.D. Study on non-piston water displacement efficiency for layered reservoir. J. Pet. Geol. Recov. Effic. 2009, 16, 86–89. [Google Scholar]
  33. An, W.Y. Interference Mechanism of Multilayer Heterogeneous Reservoir in High Water cut Stage. J. North East Pet. Univ. 2012, 36, 72–75. [Google Scholar]
  34. Zhang, S.K.; Liu, B.G.; Zhong, S.Y. Theoretical Model for Waterflooding Development of Multi-Zone Reservoir. J. Xinjiang Pet. Geol. 2009, 30, 734–737. [Google Scholar]
  35. Zhang, J.G.; Lei, G.L.; Zhang, Y.Y. Seepage Mechanics; China University of Petroleum Press: Beijing, China, 1998; pp. 148–160. [Google Scholar]
  36. Li, S.X.; Gu, J.W. Foundation of Reservoir Numerical Simulation; China University of Petroleum Press: Beijing, China, 2009; pp. 147–148. [Google Scholar]
  37. Corey, A.T. The Interrelation between Gas and Oil Relative Permeabilities. Prod. Mon. 1954, 19, 38–41. [Google Scholar]
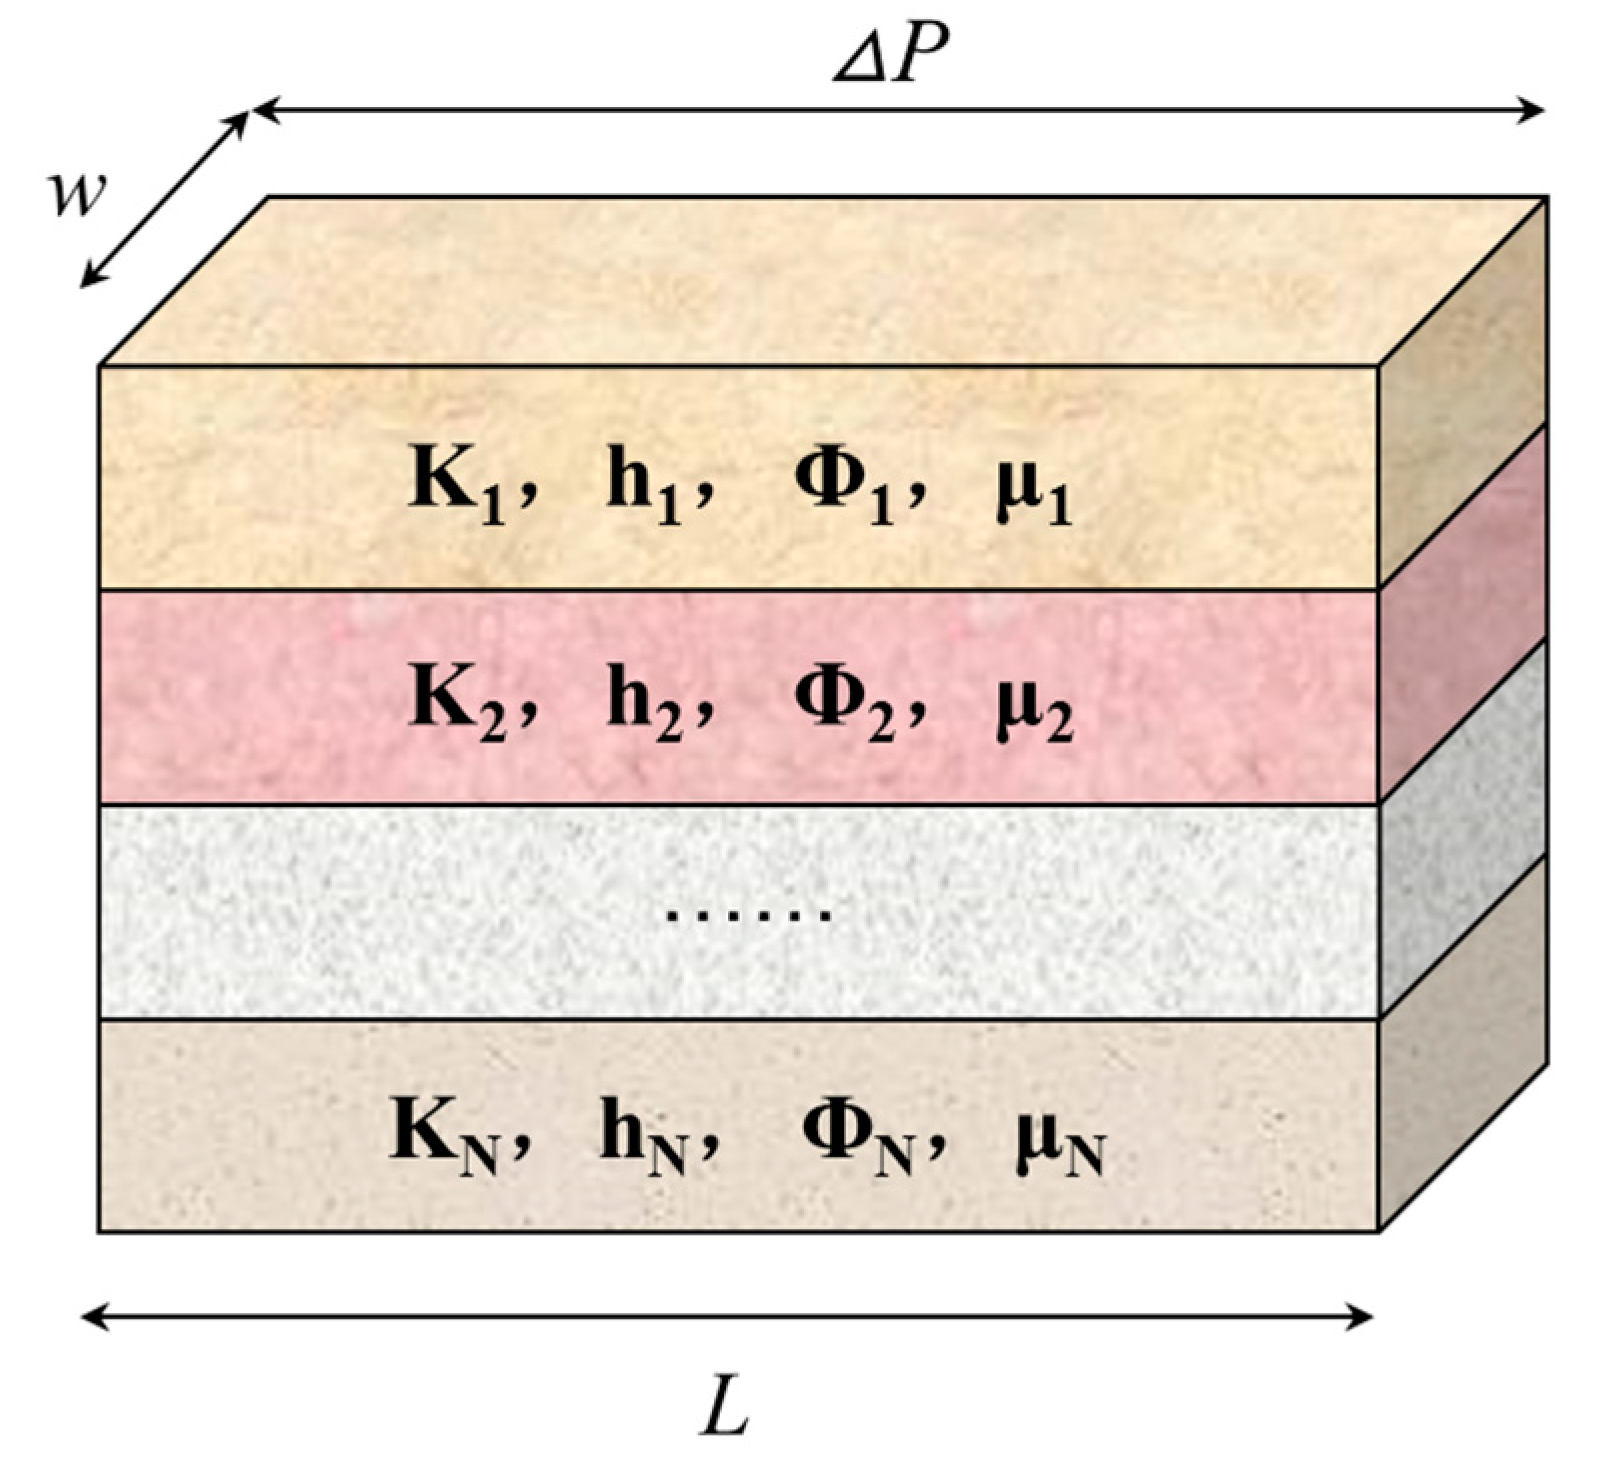
Figure 1. Schematic of the one-dimensional multilayer water flood model.
Energies 11 02428 g001
Figure 2. Schematic of planar radial multilayer water flood model.
Energies 11 02428 g002
Figure 3. Flow chart for solving the multilayer water flooding model.
Energies 11 02428 g003
Figure 4. Comparison of our calculated model and Zhang’s model [34] for the daily oil production rate in different permeability layers. Red dots denote Zhang’s model; blue dotted line denotes the calculated model. (a) High permeability layer; (b) Middle permeability layer; (c) Low permeability layer.
Energies 11 02428 g004aEnergies 11 02428 g004b
Figure 5. Comparison of the seepage resistance with different permeability in each layer of the planar radial flow model ranging from 0 to 5 pore volume (PV).
Energies 11 02428 g005
Figure 6. Comparison of recovery percentage in the reservoir ranging from 0 to 5 PV (a) separated and commingling production; (b) each different permeability layer (solid line, commingling production; dotted line, separated production).
Energies 11 02428 g006
Figure 7. Ratio of liquid production between high and low permeability layers (best to the worst) as the water cut ranging from 0 to nearly 100%.
Energies 11 02428 g007
Figure 8. Comparison of the liquid production rate with a permeability-to-viscosity ratio ranging from 0 to 5 PV. (a) Permeability ratio = 5; (b) Viscosity ratio = 5.
Energies 11 02428 g008
Figure 9. Recovery degree increase of separate production with a permeability ratio ranging from 1 to 10.
Energies 11 02428 g009
Figure 10. Comparison of the single well production index after separated production for nine months.
Energies 11 02428 g010
Table 1. Main parameters of the model.
Model ParametersValueModel ParametersValue
Reservoir radius (m)350Layer 1 permeability (10−3 µm2)3000
Reservoir thickness (m)5Layer 2 permeability (10−3 µm2)1800
Reservoir porosity (%)25Layer 3 permeability (10−3 µm2)600
Water injection rate (m3/d)500Oil viscosity (mPa·s)50
Table 2. Main parameters of the model (for viscosity ratio).
Model ParametersValueModel ParametersValue
Reservoir radius (m)350Oil viscosity in Layer 1 (mPa·s)17
Reservoir thickness (m)5Oil viscosity in Layer 2 (mPa·s)50
Reservoir porosity (%)25Oil viscosity in Layer 3 (mPa·s)85
Water injection rate (m3/d)500Layers’ permeability (10−3 µm2)1800