Article

Interval Energy Flow Analysis in Integrated Electrical and Natural-Gas Systems Considering Uncertainties

School of Electrical and Information Engineering, Tianjin University, Tianjin 300072, China
*
Author to whom correspondence should be addressed.
Energies 2019, 12(11), 2043; https://doi.org/10.3390/en12112043
Submission received: 27 March 2019 / Revised: 20 May 2019 / Accepted: 26 May 2019 / Published: 28 May 2019
(This article belongs to the Section F: Electrical Engineering)

Abstract

:
As integrated electrical and natural-gas systems (IENGS) are popularized, the uncertainties brought by variation of electrical load, power generation, and gas load should not be ignored. The aim of this paper is to analyze the impact of those uncertain variables on the steady-state operation of the whole systems. In this paper, an interval energy flow model considering uncertainties was built based on the steady-state energy flow. Then, the Krawczyk–Moore interval iterative method was used to solve the proposed model. To obtain precise results of the interval model, interval addition and subtraction operations were performed by affine mathematics. The case study demonstrated the effectiveness of the proposed approach compared with Monte Carlo simulation. Impacts of uncertainties brought by the variation of electrical load, power generation, and gas load were analyzed, and the convergence of energy flow under different uncertainty levels of electrical load was studied. The results led to the conclusion that each kind of uncertainties would have an impact on the whole system. The proposed method could provide good insights into the operating of IENGS with those uncertainties.

1. Introduction

With the increasing demand for energy and the growing environmental issues, it is urgent to utilize energy more efficiently. One way to overcome this problem is to make full use of the integrated electrical and natural-gas systems. The integrated electrical and natural-gas systems (IENGS) can realize this goal through the strengthening of the coordination between electrical systems and natural-gas systems [1]. For example, coupling units such as gas-fired generators and P2G (power to gas) in the electrical and natural-gas systems achieves effective allocation of energy by real-time scheduling. IENGS has the advantage of high energy efficiency, less environmental pollution, and sustainable energy supply, which is a trend of energy development in the future.
As one of the most important analytical tools for IENGS, energy flow analysis lays the foundation of the optimal operation [2,3,4,5,6], planning [7,8,9,10], energy market [11], and optimal scheduling [12] of the IENGS. There are some studies focused on energy flow analysis with different energy coupling links. A decomposing energy flow strategy for a multienergy carrier system has been proposed in Ref. [13] and the interdependent equipment, such as combined heating and power (CHP), boiler, and electrical pump, is taken into account. Ref. [14] considers the effect of temperature in the natural-gas system and a distributed slack node technique in the electricity network and proposes an integrated formulation for the steady-state analysis of electricity and natural-gas coupled systems based on the Newton–Raphson formulation. The interactions between power and gas systems by microturbines have been modeled and dynamic impact of interdependency has been studied in Ref. [15]. A unified steady-state energy flow formulation is developed with bidirectional energy conversion: power to gas (P2G) and gas-fired power generation in the IENGS in Ref. [16]. Since the turboexpander is also commonly used to strongly link the electrical and gas networks, Ref. [17] investigates operational parameters of natural-gas regulation stations (GRS), which influence the efficiency of the gas expansion process and determine selection criteria for a cost-effective application of turboexpanders at selected GRS. The turboexpander has been combined in a CHP plant that supplies a district heating network, in order to save energy and reduce CO2 emissions by means of smart systems integration in Ref. [18]. The steady-state energy flow considering time-scale characteristics has also been analyzed [19,20,21,22]. A multitemporal simulation model is presented to carry out integrated analysis of electricity, heat, and gas distribution networks, with specific applications to multivector district energy systems in Ref. [19]. A modified teaching–learning-based optimization algorithm is utilized to solve the multiperiod optimal energy flow of multicarrier energy networks in Ref. [20]. Ref. [21] proposes a quasi-steady multienergy flow model and calculates the energy flow of electricity and heating systems considering the time-scale characteristics. An integrated simulation model has been proposed considering the impacts of interdependencies between electricity and natural-gas systems in terms of security of energy supply in Ref. [22].
However, the uncertainties of IENGS are not considered in the above references. There are some papers considering the effect of uncertainties and disturbances in Model Predictive Control (MPC) [23], DC microgrid [24], damping the power swings [25], and optimal power flow [26]. Actually, there exist some kinds of uncertain factors in the operating IENGS, such as power load, gas load, and power generation. A probabilistic energy flow framework of IENGS is proposed considering correlated varying energy demands and wind power in Ref. [27]. Nevertheless, it is difficult to obtain the probability distribution function of those uncertainties accurately. Interval mathematics is an effective tool to address this issue [28,29]. Ref. [28] uses linear relaxation and optimality-based bounds tightening methods to calculate interval power flow. A power flow calculation method based on interval mathematics is proposed in Ref. [29], and an interval gas flow model considering the uncertainty of wind power is analyzed in [30].
Considering that the interval mathematics provides an approach to describe the uncertain information, which only needs upper and lower bounds of uncertainties, interval mathematics is applied to calculate the energy flow and analyze the impact of the uncertainties in the operating IENGS. So, this paper is aimed at the analysis of energy flow considering various uncertainties that may occur in the operating IENGS. The contributions of this paper can be summarized as follows:
  • Interval energy flow model of IENGS is built to reflect the various uncertainties brought by electrical load, power generation, and gas load, and the Krawczyk–Moore interval iterative method is used to solve interval energy flow equations and verify its correctness with the comparison to Monte Carlo simulation.
  • The influence of each kind of uncertainty brought by electrical load, power generation, and gas load has been investigated, and especially the impact of uncertainty in power system on gas system and the impact of uncertainty in gas system on power system are analyzed.
  • The convergence of energy flow is analyzed when the uncertainty level of electrical load is increased to verify the approach’s effectiveness.
The remainder of this paper is organized as follows. The interval energy flow model considering uncertainties is built based on the steady-state energy flow in Section 2. In Section 3, the Krawczyk–Moore interval iterative method is used to calculate energy flow. Case study and simulation results are illustrated in Section 4, and Section 5 draws the conclusion of the paper.

2. Energy Flow Model in IENGS Considering Uncertainties

An IENGS consists of the power system, the natural-gas system, and coupling units. Electrical power is transmitted from the power supply side to the load side by the power network, and the natural-gas system is applied to transmit gas from gas source to gas load through pipe lines and compressors. Interconversion of electricity and gas is achieved by equipment such as CHP units, electric boilers, gas-fired generators, and P2G device. This paper takes the gas-fired generator as a coupling unit for the interconnected linkage. The IENGS considered in this paper is shown in Figure 1.

2.1. Steady-State Energy Flow Model without Consideration of Uncertainty

To build the steady-state energy flow model of IENGS, the power flow model is given firstly, and then the gas flow model is built with reference to the modeling process of power flow since there are many similarities between them. Lastly, the coupling unit model is given.

2.1.1. Power Flow Model

For each bus i in the power system, the power flow calculation model under polar coordinates is expressed as:
P i = U i j = 1 n E U j ( G i j cos δ i j + B i j sin δ i j ) ,
Q i = U i j = 1 n E U j ( G i j sin δ i j B i j cos δ i j ) ,
where Pi and Qi are active power and reactive power injected into bus i, respectively. Ui is the voltage amplitude of bus i, and δij is the voltage phase angle difference between bus i and j. Gij and Bij are conductance and susceptance between bus i and j in bus admittance matrix, respectively. nE is the total bus number in the whole power system.
Buses in the power system can be classified into PQ buses, PV buses, and slack buses, and each bus satisfies Kirchhoff’s first law in the power system, that is, nodal power balance equations of bus i can be expressed as:
Δ P i = P s , i P l , i P i = 0 ,
Δ Q i = Q s , i Q l , i Q i = 0 ,
where Ps,i and Qs,i are active power and reactive power generated by bus i, respectively. Pl,i and Ql,i are active power and reactive power consumed by bus i, respectively.

2.1.2. Gas Flow Model

Natural-gas systems have many similarities with power systems. A structural comparison between gas systems and power systems is illustrated in Table 1.
1. Gas flow model of pipelines
There exist lots of pipelines to realize long-distance transmission of natural gas similar to the transmission line in power systems. An accurate model for calculating the flow of natural-gas pipelines is given in [14]. Ignoring the influence of temperature and the environment on the gas flow of pipelines, the gas flow model of pipelines in this paper is given as [31]:
f m n = sgn ( v m v n ) h m n | v m 2 v n 2 | ,
where fmn is the gas flow passing through nodes from m to n. vm and vn are the gas pressure at nodes m and n, respectively. hmn is a parameter which is related to gas pipelines and fluids and influenced by various factors such as the length and inner diameter of pipelines, the friction coefficient of natural gas flowing in the pipeline, and the natural-gas temperature. sgn(vm-vn) is a symbolic function used to characterize the flow direction of natural gas in a pipeline, which is expressed as [27]:
sgn ( v m v n ) = { + 1 ,   v m v n 1 , v m < v n ,
2. Gas flow model of compressors
Power transformers are typically placed at certain buses in order to reduce power losses caused by long-distance transmission in power systems. Natural-gas compressors are used to compensate the natural-gas pressure drop caused by the pipeline transmission process. Compressors increase the gas pressure level by an electric motor or a gas-fired turbine. The gas required for the gas-fired turbine compressor extracted from the natural-gas network is expressed as [14]:
H c , m = B c , m n f c , m n [ ( v n v m ) Z c , m n 1 ] ,
τ c , m = α c + β c H c , m + γ c H c , m 2 ,
where Hc,m is the energy consumption of the compressor. Bc,mn and Zc,mn are the compressor parameters, which depend on the temperature, efficiency, and compression factor of the compressor. τc,m is the gas required for the gas-fired turbine compressor extracted from the natural-gas network, and α, β, and γ are compressors gas consumption coefficients. In this paper, γ c is set 0 as is in Ref. [27], so the equation is converted to a linear function.
3. Node type
Analogous with power systems, nodes in the natural-gas network can be divided into two types:
(1)
known-pressure node. Gas supply of this node is sufficient and the pressure is a given reference value to compute all other unknown nodal pressures, which is similar to slack buses in power systems.
(2)
known-injection node. Gas consumption and injection are known while pressure is unknown for the node, which is analogous to the PQ buses in power systems.
4. Nodal gas flow balance equation
Kirchhoff’s first law is satisfied by each node in the natural-gas network, namely, the sum of gas flow inlet is equal to the sum of gas flow output for each node, which can be expressed as:
Δ f m = f s , m n M p f p , m n k M c f c , m k k M c τ c , m k f l , m = 0 ,
where Mp and Mc are the set of pipeline nodes and compressor nodes adjacent to the node m, respectively, and fl,m and fs,m are gas load and source at the node m, respectively.

2.1.3. Coupling Model

This paper considers the gas-fired generator as a coupling unit for the interconnected linkage. The gas flow required by the coupling is expressed as [14]:
H g a s , m = α g + β g P G , i + γ g P G , i 2 ,
F g a s , m = H g a s , m G H V ,
where PG,i is the power output of gas-fired generator at bus i in the power system, and Fgas,m is the gas flow of the gas-fired generator of node m in the natural-gas system. In Equation (11), the fuel consumption of the gas-fired generator is related to net heating value (lower heating value) and the gross heating value. Here, we regard it as an ideal process and choose the gross heating value as in Ref. [14]. GHV is gross heating value, and αg, βg, and γg are heat rate coefficients of gas-fired generators.

2.1.4. Steady-State Energy Flow Balance Equation

Considering the coupling unit, Equations (3) and (9) are rewritten as (12) and (13):
Δ P i = P g , i + P s , i P l , i P i = 0 ,
Δ f m = f s , m n M p f p , m n k M c τ c , m k f l , m f g , m = 0 ,
So, the energy balance equation of the integrated power and natural-gas systems is corrected to Equations (4), (12) and (13).

2.2. Interval Energy Flow Modeling Considering Uncertainty

2.2.1. Uncertainties in Interval Forms

There are a large number of uncertain factors in the operating IENGS. In this paper, three kinds of uncertainties are taken into consideration caused by variations of electrical load, power generation, and gas load. Interval mathematics provides an effective tool to describe and address uncertain variables. One of the advantages of applying interval mathematics is that only the upper and lower bounds of uncertainties are needed, especially when the probability distribution function of uncertainties is hard to obtain accurately.
The interval number and interval function are expressed by “[ ]” to distinguish a certain number and function. The number of interval [ x ] = [ x _ , x ¯ ] is the set of all x that satisfies x _ x x ¯ , which can be formulated by:
[ x ] = [ x _ , x ¯ ] = { x | x _ x x ¯ } ,
where x _ , x ¯ , and x _ x ¯ . In addition, x _ and x ¯ are called the lower and upper limits of x, respectively, and is the set of real numbers. The arithmetic operations are described in [32].
Hence, the three kinds of uncertainties (variations of electrical load, power generation, and gas load) in interval forms are expressed as:
{ [ P g , i ] = [ P _ g , i , P ¯ g , i ] [ P l , i ] = [ P _ l , i , P ¯ l , i ] [ f l , m ] = [ f _ l , m , f ¯ l , m ] ,
The variables in interval forms are formulated by:
{ [ δ ] = [ δ _ , δ ¯ ] [ U ] = [ U _ , U ¯ ] [ v ] = [ v _ , v ¯ ] ,

2.2.2. Energy Flow Model Using Interval Mathematics

Now that the uncertainties and variables are obtained in interval forms, the energy flow equations considering uncertainties can be formulated by interval mathematics. The interval energy flow model of IENGS can be expressed as:
{ [ Δ P i ] = [ P s , i ] + [ P g , i ] [ P l , i ] [ U i ] j = 1 n E [ U j ] ( G i j cos [ δ i j ] + B i j sin [ δ i j ] ) [ Δ Q i ] = [ Q s , i ] [ Q l , i ] [ U i ] j = 1 n E [ U j ] ( G i j sin [ δ i j ] B i j cos [ δ i j ] ) [ Δ f m ] = f s [ f l , m ] [ f g , m ] n M p [ f m n ] [ τ c , m ] ,
Also, (17) can be simplified as nonlinear interval equations formulated by:
[ y ] = f ( [ x ] ) ,

3. Interval Energy Flow Analysis based on Krawczyk–Moore Iterative Method

3.1. Krawczyk–Moore Iterative Method in Energy Flow Analysis

The interval energy flow model can be solved by the Krawczyk–Moore iterative method. The Krawczyk–Moore interval iterative method is based on Moore’s research [33], which has been used in interval power flow analysis [34,35]. To apply this method, an interval operator should be built, which can be expressed as:
K ( x 0 , [ x ] ) = x 0 Y f ( x 0 ) ( E Y F ( [ x ] ) ) ( [ x ] x 0 ) ,
where x0 is central value of [x], which is a certain vector, and Y is a nonsingular matrix, and F ( [ x ] ) is the derivative of f ( [ x ] ) .
The advantage of the Krawczyk–Moore iterative method is that the inverse of Jacobian matrix need not be calculated in each iteration by using the interval operator K ( x 0 , [ x ] ) , since calculation for the inverse of Jacobian matrix needs mass computation and sometimes is quite difficult.
The ith iteration process of the Krawczyk–Moore method is as follows:
{ [ x i + 1 ] = [ x i ] K ( [ x i ] ) K ( [ x i ] ) = x 0 i Y i f ( x 0 i ) ( E Y i F ( [ x i ] ) ) ( [ x i ] x 0 i ) x 0 i = x _ i + x ¯ i 2 Y i = { ( F i ( [ x i ] ) _ + F ( [ x i ] ) ¯ 2 ) 1 , E Y i F i ( [ x i ] ) E Y i 1 F ( [ x i ] ) Y i 1 , other   conditions ,
When the Krawczyk–Moore iterative method is used in the interval energy flow model above, [ x ] is expressed as (21) and (22) in the power system and gas system, respectively:
[ x E ] = [ [ δ ] [ U ] ] = [ [ δ _ , δ ¯ ] [ U _ , U ¯ ] ] ,
[ x G ] = [ v ] = [ v _ , v ¯ ] ,
Meanwhile, the corresponding F ( x ) is expressed as (23) and (24), respectively:
F ( [ x E ] ) = [ J E ] = [ [ H ] [ N ] [ J ] [ L ] ] = [ [ H _ , H ¯ ] [ N _ , N ¯ ] [ J _ , J ¯ ] [ L _ , L ¯ ] ] ,
F ( [ x G ] ) = [ J G ] = [ J G _ , J G ¯ ] ,
where J E and J G are the Jacobian matrices of power flow and gas flow, respectively.

3.2. Improvement of the Krawczyk–Moore Iterative Process with Affine Arithmetic

When the Krawczyk–Moore iterative method is used to solve the interval energy flow model, the solution may be too conservative since there exits correlation between interval variables in [ J E ] and [ J G ] [36]. In this situation, affine mathematics can describe the correlation and reduce the conservativeness effectively.

3.2.1. Affine Arithmetic

Affine mathematics is an improved form of interval mathematics, which can describe the interconnection between uncertain variables, thus making the calculation results of interval energy flow more precise [37]. A quantity x ^ is represented as an affine form (25):
x ^ = x 0 + x 1 ε 1 + x 2 ε 2 + + x n ε n = x 0 + i = 1 n x i ε i ,
where x0 and xi are the center value and partial deviation of x ^ , respectively, and ε i is the noisy symbol that lies in the interval [−1,1]. The interval form and the affine form of a quantity can be converted to each other. If [ x ] is converted to x ^ , then x 0 = ( x _ + x ¯ ) / 2 and x 1 = ( x ¯ x _ ) / 2 in two order form, and [ x ] = [ x 0 x 1 ,     x 0 + x 1 ] if x ^ is converted to [ x ] .

3.2.2. Improvement in Iterative Process with Affine Arithmetic

Affine mathematics can optimize the process of calculation considering the interdependency between variables. Therefore, K ( x ) in Equation (19) is rewritten as:
K ( x 0 , [ x ] ) = x 0 Y f ( x 0 ) ( E Y F ( [ x ] ) ) x 1 ε 1 ,
where x1 is the partial deviation of [x], denoted as x 1 = ( x ¯ x _ ) / 2 .
Considering there is correlation in [ J E ] and [ J G ] , affine mathematics can describe the correlation in energy flow analysis quantitatively.
1. Improvement of [JE]
Considering the correlation in [ J E ] of the power system, there exits correlation of sin δ and cos δ in submatrices of H, N, J, and L. Take the submatrix H as the instance, the matrix elements in submatrix H can be expressed as [34]:
[ H i j ] = [ U i ] [ U j ] ( G i j sin [ δ i j ] B i j cos [ δ i j ] ) = [ U i ] [ U j ] G i j 2 + B i j 2 sin ( [ δ i j ] + μ H , i j )
[ H i i ] = [ U i ] j = 1 , j i n E [ U j ] ( G i j sin [ δ i j ] B i j cos [ δ i j ] ) = [ U i ] j = 1 , j i n E [ U j ] G i j 2 + B i j 2 sin ( [ δ i j ] + μ H , i j )
where μ H , i j = arctan ( B i j / G i j ) , which is a fixed value. Other submatrices of N, J, and L of Jacobian matrix in the power system can be calculated in the same way.
2. Improvement of [JG]
Considering the correlation in [ J G ] of the natural-gas system, | v m 2 v n 2 | can be formulated by square difference formula and considering the correlation between vm and vn, [ f m n ] can be expressed as:
[ f m n ] = sgn ( [ v m ] [ v n ] ) h m n | [ v m ] 2 [ v n ] 2 | = sgn ( [ v m ] [ v n ] ) h m n | ( [ v m ] [ v n ] ) ( [ v m ] + [ v n ] ) |
In this way, by using square difference formula, only a calculation of interval multiplication is needed to be performed when [ J G ] is calculated by [ f m n ] , while addition and subtraction is performed by affine mathematics. Hence, the results will be more accurate by using (30) and (31):
[ J G , m n ] = 1 2 [ f m n ] [ v m ] [ v n ] = h m n 2 | [ v m ] + [ v n ] [ v m ] [ v n ] | ,
[ J G , m m ] = 1 2 n = 1 , n m N G [ f m n ] [ v m ] [ v n ] = h m n 2 n = 1 , n m N G | [ v m ] + [ v n ] [ v m ] [ v n ] | ,

3.3. Interval Energy Flow Analysis Process

The analysis process of interval energy flow in this paper is shown in Figure 2, which can be summarized in eight steps.
Step 1: Initialize the upper and lower bounds of variables. In this step, the maximum limit and minimum limit of variables in energy flow analysis are chosen as the initial values of the upper and lower bounds via (32) and (33).
[ x E 0 ] = [ [ δ 0 ] [ U 0 ] ] = [ [ δ min , δ max ] [ U min , U max ] ] ,
[ x G 0 ] = [ v min , v max ] ,
Step 2: Convert the interval variables to the affine form via (34) and (35).
x ^ E i = [ δ ^ i U ^ i ] = [ δ _ i + δ ¯ i 2 + δ ¯ i δ _ i 2 ε δ i U _ i + U ¯ i 2 + U ¯ i U _ i 2 ε U i ] ,
x ^ G i = v _ i + v ¯ i 2 + v ¯ i v _ i 2 ε v i ,
Step 3: Calculate Y i . If i = 0, then Y 0 = [ Y E 0 Y G 0 ] T , which is expressed as:
Y E 0 = [ [ H _ 0 + H ¯ 0 2 ] [ N _ 0 + N ¯ 0 2 ] [ J _ 0 + J ¯ 0 2 ] [ L _ 0 + L ¯ 0 2 ] ] 1 ,
Y G 0 = [ Y ¯ G 0 + Y _ G 0 2 ] 1 ,
if i 1 , Y i is expressed as:
Y E i = { [ [ H _ i + H ¯ i 2 ] [ N _ i + N ¯ i 2 ] [ J _ i + J ¯ i 2 ] [ L _ i + L ¯ i 2 ] ] 1 , E Y E i F E ( [ x E i ] ) E Y G i 1 F G ( [ x E i ] ) Y E i 1 , other   conditions ,
Y G i = { [ Y ¯ G i + Y _ G i 2 ] 1 , E Y G i F G ( [ x G i ] ) E Y G i 1 F G ( [ x G i ] ) Y G i 1 , other   conditions ,
Step 4: Calculate K E ( [ x E i ] ) in the power system. Firstly, calculate ( E Y E i F ( [ x E i ] ) ) x 1 ε 1 using affine mathematics and convert the result to interval form. Then, K E ( [ x E i ] ) is calculated by interval mathematics via (20).
Step 5: Calculate parameters of coupling unit. Firstly, calculate the power output of gas turbines, then calculate the gas flow consumed by gas-fired generators via (10) and (11).
Step 6: Calculate K G ( [ x G i ] ) in the gas system, which is similar to Step 4.
Step 7: Calculate the next iteration value of energy flow, which can be expressed as:
[ x i + 1 ] = [ x i ] K ( [ x i ] ) ,
Step 8: Determine convergence of energy flow results via (41) and (42) where ε e r r , E and ε e r r , G are the iterative errors in power flow and gas flow, respectively. If the results converge, then output the results, otherwise jump to Step 3 to continue the iteration.
{ | x _ E i + 1 x _ E i | ε e r r , E | x ¯ E i + 1 x ¯ E i | ε e r r , E ,
{ | x _ G i + 1 x _ G i | ε e r r , G | x ¯ G i + 1 x ¯ G i | ε e r r , G ,

4. Case Study

4.1. Thirty-Nine-Bus Electrical System Coupled with 20-Node Gas System

The IENGS consisting of the IEEE 39-bus system and the Belgian natural-gas system shown in Figure 3 are presented to analyze the suitability of the proposed approach. The scales of the two subsystems match each other. The Belgian natural-gas system, whose detailed data can be found in Ref. [14], consists of 20 gas nodes and 24 gas pipelines, in which there are 7 gas source nodes, 8 gas load nodes, and 2 pressure nodes driven by external energy sources. There are 3 gas-fired generators at buses 30, 31, and 34 in the power system, which are supplied from nodes 4, 12, and 16 in the gas system, respectively. Bus 31 in the power system and node 1 in the gas system are selected as slack nodes.
Gas source and gas load information of the gas network is shown in Table 2, and detailed information of pipelines can be found in [38]. In addition, parameters of gas-fired generators are shown in Table 3. It should be noted that although a model with the possibility of using a quadratic one is set up, this model is transformed to a linear model because γ = 0. The value of GHV in (11) is 1015 BTU/SCF. In this paper, the British notation is used instead of the SI notation, and their conversion relations are 1 BTU/SCF = 37.25 × 10³ J/m3, and 1 MSCF = 28.32 m3.
In this section, five scenarios are designed to analyze the energy flow in the IENGS.
Scenario 1: without uncertainties.
Scenario 2: with a ± 5% variation on electrical load.
Scenario 3: with a ± 5% variation on the power generator of bus 36.
Scenario 4: with a ± 5% variation on gas load.
Scenario 5: considering uncertainties including Scenario 2, 3, and 4.

4.2. Comparison with Monte Carlo Simulation

To validate the effectiveness of the proposed approach, certain energy flow results of Scenario 1, interval energy flow solutions of Scenario 2 obtained by the proposed approach, and Monte Carlo (MC) stochastic simulation are calculated. MC stochastic simulation randomly samples load variation for 104 trials to get maximum/minimum voltage magnitude, voltage angle of the power system, and gas pressure of the gas system. It is assumed that solutions of MC simulation are regarded as the real interval results if sufficient numbers of samples are applied. Partial results are listed in Table 4 and Table 5 for the sake of brevity and readability.
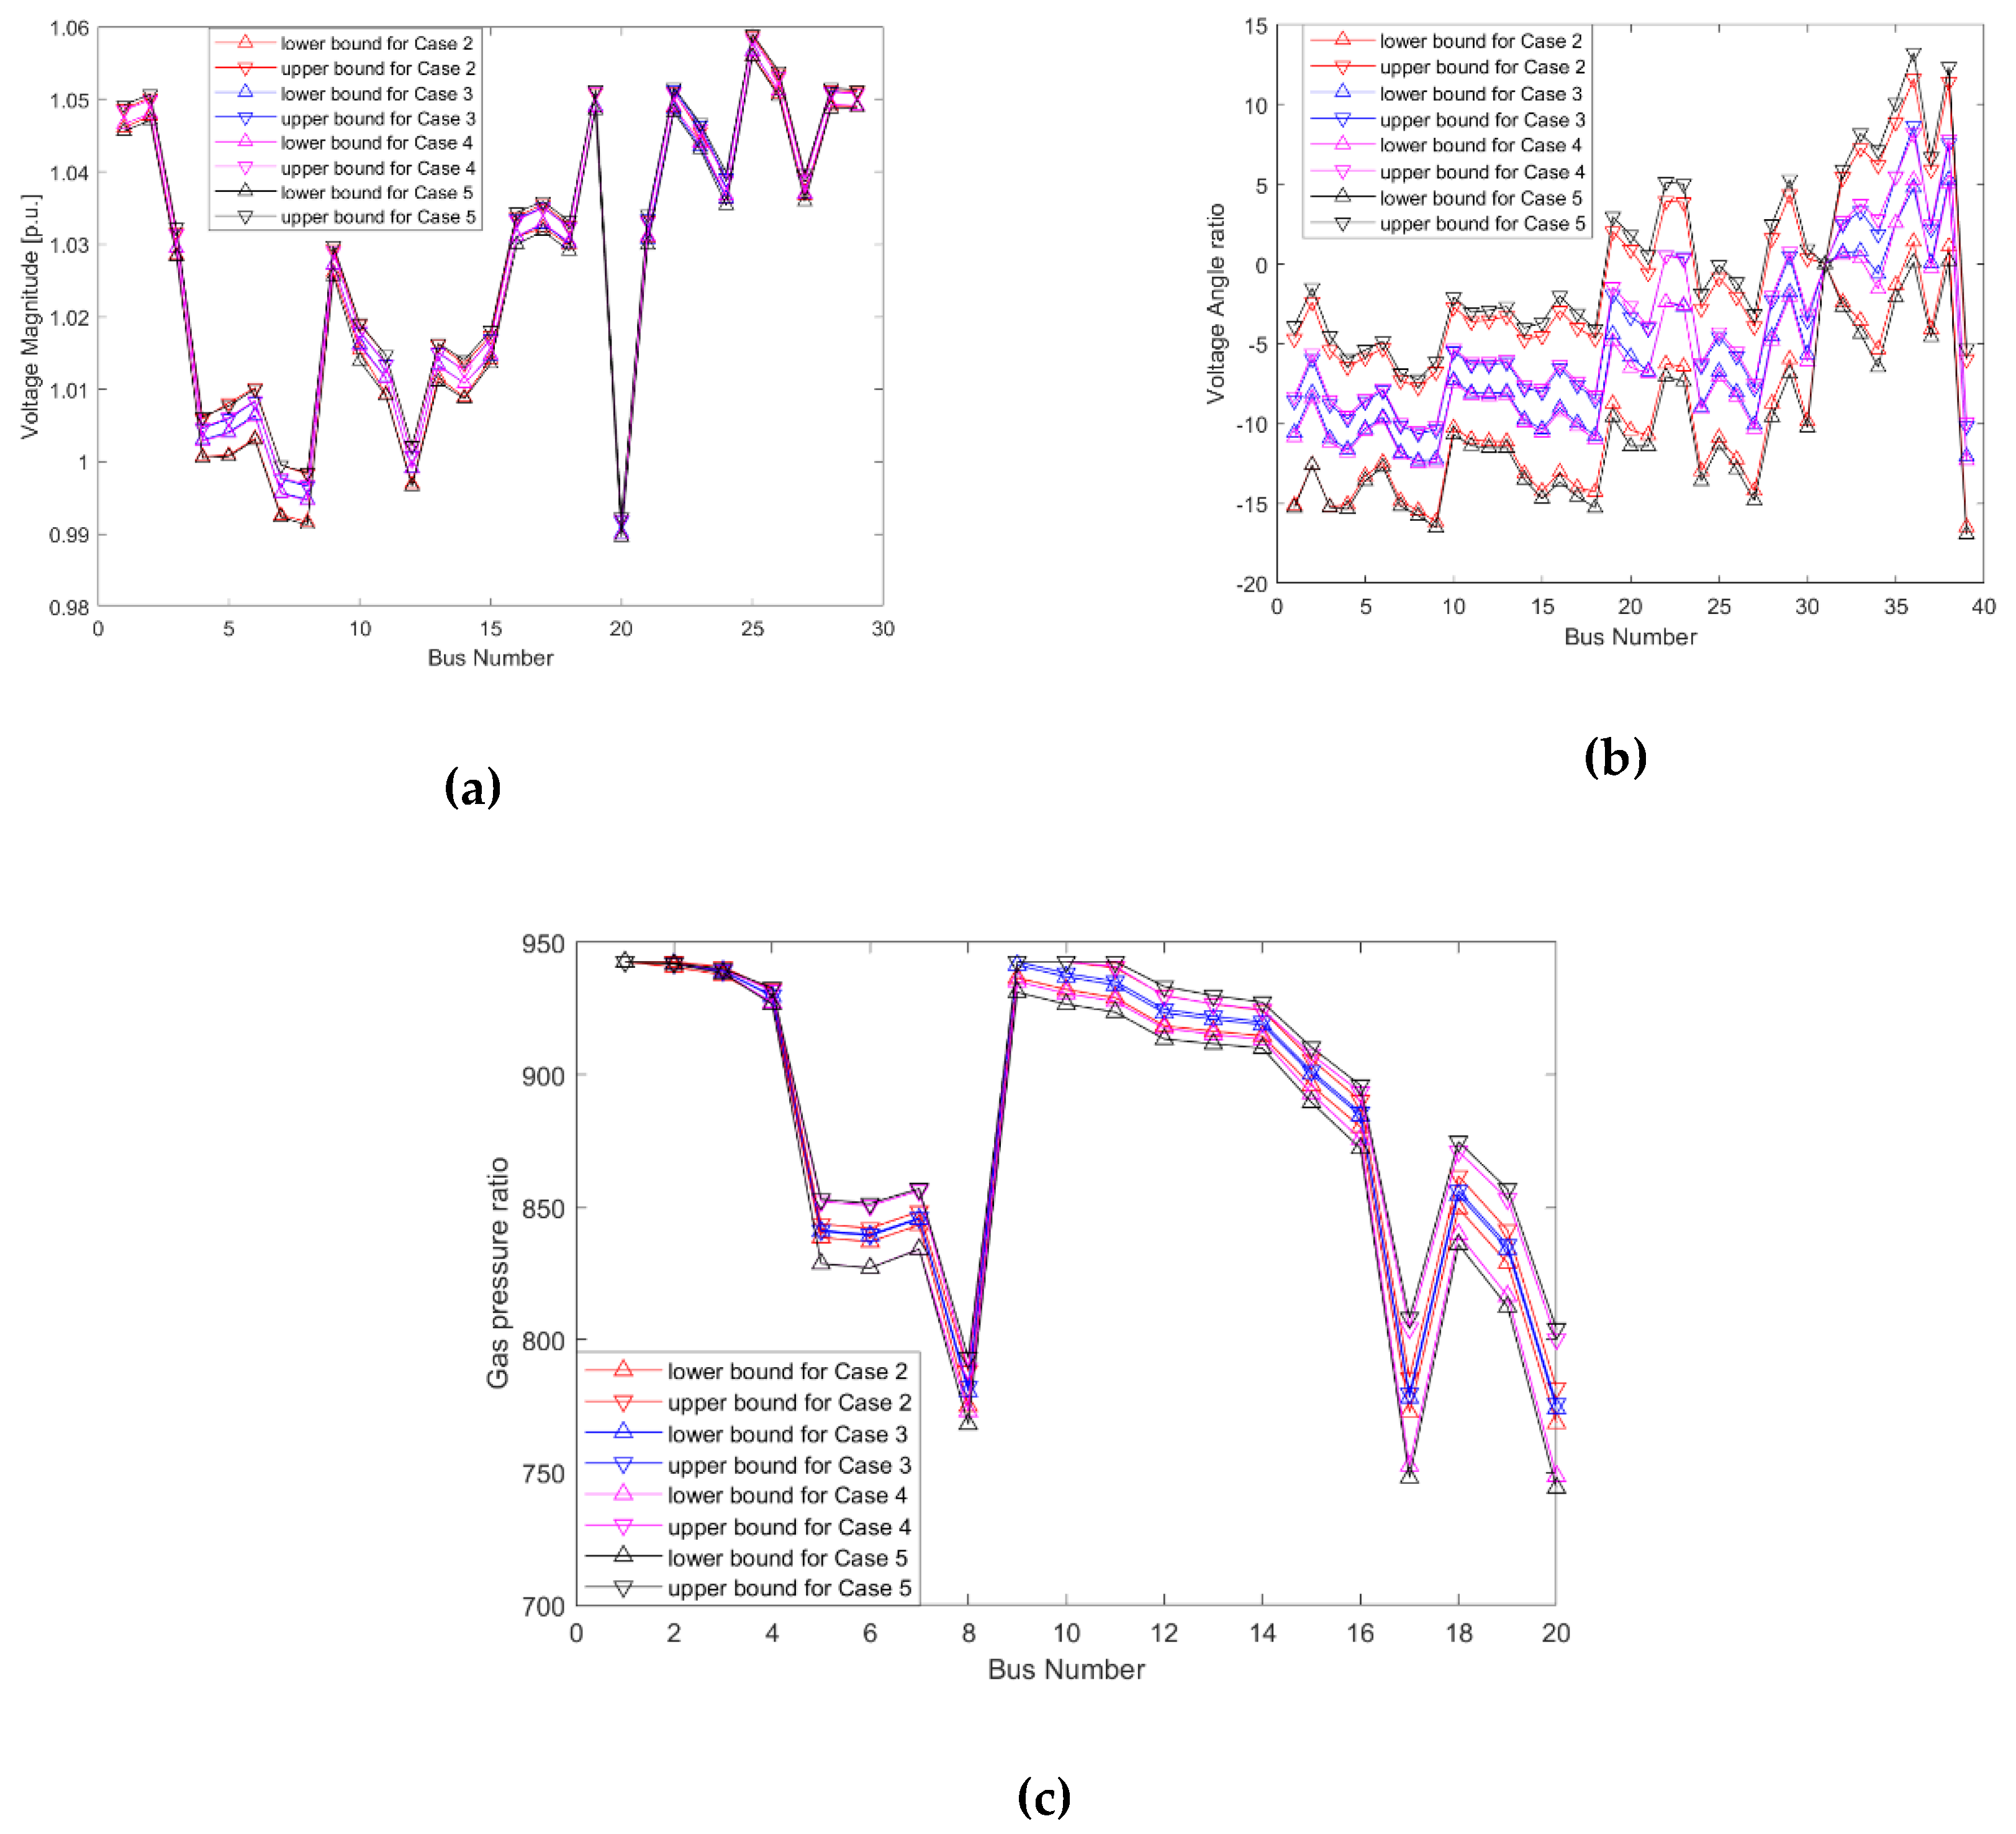
The results of Scenario 1 are lying in the solutions obtained by the proposed approach from the above comparison. Furthermore, the results calculated by the proposed approach is close to MC simulation results and former results include all the latter results, which can illustrate the completeness of the proposed approach. The detailed results are illustrated in Figure 4, which reflects the comparison between the proposed approach and MC simulation intuitively. Figure 4a shows the variation of voltage magnitude from bus 1 to bus 29 in the power system. It should be noted that upper bound and lower bound of voltage magnitudes from bus 30 to bus 39 obtained by the proposed approach and MC simulation have the same values, which are also equal to the results calculated by certain energy flow in Scenario 1. That is because bus 31 is the slack bus and the others are PV buses, whose voltage magnitude cannot change in the energy flow calculation process. Figure 4b shows the variation of voltage angle from bus 1 to bus 39 in the power system. Figure 4c shows the variation of gas pressure from node 1 to node 20 in the gas system. Voltage angle of bus 31 in Figure 4b and gas pressure of node 1 in Figure 4c will not change under three situations, as bus 31 in the power system and node 1 in the gas system are slack nodes.
The comparison in Figure 4 demonstrates that the proposed approach can estimate the upper and lower bounds of energy flow in IENGS considering uncertainties. The results obtained by MC simulation are included by the proposed approach and the two kinds of results are very close. However, it takes less time to get the results by the proposed approach compared with MC simulation, hence the proposed approach has sound applicability for energy flow analysis considering uncertainty.

4.3. Uncertain Energy Flow Analysis

To analyze the impact of uncertainties brought by variation of electrical load, power generation, and gas load, the results of Scenarios 2, 3, and 4 are calculated and those solutions are shown in Figure 5 together.
1. Analysis of electrical load variation
In Scenario 2, electrical load variation has an influence on the IENGS. That is to say, the uncertainty produced by the power system is delivered to the gas system, making gas pressure of its nodes fluctuate. Power generation in bus 31, which is supplied by the gas-fired generator from coupling node 12 in the gas system, varies with electrical load. The power generation of the gas-fired generator changes with its gas consumption. Then, the variation of the coupling node 12 causes the variation of gas load accordingly, which will make gas pressure of all gas nodes fluctuate. Hence the energy flow will change over electrical load variation.
2. Analysis of power generator variation
In Scenario 3, the uncertainty is reflected in the power system and gas system, similar to the situation in Scenario 2. When the output of power generator fluctuates by uncertainty, all the results of electrical nodes will fluctuate, as well as the variation of all gas nodes. That is because, like Scenario 2, output of variation of coupling bus 31 will make the gas load fluctuate in gas node 12, thus gas pressure of all gas nodes fluctuates in Scenario 3. Besides, the impact on the power system by the variation of a single generator in Scenario 3 is less than the variation of multiple loads in Scenario 2.
3. Analysis of gas load variation
In Scenario 4, gas load variation will make IENGS fluctuate. Furthermore, it should be noted that the variation of the power system brought by the uncertainty in the gas system is less than the variation brought by the uncertainty of electrical load in Scenario 2. That is because in Scenario 4, when gas loads fluctuate, gas consumption of gas-fired generators will vary at gas nodes 4, 12, and 16, which will change the power generation in bus 30, 31, and 34 of the power system. Therefore, the uncertainty is delivered to the whole power system. Now that there are three uncertain power sources in Scenario 4, the variation in power system is more than variation brought by a single uncertain power source in Scenario 3.
4. Analysis of all uncertainties
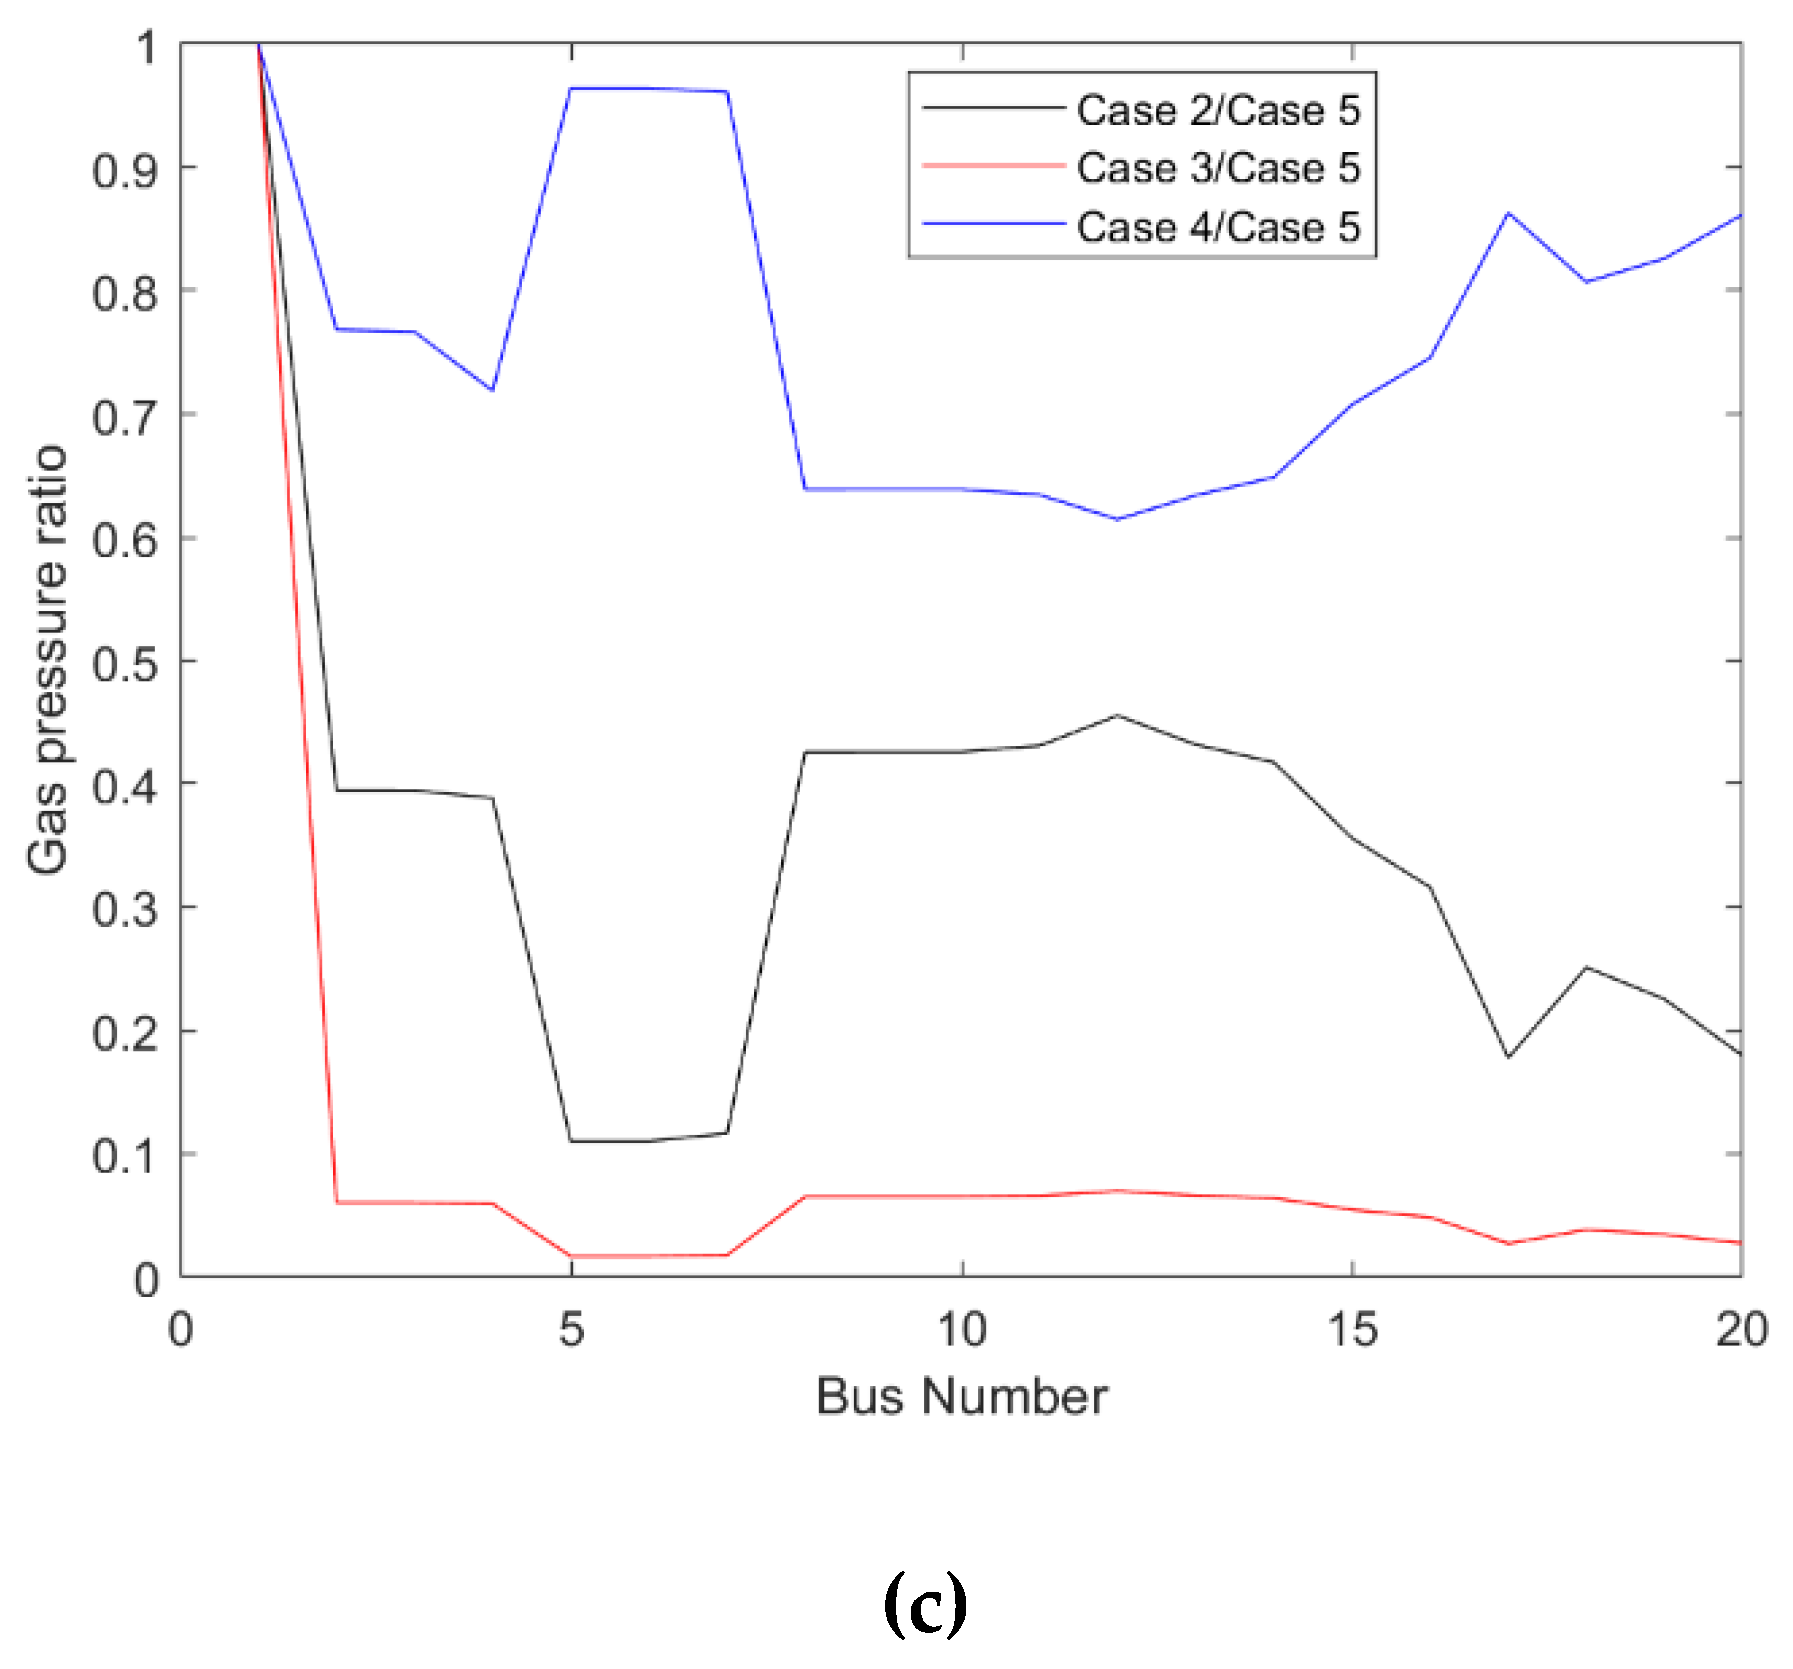
When all three uncertainties are taken into consideration, the operating parameters U, δ, and v will fluctuate apparently to an extent. In addition, the variation of energy flow is much larger than Scenario 2–4 as is shown in Figure 5. To compare the uncertainty level of operating parameters in Scenario 5 with Scenario 2–4, the interval breadth ratios λ is proposed, which can be calculated by λ x , i = ( x ¯ c a s e   i x _ c a s e   i ) / ( x ¯ c a s e 5 x _ c a s e 5 ) (i = 2, 3, 4), where x is denoted as U, δ, or v. Solutions of Scenario 5 are set as reference values and λ x , i > 0 . When λ x , i < 1 , it means that fluctuation of the solution x in Scenario i is smaller than that in Scenario 5. The smaller λ x , i is, the lighter the variation of parameter x is in Scenario i compared with Scenario 5. When λ x , i > 1 , it means that variation of the solution x in Scenario i is larger than that in Scenario 5.
The solutions of U, δ, or v in Scenarios 2, 3, and 4 are shown in Figure 6. Most values of λ U , i , λ δ , i and λ v , i (i = 2, 3, 4) are less than 1, from which it can be seen that the variation in Scenario 5 is larger than in Scenarios 2, 3, and 4. That is because the number of the uncertainty sources is larger than the number in Scenarios 2, 3, and 4, which can illustrate that accumulation of uncertainty sources will make the IENGS much more uncertain.
In addition, from the comparison between Scenario 2 and Scenario 4, it can be concluded that the impact on gas system by the variation of electrical buses is much less than that of gas nodes, since only a gas node changes in Scenario 2. Similarly, the impact on gas system by the variation of single power generator is much less than that of gas nodes by the comparison between Scenario 3 and Scenario 4. In the same view, it can be seen that the impact on power system by the variation of gas nodes is much less than that of electrical buses by the comparison of Scenario 2 and Scenario 4.

4.4. Convergence Analysis of Uncertain Energy Flow

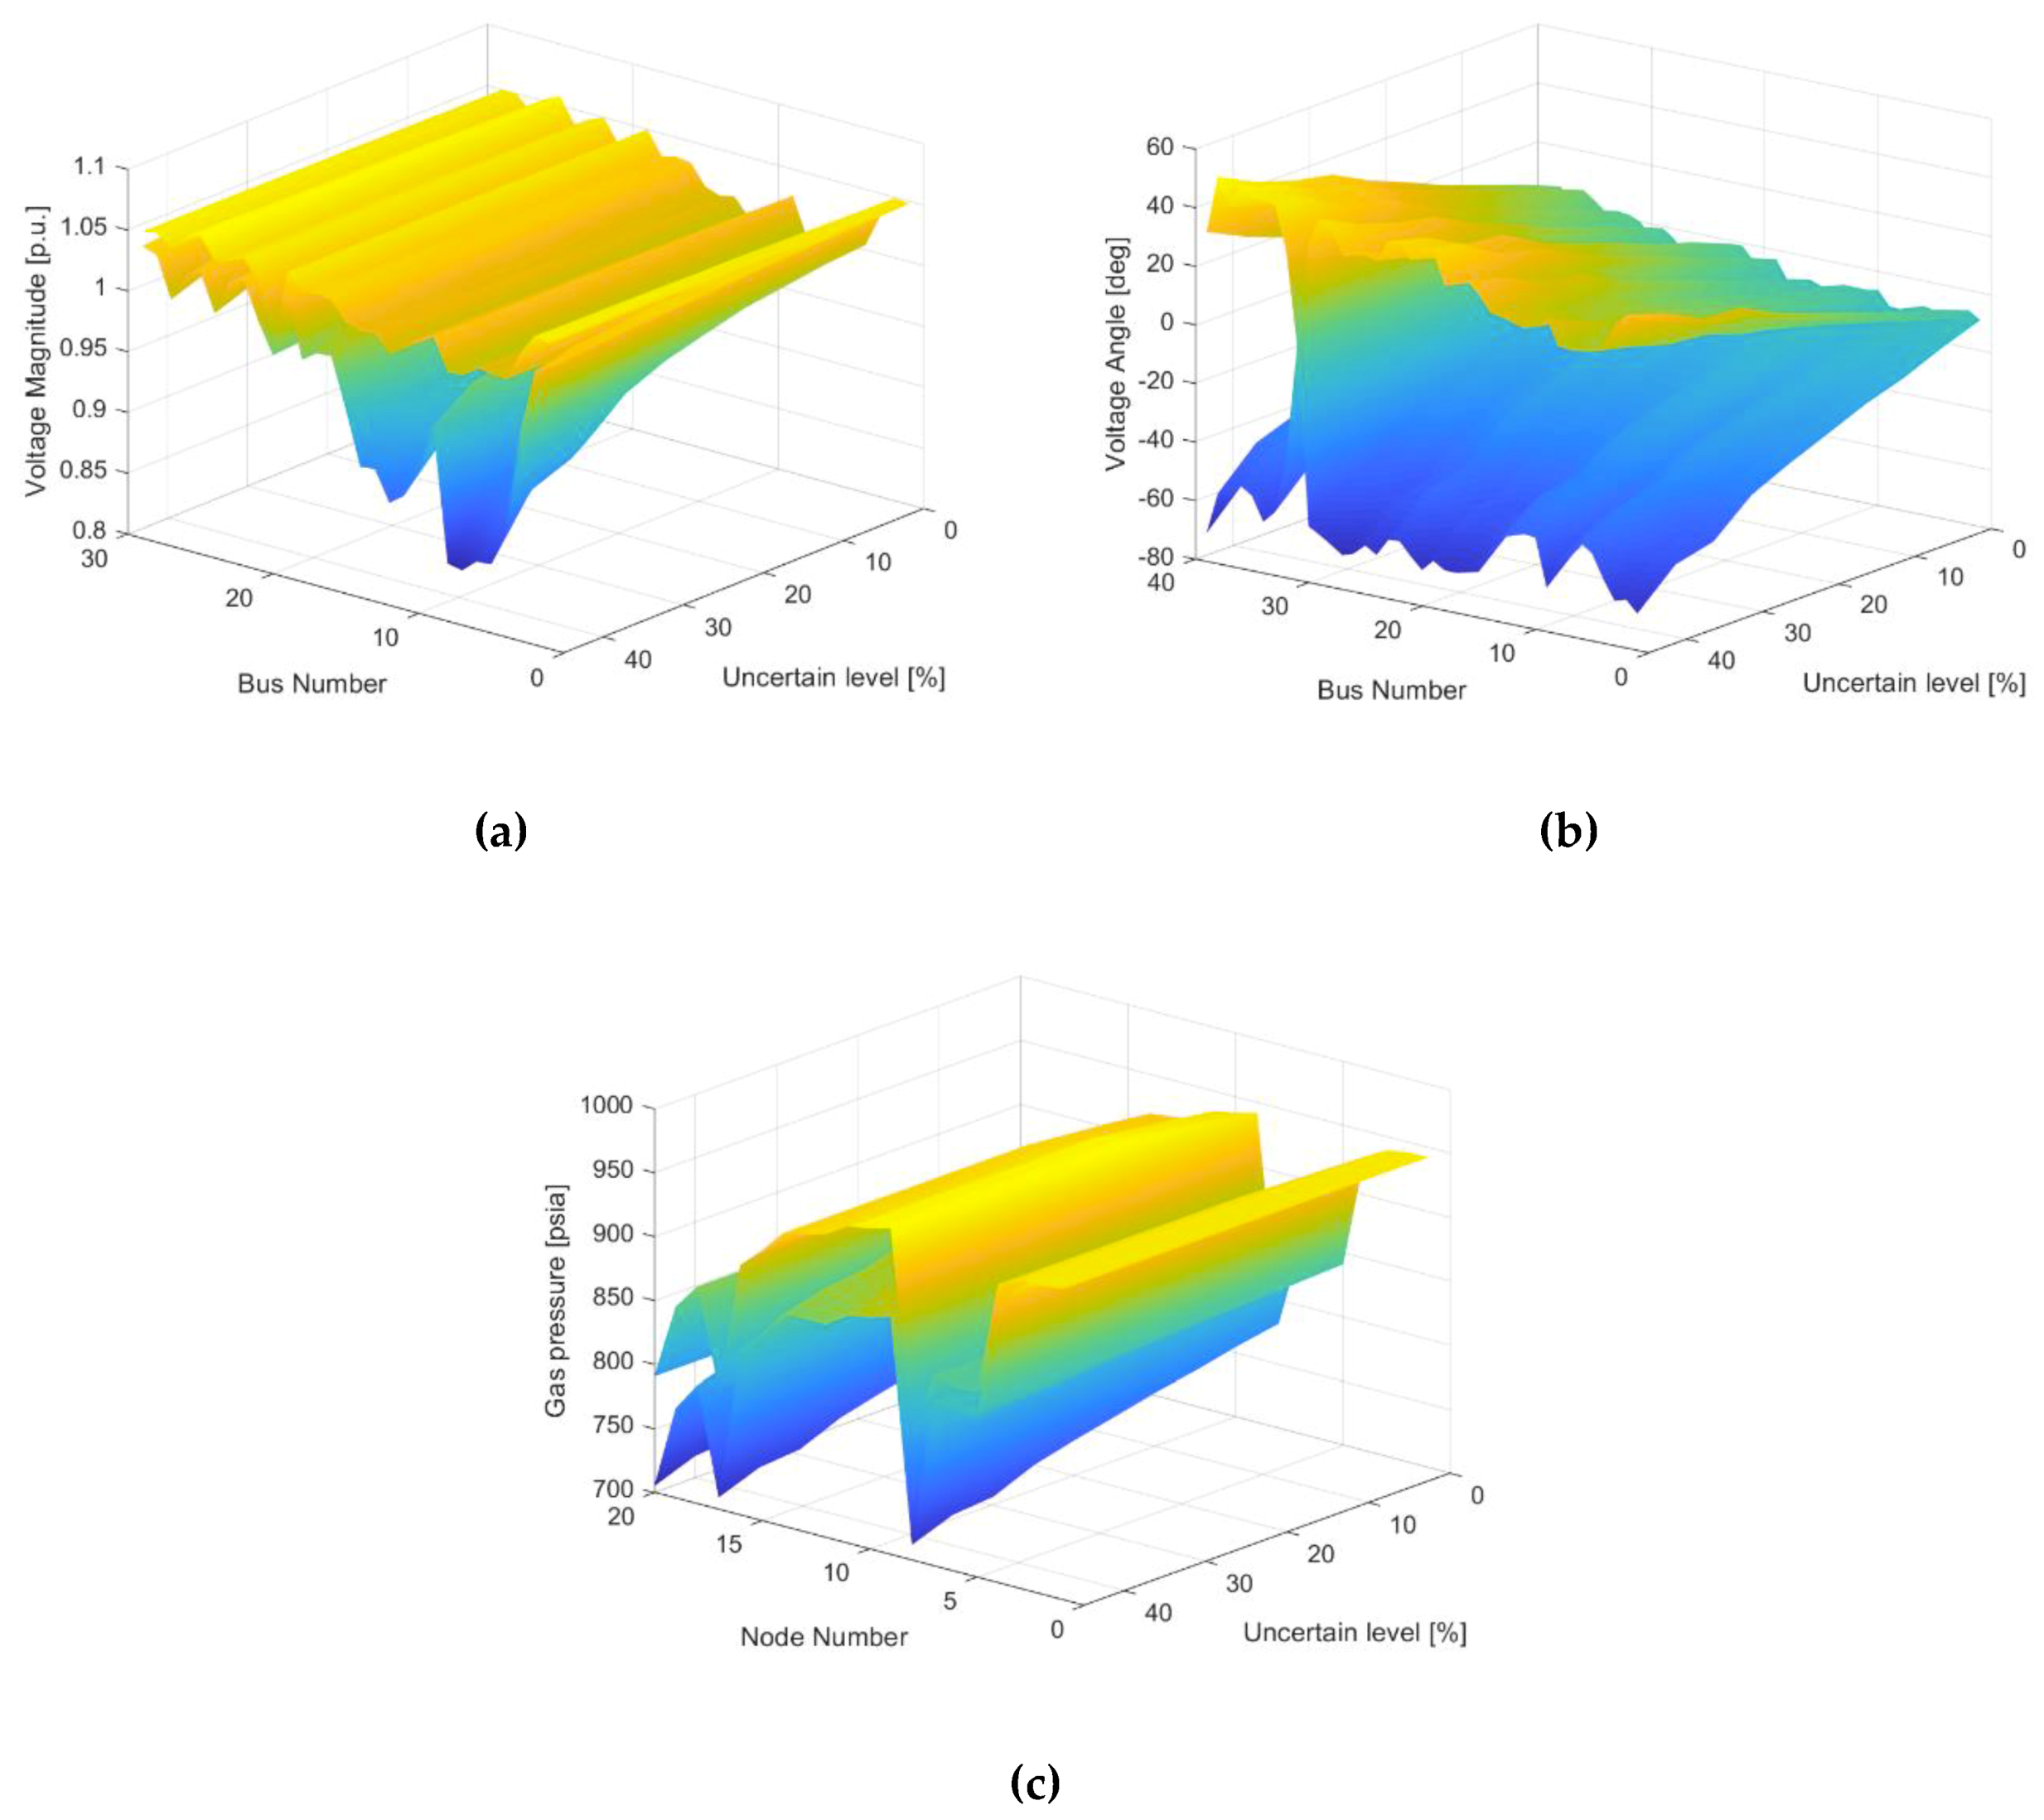
This part is aimed at the stability of the whole system when the uncertainty of a certain variable increases. Take Scenario 2, for example: the uncertainty level of electrical load is ± 5%. Here, ± W% is expressed as the uncertainty level of electrical load, and the value of W is gradually increased to analyze the convergence of the proposed approach. As the variation of electrical load expands, the interval breadth of results becomes larger. Figure 7 shows [U], [δ], and [v] of uncertain energy flow when W is increased. It can be seen that as the W% increases, the convergence of the solution changes. When W is just over 40, the solution of uncertain energy flow becomes divergent. As bus 31 is the slack bus, and bus 30, 32–39 are PV buses, the voltage magnitudes of these nodes have the same value when W increases, which is no longer shown in Figure 7a. The voltage angle of bus 31 in Figure 7b and the gas pressure of node 1 in Figure 7c will remain unchanged when W changes, as bus 31 in the power system and node 1 in the gas system are slack nodes.
As the variation of electrical load becomes larger, the lower bound of power output in bus 31 will be 0. So, the gas-fired turbine in bus 31 will not deliver power, which means the turbine will stop operating. The gas consumption will not change at node 12 in the gas system. Therefore, the upper bound of gas pressure in the gas system will not change, while its lower bound will still change in Figure 7c.

5. Conclusions

In this paper, an interval energy flow model considering uncertainties is built based on the steady-state energy flow model. The uncertainties include variation of electrical load, power generation, and gas load that may occur in the IENGS. To solve this model, the Krawczyk–Moore interval iterative method is used to calculate energy flow, and affine mathematics is applied in the calculation process to get less conservative solutions. The case study shows the effectiveness of the proposed approach by comparing it with MC simulation. By calculating energy flow in different cases, several conclusions can be made as follows:
  • Uncertainty caused by the power system (variation of electrical load or power generation) will be delivered to the gas system by coupling nodes. Similarly, uncertainty caused by the gas system (variation of gas load) will be delivered to the power system by coupling nodes.
  • Accumulation of uncertainties brought by multiple sources will also will expand the variation of the whole system.
  • Uncertainty on the increase brought by a single source (variation of electrical load, power generation, or gas load) will expand the variation of the whole system.

Author Contributions

Conceptualization, S.W. and S.Y.; Data curation, S.W. and S.Y.; Formal analysis, S.Y.; Funding acquisition, S.W.; Investigation, S.Y.; Methodology, S.W.; Project administration, S.W.; Resources, S.W.; Software, S.Y.; Supervision, S.W.; Validation, S.Y.; Writing—original draft, S.Y.; Writing—review & editing, S.W.

Funding

This research received no external funding.

Conflicts of Interest

The authors declare no conflict of interest.

References

  1. Henderson, M.; Shahidehpour, M. Continuing to grow: natural gas usage rising in electricity generation. IEEE Power Energy Mag. 2014, 12, 12–19. [Google Scholar] [CrossRef]
  2. Chen, S.; Wei, Z.; Sun, G.; Sun, Y.; Zang, H.; Zhu, Y. Optimal power and gas flow with a limited number of control actions. IEEE Trans. Smart Grid 2018, 9, 5371–5380. [Google Scholar] [CrossRef]
  3. Shabanpour-Haghighi, A.; Seifi, A.R. An integrated steady-state operation assessment of electrical, natural gas, and district heating networks. IEEE Trans. Power Syst. 2016, 31, 3636–3647. [Google Scholar] [CrossRef]
  4. Li, Y.; Zou, Y.; Cao, Y.; Tan, Y.; Cao, Y.; Liu, X.; Shahidehpour, M.; Tian, S.; Bu, F. Optimal stochastic operation of integrated low-carbon electric power, natural gas, and heat delivery system. IEEE Trans. Sustain. Energy 2018, 9, 273–283. [Google Scholar] [CrossRef]
  5. Chen, S.; Wei, Z.; Sun, G.; Cheung, K.W.; Wang, D. Identifying optimal energy flow solvability in electricity-gas integrated energy systems. IEEE Trans. Sustain. Energy 2017, 8, 846–854. [Google Scholar] [CrossRef]
  6. Wang, C.; Wei, W.; Wang, J.; Bai, L.; Liang, Y.; Bi, T. Convex optimization based distributed optimal gas-power flow calculation. IEEE Trans. Sustain. Energy 2018, 9, 1145–1156. [Google Scholar] [CrossRef]
  7. Ding, T.; Hu, Y.; Bie, Z. Multi-Stage stochastic programming with nonanticipativity constraints for expansion of combined power and natural gas systems. IEEE Trans. Power Syst. 2018, 33, 317–328. [Google Scholar] [CrossRef]
  8. Shao, C.; Shahidehpour, M.; Wang, X.; Wang, B. Integrated planning of electricity and natural gas transportation systems for enhancing the power grid resilience. IEEE Trans. Power Syst. 2017, 32, 4418–4429. [Google Scholar] [CrossRef]
  9. Qiu, J.; Dong, Z.Y.; Zhao, J.H.; Meng, K.; Zheng, Y.; Hill, D.J. Low carbon oriented expansion planning of integrated gas and power systems. IEEE Trans. Power Syst. 2015, 30, 1035–1046. [Google Scholar] [CrossRef]
  10. Zhao, B.; Conejo, A.J.; Sioshansi, R. Coordinated expansion planning of natural gas and electric power systems. IEEE Trans. Power Syst. 2018, 33, 3064–3075. [Google Scholar] [CrossRef]
  11. Gil, M.; Dueñas, P.; Reneses, J. Electricity and natural gas interdependency: comparison of two methodologies for coupling large market models within the European regulatory framework. IEEE Trans. Power Syst. 2016, 31, 361–369. [Google Scholar] [CrossRef]
  12. Qiu, J.; Zhao, J.; Yang, H.; Dong, Z.Y. Optimal Scheduling for prosumers in coupled transactive power and gas systems. IEEE Trans. Power Syst. 2018, 33, 1970–1980. [Google Scholar] [CrossRef]
  13. Massrur, H.R.; Niknam, T.; Aghaei, J.; Shafie-khah, M.; Catalão, J.P.S. Fast decomposed energy flow in large-scale integrated electricity–gas–heat energy systems. IEEE Trans. Sustain. Energy 2018, 9, 1565–1577. [Google Scholar] [CrossRef]
  14. Martinez-Mares, A.; Fuerte-Esquivel, C.R. A unified gas and power flow analysis in natural gas and electricity coupled networks. IEEE Trans. Power Syst. 2012, 27, 2156–2166. [Google Scholar] [CrossRef]
  15. Xu, X.; Jia, H.; Chiang, H.D.; Yu, D.C.; Wang, D. Dynamic modeling and interaction of hybrid natural gas and electricity supply system in microgrid. IEEE Trans. Power Syst. 2015, 30, 1212–1221. [Google Scholar] [CrossRef]
  16. Zeng, Q.; Fang, J.; Li, J.; Chen, Z. Steady-state analysis of the integrated natural gas and electric power system with bi-directional energy conversion. Appl. Energy 2016, 184, 1483–1492. [Google Scholar] [CrossRef]
  17. Kuczyński, S.; Łaciak, M.; Olijnyk, A.; Szurlej, A.; Wlodek, T. Techno-economic assessment of turboexpander application at natural gas regulation stations. Energies 2019, 12, 755. [Google Scholar] [CrossRef]
  18. Borelli, D.; Devia, F.; Brunenghi, M.M.; Schenone, M.; Spoladore, A. Waste energy recovery from natural gas distribution Network: CELSIUS Project Demonstrator in Genoa. Sustainability 2015, 7, 16703–16719. [Google Scholar] [CrossRef]
  19. Liu, X.; Mancarella, P. Modelling, assessment and Sankey diagrams of integrated electricity-heat-gas networks in multi-vector district energy systems. Appl. Energy 2016, 167, 336–352. [Google Scholar] [CrossRef]
  20. Shabanpour-Haghighi, A.; Seifi, A.R. Simultaneous integrated optimal energy flow of electricity, gas, and heat. Energy Conver. Manag. 2015, 101, 579–591. [Google Scholar] [CrossRef]
  21. Pan, Z.; Guo, Q.; Sun, H. Interactions of district electricity and heating systems considering time-scale characteristics based on quasi-steady multi-energy flow. Appl. Energy 2016, 167, 230–243. [Google Scholar] [CrossRef]
  22. Erdener, B.C.; Pambour, K.A.; Lavin, R.B.; Dengiz, B. An integrated simulation model for analysing electricity and gas systems. Int. J. Electr. Power Energy Syst. 2014, 61, 410–420. [Google Scholar] [CrossRef]
  23. Ghanaatian, M.; Lotfifard, S. Control of flywheel energy storage systems in the presence of uncertainties. IEEE Trans. Sustain. Energy 2019, 10, 36–45. [Google Scholar] [CrossRef]
  24. Niloofar, G.; Shabestari, M.; Parisa, M.; Ali, M.; Subhashish, B. State-space modeling and reachability analysis for a dc microgrid. In Proceedings of the Applied Power Electronics Conference and Exposition (APEC) 2019, Anaheim, CA, USA, 7–8 February 2019. [Google Scholar]
  25. Gharibpour, H.; Monsef, H.; Ghanaatian, M. The comparison of two control methods of power swing reduction in power system with UPFC compensator. In Proceedings of the 20th Iranian Conference on Electrical Engineering (ICEE2012), Tehran, Iran, 15–17 May 2012. [Google Scholar] [CrossRef]
  26. Luo, J.; Shi, L.; Ni, Y. A solution of optimal power flow incorporating wind generation and power grid uncertainties. IEEE Access 2018, 6, 1. [Google Scholar] [CrossRef]
  27. Chen, S.; Wei, Z.; Sun, G.; Cheung, K.W.; Sun, Y. Multi-linear probabilistic energy flow analysis of integrated electrical and natural-gas systems. IEEE Trans. Power Syst. 2017, 32, 1970–1979. [Google Scholar] [CrossRef]
  28. Ding, T.; Bo, R.; Li, F.; Guo, Q.; Sun, H.; Gu, W.; Zhou, G. Interval power flow analysis using linear relaxation and optimality-based bounds tightening (OBBT) methods. IEEE Trans. Power Syst. 2015, 30, 177–188. [Google Scholar] [CrossRef]
  29. Wang, Z.; Alvarado, F.L. Interval arithmetic in power flow analysis. IEEE Trans. Power Syst. 1992, 7, 1341–1349. [Google Scholar] [CrossRef]
  30. Qiao, Z.; Guo, Q.; Sun, H.; Pan, Z.; Liu, Y.; Xiong, W. An interval gas flow analysis in natural gas and electricity coupled networks considering the uncertainty of wind power. Appl. Energy 2017, 201, 343–353. [Google Scholar] [CrossRef]
  31. Li, Q.; An, S.; Gedra, T.W. Solving natural gas load flow problems using electric load flow techniques. In Proceedings of the North American Power Symposium, Rolla, MO, USA, 14–16 September 2003. [Google Scholar]
  32. Moore, R.E. Methods and Applications of Interval Analysis; Society for Industrial and Applied Mathematics: Philadelphia, PA, USA, 1979; ISBN 0-89871-161-4. [Google Scholar]
  33. Mori, H.; Yuihara, A. Calculation of multiple power flow solutions with the Krawczyk method. In Proceedings of the 1999 IEEE International Symposium on Circuits and Systems VLSI, Orlando, FL, USA, 30 May–2 June 1999. [Google Scholar] [CrossRef]
  34. Ding, T.; Cui, H.; Gu, W.; Wan, Q. An uncertainty power flow algorithm based on interval and affine arithmetic. Autom. Electr. Power Syst. 2012, 36, 51–55. [Google Scholar] [CrossRef]
  35. Ding, T.; Li, F.; Li, X.; Sun, H.; Bo, R. Interval radial power flow using extended DistFlow formulation and Krawczyk iteration method with sparse approximate inverse preconditioner. IET Gener. Transm. Distrib. 2015, 9, 1998–2006. [Google Scholar] [CrossRef]
  36. Figueiredo, D.; Henrique, L.; Jorge, S. Affine arithmetic: concepts and applications. Numer. Algorithms 2004, 37, 147–158. [Google Scholar] [CrossRef]
  37. Wang, S.; Han, L.; Wu, L. Uncertainty tracing of distributed generations via complex affine arithmetic based unbalanced three-phase power flow. IEEE Trans. Power Syst. 2015, 30, 3053–3062. [Google Scholar] [CrossRef]
  38. Wolf, D.; Smeers, Y. The gas transmission problem solved by an extension of the simplex algorithm. Manag. Sci. 2000, 46, 1454–1465. [Google Scholar] [CrossRef]
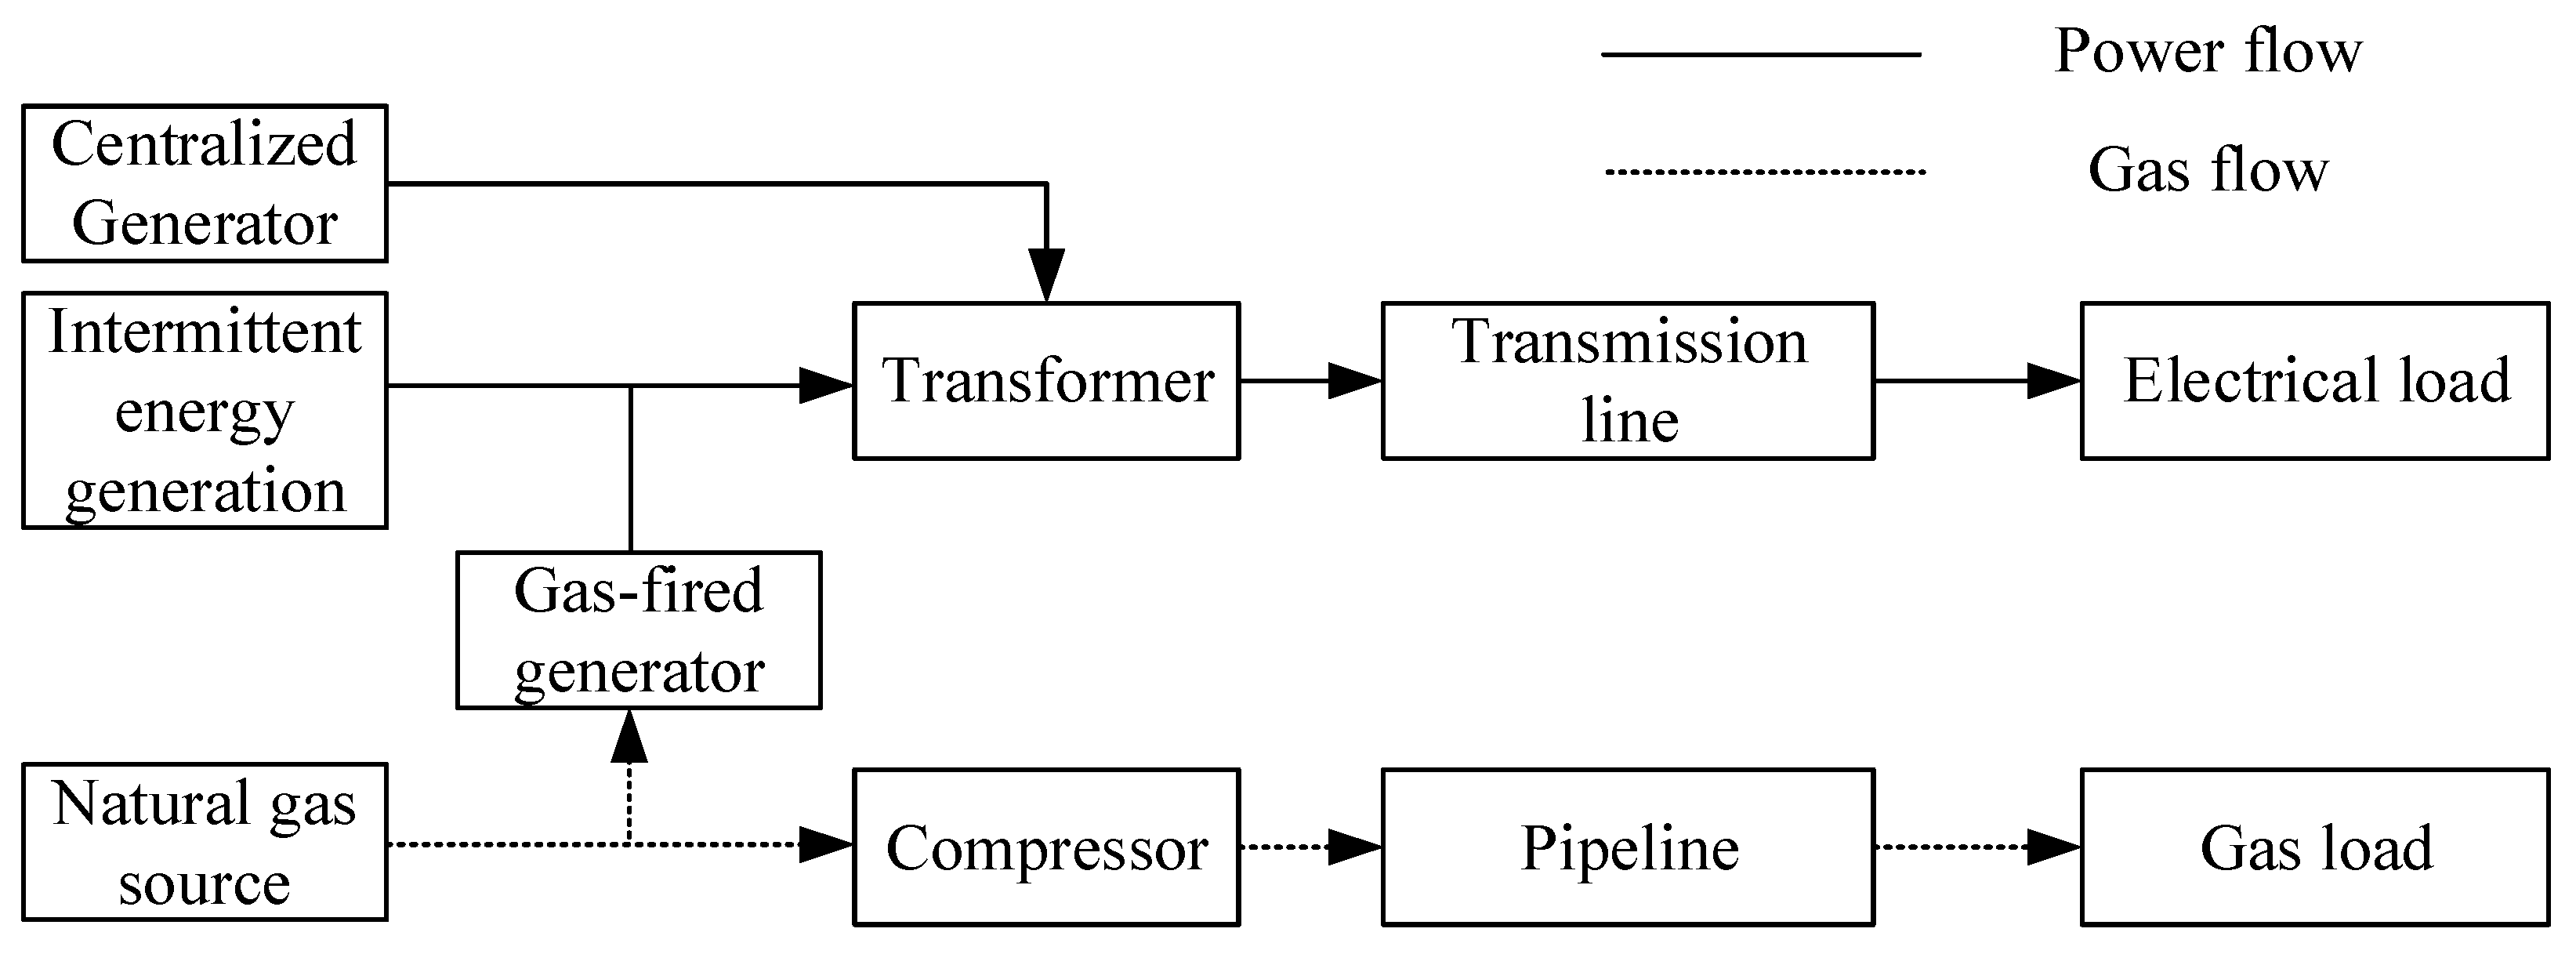
Figure 1. Integrated electrical and natural-gas systems.
Energies 12 02043 g001
Figure 2. Flow chart of interval energy flow calculation.
Energies 12 02043 g002
Figure 3. IENGS composed by IEEE 39-bus system and 20-node gas system.
Energies 12 02043 g003
Figure 4. Energy flow solution of Scenario 1 and Scenario 2 by proposed approach and MC simulation. (a) Voltage magnitude solution; (b) voltage angle solution; (c) gas pressure solution.
Energies 12 02043 g004
Figure 5. Energy flow solution of Scenario 2, Scenario 3, Scenario 4, and Scenario 5 by proposed approach. (a) Voltage magnitude solution; (b) voltage angle solution; (c) gas pressure solution.
Energies 12 02043 g005
Figure 6. Solutions of interval length ratio in Scenarios 2, 3, and 4. (a) Voltage magnitude ratio; (b) voltage angle ratio; (c) gas pressure ratio.
Energies 12 02043 g006aEnergies 12 02043 g006b
Figure 7. Convergence of interval solutions when uncertainty level is increased. (a) Voltage magnitude solution; (b) voltage angle solution; (c) gas pressure solution.
Energies 12 02043 g007
Table 1. Comparison between power system and gas system.
TermsPower SystemNatural-Gas System
ElementLine
Transformer
Pipeline
Compressor
VariableAmplitude, Phase angle
Active power, Reactive power
Pressure
Injection
Node typePQ bus, PV bus
Slack bus
Known injection node
Known pressure node
Table 2. Gas source and load information.
NodeSource (MSCF3/Hour)Load (MSCF3/Hour)
121.6130
29.6320
305.7666
400
50.5620
605.9358
707.7339
829.64660
900
1009.3672
1100
1203.1194
135.28240
142.07030
15010.1764
16014.978
1700
1800
190.30160
2002.8237
Table 3. Parameters of gas-fired generators.
NumberPower BusGas Nodeαβγ
1304070
23112070
33416070
Table 4. Power flow solution of Scenario 1 and Scenario 2 by proposed approach and MC simulation.
BusCertain Power Flow Results of Scenario 1Interval Power Flow Results by Proposed Approach of Scenario 2Interval Power Flow Results by MC Simulation of Scenario 2
Uδ[U][δ][U][δ]
41.0038−10.6546[1.0007, 1.0059][−15.0646, −6.4446][1.0012, 1.0052][−14.2234, −7.3382]
91.0281−11.2997[1.0261, 1.0294][−16.1506, −6.7488][1.0265, 1.0289][−15.2939, −7.4510]
131.0142−7.0959[1.0116, 1.0161][−11.1179, −3.2738][1.0119, 1.0154][−10.3979, −4.0105]
181.0313−9.6156[1.0299, 1.0326][−14.7713, −4.6599][1.0303, 1.0322][−13.9605, −5.6291]
231.0450−1.1221[1.0441, 1.0455][−6.4243, 3.8801][1.0446, 1.0453][−5.6517, 3.0626]
271.0379−8.9173[1.0367, 1.0392][−14.2173, −3.9173][1.0370, 1.0388][−13.4650, −4.7830]
301.0475−4.5918[1.0475, 1.0475][−9.8479, 0.3643][1.0475, 1.0475][−8.9419, −0.5602]
320.98311.6155[0.9831, 0.9831][−2.4121, 5.4430][0.9831, 0.9831][−1.5599, 4.5918]
341.01230.6263[1.0123, 1.0123][−5.3464, 6.1989][1.0123, 1.0123][−4.4250, 5.3869]
Table 5. Gas flow solution of Scenario 1 and Scenario 2 by proposed approach and MC simulation.
NodeCertain Gas Flow Results of Scenario 1Interval Gas Flow Results by Proposed Approach of Scenario 2Interval Gas Flow Results by MC Simulation of Scenario 2
v[v][v]
1942.70[942.70, 942.70][942.70, 942.70]
2942.00[940.72,942.70][941.92,942.08]
4929.82[927.46,932.29][928.66,931.09]
6839.52[837.03,842.12][838.23,840.92]
10937.71[932.22,942.70][933.42,942.32]
12924.09[918.54,929.97][919.74,928.77]
14919.49[914.73,924.37][915.93,923.17]
16885.24[880.34,890.27][881.54,889.07]
18855.54[849.64,861.79][850.84,860.59]