Article

Influence of Permeability and Injection Orientation Variations on Dispersion Coefficient during Enhanced Gas Recovery by CO2 Injection

by
Muhammad Kabir Abba
*,
Athari Al-Otaibi
,
Abubakar Jibrin Abbas
,
Ghasem Ghavami Nasr
and
Martin Burby
Petroleum and Gas Research Group, The University of Salford, Manchester M4 5WT, UK
*
Author to whom correspondence should be addressed.
Energies 2019, 12(12), 2328; https://doi.org/10.3390/en12122328
Submission received: 5 May 2019 / Revised: 12 June 2019 / Accepted: 14 June 2019 / Published: 18 June 2019

Abstract

:
This investigation was carried out to highlight the influence of the variation of permeability of the porous media with respect to the injection orientations during enhanced gas recovery (EGR) by CO2 injection using different core samples of different petrophysical properties. The laboratory investigation was performed using core flooding technique at 1300 psig and 50 °C. The injection rates were expressed in terms of the interstitial velocities to give an indication of its magnitude and variation based on the petrophysical properties of each core sample tested. Bandera Grey, Grey Berea, and Buff Berea sandstone core samples were used with measured permeabilities of 16.08, 217.04, and 560.63 md, respectively. The dispersion coefficient was observed to increase with a decrease in permeability, with Bandera Grey having the highest dispersion coefficient and invariably higher mixing between the injected CO2 and the nascent CH4. Furthermore, this dispersion was more pronounced in the horizontal injection orientation compared to the vertical orientation with, again, the lowest permeability having a higher dispersion coefficient in the horizontal orientation by about 50%. This study highlights the importance of the permeability variation in the design of the injection strategy of EGR and provides a revision of the CO2 plume propagation at reservoir conditions during injection.

1. Introduction

The effects of greenhouse gas (GHG) emissions in the form of global warming with the resulting subsequent climate change cannot be overemphasized. The authors of [1] reported that the most significant of the GHG emissions are carbon dioxide (CO2), methane (CH4), dinitrogen oxide (N2O), and other gases. Amongst all these gases, they iterated that CO2 makes up about 76% of the total global emissions of GHGs. Incidentally, combustion of fossil fuels is the central source of the global CO2 emissions and the oil and gas industry alone accounts for 65% of global CO2 emissions [2]. Furthermore, CO2 emissions from the oil and gas industry is ever increasing as a result of the high energy demand and at a rate of 1.7% per annum between the 1990s and early 2000s, and at an even higher rate of 3.1% per annum between 2000 and 2010 [3]. Therefore, the environmental consequences associated with CO2 emissions have forced researchers in the oil and gas industry to come up with technologies to curb the proliferation of anthropogenic CO2 due to the oil and gas activities. An avenue with a growing potential to address this issue is by the injection of the CO2 emissions into geological formations like oil and gas reservoirs [4] using enhanced oil/gas recovery processes. Enhanced gas recovery (EGR) by CO2 injection and sequestration is a simultaneous process whereby CO2 is injected into a natural gas (CH4) reservoir to displace CH4 and store CO2 in the reservoir.
EGR is still in its pilot/test phase and has not been widely accepted due to the nature of the gas-gas displacement whereby CO2 disperses into CH4 during the process and the recovered CH4 will be heavily contaminated with the injected CO2. This will affect the market value of the recovered CH4 given that one of the reasons for the choice of CH4 reservoirs as potential storage sites is that the recovered natural gas will offset part of the cost of the sequestration process [5]. Therefore, efforts are being made to stall the incessant mixing during EGR, and this is only achievable when the physics of the mixing are better understood. Pivotal to the adoption of the technique is understanding the mechanisms and factors which influence the interaction between the gases in situ, which leads to mixing at reservoir conditions. This will eventually provide an avenue to characterise gas systems for better injection scenarios and explore the potential and the viability of EGR as an adopted method of CO2 sequestration.
In our previous works [6,7,8,9], we studied some of the factors that affect in situ mixing between the injected CO2 and the displaced CH4 which have not been previously considered. These factors include the connate water salinity, the injection orientation and, also, the flow behaviour of CO2 in its supercritical state during EGR displacement. This research, however, focuses on the effect of injection orientation of the CO2 on the dispersion of the gas in consolidated sandstone cores with an emphasis on permeability variation. The injection orientation determines the path of the CO2 plume propagation through the pore spaces of the reservoir rock, which is also very important when it comes to the dip angle between the injector and producer wells. Consistent with our previous results, horizontal injections showed that the segregation of CO2 to the bottom of the core sample—due to its higher density of supercritical CO2 compared to that of CH4 (showed in Figure 1)—led to higher residence time of the CO2 traversing the length of the core sample, thereby increasing CO2 dispersion. Invariably, dispersion in the vertical injection orientation of the CO2 was significantly less than that in the horizontal orientation.
The authors of [10] carried out a horizontal dispersion of CO2 in CH4 in sand packs as the porous medium and also concluded that gravity plays a significant role in the dispersion of CO2 during displacement applications. Their study included long and short sand packs with similar permeabilities, while here, different consolidated core samples with different petrophysical properties and equal length were employed to ascertain the effects of their variation on dispersion. The reasoning behind the use of equal length core samples was to minimise systemic disparities in our measurements. Given that permeability is a function of length, the pore structure variation which is responsible for the permeability difference between the core sample was explored, and the interplay between the core sample and the gases was evaluated. Therefore, the variation of the injection orientation and permeability was analysed to showcase their influence on dispersion coefficient.

2. Materials and Methods

The core samples were obtained from Kocurek Industries USA whose petrophysical properties are shown in Table 1. Gas permeability was obtained using a core flooding and the porosity was evaluated using Helium Porosimetry. Research grade CO2 and CH4 were obtained from BOC UK both with purity of >99.999%.

Apparatus and Procedure

(1) Porosity and permeability measurements
The Helium Porosimeter PORG 200™ (Corelab, OK, USA and Gas Permeater PERG 200 ™ (Corelab, OK, USA) were used to measure the porosity and permeability of the core samples respectively. Details of the equipment description, principles of operation, and procedure can be found in our previous works [8]. The results are shown in Table 2.
(2) Core flooding
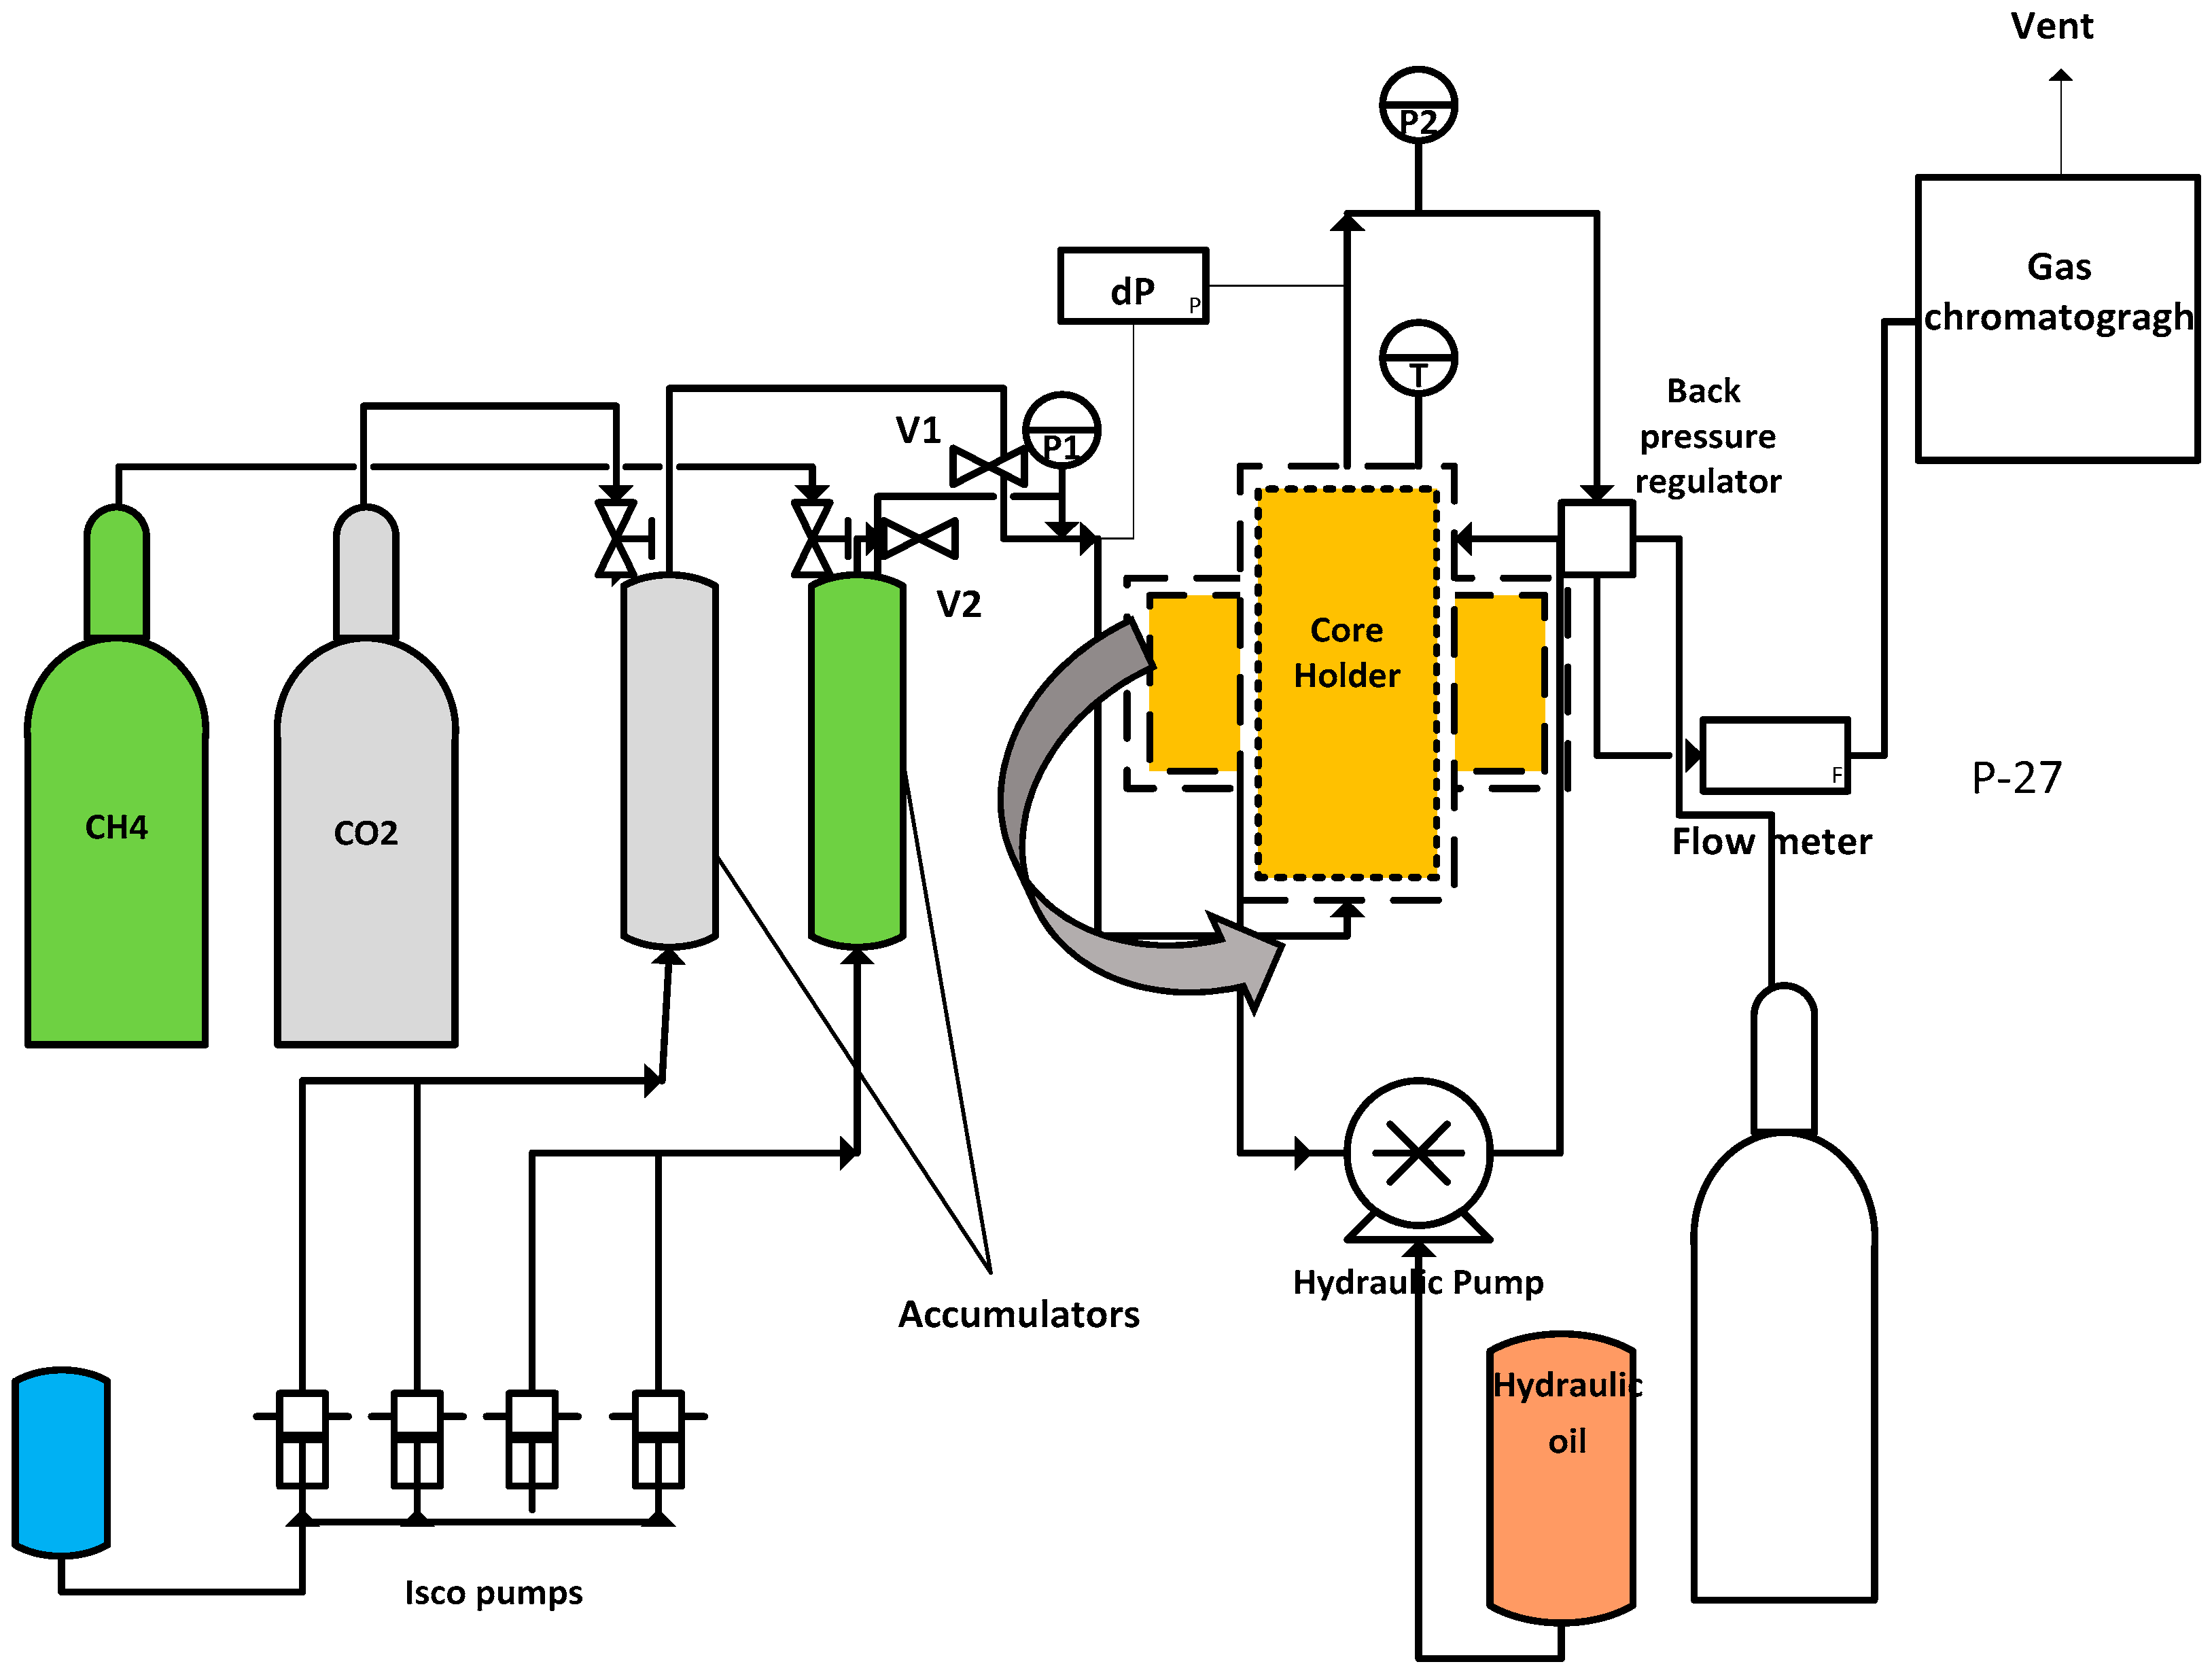
Core flooding equipment, also from CoreLab Oklahoma, UFS 200 (details are presented in [7]), was used in this work. It simulated the displacement of CH4 by supercritical CO2 at reservoir conditions. The core holder was originally horizontally orientated; however, a stand was constructed to change this orientation to vertical in order to vary the injection orientation. The same procedure was adopted as the one employed in [9], the only difference being in the using different core samples of different permeabilities and porosities. The schematics of the setup are shown in Figure 2. After carrying out the same experiments at the same conditions in the horizontal orientation for each core sample, the core holder was installed vertically, and the same experiments were repeated using the same conditions as in the previous horizontal experiments.
Injection was made from the bottom of the core holder in the vertical orientation. The injection orientation adopted in this study was not based on the dip angle of injection during the flooding and recovery processes. The experiments were not field scale depictions of the injection strategy, rather, we were looking at core to pore scale investigation of the flow physics of CO2 plume as it displaces nascent CH4. Central to the experiments was the interaction and mixing between CO2 in its supercritical state and the CH4 in the reservoir given that the CO2 plume occupies the lower echelon of the CH4 zone due to its higher density at supercritical condition as we have iterated in our previous works. Vertical and horizontal flows of the CO2 plume are the two extreme flow conditions in terms of propagation direction.
(3) Data analysis
A single parameter diffusion equation was used by [11] in the description of the longitudinal dispersion coefficient for gas flow in porous media which is shown in Equation (1):
K l 2 C x 2 u C x = C t ,
where C-CO2 concentration at time t, location x, Kl—the longitudinal dispersion coefficient, and u is the interstitial velocity. The dimensionless for of Equation (1) is written as
1 P e 2 C x D 2 C x D = C t D ,
where each parameter is defined in Table 3.
This one-dimensional advection–dispersion (ADE) equation was used to measure/evaluate, analytically, the longitudinal dispersion of CO2 into CH4 using the solution of the equation and also assuming that the dispersion coefficient and interstitial velocity of the displacing species are not affected by the concentration. With the following boundary conditions, the initial condition— C = 0   at   t D = 0 , boundary conditions— C = 1   at   x D = 0 ,   C 0   as   x D , the dimensionless solution to (Equation (1)) thus becomes [12,13,14]
C = 1 2 { e r f c   ( x D t D 2 t D / P e ) + e P e x D e r f c ( x D + t D 2 t D / P e ) } .
Using the obtained concentration profiles from core flooding experiments, Equation (3) was used to fit the results from the experiments and the dispersion coefficient was obtained analytically using the least squares regression method with the dispersion coefficient as the fitting parameter.
Perkins and Johnston (1963) described the medium Péclet number denoted by Pex, which defines the displacement mechanism that is dominant in gas dispersion in porous media as
P e x = u m d D ,
where D—diffusion coefficient (m2/s), Pem—medium Péclet number, um—mean interstitial velocity (m/s), and d is the characteristic length scale of mixing in the porous medium. Largely, at the values of Pem < 0.1, diffusion mixing dominates and, equally, at Pex > 10, advective mixing dominates during the gas dispersion process. In this range of Pex, [15] related diffusion to dispersion coefficients as presented in (Equation (6)):
K l D = 1 τ + α u m n D ,
where α represents the dispersivity of the porous medium in m, τ is the tortuosity of the porous medium, and n is an exponent.
Additionally, [16,17,18] reported a correlation between the molecular diffusion coefficient, pressure, and temperature to obtain accurate diffusivity at conditions relevant to EGR as follows:
D = ( 4.3844 × 10 13 p + 8.55440 × 10 11 ) T 1.75 p ,
where D (m2/s) is the molecular diffusion coefficient of CO2 in CH4 pressure p (MPa) and at temperature T (K).

3. Results and Discussion

The core flooding experiments were carried out at 1300 psig, and 50 °C in both vertical and horizontal orientations for each core sample. The interstitial velocities were varied according to individual core samples given their different porosities. A range of interstitial velocities was based on the injection rates in our previous work [8], which were evaluated using Equation (7):
u = Q ϕ A ,
where Q—injection rate in m3/s, A—cross-sectional area of core sample, and φ—porosity of core sample. The results are shown in Table 4.
Accordingly, the results of each individual core sample will be presented, discussed, and analysed based on the injection orientation and the interstitial velocity. Grey Berea core sample will be presented first, followed by Bandera Grey and, finally, Buff Berea.
The mole fractions of the injected CO2 were used to develop the concentration profile which assesses rate of mixing between the injected CO2 and the CH4, in situ, using Equation (3) to fit the equation to the experimental data and varying KL, which is the longitudinal dispersion coefficient (keeping the interstitial velocity constant as assumed in the 1D ADE), until the analytical solution fits the experimental results. The Lexp was also adjusted in the regression to provide a good fit as carried out by [16] and adopted by [17]. Least square regression analysis was the method used in the curve fitting process.
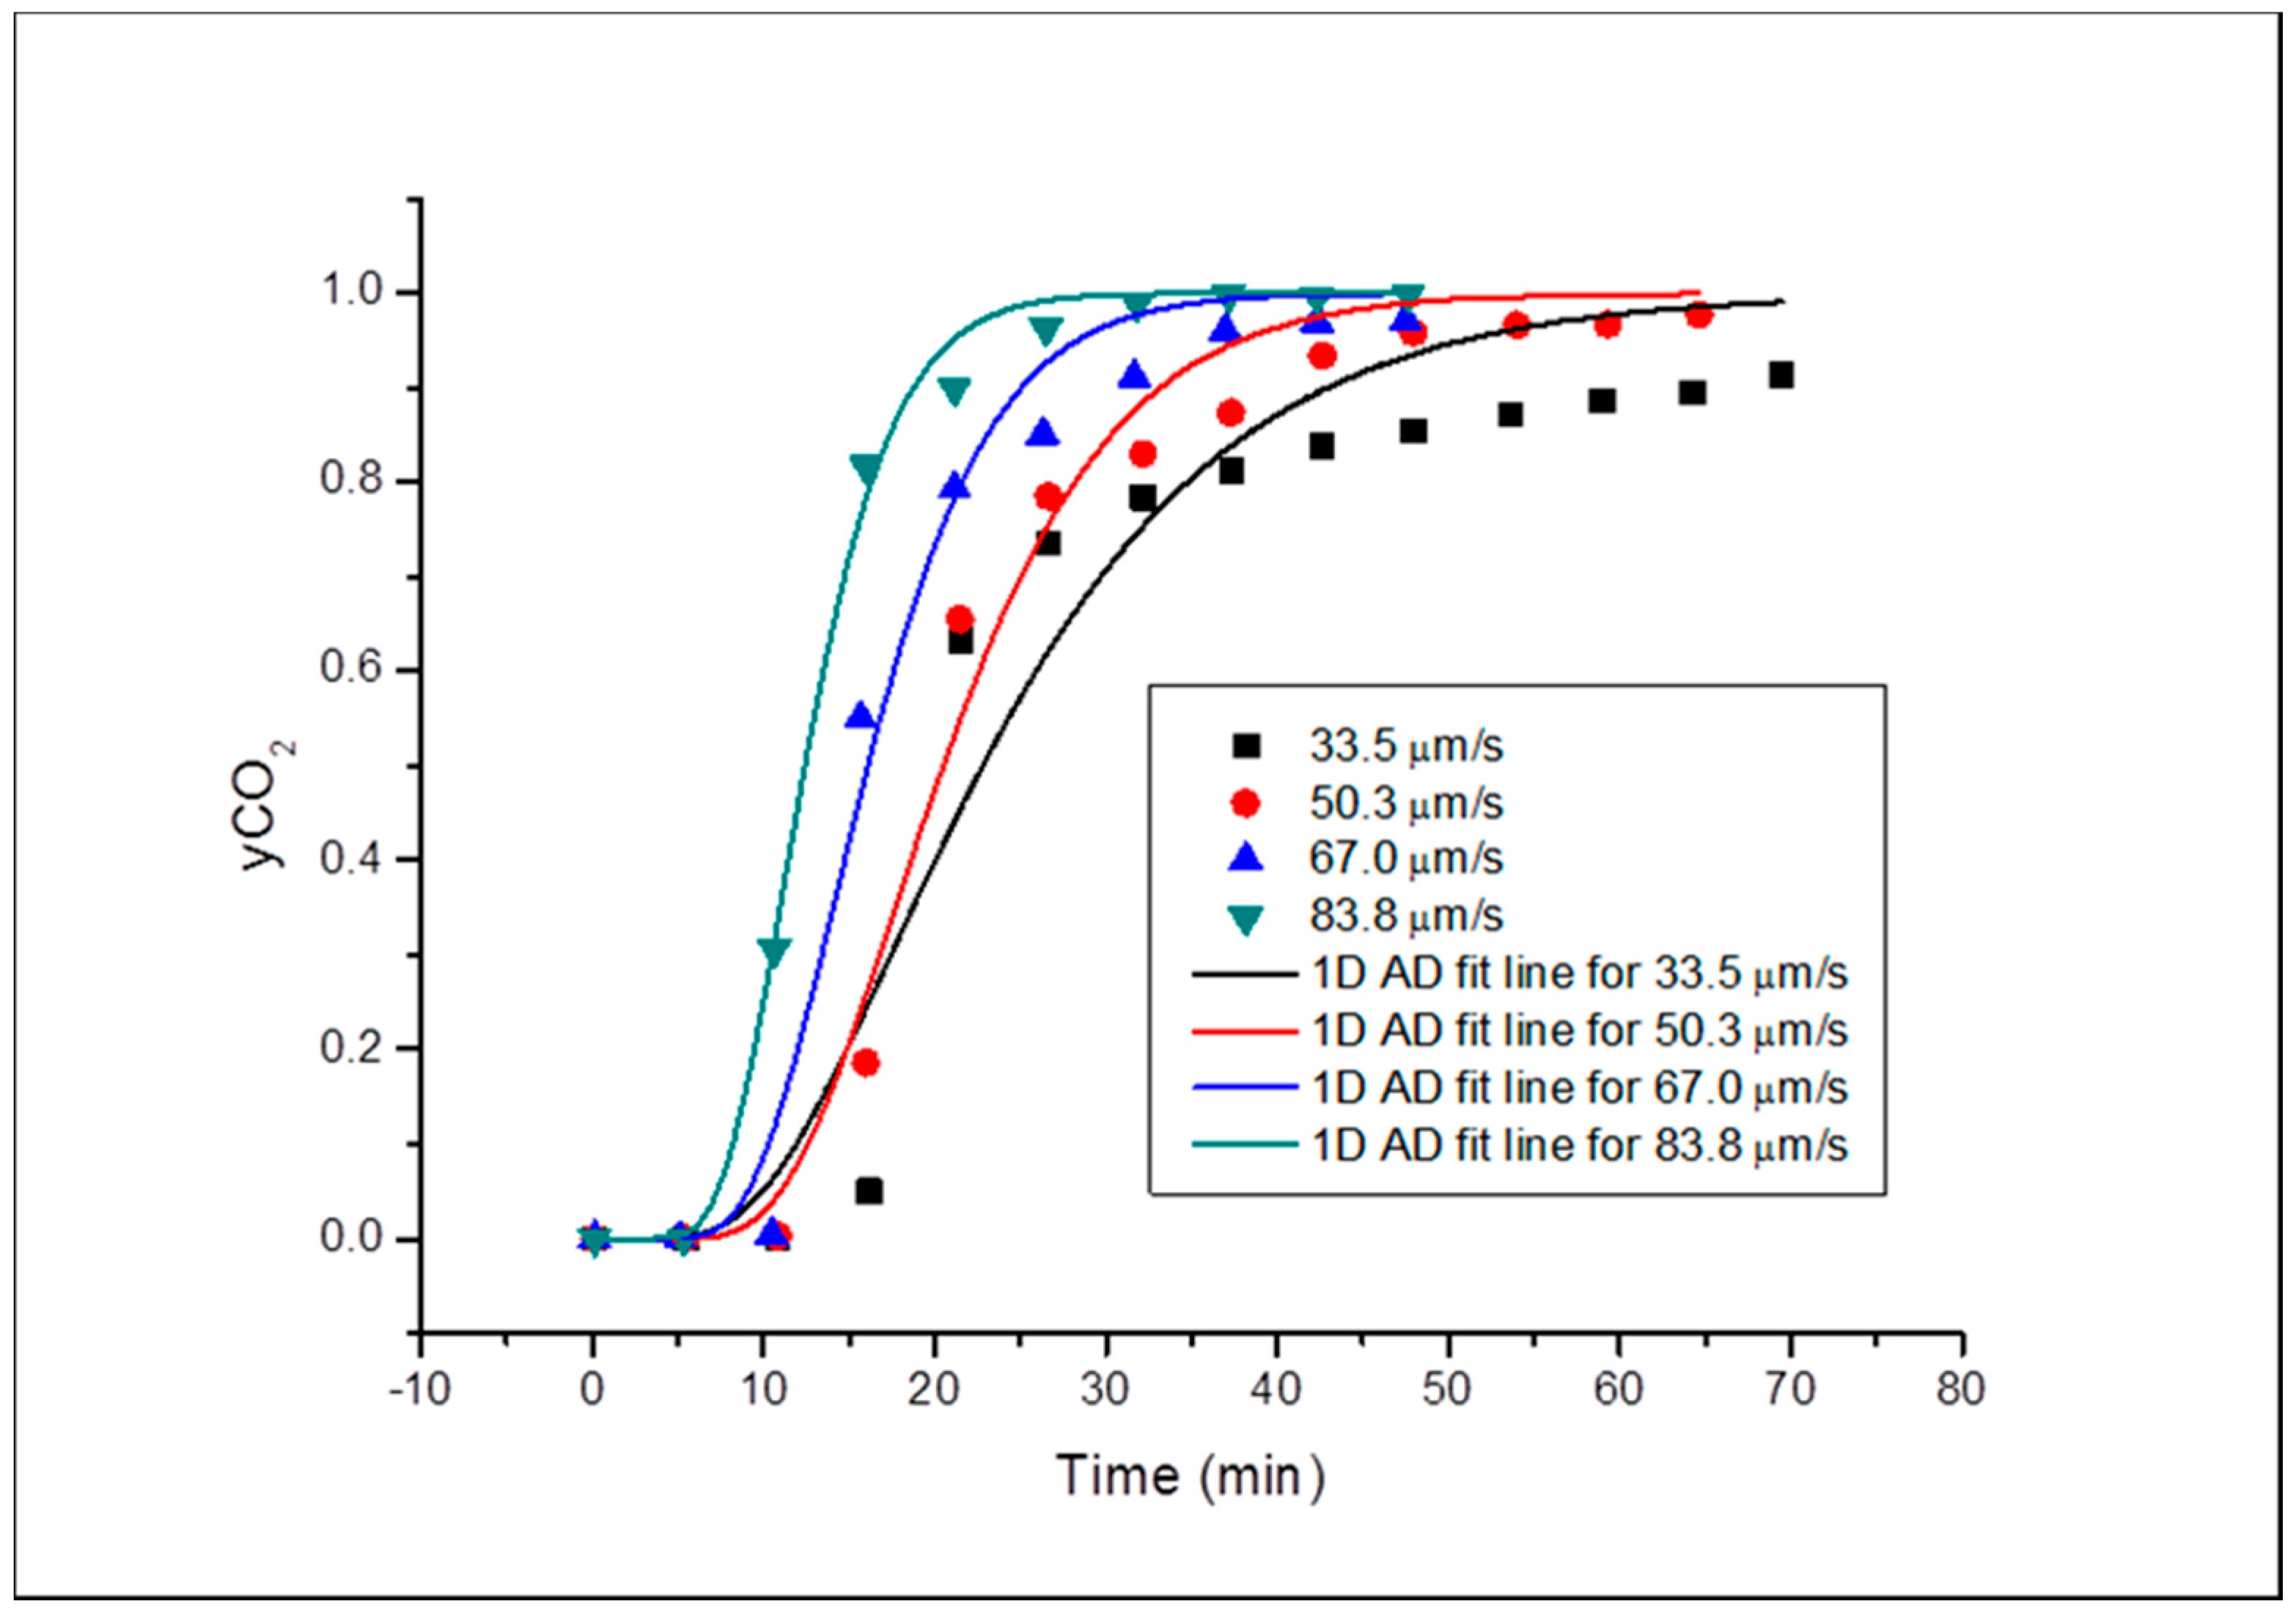
Curve fitting was carried out using OriginPro 8 software and the curve-fitted concentration profiles for each u for Grey Berea core sample are shown in Figure 3 and Figure 4 for horizontal and vertical orientation respectively. The dispersion coefficients were evaluated, and it was shown that the KL increases with increase in the interstitial velocity. This was done for all core samples and injection orientation experiments in this investigation. There was early breakthrough at higher values of u run and a late breakthrough at lower values as expected in all the core samples. The fitting of the 1D ADE to the experimental results was meagre as a result of systemics like entry and exit effects as described in the works of [17]. This was noted for all the runs in the entire experiments. However, these do not affect the evaluation of the parameter i.e., dispersion coefficient. For all subsequent experiments, these systemic effects were noticed and are presented as such.
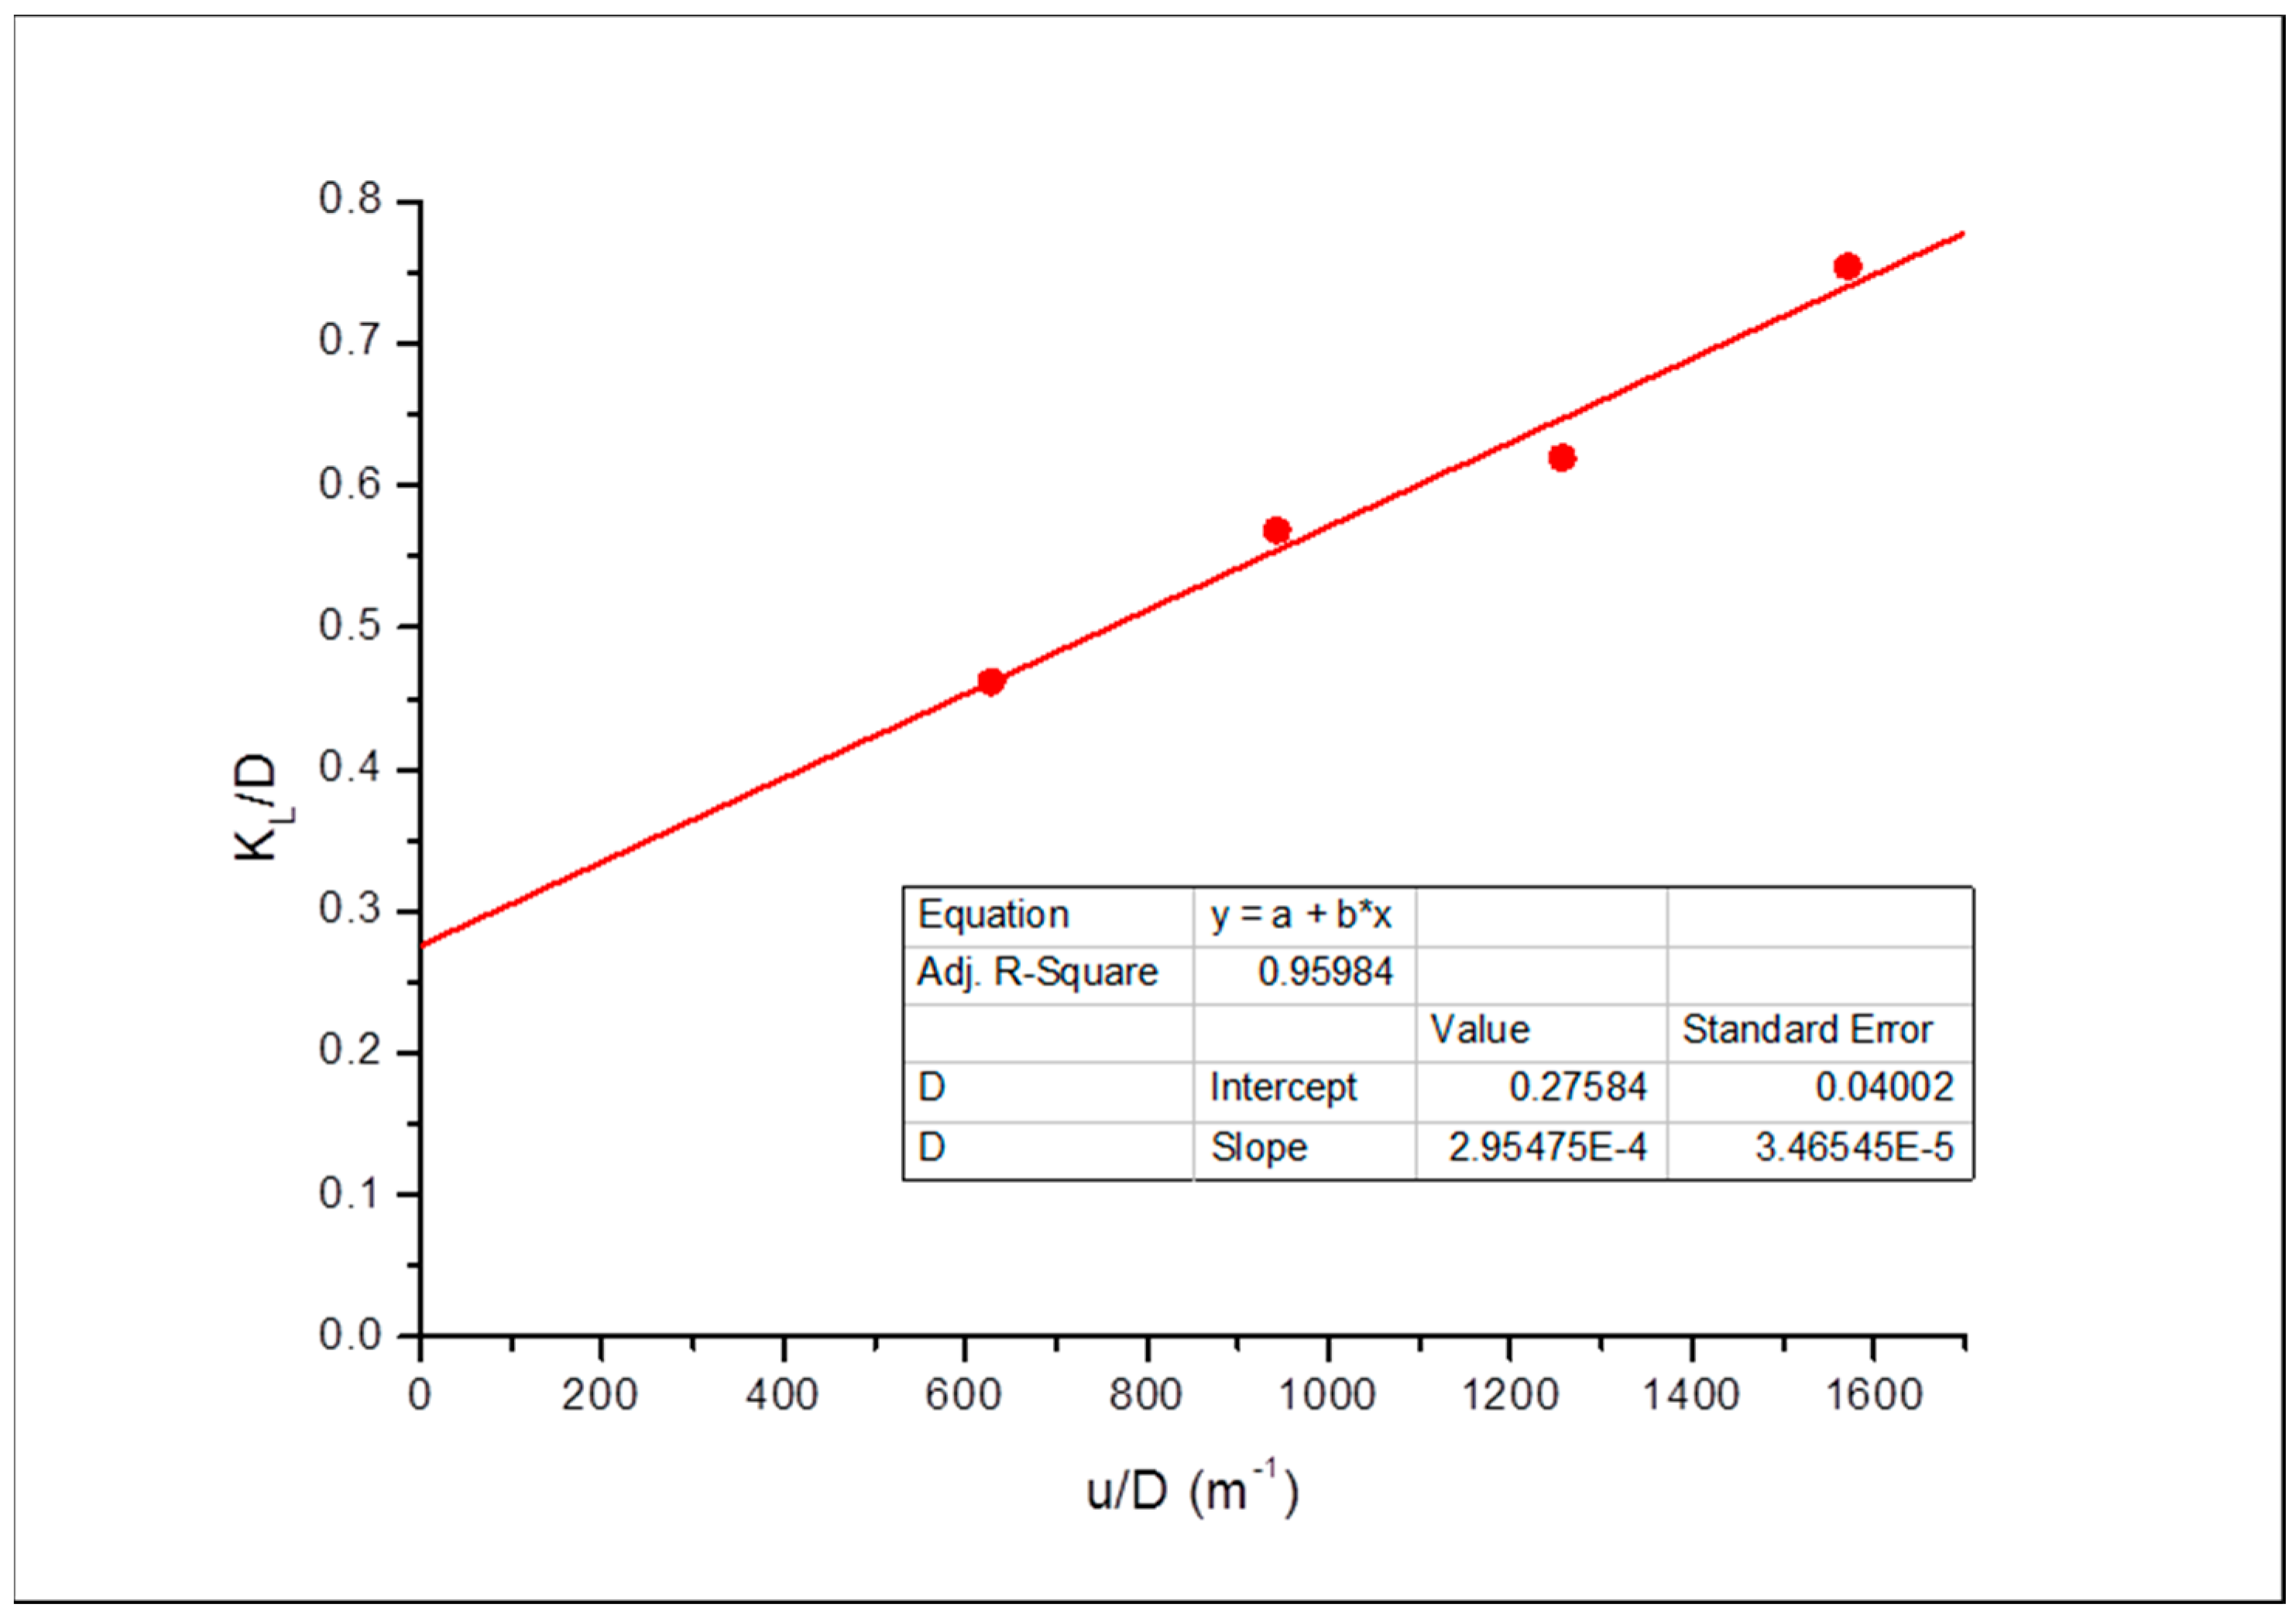
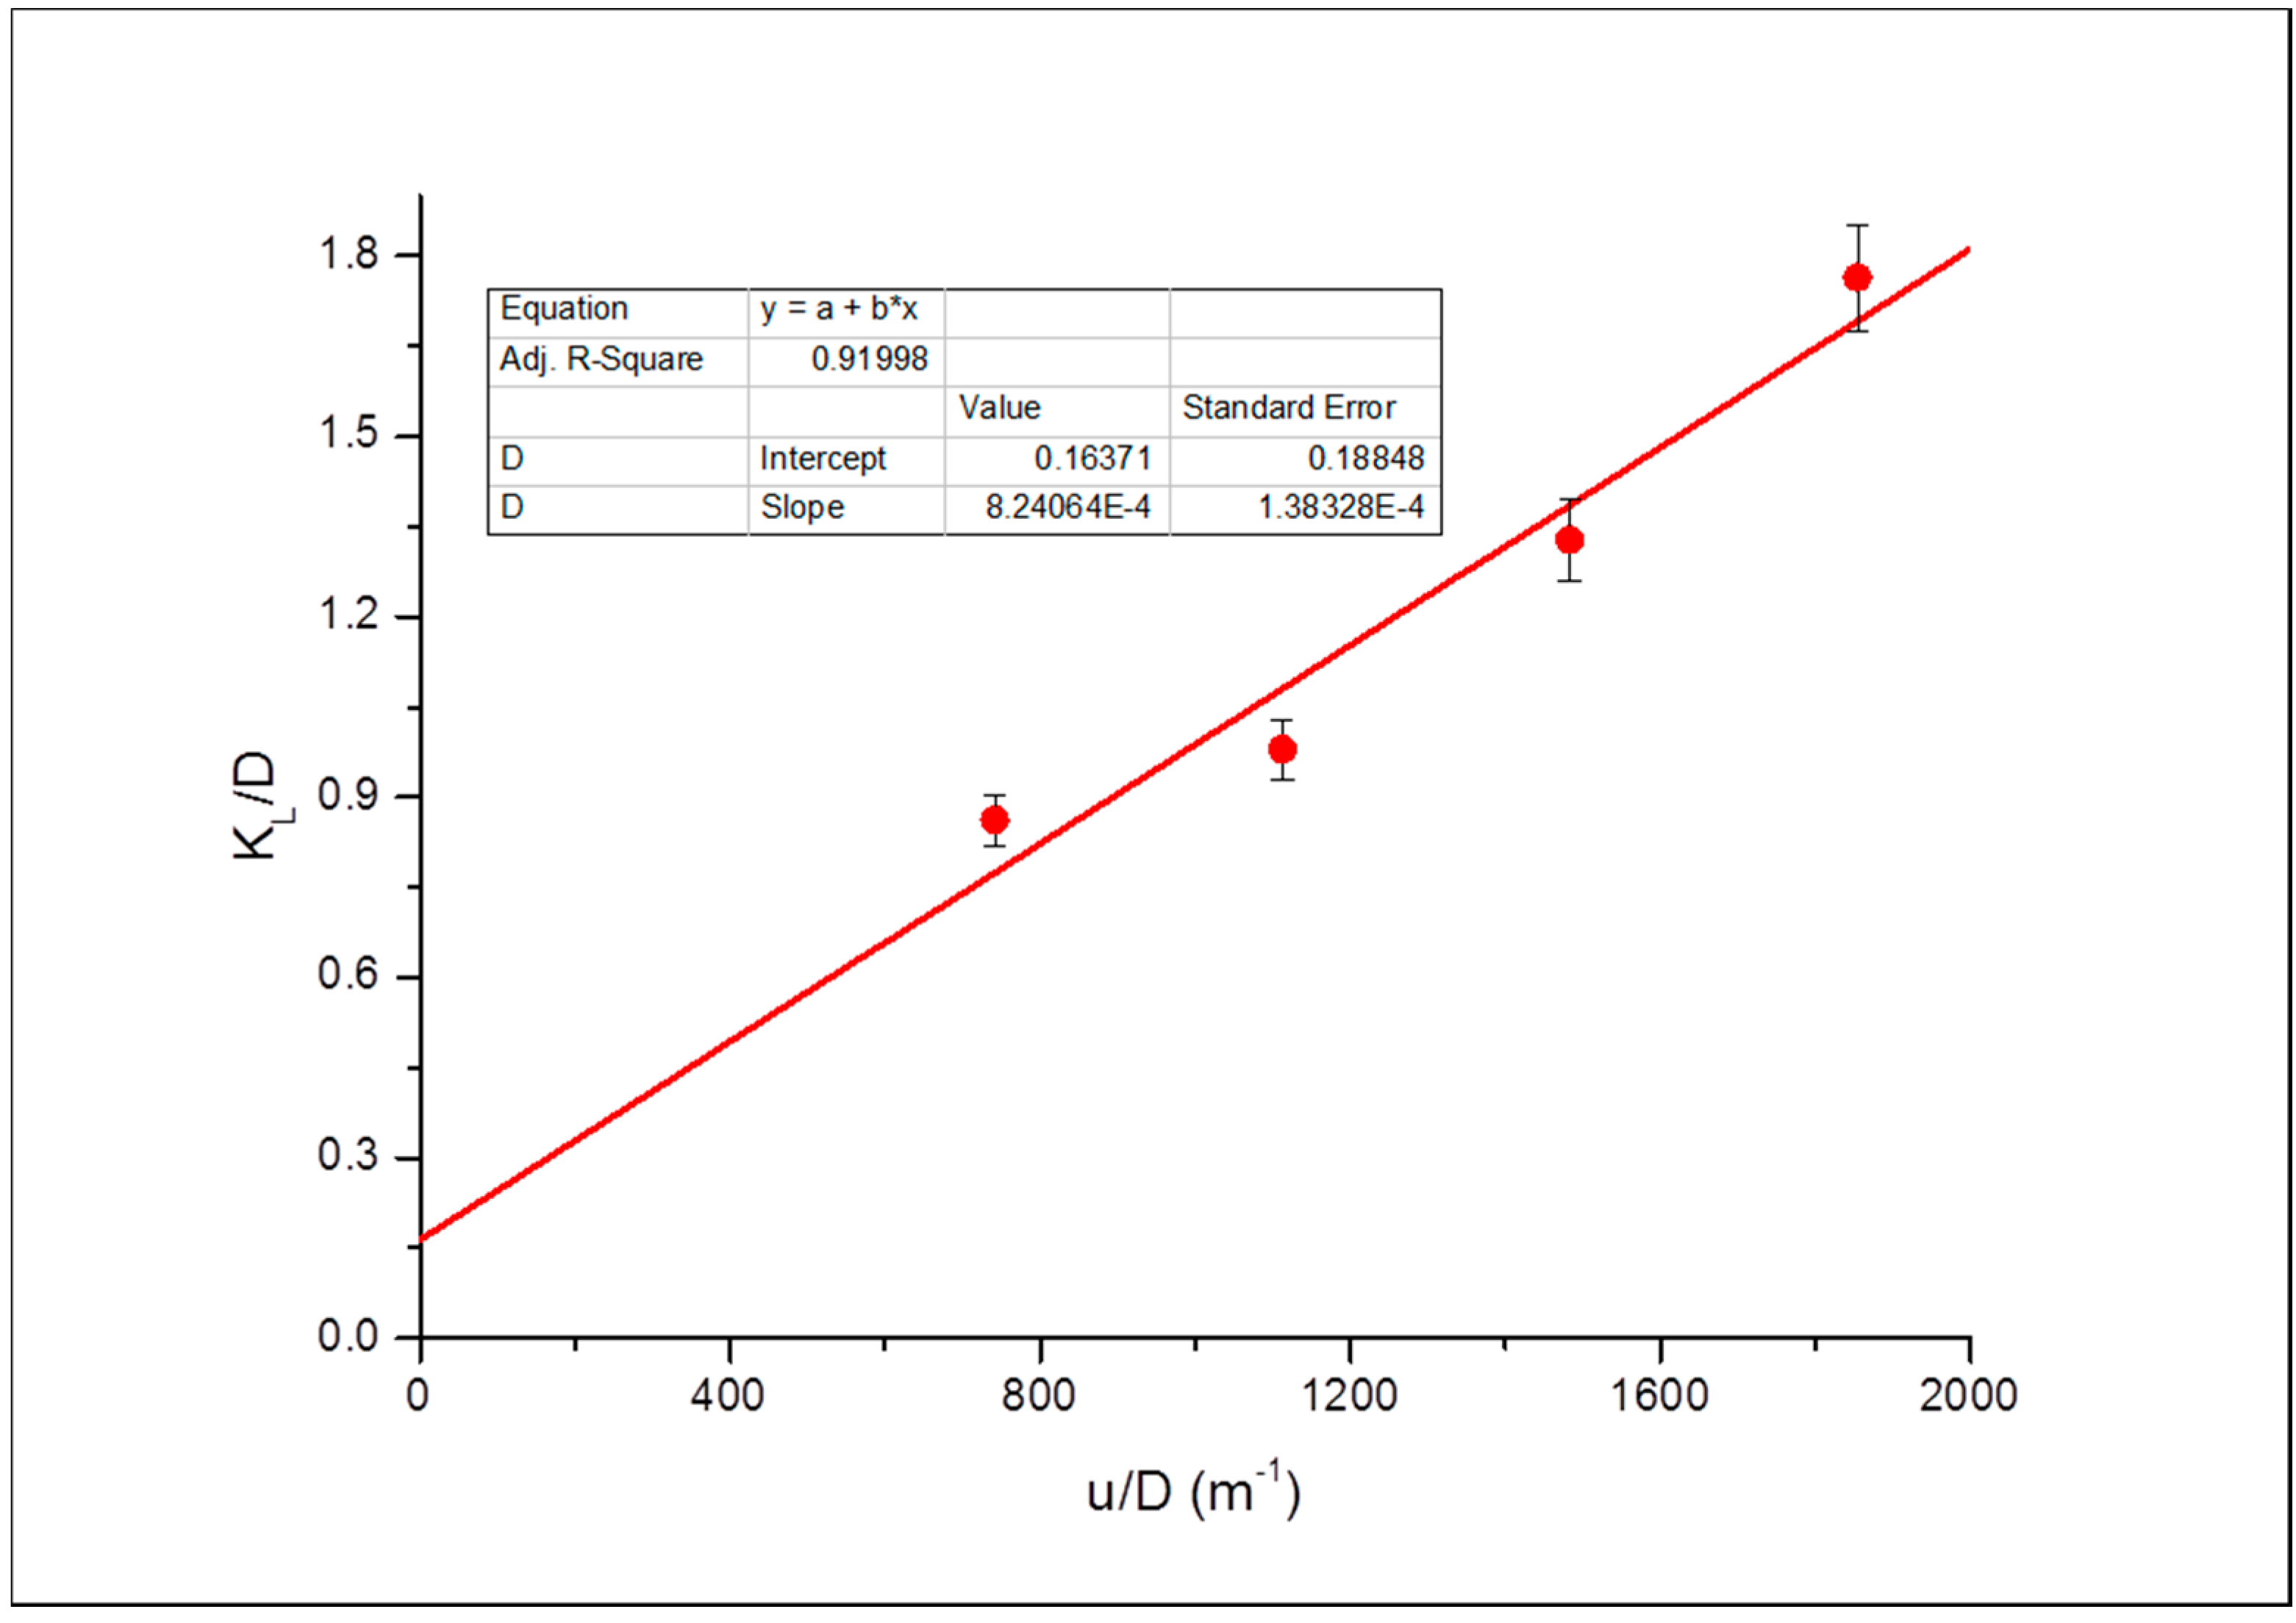
Using Equation (6), the diffusion coefficients, D, were evaluated at the experimental conditions. This is essential when describing the dispersivity, α, and the Pex of the core sample, and also when comparing the results to those in literature, which will further reaffirm the accuracy of the experiments. The dispersivity can be analytically evaluated by fitting Equation (5) to the plot of u/D against k/D which is a straight line as shown in Figure 4.
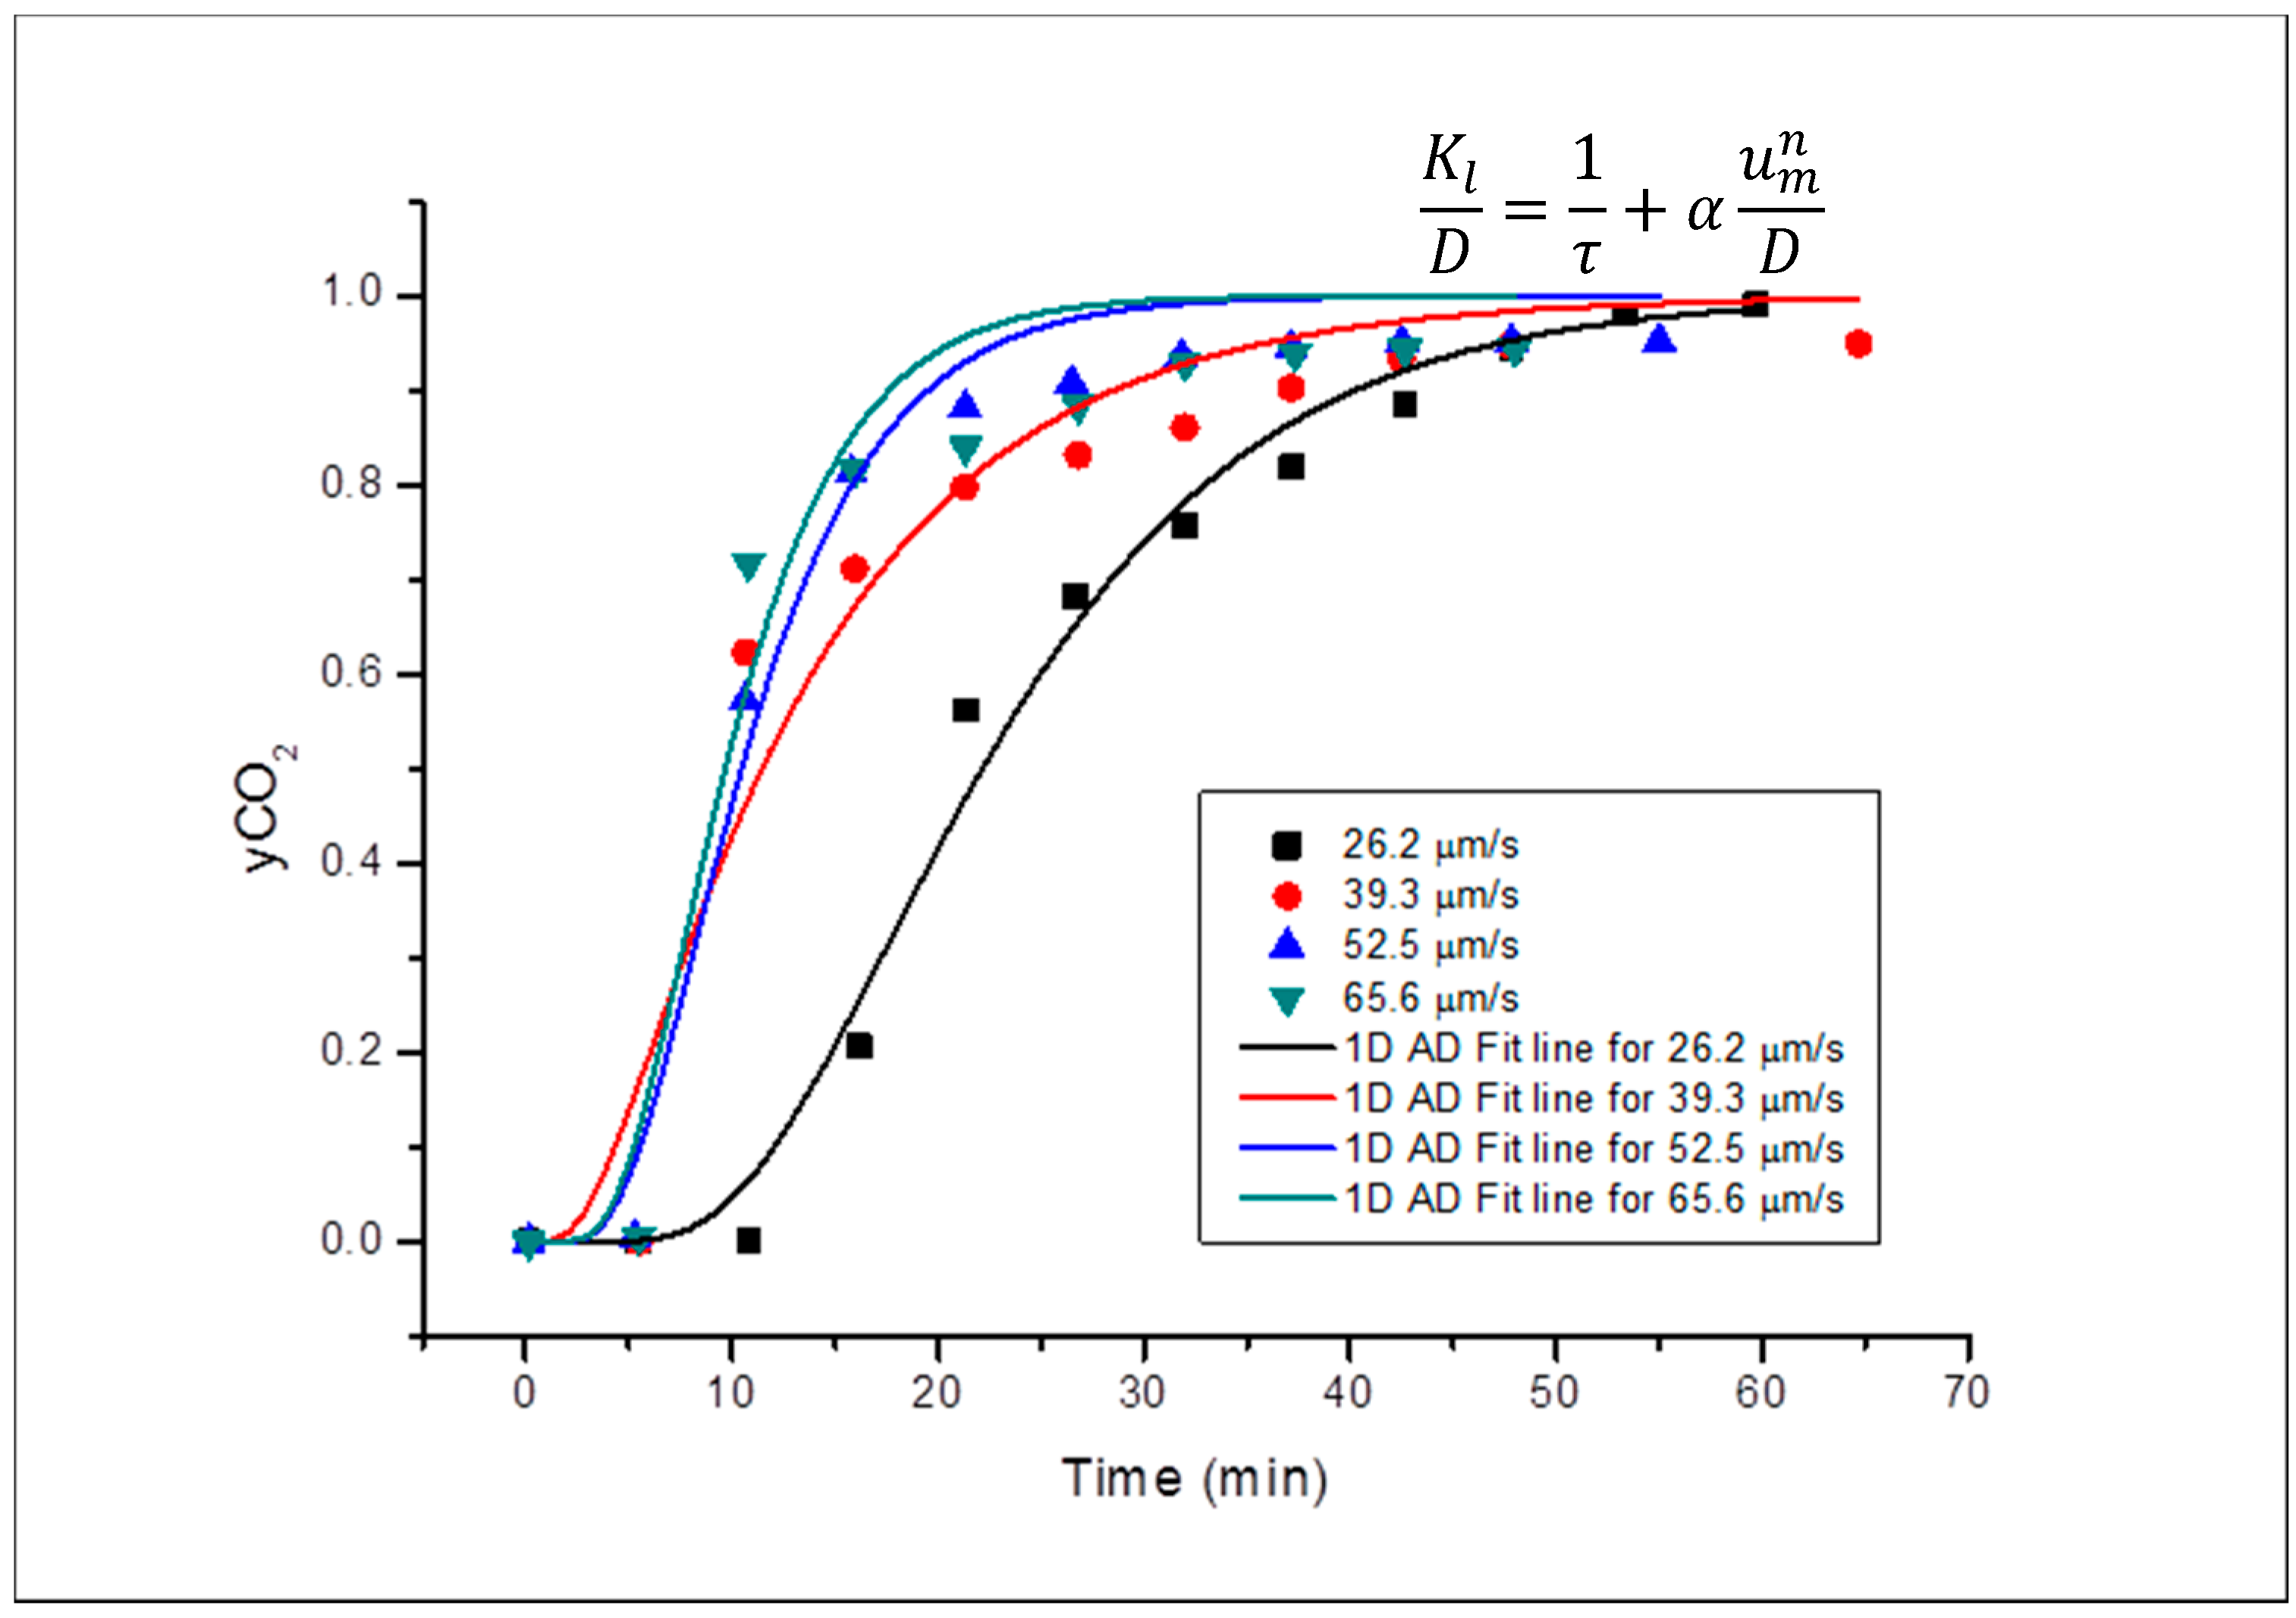
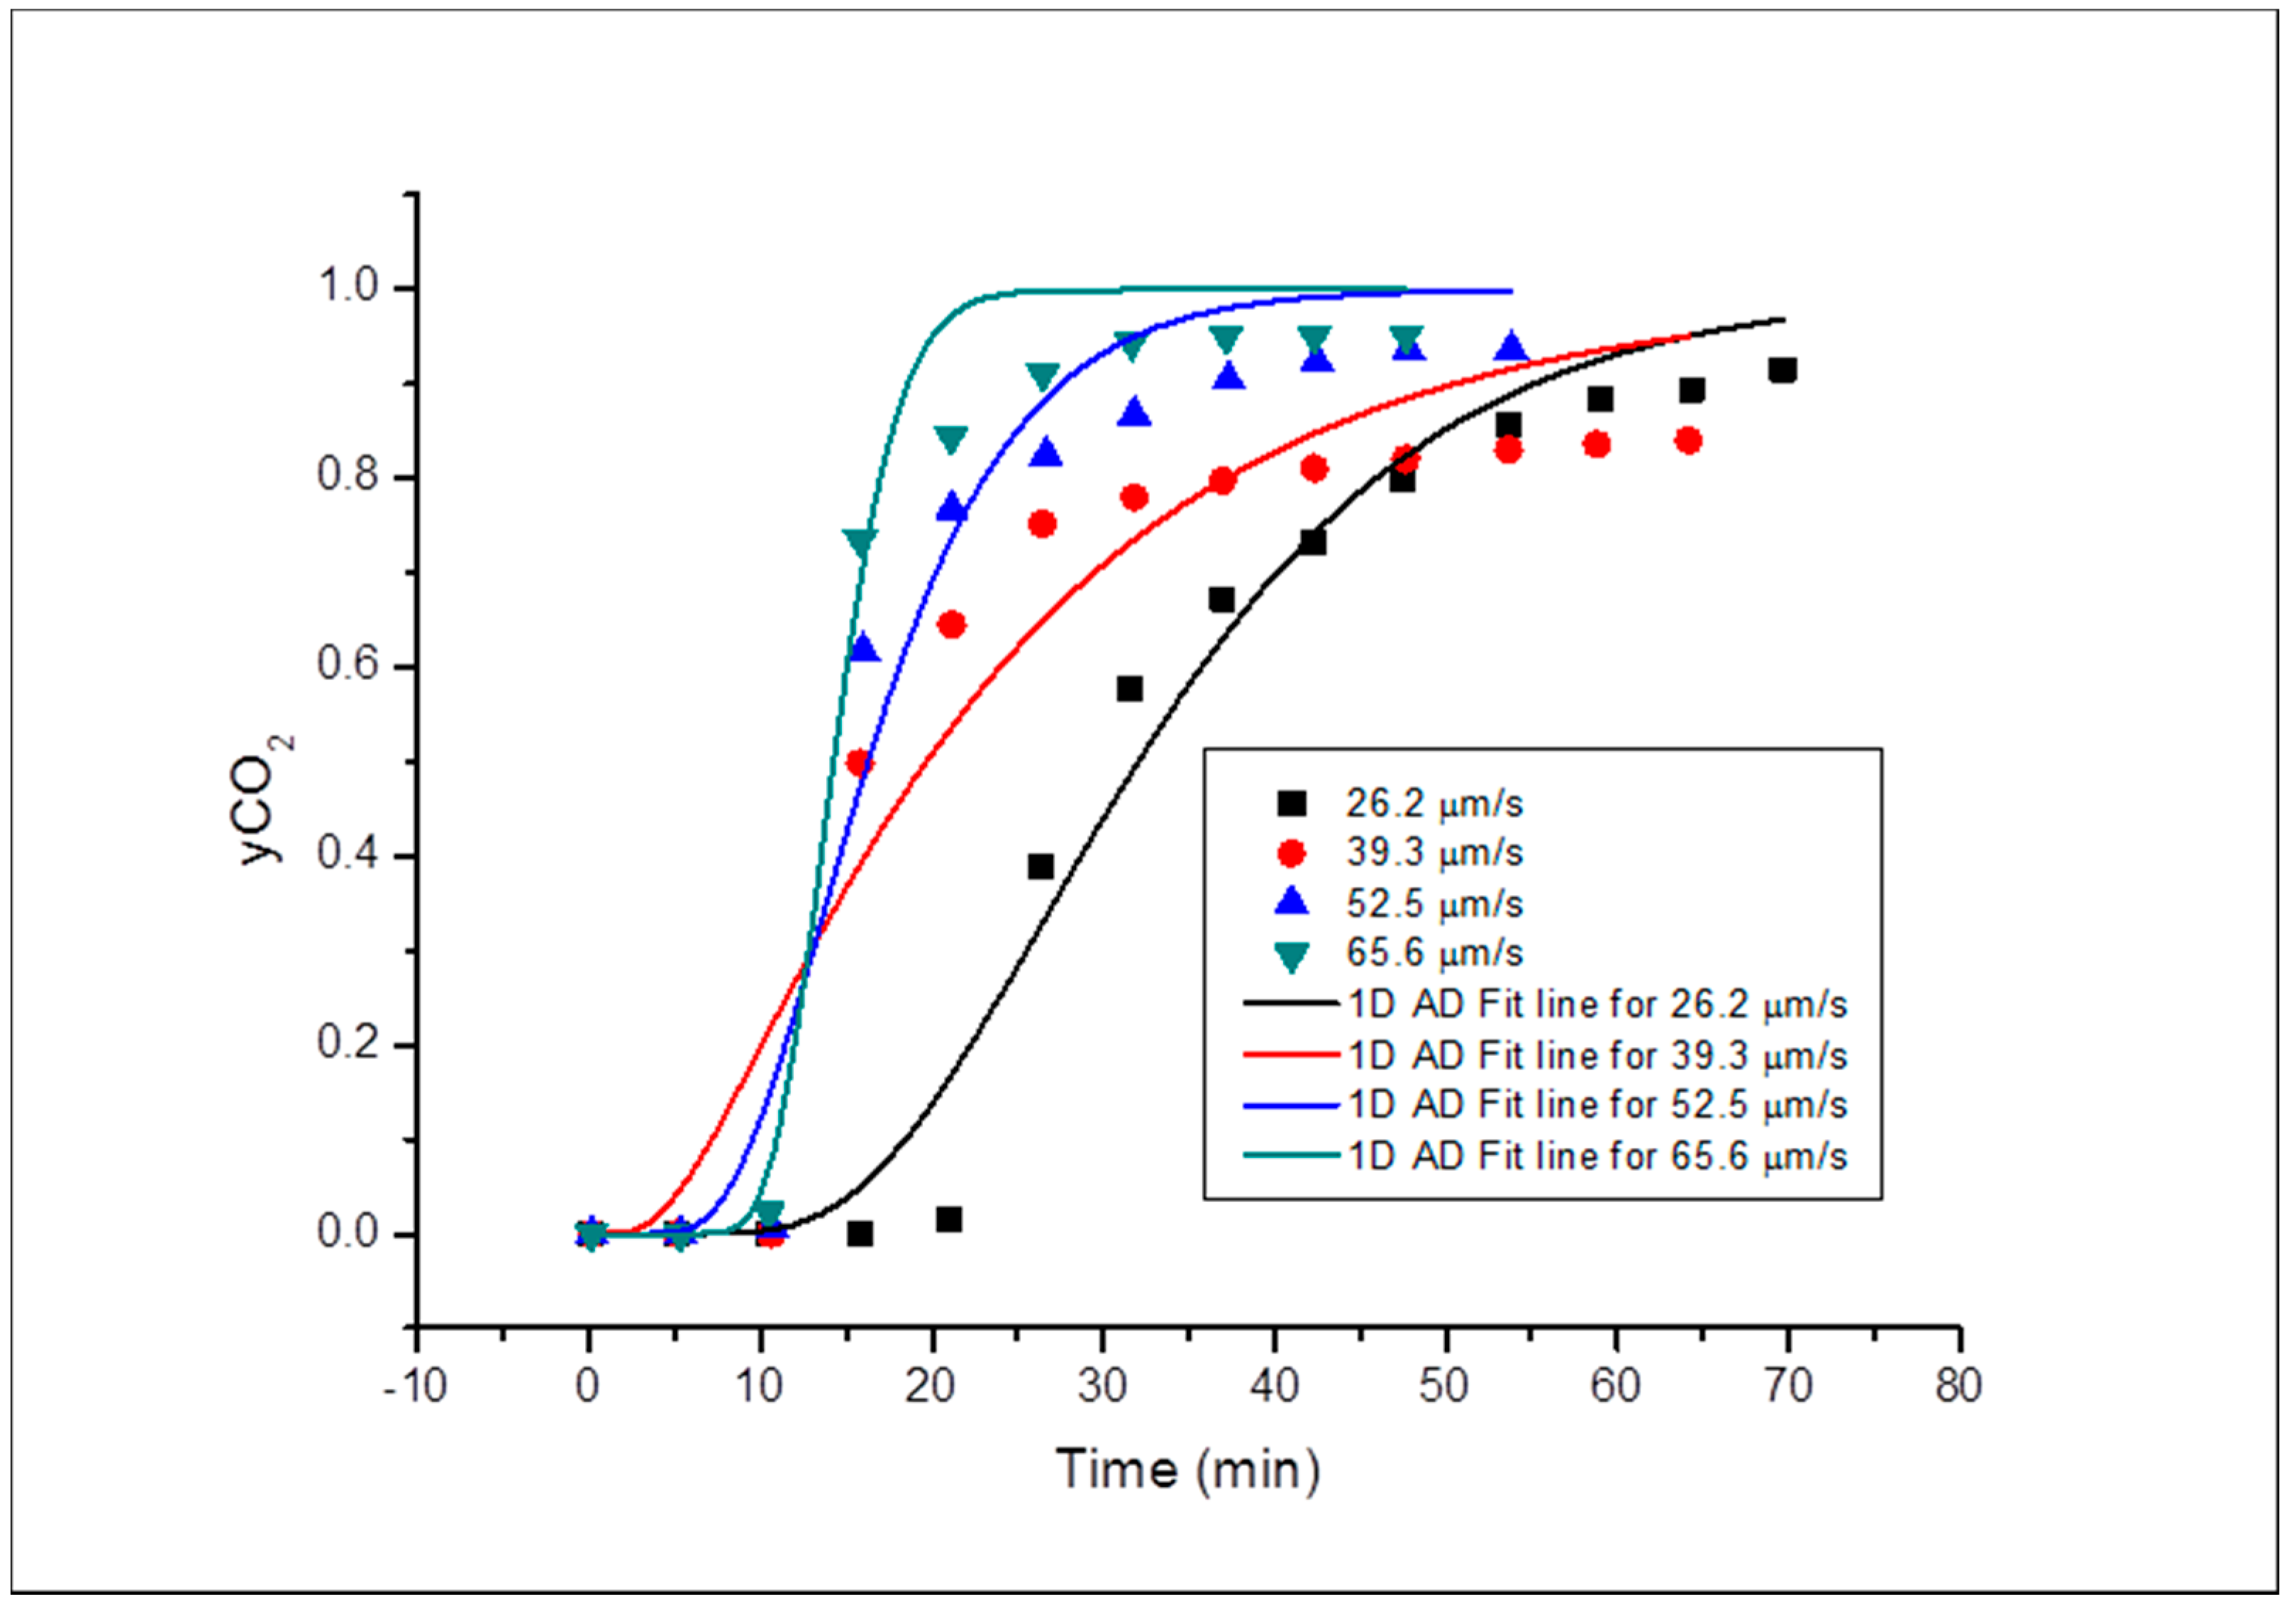
The fitted concentration profiles of the subsequent core sample (Buff Bera) is shown in Figure 5 and Figure 6, for horizontal and vertical orientation respectively, which also showed meagre fitting as a result of systemic errors as seen in Grey Berea.
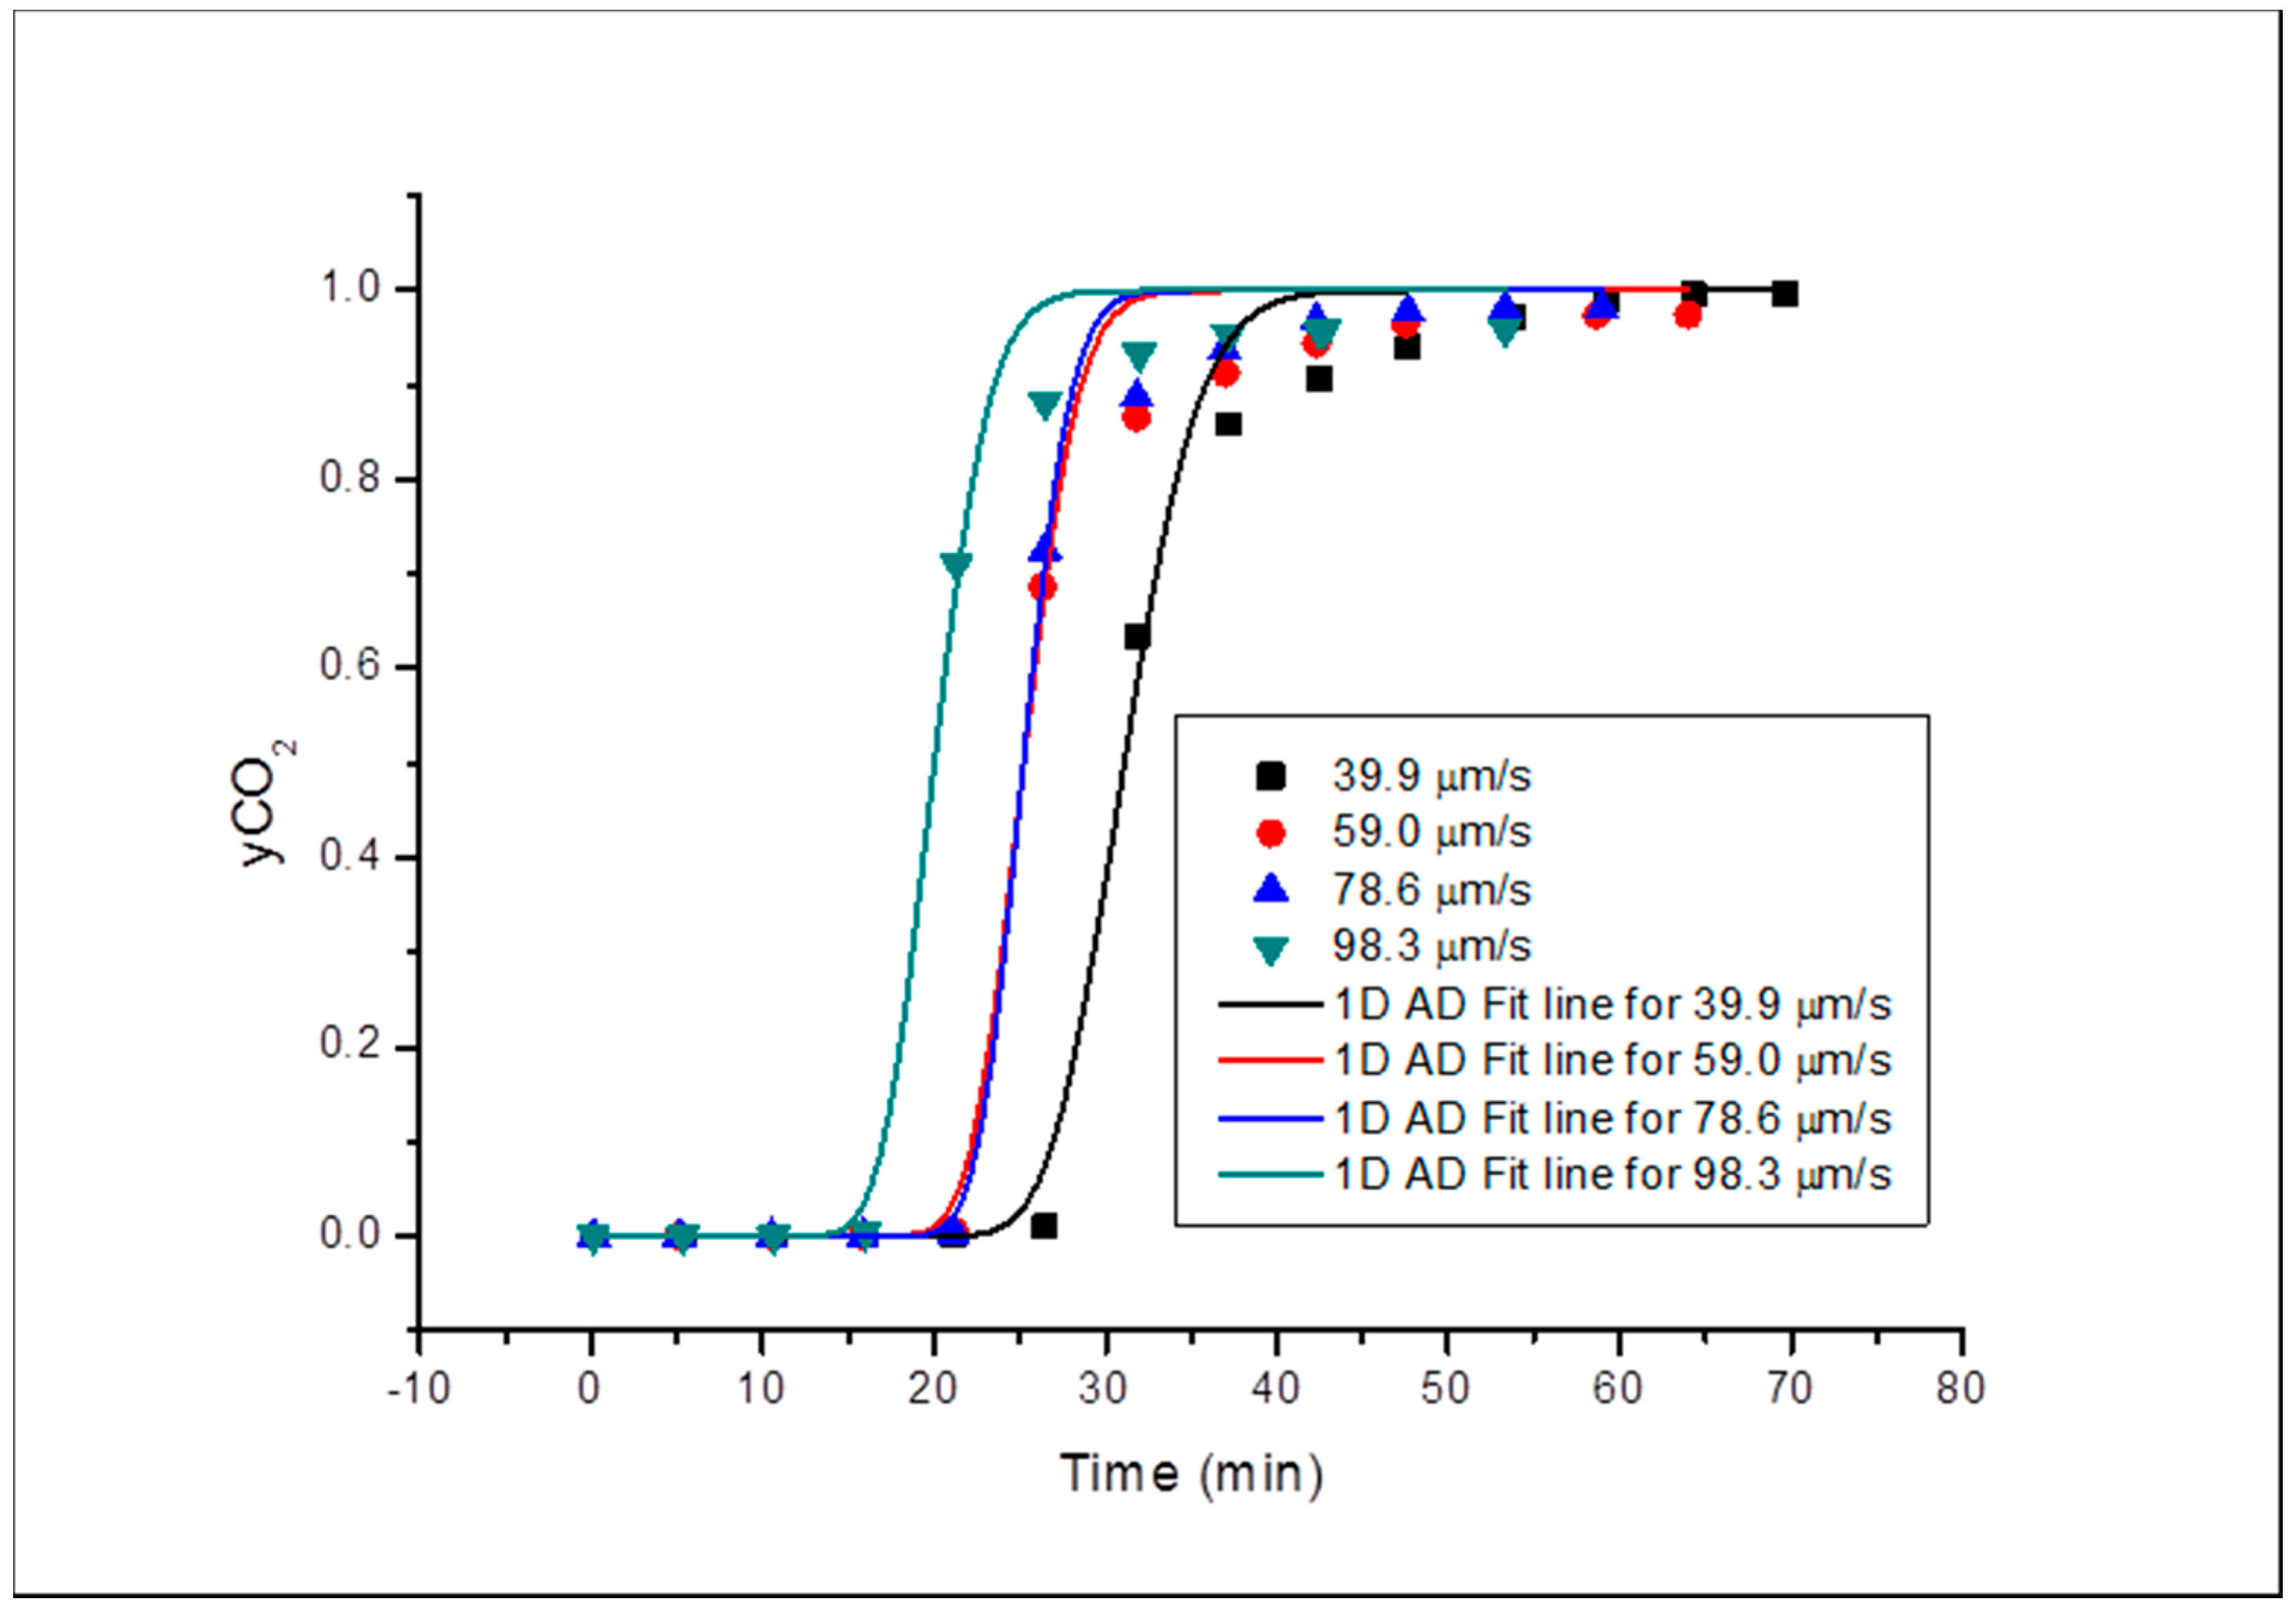
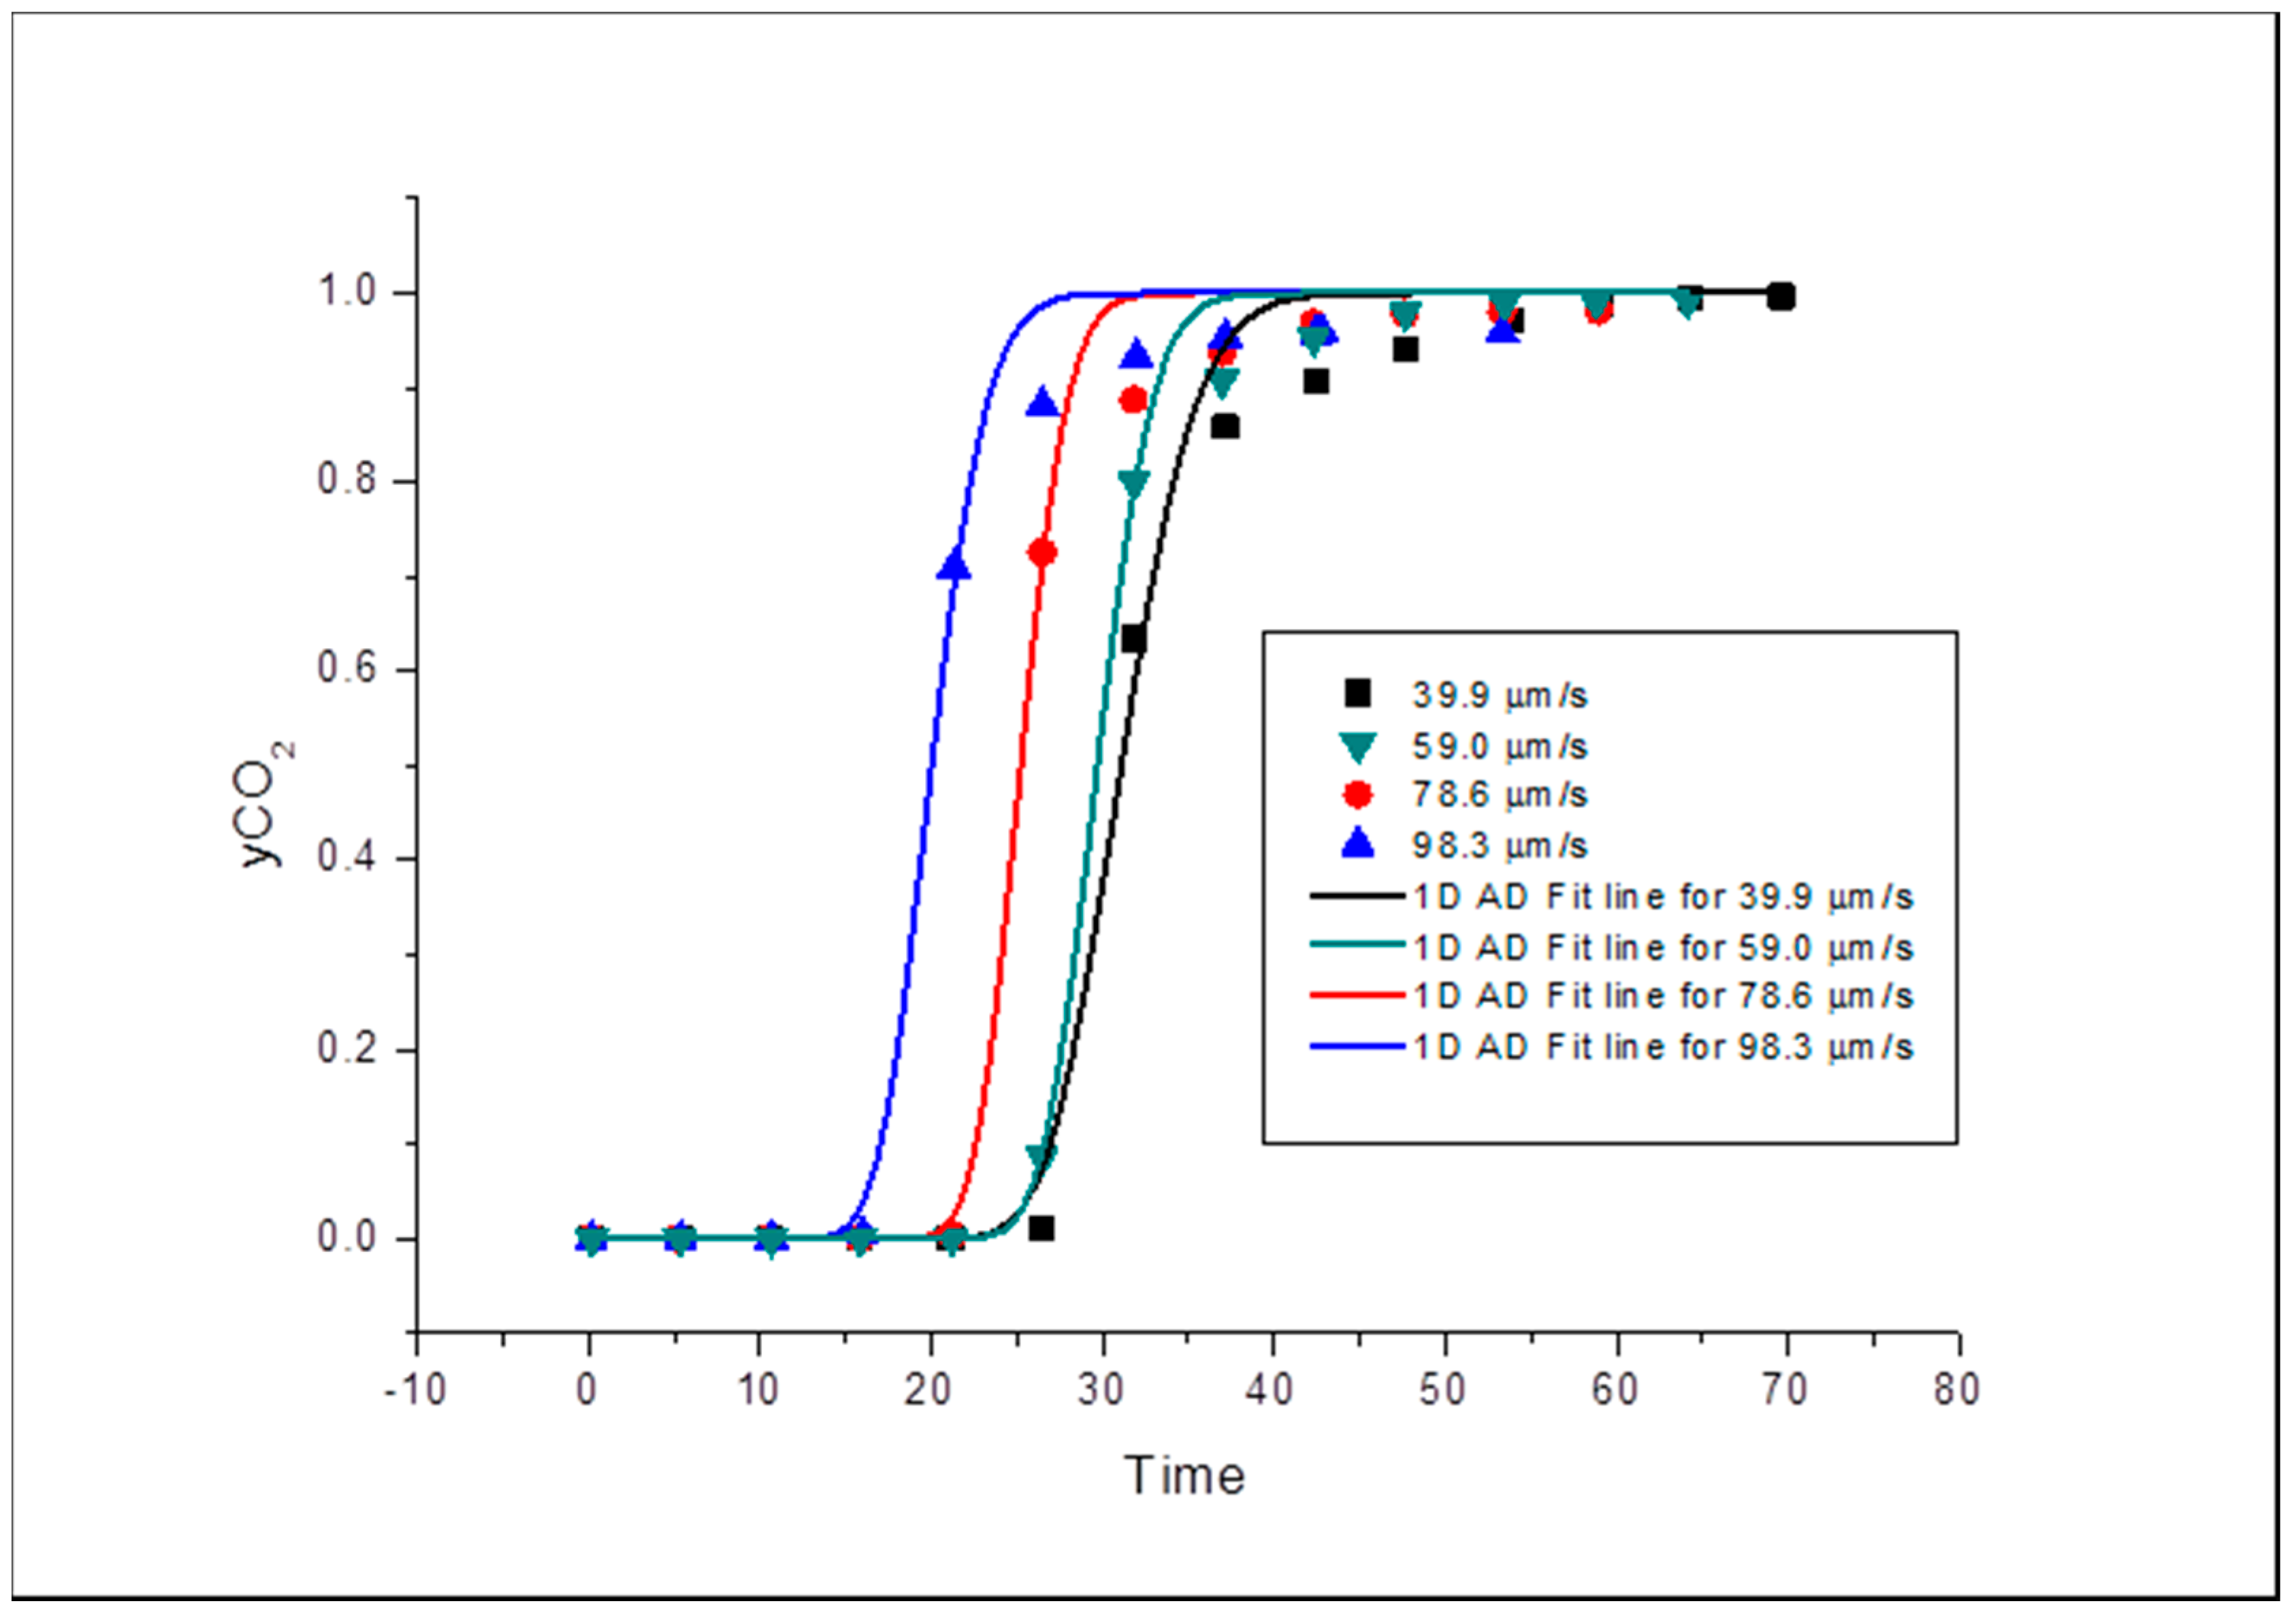
Similarly, Bandera Grey core sample fitted horizontal and vertical orientation concentration profiles are shown in Figure 7 and Figure 8. The profiles are steeper than the previous ones obtained for the core samples (Buff Berea and Grey Berea) because of the instant mixing during the displacement process due to higher interstitial velocities.
The works of [16,18,19] presented values of the apparent dispersivity in consolidated porous media that were generally smaller than 0.01 ft (0.003 m). Hughes et al. (2012) obtained dispersivity in a range of 0.0001 to 0.0011 m using a core sample (Donny brook) with similar petrophysical properties as the ones used in this work. This provided a practical input variable for EGR simulations. As dispersivity is a very important porous media property, its accurate determination can provide a befitting technique to establish the optimum injection rate of the CO2 for a better simulation of the fluid flow in the matrix of the reservoir during EGR. All the dispersivity obtained (from each experiment carried out in this study are well within those obtained from literature. This was evaluated from Equation (5) as earlier stated—a straight-line equation. This further demonstrates the reliability of the experiments.
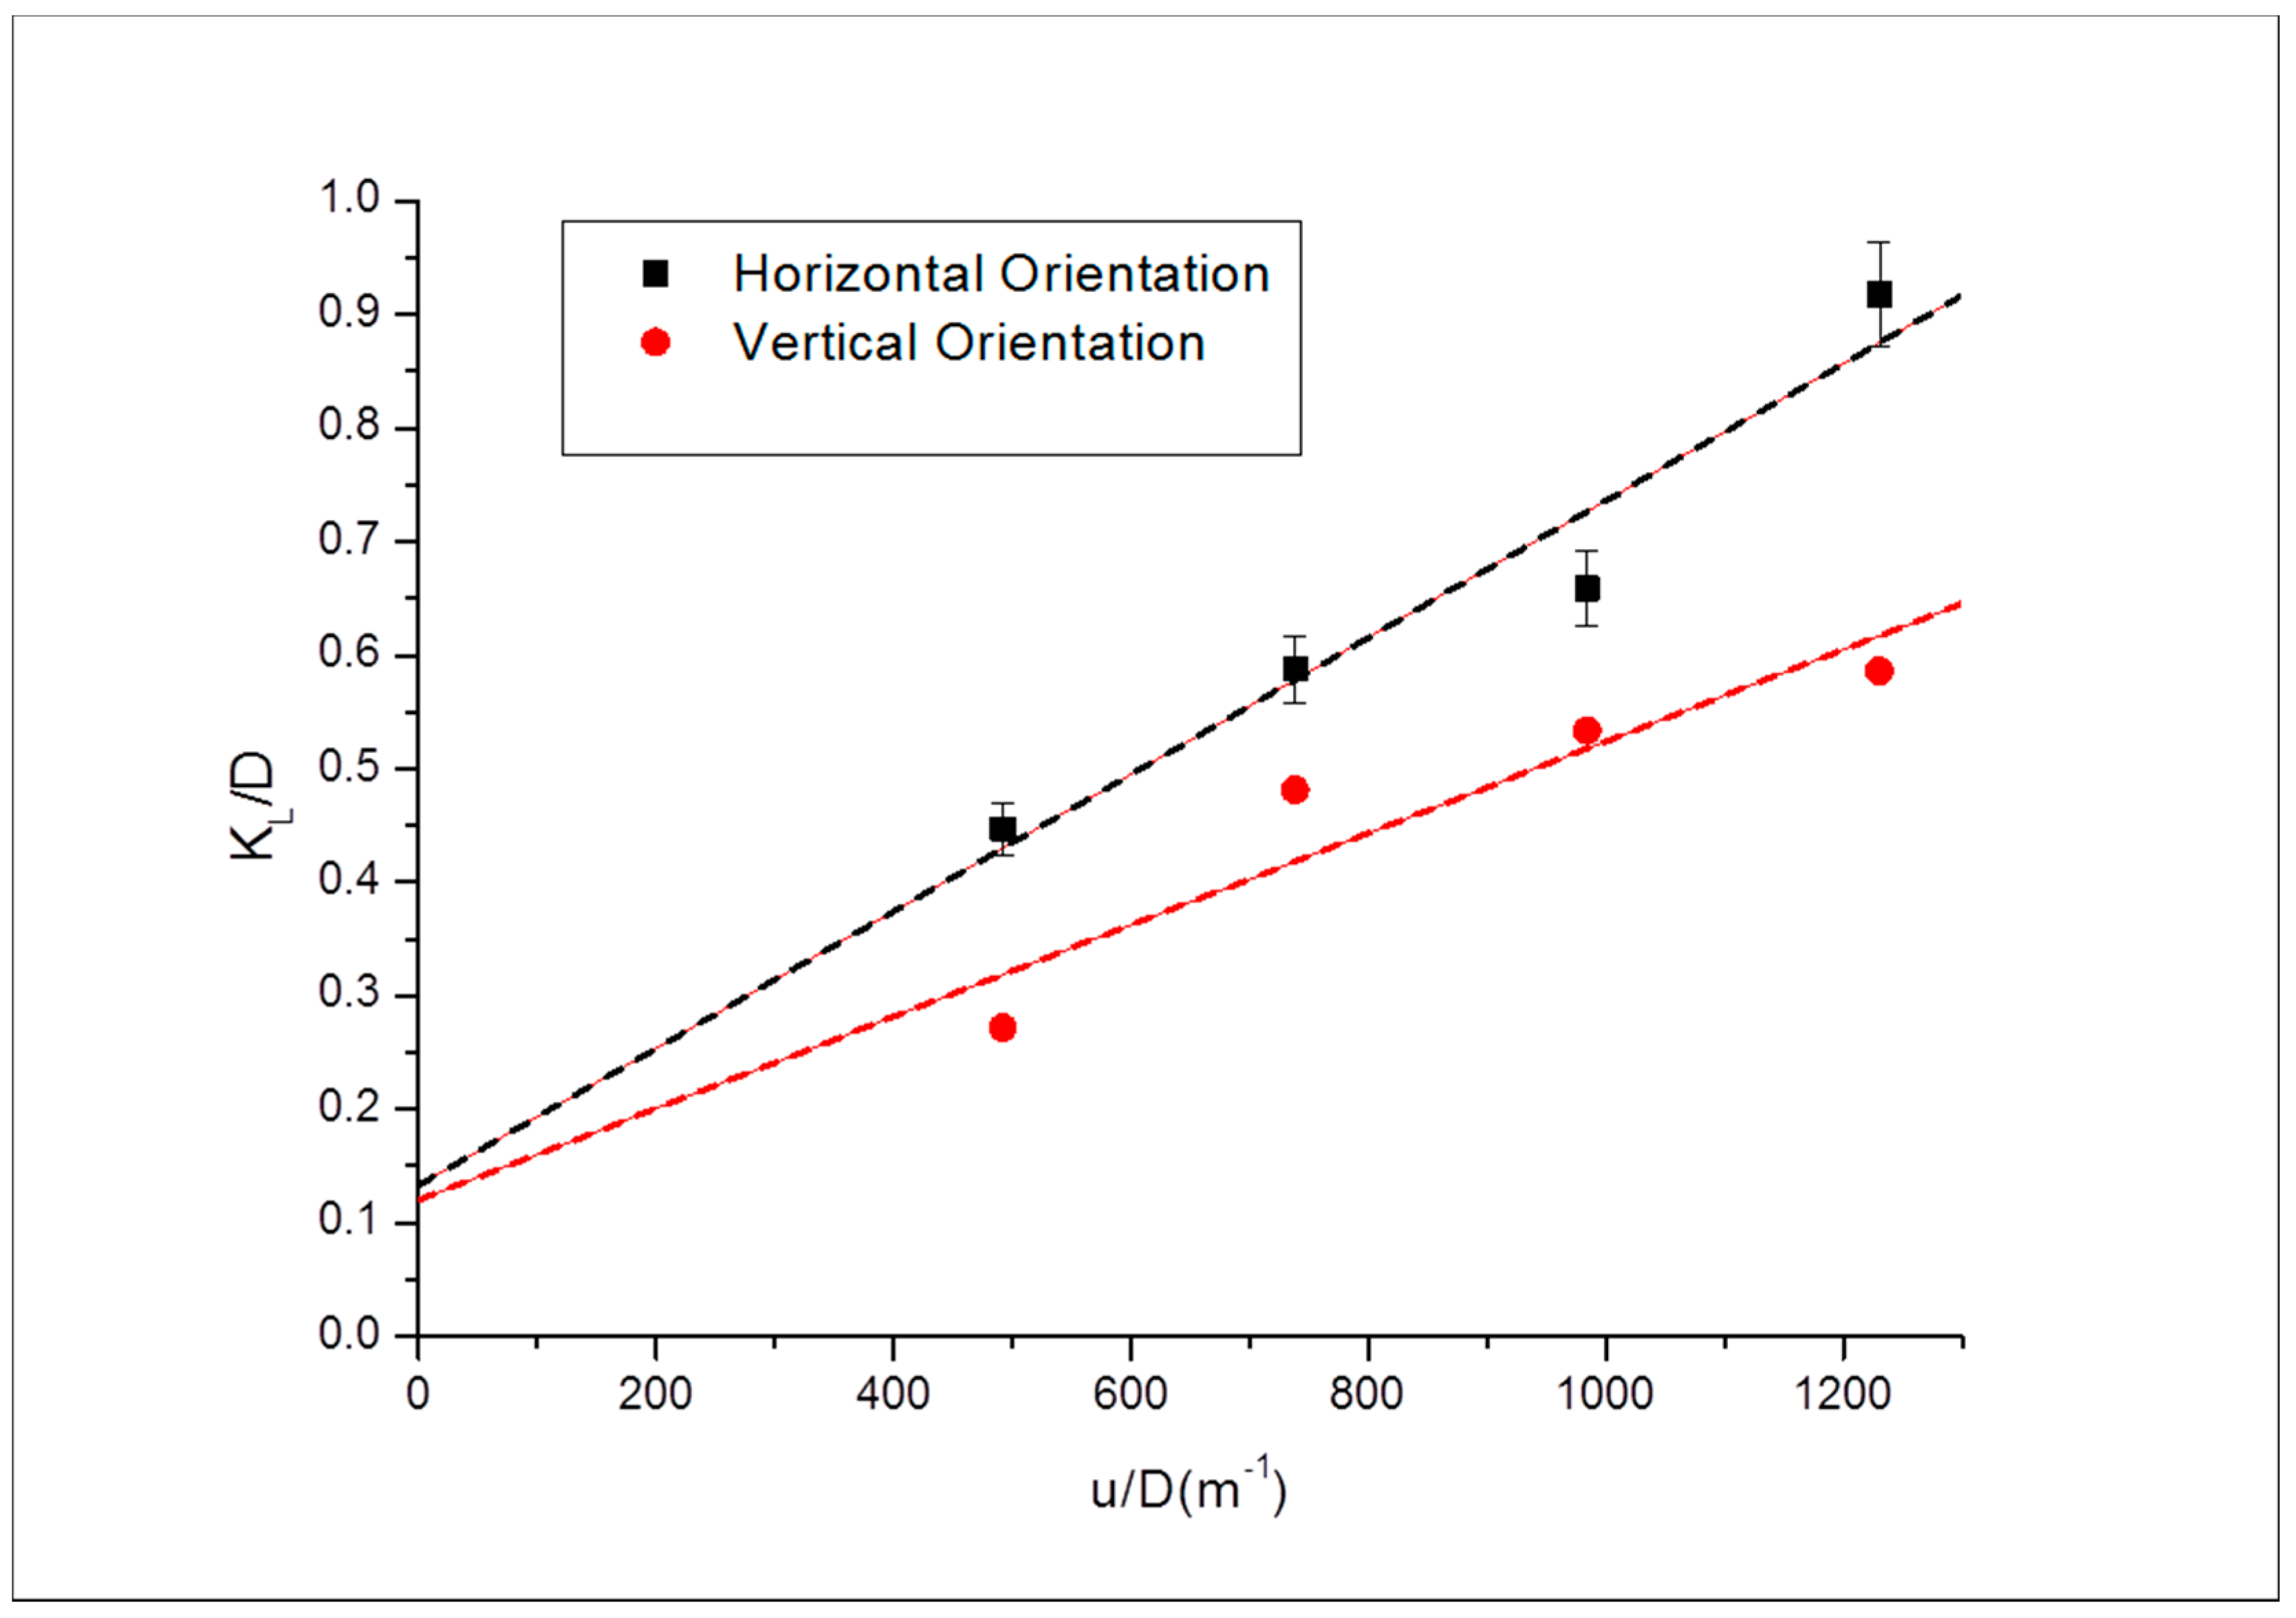
The tortuosity (inverse of the intercept on the y-axis of the straight line) was similar in both cases (Figure 9, Figure 10 and Figure 11), for Grey Berea, indicating that regardless of the injection orientation of the core sample, the tortuosity (a property of the core sample) remained unchanged. This shows that core orientation does not alter the pathways of the matrix of the porous media when fluids traverse through the porous medium, further attributing the fluid behaviour to mainly a function of the fluid properties and not the porous media. This was also true for Buff Berea depicted in Figure 12 and Figure 13, and a comparison between the vertical and horizontal dispersivity is shown in Figure 14.
Bandera Grey core sample exhibited similar trend as the previous core samples discussed in terms of dispersivity as shown in Figure 15, Figure 16 and Figure 17. Dispersivity, however, is highest in Bandera Grey compared to the other core samples. This can be attributed to the grain arrangement of the core sample and the structure of the pore matrix which is tightly packed with its characteristic low permeability.
There certainly are similarities between the vertical and horizontal orientations in all the core samples used in this study in terms of dispersion coefficient. This discussion is highlighted in the next section, which summarises the dispersion coefficient variation with the permeability.

Summary of the Dispersion Coefficient Investigation

A summary of the dispersion coefficients for all the core samples is shown in Table 5.
Dispersion coefficient generally decreases with increase in permeability as seen in Table 5. Hence, the core sample with the least permeability (Bandera Grey) showed a significantly higher dispersion coefficient. Another realisation from the Table is that in all the runs, those in the horizontal orientation appear to have the higher dispersion coefficient compared to the vertical counterparts. This can be attributed to the effect of gravity on the CO2 as it traverses the core sample. Also, since the interstitial velocity is a function of porosity, the core sample with the most porosity had the lowest interstitial velocity and, hence, a lower dispersion coefficient at lower injection rates. The dispersion coefficient increases significantly at higher injection rates in all the runs regardless of the orientation. Furthermore, in the higher permeability core sample, the interaction between the injected CO2 and the nascent CH4 was limited as the CO2 interstitial velocity was lower and, thus, the dispersion coefficient was lower compared to the subsequent core samples. The opposite was realised in the low permeability sample with the highest interstitial velocity was characterised by higher agitation of the gas molecules within the porous medium which eventually led to higher interaction and mixing and of course higher dispersion coefficient—the rate of mixing. Permeability is one of the vast factors that influence dispersion.
The dispersivity also increases with increase in permeability. This being a function of the core sample is evident with this trend, as the absolute permeability of the core sample is also a property of the core sample. Basically, the higher the permeability of the core sample, the higher the rate of mixing when CO2 is injected to displace CH4. However, dispersivity is scale-dependent [20,21] and, albeit being at laboratory scale, this finding is an indication of the effects of the petrophysical properties on the mixing taking place during EGR. Finding the right injection scenario is vital in achieving the best recovery efficiency whilst storing substantial volumes of CO2.

4. Conclusions

The effects of permeability on the dispersion coefficient have been shown to be significant during the displacement of CH4 by supercritical CO2. This effect was more pronounced in the horizontal orientation compared to the vertical orientation which was attributed to the gravity effects on the supercritical CO2 as it traverses the core sample. The magnitude difference in the dispersion coefficients was about 20%–30% higher in the horizontal orientation compared to the vertical orientation. Bandera Grey, with the lowest permeability and porosity, exhibited a wider contrast (40%–50%) between the dispersion coefficients in both orientations as a result of higher interstitial velocity and tortuosity of the core sample compared to the other core samples tested. Therefore, the effect of permeability and orientation on mixing between the displacing and displaced gas during EGR are vital. This study highlights the influence of the permeability variation and plume propagation orientation on the mixing between CO2 and CH4 during EGR. It provides reservoir engineers with an insight into characterising gas systems during the design of the EGR technology. The injection rates, injection pressures, and dip angle of injection from the injector to the producer can be evaluated accurately during simulation studies prior to field scale application and implementation. Inclusion of such hysteresis will provide a better representation of the injection process given that the main reason why EGR has not been widely adopted is the its economic drawback brought on by incessant mixing and contamination of the recovered CH4.

Author Contributions

Conceptualization, M.K.A. and A.J.A.; Methodology, M.K.A.; Data software tools analysis, A.A.-O.; Investigation, M.K.A.; writing—original draft preparation, M.K.A.; writing—review and editing, M.B.; visualization, A.A.-O.; supervision, G.G.N.

Funding

This research received no external funding.

Acknowledgments

The authors would like to show gratitude to Petroleum Technology Development Fund Nigeria (PTDF) for the studentship.

Conflicts of Interest

The authors declare no conflict of interest.

References

  1. Ziyarati, M.T.; Bahramifar, N.; Baghmisheh, G.; Younesi, H.; Younessi, H. Greenhouse gas emission estimation of flaring in a gas processing plant: Technique development. Process. Saf. Environ. Prot. 2019, 123, 289–298. [Google Scholar] [CrossRef]
  2. Abas, N.; Kalair, A.; Khan, N. Review of fossil fuels and future energy technologies. Futures 2015, 69, 31–49. [Google Scholar] [CrossRef]
  3. Wegener, M.; Amin, G.R. Minimizing Greenhouse Gas Emissions using Inverse DEA with an Application in Oil and Gas. Expert Syst. Appl. 2018, 122, 369–375. [Google Scholar] [CrossRef]
  4. Vilcáez, J. Numerical modeling and simulation of microbial methanogenesis in geological CO2 storage sites. J. Pet. Sci. Eng. 2015, 135, 583–595. [Google Scholar] [CrossRef]
  5. Kalra, S.; Wu, X. CO2 injection for Enhanced Gas Recovery. In Proceedings of the SPE Western North American and Rocky Mountain Joint Meeting, Denver, CO, USA, 17–18 April 2014; pp. 16–18. [Google Scholar]
  6. Abba, M.K.; Abbas, A.J.; Nasr, G.G. Enhanced Gas Recovery by CO2 Injection and Sequestration: Effect of Connate Water Salinity on Displacement Efficiency. In Proceedings of the SPE Abu Dhabi International Petroleum Exhibition & Conference, Abu Dhabi, UAE, 13–16 November 2017. [Google Scholar]
  7. Abba, M.K.; Al-Othaibi, A.; Abbas, A.J.; Nasr, G.G. Effects of gravity on flow behaviour of supercritical CO2 during enhanced gas recovery and sequestration. In Proceedings of the Fifth CO2 Geological Storage Workshop, Utrecht, The Netherlands, 21–23 November 2018. [Google Scholar]
  8. Abba, M.K.; Al-Othaibi, A.; Abbas, A.J.; Nasr, G.G.; Mukhtar, A. Experimental investigation on the impact of connate water salinity on dispersion coefficient in consolidated rocks cores during Enhanced Gas Recovery by CO2 injection. J. Nat. Gas Sci. Eng. 2018, 60, 190–201. [Google Scholar] [CrossRef]
  9. Abba, M.K.; Abbas, A.J.; Al-Othaibi, A.; Nasr, G.G. Enhanced Gas Recovery by CO2 Injection and Sequestration: Effects of Temperature, Vertical and Horizontal Orientations on Dispersion Coefficient. In Proceedings of the Abu Dhabi International Petroleum Exhibition & Conference, Abu Dhabi, UAE, 12–15 November 2018. [Google Scholar]
  10. Liu, S.; Song, Y.; Zhao, C.; Zhang, Y.; Lv, P.; Jiang, L.; Liu, Y.; Zhao, Y. The horizontal dispersion properties of CO2-CH4in sand packs with CO2displacing the simulated natural gas. J. Nat. Gas Sci. Eng. 2018, 50, 293–300. [Google Scholar] [CrossRef]
  11. Newberg, M.; Foh, S. Measurement of Longitudinal Dispersion Coefficients for Gas Flowing Through Porous Media. In Proceedings of the SPE Gas Technology Symposium, Dallas, TX, USA, 13–15 June 1988; pp. 5–9. [Google Scholar]
  12. Mamora, D.D.; Seo, J.G. Enhanced Recovery by Carbon Dioxide Sequestration in Depleted Gas Reservoirs. In Proceedings of the SPE Annual Technical Conference and Exhibition, San Antonio, TX, USA, 29 September–2 October 2002; pp. 1–9. [Google Scholar]
  13. Nogueira, M.; Mamora, D.D. Effect of Flue-Gas Impurities on the Process of Injection and Storage of CO2 in Depleted Gas Reservoirs. J. Energy Resour. Technol. 2005, 130, 013301. [Google Scholar] [CrossRef]
  14. Perkins, T.; Johnston, O. A Review of Diffusion and Dispersion in Porous Media. Soc. Pet. Eng. J. 1963, 3, 70–84. [Google Scholar] [CrossRef]
  15. Coats, K.H.; Whitson, C.H.; Thomas, K. Modeling Conformance as Dispersion. SPE Reserv. Eval. Eng. 2009, 12, 33–47. [Google Scholar] [CrossRef]
  16. Hughes, T.J.; Honari, A.; Graham, B.F.; Chauhan, A.S.; Johns, M.L.; May, E.F. CO2 sequestration for enhanced gas recovery: New measurements of supercritical CO2–CH4 dispersion in porous media and a review of recent research. Int. J. Greenh. Gas Control. 2012, 9, 457–468. [Google Scholar] [CrossRef]
  17. Liu, S.; Zhang, Y.; Xing, W.; Jian, W.; Liu, Z.; Li, T.; Song, Y. Laboratory experiment of CO2-CH4 displacement and dispersion in sandpacks in enhanced gas recovery. J. Nat. Gas Sci. Eng. 2015, 26, 1585–1594. [Google Scholar] [CrossRef]
  18. Honari, A.; Hughes, T.J.; Fridjonsson, E.O.; Johns, M.L.; May, E.F. Dispersion of supercritical CO2 and CH4 in consolidated porous media for enhanced gas recovery simulations. Int. J. Greenh. Gas Control 2013, 19, 234–242. [Google Scholar] [CrossRef]
  19. Coats, K.H.; Whitson, C.H. SPE 90390 Modeling Conformance as Dispersion. In Proceedings of the SPE Annual Technical Conference and Exhibition, Houston, TX, USA, 26–29 September 2004. [Google Scholar]
  20. Bjerg, P. Dispersion in Aquifers; DTU Environment: Lyngby, Denmark, 2008. [Google Scholar]
  21. Schulze-Makuch, D. Longitudinal dispersivity data and implications for scaling behaviour. Groundwater 2005, 43, 443–456. [Google Scholar] [CrossRef] [PubMed]
Figure 1. CH4 and CO2 density as a function of temperature at 1300 psi.
Energies 12 02328 g001
Figure 2. Core flooding set up schematics.
Energies 12 02328 g002
Figure 3. Concentration profile for Grey Berea in horizontal orientation.
Energies 12 02328 g003
Figure 4. Concentration profile for all Grey Berea runs vertical orientation.
Energies 12 02328 g004
Figure 5. Concentration profile of all the runs for Buff Berea in horizontal orientation.
Energies 12 02328 g005
Figure 6. Concentration profile for all Buff Berea runs in vertical orientation.
Energies 12 02328 g006
Figure 7. Concentration profile for Bandera Grey in horizontal orientation.
Energies 12 02328 g007
Figure 8. Concentration profile for Bandera Grey runs in vertical orientation.
Energies 12 02328 g008
Figure 9. Dispersion to diffusion coefficient ratio against interstitial velocity for Grey Berea (vertical).
Energies 12 02328 g009
Figure 10. Dispersivity evaluation using the dispersion coefficient and interstitial velocity for Grey Berea (horizontal).
Energies 12 02328 g010
Figure 11. Comparison of the dispersivities in both orientations for Grey Berea.
Energies 12 02328 g011
Figure 12. Dispersivity evaluation for Buff Berea in the horizontal orientation.
Energies 12 02328 g012
Figure 13. Dispersivity evaluation for Buff Berea in the vertical orientation.
Energies 12 02328 g013
Figure 14. Comparison of the dispersivities in both orientations for Buff Berea.
Energies 12 02328 g014
Figure 15. Dispersivity evaluation for Bandera Grey in the horizontal orientation.
Energies 12 02328 g015
Figure 16. Dispersivity evaluation for Bandera Grey in the vertical orientation.
Energies 12 02328 g016
Figure 17. Comparison of the dispersivities in orientations for Bandera Grey.
Energies 12 02328 g017
Table 1. Dimensions and petrophysical properties of core samples.
Core SamplesLength (mm)Diameter (mm)* Porosity (%)* Permeability (md)
Grey Berea76.2725.2219–20200–315
Bandera Grey76.0025.472130
Buff Berea76.1824.9526350–600
* Properties provided by suppliers.
Table 2. Measured petrophysical properties.
Core SamplesPorosimetry Porosity (%)Measured Permeability (md)
Bandera Grey1716.08
Grey Berea20217.04
Buff Berea26.27560.63
Table 3. Dimensionless parameters.
ParameterExpression
P e u L K l
t D t u L
x D x L
u Q π r 2 ϕ
Table 4. Interstitial velocities employed in each core sample.
SNCore SamplePorosity (%)Interstitial Velocity (μm/s)
1Grey Berea20.1033.5–83.8
2Bandera Grey17.2039.3–98.3
3Buff Berea26.2726.2–65.6
Table 5. Summary of all dispersion coefficients.
Core SampleU (μm/s)KL (10−8 m2/s)
HorizontalVertical
Bandera (k = 16.08 md)39.37.014.56
59.08.975.19
78.613.207.03
98.315.239.35
Grey Berea (k = 217.04 md)33.53.112.46
50.33.643.03
67.04.013.70
83.85.514.02
Buff Berea (k = 560.63 md)26.22.381.44
39.33.132.56
52.53.512.84
65.64.893.12