The Technological Progress of the Fuel Consumption Rate for Passenger Vehicles in China: 2009–2016


Automotive Data Center, China Automotive Technology and Research Center, Tianjin 300300, China
*
Author to whom correspondence should be addressed.
Energies 2019, 12(12), 2384; https://doi.org/10.3390/en12122384
Submission received: 27 May 2019
/
Revised: 16 June 2019
/
Accepted: 19 June 2019
/
Published: 21 June 2019
(This article belongs to the Collection Energy Use Efficiency)
Abstract
:China has set stringent fuel consumption rate (FCR) targets to address the serious environmental and energy security problems caused by vehicles. Estimating the technological progress and tradeoffs between FCR and vehicle attributes is important for assessing the viability of meeting future targets. In this paper, we explored the relationship between vehicle FCR and other attributes using a regression model with data from 2009–2016. We also quantified the difference in the tradeoff between local and joint venture brands. The result showed that from 2009 to 2016, if power and curb mass were held constant, 2.3% and 2.9% annual technological progress should have been achieved for local and joint venture brands, respectively. The effectiveness of fuel-efficient technologies for joint venture brands is generally better than that of local brands. Impacts of other attributes on FCR were also assessed. The joint venture brands made more technological progress with FCR improvement than that of local brands. Even if 100% of technological progress (assume the technological progress in the future were the same as that of 2009–2016) investment were used to improve actual FCR after 2016, it would be difficult to meet 2020 target. Accelerating the adoption of fuel-efficient technologies, and controlling weight and performance, are both needed to achieve the 2020 and 2025 targets.
1. Introduction
The total number of vehicles in China has increased dramatically over the past decades and reached 231.2 million in 2018 (excluding 9.06 million three-wheeled vehicles and low-speed trucks) [1]. The rapid growth in vehicle numbers has caused serious environmental and energy security problems. In 2015, nearly 700 million tons of carbon dioxide (CO2) was produced from China’s road traffic, and these emissions are increasing [2]. China’s dependency on foreign countries for oil reached 68.4% in 2017 [3]. Automotive gasoline and diesel accounted for 80% of all gasoline and diesel consumption in 2017. To reduce the fuel consumption from passenger cars, China has issued a series of fuel consumption rate (FCR) standards and regulations for passenger vehicles. China released its first FCR limit standard for passenger vehicles in 2004 [4]. The corporate average FCR standard for passenger vehicles was released in 2011 [5] and updated in 2014 [6]. China also set the FCR targets for new passenger vehicles to 5.0 L/100 km in 2020 [7] and 4.0 L/100 km in 2025.
Globally, the transport sector contributes about one-fourth of total fossil fuel greenhouse gas (GHG) emissions, about three-quarters of that amount come from road transport [8]. To curb the GHG emissions from road transport, ten countries and regions including China, U.S., EU, and Japan, etc., have established mandatory or voluntary standards for light-duty vehicles [9,10].
There are two pathways to achieve the increasingly stringent passenger vehicle FCR target for carmakers. One is to produce more new energy vehicles (NEVs), as the electricity consumption of NEVs is calculated as zero, and they have multipliers in the Phase IV standard. In the Phase IV standard [6], the equivalent energy consumption of battery electric vehicles (BEV), the electric-drive part of plug-in hybrid vehicles (PHEV) and fuel cell vehicles (FCV) are calculated as zero. The multiplier of NEVs is set at five from 2016 to 2017, decreasing to three from 2018 to 2019, and two in 2020. The other pathway for compliance is to improve the FCR of conventional vehicles by deploying fuel-efficient technologies or adjusting portfolios by producing more smaller and lighter vehicles. As there are still many barriers to the promotion of NEVs, such as high retail prices, short electric ranges and a shortage of charging infrastructure [11], improving the FCR of conventional vehicles has become one of the necessary paths for carmakers to comply with their FCR targets.
With the tightening passenger vehicle FCR targets and regulations, China achieved 1.7% FCR improvement annually for the period 2009–2017. The market penetration of fuel-efficient technologies is increasing rapidly. The adoption rate of gasoline direct injection (GDI) and turbocharging for new passenger vehicles in China reached 39.39% and 45.11% in 2017 [3], from 0.5% and 3.4% in 2009 [12], respectively.
Previous research found that the official tested FCR is highly correlated with curb weight, power, acceleration time, and other characteristics. By using the features of the U.S. car from 1975 to 2009, the research found that a 1% increase in weight results in a 0.69% increase in FCR, and a 1% reduction in 0–97 km/h acceleration time results in a 0.44% increase in FCR when holding all else equal [13]. Similar results were also found by using the technical specifications and fuel consumption information of automobiles for sale in Europe from 1975 to 2015 [14]. After reviewing relevant studies, the fuel-mass coefficients (the ratio of FCR change (%) and weight change (%)) was found to be in the range of 0.315−0.71 [15]. By evaluating a wide range of vehicle case studies of gasoline turbocharged cars, which represent the 2015 European market, the fuel reduction value coefficient (the ratio of FCR achieved through mass reduction to vehicle mass reduction) was found within the range of 0.159−0.237 L/100km*100kg for the mass reduction only and 0.252−0.477L/100km*100kg for the secondary effect [16]. The combination of life cycle assessment with the traditional design procedure was also proposed to assess the environmental performances of automotive component light weighting [17]. Fuel economy standards and regulations aim to improve the FCR of new passenger vehicles. In addition to FCR, consumers also pay attention to vehicle performance, etc., which are highly correlated with FCR. Thus, to analyze the feasibility of achieving the targets of 5.0 L/100 km in 2020 and 4.0 L/100 km in 2025 for new passenger vehicles in China, it is necessary to quantify the tradeoff between FCR and other attribute parameters of passenger vehicles in China.
Many studies have been conducted on the trend of passenger vehicle FCRs and the tradeoff between official tested FCR and other vehicle attributes. A new index called the Performance-Size-Fuel economy Index (PSFI) was proposed by An, which is defined as the product of the vehicle performance, size, and fuel economy [18]. The PSFI was used to assess the technical efficiency improvement rates of cars and trucks from 1977 to 2005 in the U.S. The PSFI showed good correlations and appeared quite linear for both cars and trucks by using the 1977 to 2005 data from the Fuel Economy Trends Report of the Environmental Protection Agency (EPA). The PSFI provides a way to measure the technological progress of vehicles, but it simply sets the coefficient values of the three variables to one, which requires further study and explanation. Compared with recent research results [13,14], the impact of curb weight on FCR could be exaggerated in the definition of PSFI. To better estimate the technological progress and the tradeoff between FCR and other attributes, Knittel built a regression model on fuel economy, weight, engine power, and torque, and also introduced the production possibilities frontier (PPF) to capture the technological progress. The result showed that if the power, torque and curb weight of the light-duty vehicle in the U.S. stayed at the same level as 1980, the fuel economy from 1980 to 2006 could have improved by nearly 50% for both passenger cars and light trucks [19]. Klier and Linn expanded Knittel’s analysis by matching engine data to vehicle production data. The changes in the rate were examined, and the results showed that recent changes in the U.S. and European fuel economy standards had increased the speed of technology adoption [20]. MacKenzie and Heywood extended Knittel’s econometric approach by adopting both vehicle system attributes and consumer amenities as independent variables. They found that between 1975 and 2009, per-mile fuel consumption could have been reduced by approximately 70%, or an average of 3.4% per year, if not for reductions in acceleration time and the introduction of new attributes and functionality to vehicles [13]. To the best of our knowledge, this topic for China has not been carefully studied before due to a lack of sufficient data.
In this paper, we mainly aimed to address the following points:
- Summarize the trend of FCR and vehicle characteristics for Chinese passenger vehicles for 2009–2016 based on a comprehensive database built by China Automotive Technology and Research Center (CATARC).
- Construct a quantitative model between FCR and vehicle attributes to estimate the impact of vehicle characteristics on FCR and the technological progress for local and joint venture manufacturers (Chinese domestic carmakers are generally divided into the joint venture and local corporations. Joint venture corporations are generally jointly invested by foreign carmakers and Chinese carmakers, such as SAIC-Volkswagen, which was established by Volkswagen and Shanghai Automotive Industry Corporation (SAIC). In the joint venture corporations, the technology and brand are usually provided by the foreign side. The Chinese side usually provides land use rights and funds. The vehicle models produced by the joint venture corporation is called joint venture brand cars. Local corporations are usually 100% owned by Chinese companies, with completely independent product modification rights and brand operation rights. The vehicle models produced by local corporations are called local brands, such as BYD and Geely. Since the local brands and joint venture brands have significant differences in the quota of different vehicle types and technical characteristics, they are studied separately in this paper), respectively.
- Analyze the differences between the joint venture and the local brands in the tradeoff between FCR and vehicle attributes.
2. Data
The data used in this paper were from the Automotive Data Center Database of CATARC, including FCR in L/100 km, vehicle level characteristics (such as curb weight, vehicle acceleration time, etc.), engine attributes (such as engine power, torque, etc.), fuel-efficient technology configuration (such as engine aspiration type, fuel injection mode, etc.), and production by model and year for all new passenger vehicles (according to GB/T 3730.3–2001, the passenger vehicle in China is defined as a vehicle designed and constructed for the carriage of passengers and having a maximum design mass not exceeding 3.5 tons) produced by domestic manufacturers between 2009 and 2016. Gasoline vehicles dominated the conventional vehicle market of China and other fuel types of vehicles, such as diesel vehicles, bi-fuel vehicles, etc., accounted for less than 2% of the total market. In this paper, we focused only on gasoline passenger vehicles. The total number of gasoline passenger vehicle models was 14,183, which were all used to run the regression model introduced in the methodology section.
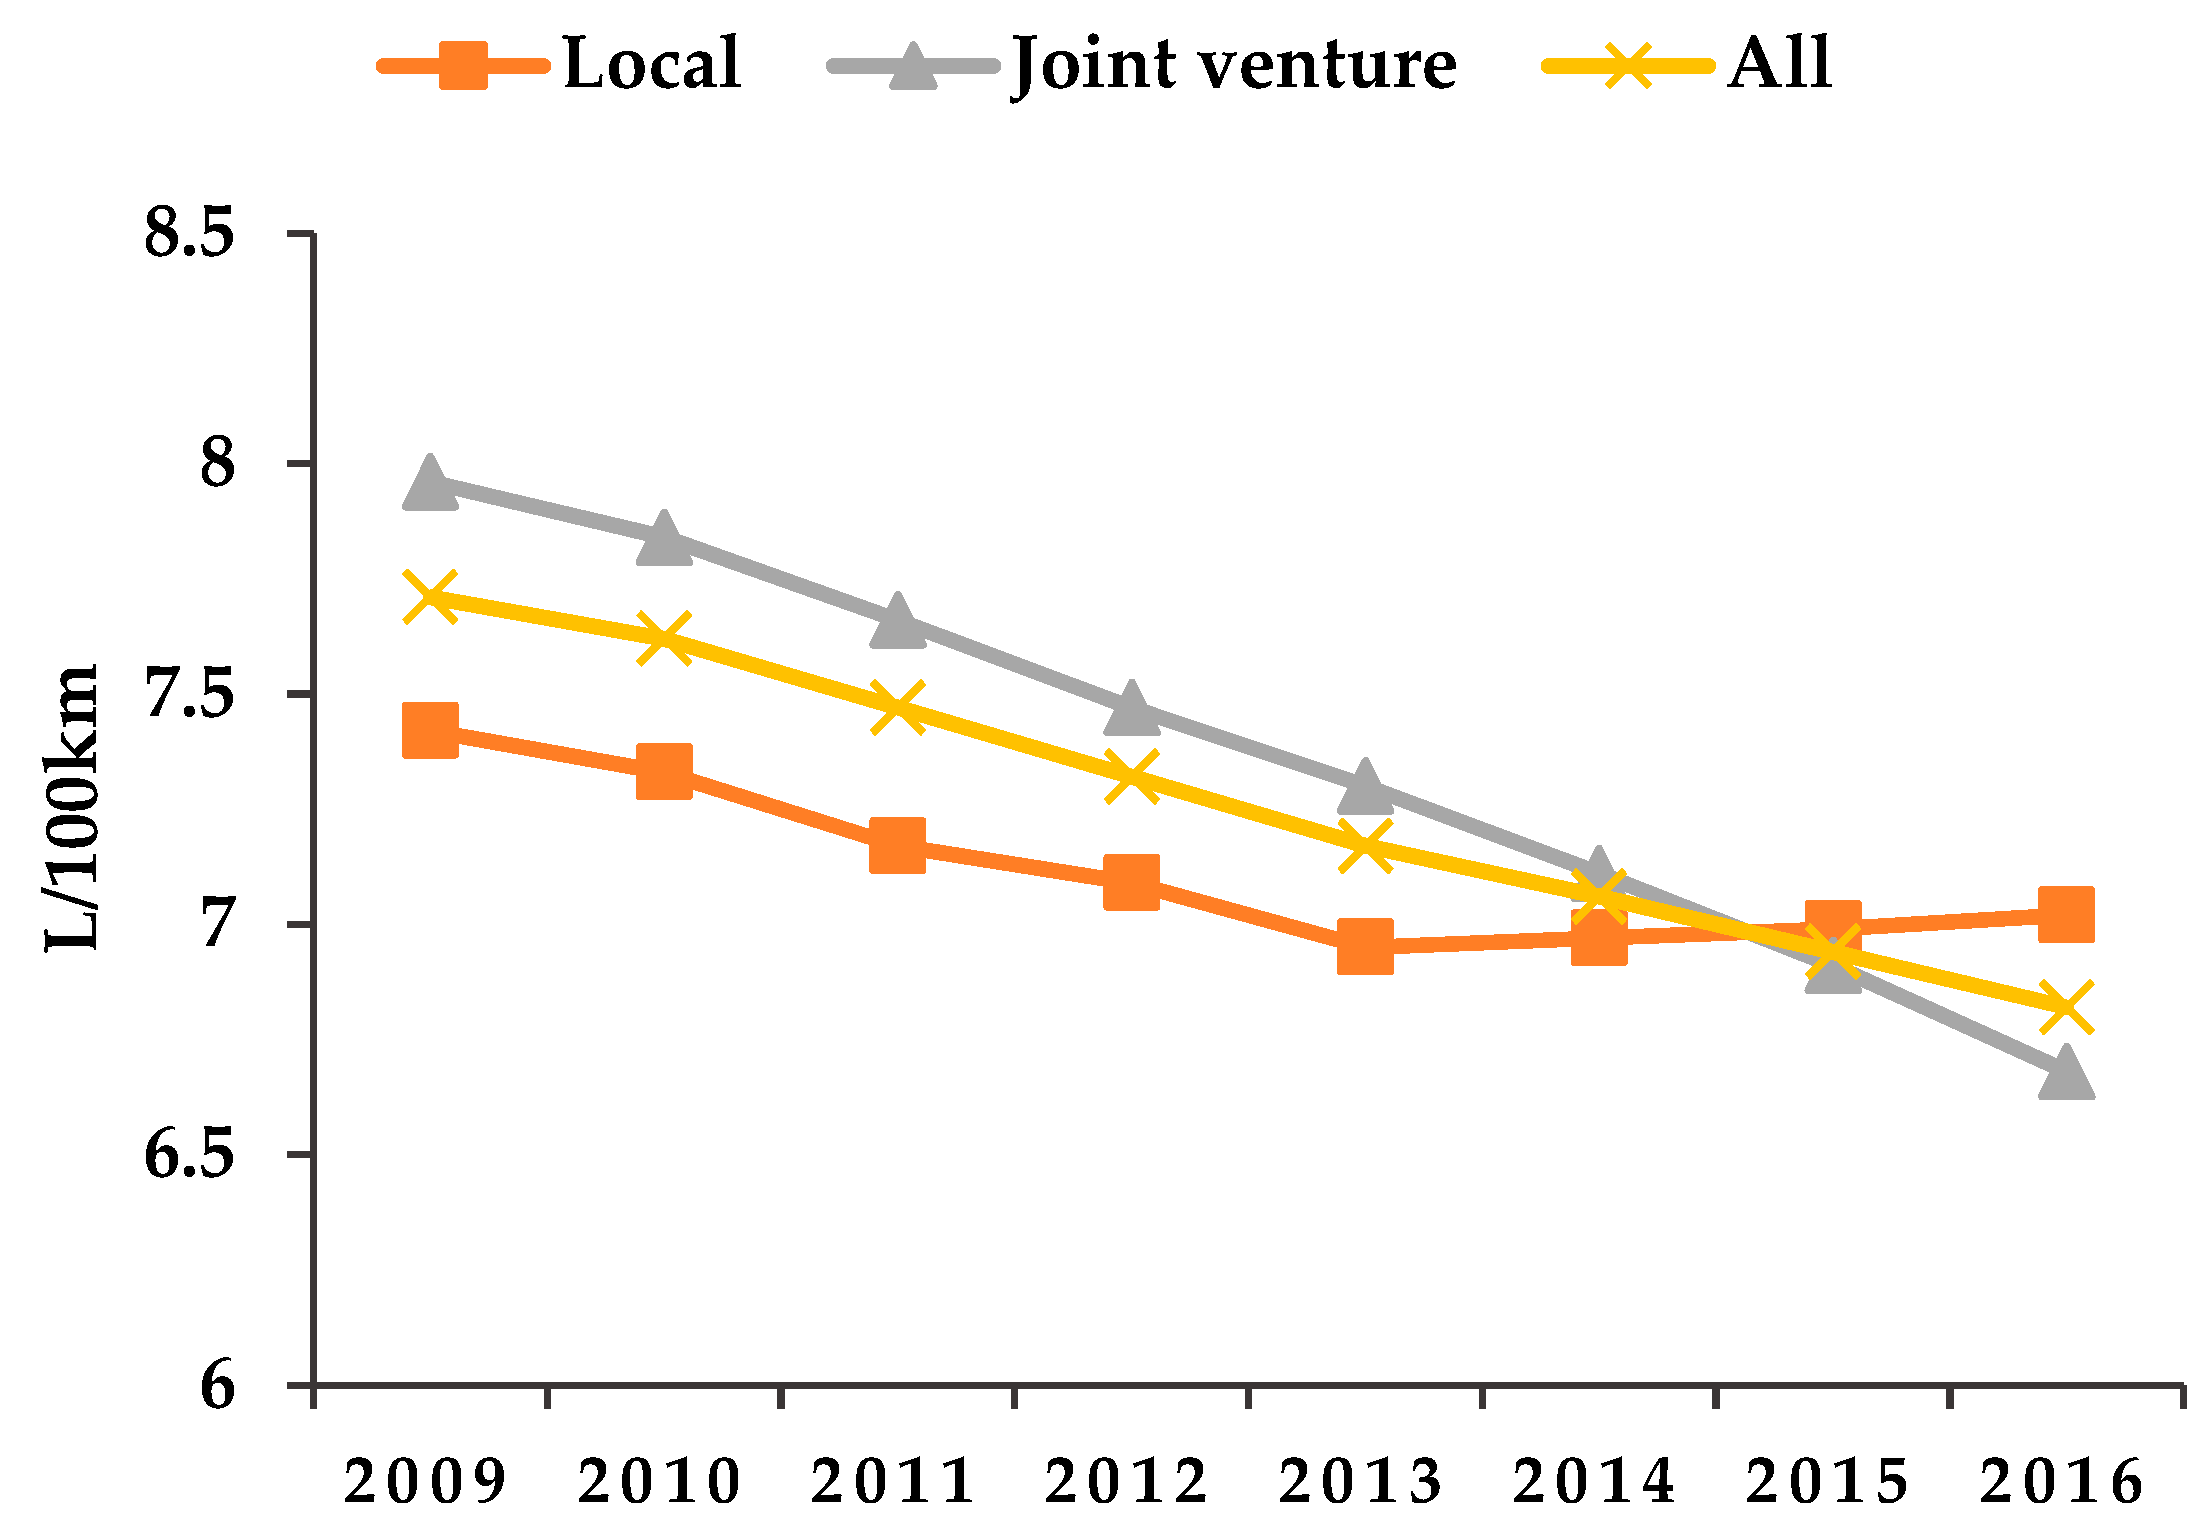
Figure 1 illustrates the production-weighted FCR of domestic passenger vehicles from 2009 to 2016. As shown in Figure 1, the average official tested FCR of gasoline passenger vehicles in China improved from 7.71 L/100 km in 2009 to 6.82 L/100 km in 2016, with an annual improvement rate of 1.7% (the trend is the result of both the improvement of vehicle fuel efficiency and change of market share for different vehicle types and classes). The unadjusted average fuel economy for cars in the U.S. market increased from 32.1 MPG (equivalent to 7.32 L/100 km after unit conversion) in 2009 to 36.9 MPG (6.37 L/100 km) in 2016 [21], with an annual improvement rate of 2.0%. In the EU market, the average CO2 emissions from new gasoline passenger cars decreased from 146.6 g/km (equivalent to 6.27 L/100 km) in 2009 to 121.7 g/km (equivalent to 5.20 L/100 km) in 2016 [22], with an annual improvement rate of 2.62%. As the passenger vehicle FCR in both the EU and China was tested under the New European Driving Cycle (NEDC) between 2009 and 2016, the FCRs of passenger vehicles in the EU and China were comparable. We found that the FCR improvement in the EU was faster than China, and there was a big gap between the FCR of passenger vehicles in China and the EU. The FCR gap between China and the EU might be due to two main reasons. Firstly, the curb weight in the EU was lower than that of China. Secondly, the EU had a higher adoption rate of fuel-efficient technologies for passenger vehicles than China.
Curb weight is the basis for the current FCR standard for passenger vehicles in China. As illustrated in Figure 2, the production-weighted passenger vehicle curb weight increased by 13.1%, from 1222 kg in 2009 to 1382 kg in 2016. The increasing curb weight may be mainly due to the increasing percentage of sales and stock for sport utility vehicles (SUVs) and multi-purpose vehicles (MPVs). The SUVs and MPVs stock dramatically increased from 10.3% and 4.3% in 2012 to 20.0% and 6.9% in 2016, respectively [23].
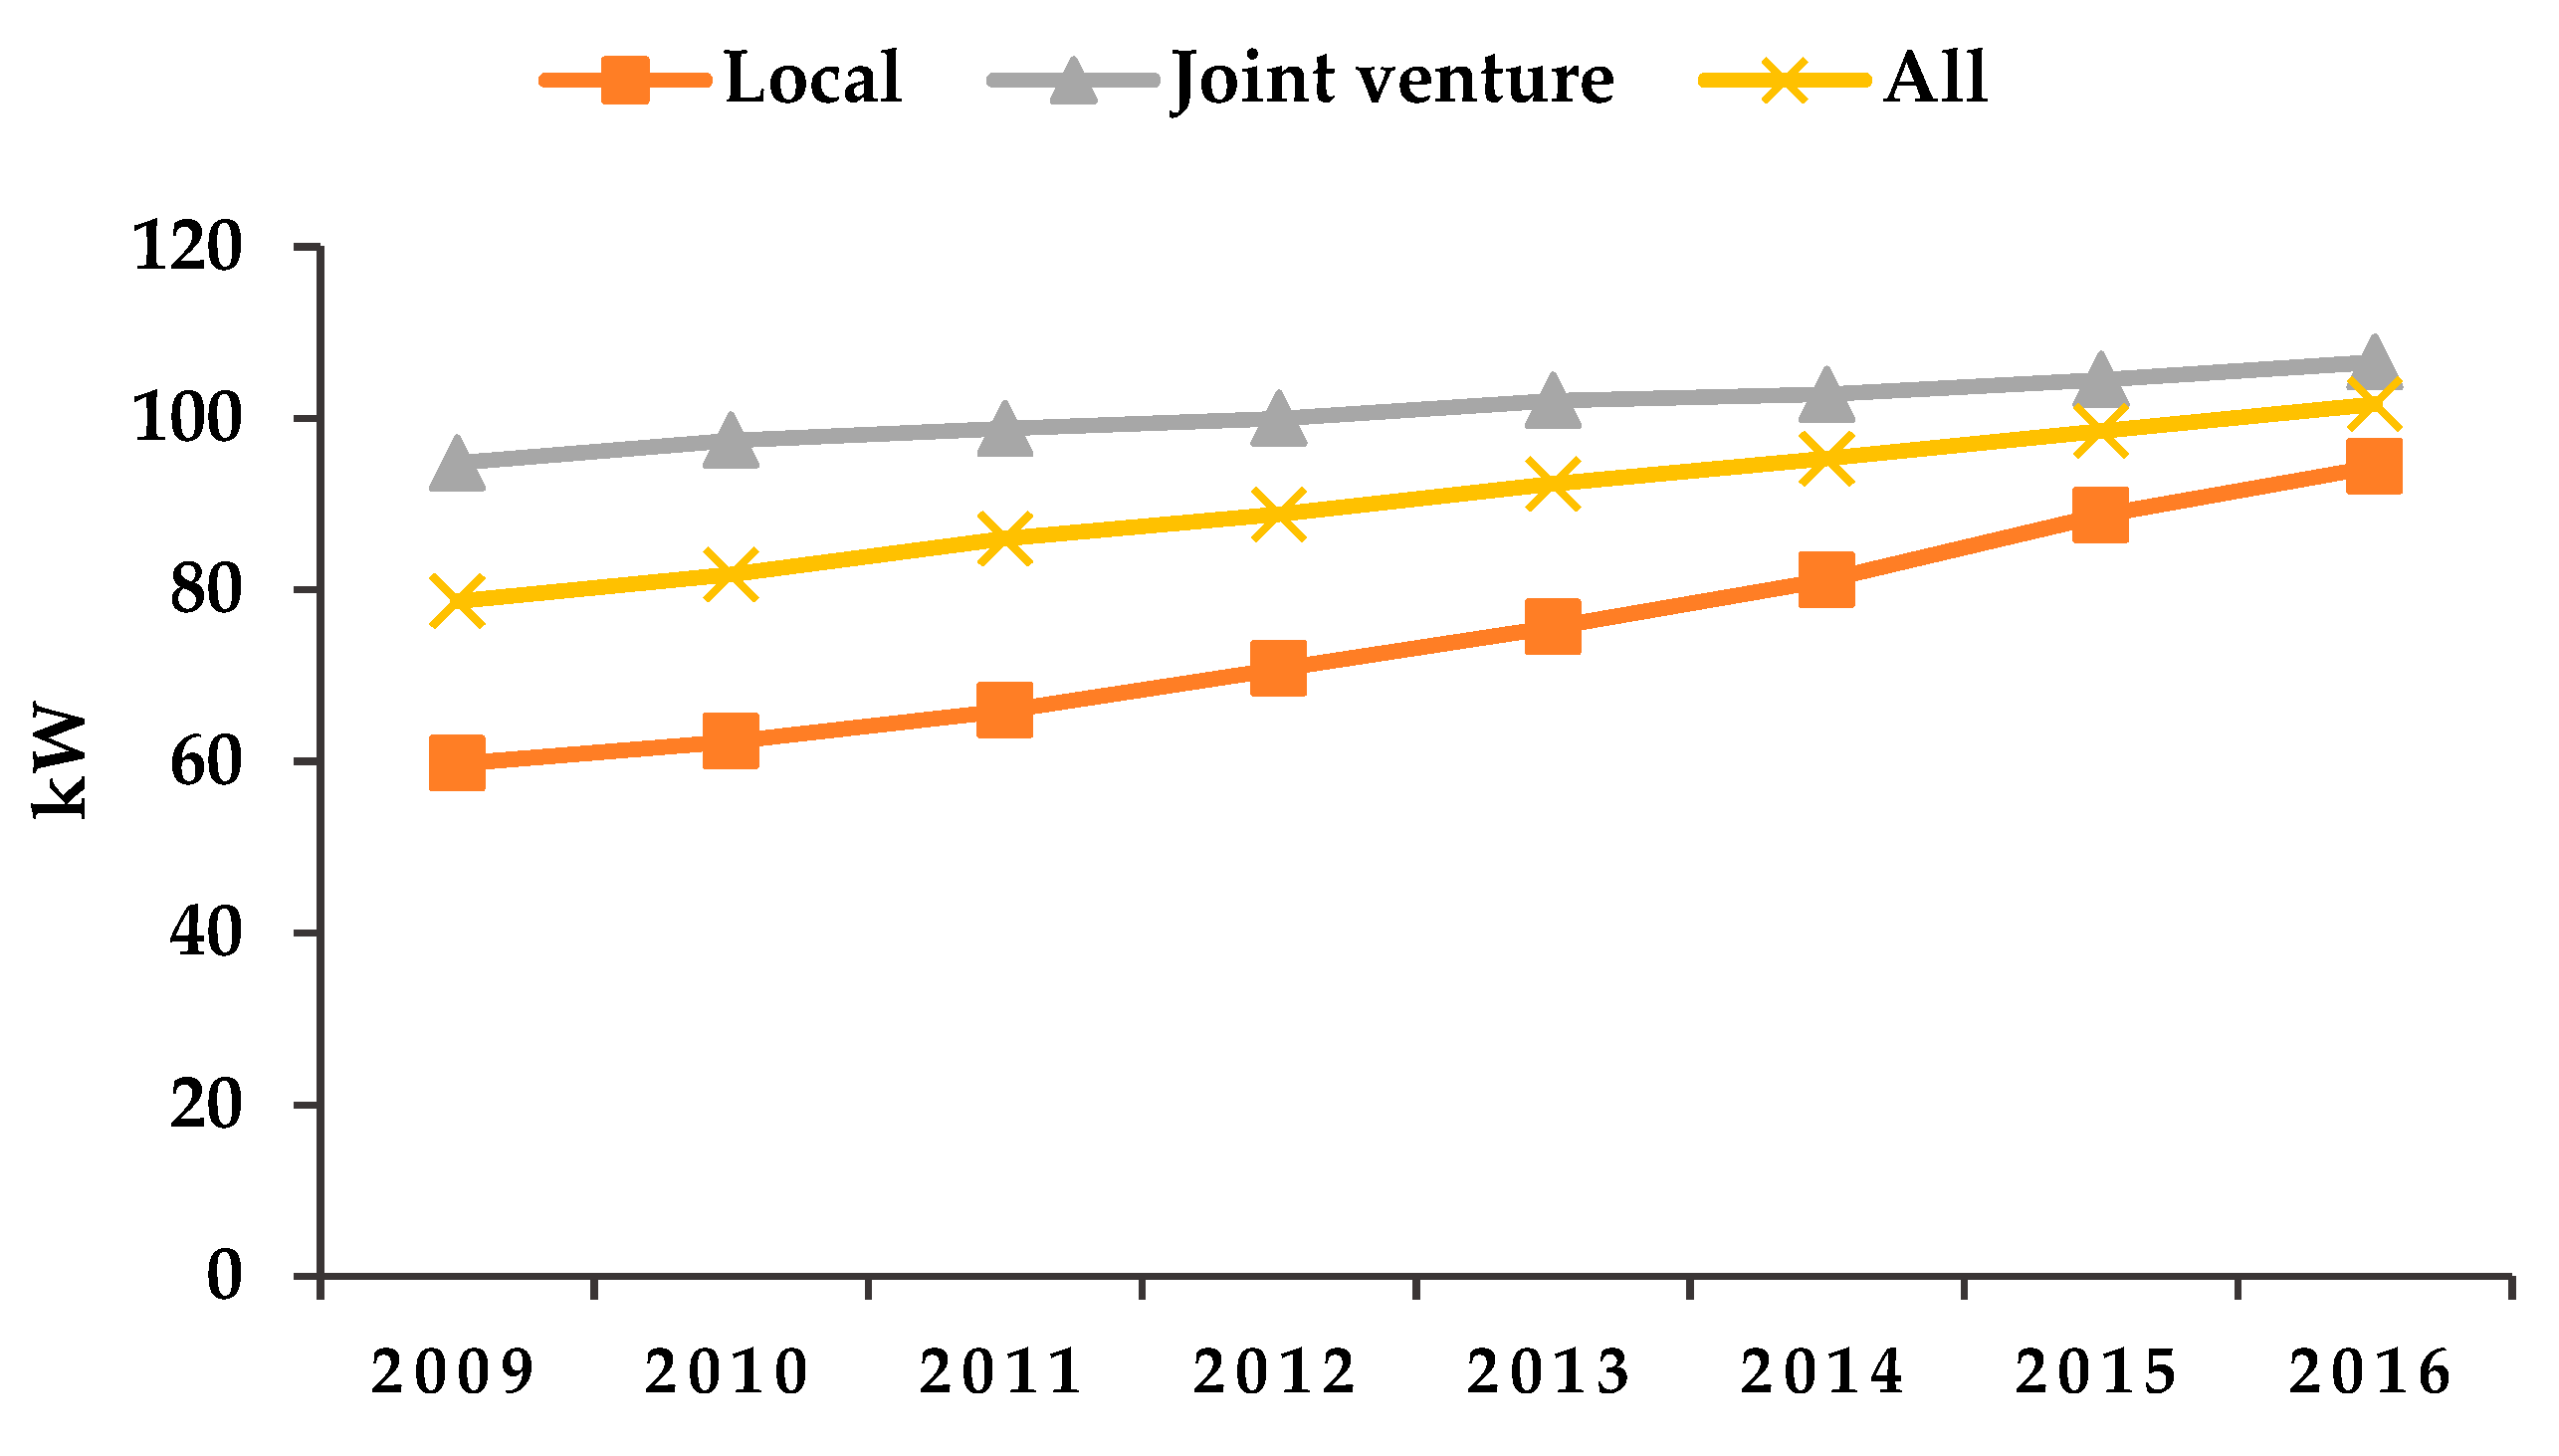
As illustrated in Figure 3, the production-weighted power increased from 78.7 kW in 2009 to 101.7 kW in 2016, with an annual growth rate of 3.7%. The negative effect of increasing power on the FCR of passenger vehicles has already been realized in the U.S. and EU markets. To better estimate the effect of vehicle attributes on FCR, it is necessary to explore the relationship between FCR and other attributes of passenger vehicles in the Chinese market by using an econometric model.
3. Methodology
There are generally two ways to achieve the desired goal in this paper. The engineering simulation method could simulate the relationship between FCR and the influencing factors. Based on engineering simulation analysis, the FCR can also be predicted based on the change of influencing factors. However, the simulation method requires high quantity and quality of input data, and the simulation results for certain models may not represent the nationwide fleet. A linear regression method based mainly on the methodology of Knittel [19] and MacKenzie [13] was adopted in this study to analyze the relationship between official tested FCR and observable variables such as power, curb weight, fuel-efficient technology and other unobservable variables, such as vehicle brand, build year, etc., as shown in Equation (1):
where represents the FCR of passenger vehicle model i in year t in the unit of L/100 km. is a constant. is the curb weight in kg. is the 0 to 100 km/h acceleration time in seconds. is a vector of dummy variables including whether the vehicle has a manual transmission, whether the vehicle is an SUV, or whether the vehicle has a turbocharge. is the year fixed effects to estimate the technological progress by year t. represents the difference by vehicle brands. We chose the vehicle brand rather than the manufacturer as a variable because the same manufacturer often produces more than one brand, and the vehicle characteristics of different brands vary widely. For instance, Changan Ford Mazda Corporation has four brands: the brand Ford of Sino-U.S., the brand Mazda of Sino-Japan, the brand Volvo of Sino-EU, and the local brand Changan. is the random error term.
As is a set of variables to estimate the annual technological growth, if does not include any fuel-efficient technology, then will capture all the technological growth in year . If vehicle attributes do not change, represents the potential FCR improvement in year t compared with the FCR in the base year due to the fuel-efficient technology deployment, as shown in Equation (2):
where, represents FCR in year t. represents FCR in the base year. For small values of , .
4. Results Analysis
4.1. Model Estimation Results
Table 1 shows the estimation results of the regression models for passenger vehicle FCRs as a function of curb weight, power, acceleration time, and other attributes based on Equation (1). The products of joint venture brands and local brands showed great differences in both FCR and other attributes from 2009 to 2016. In this paper, we estimated the joint venture brands and local brands separately and compared them with each other. In each case, we estimated four models with different sets of control variables to explore the technological progress and effects of vehicle attributes on the FCR from 2009 to 2016. The estimated coefficients represent the elasticity coefficients of corresponding variables to FCR. The variables of all models include vehicle types, year fixed effect, vehicle brand, and curb weight. We captured the annual technological growth by using the year fixed effect while holding other variables constant. The estimate results are shown in Table 1. We also explored the effects of curb weight, acceleration time, power, drive type, turbocharging, GDI, and advanced transmissions on the official tested FCR.
Model 1 controlled the curb weight, power, vehicle type, year fixed effect, and brands. The fuel-efficient technologies, such as turbocharging, GDI, and advanced transmissions (Continuously Variable Transmission (CVT), Dual-clutch Transmission (DCT), etc.), were not controlled in Model 1, so that we could capture the technological progress for 2009–2016 through the year fixed effects while holding curb weight, power, vehicle type, and brand constant. The estimation results of Model 1 show that a 1% increase in curb weight results in a 0.86% and 0.85% increase in FCR for local brands and joint venture brands, respectively. A 1% increase in power leads to a 0.061% decrease in FCR for local brands in Model 1. The coefficient of power is negative, which is opposite to similar studies [13,14] but consistent with the results of Figure 4 and Figure 5. Figure 4 and Figure 5 show the linear regression result of power and FCR when holding curb weight constant (actually in a relatively small interval). The effect of power on FCR in Model 1 is because models with larger power are always more expensive and equipped with more fuel-efficient technologies, resulting in lower FCR. The coefficients of curb weight and power will be more reasonable if the model controls more variables of fuel-efficient technologies. More details of the results will be discussed in Model 3 and Model 4. The year fixed effect of local and joint venture brands between 2009 to 2016 are 16.1% and 20.3%, respectively, which means that if the controlling variables were kept constant in the base year of 2009, the local and joint venture brands could achieve the FCR improvement rate of 16.1% and 20.3% in 2016, respectively. We can also conclude that joint venture vehicles showed faster technological progress than that of local brands.
Model 2 is similar to Model 1 but replaces power with vehicle acceleration time. The coefficients of FCR to curb weight decrease, which is inconsistent with the findings of MacKenzie and Heywood. It is expected that the increase in weight at a constant power will result in both higher FCR and slower acceleration, but our results show this is not the case. The explanation is that power and acceleration time are both related to fuel-efficient technologies. In Model 2, the decreasing acceleration time may be accompanied by the deployment of fuel-efficient technologies. A comparison of the effects of power and acceleration time on the sensitivity of FCR to curb weight after controlling more variables will be discussed in Models 4 and 5.
Model 3 further calls for fuel-efficient technologies, such as turbocharging, GDI, advanced transmissions, drive type, and specific power deciles based on Model 1. Like the Model 5 proposed by MacKenzie and Heywood, it calls for specific power deciles as dummy variables to reflect the technical level of the engine and to make this model more robust and explanatory. The results show that compared with Model 1, the sensitivity of FCR to curb weight increases to 0.164 for local brands and 0.263 for joint venture brands after controlling more attributes. The sensitivities of the dummy variables automatic transmission (AT) and CVT to the FCR for local brands are 7.8% and 5.0%, which means that, compared with manual transmission (MT), AT and CVT could increase the passenger vehicle FCR by 7.8% and 5.0%, respectively, when other variables are constant. For the joint venture carmakers, the coefficients of AT and CVT are 4.5% and −4.4%. From the above, we can conclude that, compared with joint venture brands, the effectiveness of AT and CVT for local brands needs to be improved. The sensitivities of GDI to FCR are −3.1% for local brands and −6.5% for joint venture brands, which means the GDI of joint venture brands has a better effect than that of local brands.
Compared with Model 3, Model 4 replaces power with vehicle acceleration time. Instead of decreasing the sensitivity of FCR to curb weight in Model 1 and Model 2, this change increases it. After calling for more fuel-efficient technologies, especially those related with power and acceleration time, the change of sensitivity of FCR to curb weight is consistent with the findings of MacKenzie and Heywood and can be explained by the increase in weight at a constant acceleration time, which requires a higher FCR for both weight change and power change.
4.2. Technological Growth
Technological progress is captured by the year fixed effect . To make technological progress more intuitive, we define it as follows:
The results of the technological progress estimation are shown in Table 2. The results of these four models show that the technological progress of the joint venture is greater than that of local brands. In Model 1, the joint venture shows an 18.4% improvement from 2009 to 2016, which is faster than local brands, with an improvement of 14.9% from 2009 to 2016. The results are consistent with the penetration of fuel-efficient technologies by brands from 2009 to 2016 in China [12].
When holding other variables constant at the base year, the mathematical expression of FCR potential () is:
In this paper, we set 2009 as the base year, and the is the actual FCR in 2009. is regarded as the FCR reduction potential for the target year. is the year fixed effect.
Figure 6 shows the actual FCR and expected FCR of different models shown in Table 2 by Equation (4). The solid and dotted lines with different colors in Figure 6 indicate the results of local brands and joint venture brands, respectively. The blue lines indicate the actual FCR of new passenger vehicles. The green lines show the FCR estimates if curb weight, power, and the share of vehicle types had remained at the 2009 level (Model 1 in Table 2). The black lines represent the FCR estimates if the curb weight, vehicle acceleration performance, and the share of different vehicle types remained at the 2009 levels (Model 2 in Table 2). The red lines represent the FCR estimates if the weight, power, drive type, powertrain features (turbocharging, GDI, transmission, etc.) and the share of vehicle types remained at the 2009 levels (Model 3 in Table 2).
From Figure 6, we find that, for local and joint venture brands, 1) the actual FCR was reduced by 5.4% and 16.1%, respectively. 2) Holding weight, power, and the share of vehicle types constant at the 2009 levels, the FCR could have been reduced by 14.9% and 18.4%, respectively. 3) If weight, acceleration time, and the share of vehicle types remain unchanged, the FCR could have been reduced by 15.9% and 18.5%, respectively. 4) If weight, power, 4WD, powertrain features, and the share of vehicle types remained constant at 2009 levels, the FCR could have been reduced by 10.5% and 12.7%, respectively.
Table 3 summarizes some results of the analogous studies that focused on the technological progress of U.S. and EU passenger vehicle markets and shows a comparison with the technological progress of passenger vehicles in China. China implemented its first passenger vehicle FCR standard in 2004, and then updated the standard in 2008, 2011 and 2014, respectively. China also set its passenger vehicle FCR target at 5.0 L/100 km by 2020. The compliance pressure from the FCR standard forces carmakers to accelerate the adoption of fuel-efficient technologies in the Chinese market. The technological progress is more rapid than those of the EU and U.S., as shown in Table 3. If we hold weight and power constant, the U.S. and Europe show a 1.7% (from 1975 to 2015) and 1.2% (from 1975 to 2009) annual technological progress, which is lower than the 2.3% and 2.9% for local and joint venture brands from 2009 to 2015. Even if we control more variables, such as powertrain features, the annual technological progress could still reach 1.7% and 1.9% for local and joint venture brands, respectively. It is important to note that technological progress is not distributed evenly over time. The results of MacKenzie show that the U.S. would have reached an annual technological progress of 5% between 1975 and 1990, and 2.1% between 1990 and 2009, if not for changes in acceleration, features, and functionality. The results of Hu and Chen show that the EU had a solid improvement in fuel-efficient technology with an annual technological progress rate of 2.8% from 2005 to 2015. However, there was no noticeable improvement in potential FCR reduction from 1975 to 2005 in the EU.
4.3. Comparison of Tradeoffs Between FCR and Other Attributes
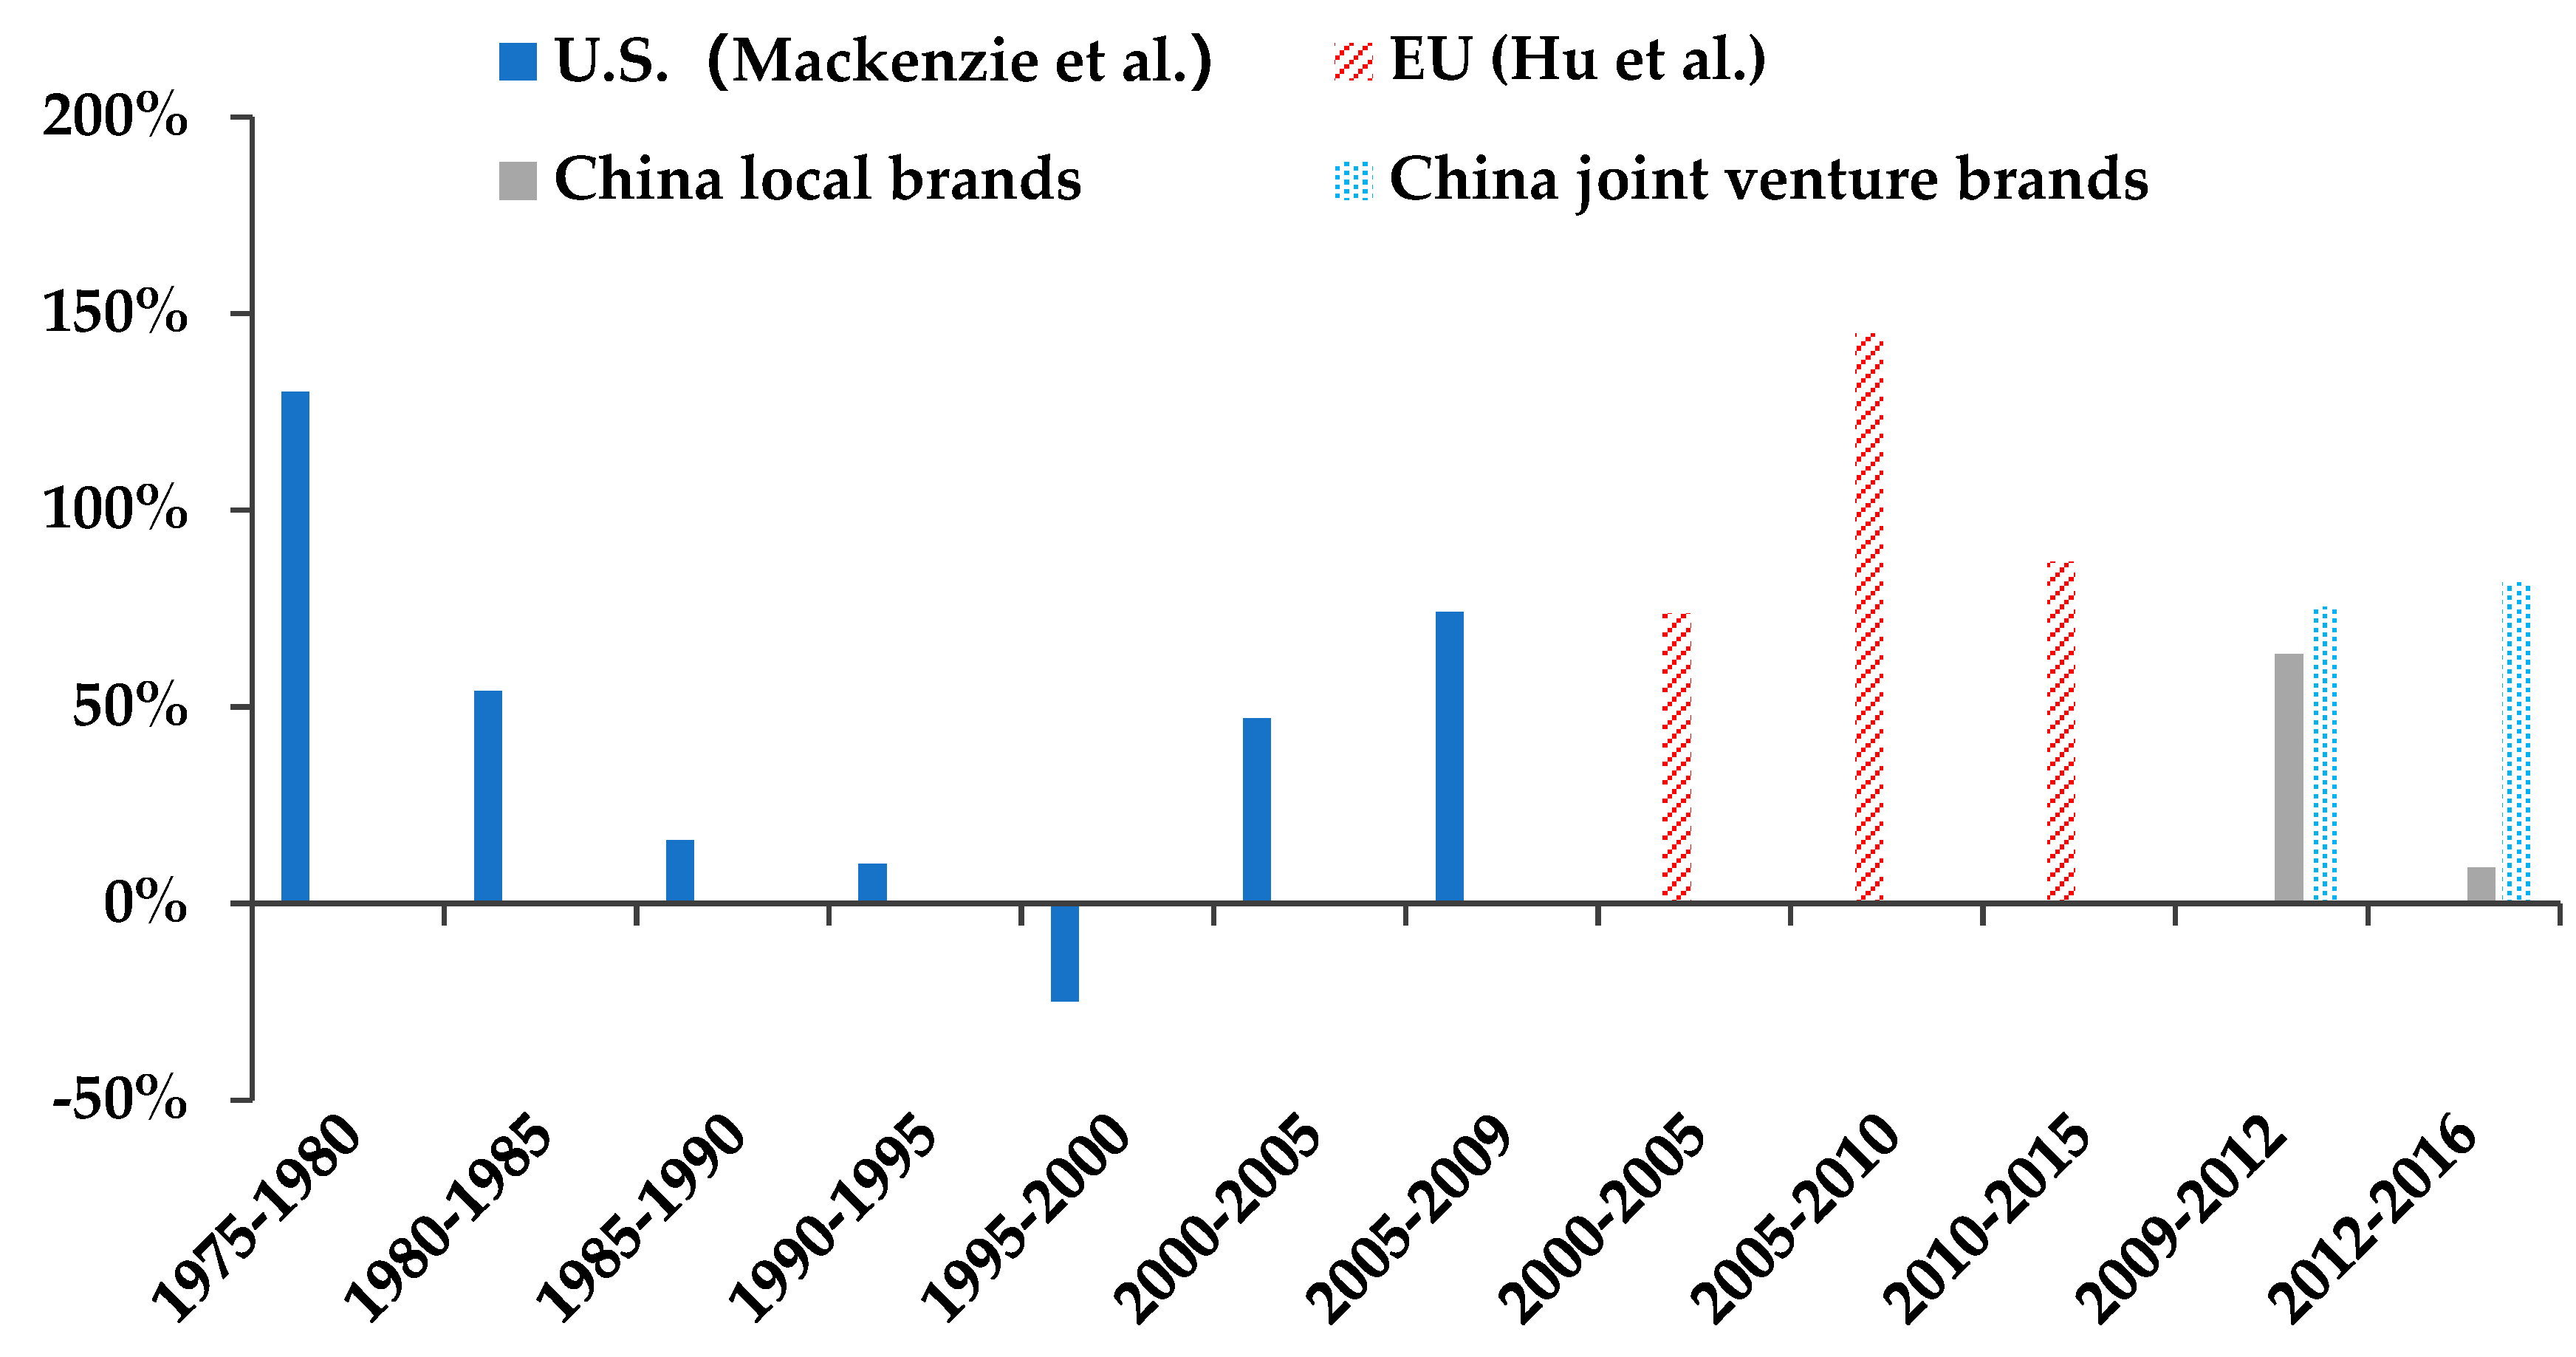
Banddivadekar [24] introduced an index to quantify the trade-offs among vehicle fuel consumption, performance, and size, which is called Emphasis on Reducing Fuel Consumption (ERFC). We modified the ERFC equation by converting fuel economy (commonly expressed as miles per gallon) to FCR (expressed as liters per 100 km) in Equation (5):
where is the actual FCR in the base year, is the actual fuel consumption in the target year, and is the evaluated fuel consumption, as shown in Table 2, holding the other variables constant. is the index quantifying how much technological progress is used for improving fuel efficiency during the base year and the target year.
Figure 7 shows the comparisons of ERFC between the U.S., EU, and China (based on the results of Model 1) during the various periods. The ERFC of the U.S. is from the results of MacKenzie and Heywood, and the ERFC of Europe was calculated from the estimation results of Hu and Chen. The ERFC values of the U.S. are highly correlated with the Corporate Average Fuel Economy (CAFE) standard and fuel price. It varied between 130%, when the U.S. was facing an oil crisis at the beginning of CAFE standard implementation during 1975–1980, and −25%, during the unchanged stringency of the CAFE standard during 1995–2000. Europe also had a high ERFC value (ranging from 74% to 145% during 2000–2015) after the European Commission adopted a Community Strategy based on three pillars for reducing CO2 emissions from cars in 1995. China released its first FCR limits standard in 2004 and updated the standard in 2008. Passenger vehicles that do not meet the FCR limit standard were not allowed to be produced and sold. Therefore, the ERFC values of local and joint venture brands in 2009–2012 showed a relatively high value of more than 60%. To achieve the target of 6.9 L/100 km in 2015, China introduced Corporate Average Fuel Consumption (CAFC) management by releasing the Phase III FCR standard for passenger vehicles in 2011, but there were no effective non-compliance penalties until China introduced CAFC and New Energy Vehicle Credits Regulation in 2017 [25]. Local brands showed much lower ERFC than the joint venture brands, especially during 2012–2016 (9% versus 81%).
5. Conclusions
Our analysis showed that China’s passenger vehicles underwent significant technological progress due to the rapidly increasing fuel-efficient technology adoption rate. However, to achieve the FCR target of 5.0 L/100 km in 2020 and 4.0 L/100 km in 2025, more than a 5% annual FCR improvement rate is needed from 2016. Our findings show that if we hold power and curb mass constant, a 2.3% to 2.9% annual technological progress was achieved between 2009 and 2016 for local and joint venture brands, respectively, which means an extra 2% technological progress is needed to achieve the future targets. As the NEVs are included in carmakers’ CAFC calculations for compliance with the standard, and counted as multiple vehicles, the target for gasoline vehicles in 2020 could be higher than 5.0 L/100 km. We predicted that 1.7 million NEVs will be produced in 2020 (the target of 2 million NEVs including passenger and commercial vehicles) with a ratio of EV to PHEV of 3:1. We found that the FCR target of the conventional vehicle in 2020 is around 5.7 L/100 km, which means an annual FCR improvement of 4.4% is needed based on the year 2016. If the ERFC value of 100% is retained, an extra annual technological progress rate of about 2% is still needed to achieve the 2020 FCR target. Our results indicate that China still faces significant challenges in achieving the FCR targets of 2020 and the future.
Our findings show that the technological progress of local brands is slower than that of joint venture brands. The regression results show the effects of fuel-efficient technologies, such as advanced transmission, GDI and turbocharging, for local brands are smaller than those of joint venture brands, which gives a reasonable explanation for why the technological progress of local brands is slower than that of the joint venture.
Our results show that the ERFC value of China’s local brands is decreasing from 63.5% (which means that 63.5% of total FCR reduction potential is used for improving fuel efficiency) between 2009 and 2012 to 9.1% between 2012 and 2016. This is mainly due to three reasons: 1) Local brands are more responsive to the high market demand for larger size and better performance vehicles such as SUVs and MPVs than joint venture brands. 2) The absence of non-compliance penalties of CAFC standards during 2012–2016. 3) Strong NEV incentive measures, such as multipliers, electric consumption considered as zero in the FCR standard, and fiscal incentives, resulted in rapid development of the NEV market, which reduced the willingness of local brands to develop fuel-efficient vehicles.
China introduced the CAFC and NEV Credits Regulation in 2017. All carmakers need to comply with specific CAFC requirements, while companies with large-scale production of conventional passenger vehicles need to comply with both CAFC and NEV targets. Under dual credit regulation, NEV credits can balance the negative CAFC credits. The carmakers with negative CAFC or NEV credits that are unbalanced will be not allowed to produce and sell new models that cannot comply with specific 2020 targets in the Phase IV standard (which is a stepped curve based on curb weight). As the deployment of NEV and fuel-efficient technology are two main compliance paths, in the future, we need not only pay attention to the tradeoff between FCR and vehicle attributes, but also the tradeoff between NEV and conventional vehicle technological progress under the newly introduced dual-credit scheme.
Author Contributions
Conceptualization, J.Z., R.Y. and Y.L.; methodology, J.Z., R.Y. and Y.L.; resources, D.Z.; writing—original draft preparation, J.Z., R.Y., Y.L. and Y.Z.; writing—review and editing, J.Z. and R.Y.
Funding
This research was funded by Energy Foundation China, grant number G–1607–24947 and G–1607–24944.
Acknowledgments
The authors would like to thank the anonymous reviewers for their reviews and comments.
Conflicts of Interest
The authors declare no conflict of interest.
Nomenclature
| Abbreviations | |
| FCR | Fuel Consumption Rate |
| NEV | New Energy Vehicle |
| BEV | Battery Electric Vehicle |
| PHEV | Plug-in Hybrid Vehicle |
| FCV | Fuel Cell Vehicle |
| GDI | Gasoline Direct Injection |
| PSFI | Performance-Size-Fuel economy Index |
| PPF | Production Possibilities Frontier |
| EPA | Environmental Protection Agency |
| CATARC | China Automotive Technology and Research Center |
| MPG | Miles Per Gallon |
| NEDC | New European Driving Cycle |
| SUVs | Sport Utility Vehicles |
| MPVs | Multi-Purpose Vehicles |
| CVT | Continuously Variable Transmission |
| DCT | Dual-clutch Transmission |
| AT | Automatic Transmission |
| MT | Manual Transmission |
| ERFC | Emphasis on Reducing Fuel Consumption |
| CAFE | Corporate Average Fuel Economy |
| CAFC | Corporate Average Fuel Consumption |
| Symbols | |
| Fuel consumption rate | |
| Curb weight | |
| 0 to 100 km/h acceleration time | |
| A vector of dummy variables | |
| A vector of coefficients | |
| The year fixed effects to estimate the technological progress | |
| The difference by vehicle brands | |
| The random error term | |
| Technological progress | |
| Subscripts | |
| i | Vehicle model |
| t | Year |
| base | Base year |
| cal | The actual fuel consumption rate |
| potential | Fuel consumption evaluated |
References
- National Bureau of Statistics (NBS), China’s 2018 Year National Economic and Social Development of Statistical Bulletin. Available online: http://www.stats.gov.cn/tjsj/zxfb/201902/t20190228_1651265.html (accessed on 10 June 2019).
- IEA. CO2 Emissions from Fuel Combustion; IEA: Paris, France, 2017. [Google Scholar]
- CATARC. Annual Report on Energy-Saving and New Energy Vehicle in China 2018; Posts and Telecom Press: Beijing, China, 2018. [Google Scholar]
- GAQSIQ. Limits of Fuel Consumption for Passenger Cars; GAQSIQ: Beijing, China, 2004; Volume GB 19578–2004.
- GAQSIQ. Fuel Consumption Evaluation Methods and Targets for Passenger Cars; GAQSIQ: Beijing, China, 2011; Volume GB 27999–2011.
- GAQSIQ. Fuel Consumption Evaluation Methods and Targets for Passenger Cars; GAQSIQ: Beijing, China, 2014; Volume GB 27999–2014.
- The Central People’s Government of China, Energy-Saving and New Energy Vehicle Industry Development Plan (2012–2020). Available online: http://www.gov.cn/zwgk/2012-07/09/content_2179032.htm (accessed on 10 June 2019).
- IEA. CO2 Emissions from Fuel Combustion 2016 Highlights; IEA: Paris, France, 2016. [Google Scholar]
- U.S. Energy Information Administration (EIA), Vehicle Standards around the World Aim to Improve FUEL Economy and Reduce Emissions. Available online: https://www.eia.gov/todayinenergy/detail.php?id=23572 (accessed on 10 June 2019).
- Bandivadekar, Z.Y.A. Light-Duty Vehicle Greenhouse Gas and Fuel Economy Standards; ICCT: Washington, DC, USA, 2017. [Google Scholar]
- Li, W.; Long, R.; Chen, H.; Geng, J. A review of factors influencing consumer intentions to adopt battery electric vehicles. Renew. Sustain. Energy Rev. 2017, 78, 318–328. [Google Scholar] [CrossRef]
- Zou, Y.; Ren, H.; Yu, R. Energy-saving technology application for conventional energy passenger cars in China. J. Automot. Saf. Energy 2017, 8, 102–108. [Google Scholar]
- MacKenzie, D.; Heywood, J.B. Quantifying efficiency technology improvements in US cars from 1975–2009. Appl. Energy 2015, 157, 918–928. [Google Scholar] [CrossRef]
- Hu, K.; Chen, Y. Technological growth of fuel efficiency in european automobile market 1975–2015. Energy Policy 2016, 98, 142–148. [Google Scholar] [CrossRef]
- Kim, H.C.; Wallington, T.J. Life-Cycle Energy and Greenhouse Gas Emission Benefits of Lightweighting in Automobiles: Review and Harmonization. Environ. Sci. Technol. 2013, 47, 6089–6097. [Google Scholar] [CrossRef] [PubMed]
- Pero, F.D.; Delogu, M.; Pierini, M. The effect of lightweighting in automotive LCA perspective: Estimation of mass-induced fuel consumption reduction for gasoline turbocharged vehicles. J. Clean. Prod. 2017, 154, 566–577. [Google Scholar] [CrossRef]
- Delogu, M.; Maltese, S.; Del Pero, F.; Zanchi, L.; Pierini, M.; Bonoli, A. Challenges for modelling and integrating environmental performances in concept design: The case of an automotive component lightweighting. Int. J. Sustain. Eng. 2018, 11, 135–148. [Google Scholar] [CrossRef]
- An, F.; DeCicco, J. Trends in Technical Efficiency Trade-Offs for the U.S. Light Vehicle Fleet. J. Engines 2007, 116, 859–873. [Google Scholar]
- Knittel, C.R. Automobiles on Steroids: Product Attribute Trade-Offs and Technological Progress in the Automobile Sector. Am. Econ. Rev. 2011, 101, 3368–3399. [Google Scholar] [CrossRef]
- Klier, T.H.; Linn, J. The Effect of Vehicle Fuel Economy Standards on Technology Adoption. J. Public Econ. 2016, 133, 41–63. [Google Scholar] [CrossRef]
- EPA. Light-Duty Automotive Technology, Carbon Dioxide Emissions, and Fuel Economy Trends: 1975 Through 2017; EPA: Washington, DC, USA, 2018.
- EEA. Monitoring CO2 Emissions from Passenger Cars and Vans in 2016; EEA: Copenhagen, Denmark, 2017.
- Zheng, J.; Zhou, Y.; Yu, R.; Zhao, D.; Lu, Z.; Zhang, P. Survival rate of China passenger vehicles: A data-driven approach. Energy Policy 2019, 129, 587–597. [Google Scholar] [CrossRef]
- Bandivadekar, A.; Bodek, K.; Cheah, L.; Evans, C.; Groode, T.; Heywood, J.; Kasseris, E.; Kromer, M.; Weiss, M. On the Road in 2035: Reducing Transportation’s Petroleum Consumption and GHG Emissions; Massachusetts Institute of Technology: Cambridge, MA, USA, 2008. [Google Scholar]
- MIIT Regulation for Corporate Average Fuel Consumption and New Energy Vehicle Credits of Passenger Vehicles. Available online: http://www.miit.gov.cn/n1146290/n4388791/c5826378/content.html (accessed on 10 June 2019).
Figure 1.
Production-weighted fuel consumption rate (FCR) of China’s domestic passenger vehicles in 2009–2016.
Figure 1.
Production-weighted fuel consumption rate (FCR) of China’s domestic passenger vehicles in 2009–2016.

Figure 2.
Production-weighted curb weight of China’s domestic passenger vehicles in 2009–2016.

Figure 3.
Production-weighted power of China’s domestic passenger vehicles in 2009–2016.

Figure 4.
Regression results of power and fuel consumption rate of models in the 1200–1300 kg curb weight class.
Figure 4.
Regression results of power and fuel consumption rate of models in the 1200–1300 kg curb weight class.

Figure 5.
Regression results of power and fuel consumption rate of models in the 1300–1400 kg curb weight class.
Figure 5.
Regression results of power and fuel consumption rate of models in the 1300–1400 kg curb weight class.

Figure 6.
Actual FCR of average new passenger vehicles, and potential FCR if various attributes had remained at 2009 levels for local and joint venture brands.
Figure 6.
Actual FCR of average new passenger vehicles, and potential FCR if various attributes had remained at 2009 levels for local and joint venture brands.

Figure 7.
Comparisons of Emphasis on Reducing Fuel Consumption (ERFC) between the U.S., EU, and China.
Figure 7.
Comparisons of Emphasis on Reducing Fuel Consumption (ERFC) between the U.S., EU, and China.


Table 1.
Results of estimating regression models of passenger vehicle FCR as a function of curb weight, power, acceleration time, and other attributes.
Table 1.
Results of estimating regression models of passenger vehicle FCR as a function of curb weight, power, acceleration time, and other attributes.
| Local Brands | Joint Venture Brands | |||||||
|---|---|---|---|---|---|---|---|---|
| Model 1 | Model 2 | Model 3 | Model 4 | Model 1 | Model 2 | Model 3 | Model 4 | |
| (Intercept) | –3.706 *** | –2.962 *** | –2.521 *** | –2.324 *** | –4.101 *** | –4.017 *** | –3.277 *** | –3.294 *** |
| –0.194 | –0.231 | –0.19 | –0.23 | –0.276 | –0.255 | –0.168 | –0.203 | |
| ln (curb weight) | 0.859 *** | 0.764 *** | 0.561 *** | 0.728 *** | 0.852 *** | 0.839 *** | 0.546 *** | 0.815 *** |
| –0.036 | –0.029 | –0.040 | –0.025 | –0.045 | –0.034 | –0.036 | –0.027 | |
| ln (power) | –0.061 * | 0.164 *** | –0.007 | 0.263 *** | ||||
| –0.026 | –0.032 | –0.026 | –0.041 | |||||
| ln(accel.) | –0.122 *** | –0.251 *** | –0.006 | –0.258 *** | ||||
| –0.026 | –0.038 | –0.018 | –0.04 | |||||
| 4WD/AWD | 0.009+ | 0.008 | 0.015 * | 0.011 | ||||
| –0.005 | –0.006 | –0.007 | –0.007 | |||||
| Turbo | 0.132 *** | 0.131 *** | –0.014 | –0.019 | ||||
| –0.021 | –0.02 | –0.021 | –0.022 | |||||
| GDI | –0.031 * | –0.033 * | –0.065 *** | –0.066 *** | ||||
| –0.014 | –0.015 | –0.015 | –0.016 | |||||
| AT | 0.078 *** | 0.030 ** | 0.045 *** | –0.013 | ||||
| –0.006 | –0.011 | –0.005 | –0.009 | |||||
| CVT | 0.050 *** | 0 | –0.044 *** | –0.117 *** | ||||
| –0.013 | –0.018 | –0.009 | –0.011 | |||||
| DCT | –0.022 * | –0.118 *** | –0.007 | –0.107 *** | ||||
| –0.009 | –0.018 | –0.012 | –0.022 | |||||
| Vehicle types | √ | √ | √ | √ | √ | √ | √ | √ |
| Year fixed effect | √ | √ | √ | √ | √ | √ | √ | √ |
| Brand | √ | √ | √ | √ | √ | √ | √ | √ |
| Specific power decile a | √ | √ | √ | √ | ||||
| Number of observations | 8516 | 8516 | 8516 | 8516 | 5667 | 5667 | 5667 | 5667 |
| 0.821 | 0.823 | 0.878 | 0.876 | 0.756 | 0.756 | 0.874 | 0.871 | |
| Adj. | 0.819 | 0.821 | 0.877 | 0.874 | 0.755 | 0.755 | 0.873 | 0.869 |
Statistical significance of t-tests on coefficient estimates: *** p < 0.001, ** p < 0.01, * p < 0.05, +p < 0.1.a. The first decile includes those passenger vehicles with engine specific power values in the lowest one-tenth of all passenger vehicles in their build year, etc.
Table 2.
Technological progress estimates for passenger vehicles in China from 2009 to 2016 (percent).
Table 2.
Technological progress estimates for passenger vehicles in China from 2009 to 2016 (percent).
| Local Brands | Joint Venture Brands | |||||||
|---|---|---|---|---|---|---|---|---|
| Model 1 | Model 2 | Model 3 | Model 4 | Model 1 | Model 2 | Model 3 | Model 4 | |
| 2010 | –1.6 | –1.7 | –0.9 | –1.0 | –3.2 | –3.2 | –2.1 | –2.2 |
| 2011 | –4.0 | –4.2 | –2.4 | –2.7 | –5.5 | –5.5 | –3.4 | –3.5 |
| 2012 | –6.9 | –7.4 | –4.5 | –4.7 | –8.1 | –8.1 | –5.4 | –5.6 |
| 2013 | –8.7 | –9.2 | –5.9 | –6.1 | –10.0 | –10.1 | –6.9 | –7.0 |
| 2014 | –10.8 | –11.5 | –7.6 | –7.8 | –12.7 | –12.8 | –9.0 | –9.1 |
| 2015 | –12.6 | –13.5 | –8.9 | –9.1 | –15.6 | –15.7 | –10.8 | –10.9 |
| 2016 | –14.9 | –15.9 | –10.5 | –10.7 | –18.4 | –18.5 | –12.7 | –12.8 |
Table 3.
Comparison of annual technological progress between the results of this work and other studies.
Table 3.
Comparison of annual technological progress between the results of this work and other studies.
| Source | Attributes Controlled | Year | Country | Annual Technological Progress |
|---|---|---|---|---|
| HU | Power, weight | 1975–2015 | EU | 1.2% |
| HU | Weight, accel. | 1975–2015 | EU | 1.4% |
| HU | Weight, engine attributes and amenities | 1975–2015 | EU | 0.7% |
| HU | Weight, engine attributes and amenities | 1975–2005 | EU | No noticeable improvement |
| HU | Weight, engine attributes and amenities | 2005–2015 | EU | 2.8% |
| MacKenzie | Power, weight | 1975–2009 | The U.S. | 1.7% |
| MacKenzie | Weight, accel. | 1975–2009 | The U.S. | 2.2% |
| MacKenzie | Accel. Features, functionality | 1975–2009 | The U.S. | 2.9% |
| MacKenzie | Accel. Features, functionality | 1975–1990 | The U.S. | 5% |
| MacKenzie | Accel. Features, functionality | 1990–2009 | The U.S. | 2.1% |
| This work | Power, weight | 2009–2016 | China | 2.3% (local brands) 2.9% (joint venture brands) |
| This work | Weight, accel. | 2009–2016 | China | 2.4% (local brands) 2.9% (joint venture brands) |
| This work | Power, weight, powertrain features | 2009–2016 | China | 1.7% (local brands) 1.9% (joint venture brands) |
© 2019 by the authors. Licensee MDPI, Basel, Switzerland. This article is an open access article distributed under the terms and conditions of the Creative Commons Attribution (CC BY) license (http://creativecommons.org/licenses/by/4.0/).
Share and Cite
MDPI and ACS Style
Zheng, J.; Yu, R.; Liu, Y.; Zou, Y.; Zhao, D. The Technological Progress of the Fuel Consumption Rate for Passenger Vehicles in China: 2009–2016. Energies 2019, 12, 2384. https://doi.org/10.3390/en12122384
AMA Style
Zheng J, Yu R, Liu Y, Zou Y, Zhao D. The Technological Progress of the Fuel Consumption Rate for Passenger Vehicles in China: 2009–2016. Energies. 2019; 12(12):2384. https://doi.org/10.3390/en12122384
Chicago/Turabian StyleZheng, Jihu, Rujie Yu, Yong Liu, Yuhong Zou, and Dongchang Zhao. 2019. "The Technological Progress of the Fuel Consumption Rate for Passenger Vehicles in China: 2009–2016" Energies 12, no. 12: 2384. https://doi.org/10.3390/en12122384
Note that from the first issue of 2016, this journal uses article numbers instead of page numbers. See further details here.