Article

Investigation of Analysis Methods for Pulse Decay Tests Considering Gas Adsorption

1
Institute of Mechanics, Chinese Academy of Sciences, Beijing 100190, China
2
Architectual Design and Research Institute of Tsinghua University, Beijing 100084, China
3
State Key Laboratory of Hydroscience and Engineering, Tsinghua University, Beijing 100084, China
*
Author to whom correspondence should be addressed.
Energies 2019, 12(13), 2562; https://doi.org/10.3390/en12132562
Submission received: 10 May 2019 / Revised: 9 June 2019 / Accepted: 1 July 2019 / Published: 3 July 2019
(This article belongs to the Special Issue Development of Unconventional Reservoirs)

Abstract

:
The pulse decay test is the main method employed to determine permeability for tight rocks, and is widely used. The testing gas can be strongly adsorbed on the pore surface of unconventional reservoir cores, such as shale and coal rock. However, gas adsorption has not been well considered in analysis pulse decay tests. In this study, the conventional flow model of adsorbed gas in porous media was modified by considering the volume of the adsorbed phase. Then, pulse decay tests of equilibrium sorption, unsteady state and pseudo-steady-state non-equilibrium sorption models, were analyzed by simulations. For equilibrium sorption, it is found that the Cui-correction method is excessive when the adsorbed phase volume is considered. This method is good at very low pressure, and is worse than the non-correction method at high pressure. When the testing pressure and Langmuir volume are large and the vessel volumes are small, a non-negligible error exists when using the Cui-correction method. If the vessel volumes are very large, gas adsorption can be ignored. For non-equilibrium sorption, the pulse decay characteristics of unsteady state and pseudo-steady-state non-equilibrium sorption models are similar to those of unsteady state and pseudo-steady-state dual-porosity models, respectively. When the upstream and downstream pressures become equal, they continue to decay until all of the pressures reach equilibrium. The Langmuir volume and pressure, the testing pressure and the porosity, affect the pseudo-storativity ratio and the pseudo-interporosity flow coefficient. Their impacts on non-equilibrium sorption models are similar to those of the storativity ratio and the interporosity flow coefficient in dual-porosity models. Like dual-porosity models, the pseudo-pressure derivative can be used to identify equilibrium and non-equilibrium sorption models at the early stage, and also the unsteady state and pseudo-steady-state non-equilibrium sorption models at the late stage. To identify models using the pseudo-pressure derivative at the early stage, the suitable vessel volumes should be chosen according to the core adsorption property, porosity and the testing pressure. Finally, experimental data are analyzed using the method proposed in this study, and the results are sufficient.

1. Introduction

The pulse decay test is the most used method for determining the permeability of low permeability rocks, and was proposed by Brace et al. in 1968 [1]. Thereafter, analytical solutions of pulse decay tests under a variety of conditions were obtained. Based on these solutions, the asymptotic solutions at early and late time are used to determine the core permeability [2,3,4,5].
Modifications are also made to the primary testing method in order to improve the accuracy and the flexibility, and to decrease the testing time [6,7]. All of these analysis methods are based upon the homogeneous model. In recent years, with the development of unconventional oil/gas reservoirs, the pulse decay method is widely used in testing shale, coal rock and tight sandstone cores [8,9,10,11,12,13,14,15]. This situation makes the analysis methods based on the homogeneous model no longer applicable. Usually helium, methane, nitrogen and carbon dioxide are used in these pulse decay tests [16,17]. For shale and coal rock, the absorptivity of helium is weak enough to be neglected, but methane and carbon dioxide are strongly adsorbed substances. When using them for testing, some phenomena other than those found using conventional non-adsorbing gases are found. The experiments of Ghanizadeh et al. and Gensterblum et al. [18,19,20] indicate that adsorption reduces core permeability. In addition, using reservoir fluid in tests is more realistic, and it can be absorbed by gas shale and coal rock. Therefore, there is a need to investigate the analysis method for adsorbing gas.
Cui et al. [21] are the earliest to investigate the influence of adsorption on the performance of pulse decay tests, and they propose a correction method by defining an effective porosity due to gas adsorption. Based on this, Civan et al. [22] suggest a more elaborate analysis method considering pressure-dependent properties by fitting several pulse decay tests. Although the method of Cui et al. [21] has become the mainstream analysis method for the pulse decay test with gas adsorption, it is only fit for equilibrium sorption, and does not involve the volume of the absorbed phase. In addition to equilibrium sorption, non-equilibrium also exists [23,24]. A few experiments of gas diffusion indicate that the unipore diffusion model is not good enough for representing cores flow characteristics [25,26,27,28]. Therefore, the non-equilibrium sorption models need to be investigated.
In this study, pulse decay tests of non-equilibrium sorption and equilibrium sorption models involving adsorbed phase volume are simulated and analyzed. A new correction method is proposed involving adsorbed phase volume, and an identifying method for non-equilibrium sorption models is suggested.

2. Mathematical Models and the Numerical Method

The principle of the pulse decay test is shown in Figure 1. It consists of an upstream vessel, a downstream vessel and a core holder. At the beginning, the fluid pressure in the upstream and downstream vessels and the core is balanced. Then, a pressure pulse is applied in the upstream vessel. The fluid in the upstream vessel flows through the core to the downstream vessel, thereby reducing the upstream pressure and increasing the downstream pressure. By analyzing the changes in the upstream and downstream pressures over time, the permeability of the core can be obtained.
Coal and shale are adsorptive to methane. If methane is used for pulse decay tests, it is necessary to use a flow model that considers adsorption for data analysis. The flow models of coal and shale are divided into equilibrium sorption and non-equilibrium sorption models. Non-equilibrium sorption models include pseudo-steady-state and unsteady state models. Adsorbed gas occupies pore volume, but current models do not consider this effect [21,23,24]. In this study, these models are modified to consider this factor. During the test, the device is placed in a constant temperature bath to ensure that the temperature is well controlled.
Therefore, the following assumptions are taken in this study: (1) The test is carried out under constant temperature conditions; (2) the test fluid is a single-phase absorbing gas; (3) the fluid flow conforms to Darcy's law for the equilibrium sorption model, and in fracture for the non-equilibrium sorption model, and conforms to Fick’s diffusion law in matrix for the non-equilibrium sorption model, and the secondary pressure gradient term is negligible; (4) the pore compressibility and core permeability are constant; and (5) the upstream and downstream vessels can be regarded as an isobaric body, and the gas leakage can be neglected. Then, equations for pulse decay tests can be written in the following. Since the pulse used in tests generally is small, the permeability change due to adsorption can be ignored. But the results obtained by this method are the apparent permeability. In order to investigating the effect of gas adsorption on permeability, tests under different pressures are required. If the pulse is large, the effect of adsorption upon permeability needs to be considered in the model.

2.1. Equilibrium Sorption Model

Most of the adsorbed gas exists in micropores, and these micropores’ conductivity is small. If the adsorbed gas can be desorbed into the flow channel within the characteristic time scale of the study, it is called equilibrium sorption, otherwise it is non-equilibrium sorption. Taking adsorbed phase volume into consideration, the governing equation of the equilibrium sorption model for pulse decay tests can be written as the following [21].
t [ ρ ( φ φ a ) + ρ sc ρ s V L p p L + p ] = x ( ρ k μ p x ) ,
where p is the pressures in Pa; t is the time in s; x is the coordinate along the sample which takes the upstream reservoir as the origin in m; μ is the viscosity of the fluid in Pa·s; k is the permeability of the sample in m2; ρsc and ρs are the density of the gas at the standard condition and the apparent density of the sample, respectively, in kg/m3; VL is the Langmuir volume in m3/kg; pL is the Langmuir pressure in Pa; φ is the porosity in %; the porosity occupied by the absorbed phase φa is
φ a = ρ sc ρ s V L p ρ a ( p L + p ) ,
where ρa is the density of the adsorbed gas in kg/m3. It should be pointed out that, unlike Cui et al. [21], ρs in Equation (1) is the apparent density of the core, and not the skeleton density, which is the ratio of the mass to the total volume of the skeleton and the pores. The equivalent total compressibility is defined as follows.
c t e = c f ρ sc ρ s V L p L φ ρ a ( p L + p ) 2 + c g φ φ a φ + ρ sc ρ s V L p L ρ φ ( p L + p ) 2 ,
where c t e is the equivalent total compressibility in Pa−1; cg is the compressibility of the testing gas in Pa−1; cf is the pore volume compressibility of the sample in Pa−1. Then, the governing equation of the equilibrium sorption model becomes:
ρ φ c t e p t = x ( ρ k μ p x ) .
And the boundary conditions are:
p ( 0 , t ) = p u ( t ) t 0 ,   p ( L , t ) = p d ( t ) t 0 ,
d p u d t = k ( c g + c V u ) μ φ L V p V u p x | x = 0 t > 0 ,
d p d d t = k ( c g + c V d ) μ φ L V p V d p x | x = L t > 0 ,
where L is the sample length in m; Vu, Vd and Vp are the volumes of the upstream reservoir, downstream reservoirs and the pores, respectively, in m3; cVd and cVu are the compressibilities of both upstream and downstream reservoirs, respectively, in Pa−1; the subscripts u and d denote these upstream and downstream reservoirs, respectively.
Since at the initial moment the pressure in the core is balanced with the downstream pressure vessel, and the upstream pressure vessel applies a pressure pulse, the initial conditions are:
p ( x , 0 ) = p d ( 0 ) 0 < x < L ,   p ( 0 , 0 ) = p u ( 0 ) .

2.2. Non-Equilibrium Sorption Model

For non-equilibrium sorption, the pores are divided into macropores/fractures (for convenience, they are collectively referred to as fractures) and micropores in the matrix. If the difference in the conductivity of the pores is up to orders of magnitude, the pores with strong conductivity can constitute preferential flow channels, and the fluids in other pores will converge toward the preferential flow channel. If the convergence time is greater than the characteristic time scale of the study, the pores of the preferential flow channel are called fractures, and the other pores form the matrix. Taking the adsorbed phase volume into consideration, the governing equations of the pseudo-steady state non-equilibrium sorption model are as follows [23,24]:
ρ ( φ c t ) f p f t = x ( ρ k f μ p f x ) V t ,
V t = 6 D m π 2 R m 2 ( C E C ) ,
where Dm is the gas diffusion coefficient in m2/s; kf is the fracture permeability in m2; Rm is the radius of the spherical matrix in m; pf is the pressure of the fracture in Pa; ct = cg + cf is the total compressibility of the sample in Pa−1; V is the total gas mass occurred in the matrix in kg/m3; C and CE are the gas concentration in the matrix and the equivalent gas concentration in the fracture, respectively, in kg/m3; φf is the fracture porosity in %; and the subscripts f and m denote the fracture and the matrix, respectively.
Equations (9) and (10) represent the flow in the fracture and the matrix, respectively. Thus, the gas concentration and the total content of the gas in the matrix are:
C = p M Z R T ,
V = ρ sc ρ s V L p f p L + p f + p f M Z R T ( φ m φ a ) ,
where M is the molecular molar mass in kg/mol; Z is the gas deviation factor; R is the Universal Gas Constant in J/(mol∙K) ; T is the temperature in K; φm is the matrix porosity in %.
Supposing the matrix is spherical, the governing equations of the unsteady state non-equilibrium sorption model are as follows [23,24]:
ρ ( φ c t ) f p f t = x ( ρ k f μ p f x ) 3 D m R m C r m | r m = R m ,
V t = 1 r m 2 r m ( r m 2 D m C r m ) .
where rm is the coordinate of the spherical matrix with the origin located at the center of the sphere in m.
The pseudo-steady state model assumes that the concentration of the matrix can quickly reach a pseudo-steady state; that is, the concentration in the matrix changes at the same speed. Therefore, a single concentration parameter can be used to characterize the state of the matrix. The mass exchange between the matrix and the fracture is positively correlated to their concentration difference, which is similar to the steady state model. It is described in Equation (10). The unsteady state model considers that the concentration distribution in the matrix is difficult to reach a pseudo-steady state, and is in an unsteady state for a long time. This unsteady flow can be governed by Equation (14).
It is only necessary to replace p in Equations (5)–(7) with pf to obtain the boundary conditions for the non-equilibrium sorption models. In addition, the gas concentration at the initial time can be obtained by substituting the pressure of the downstream vessel at the initial time into Equation (11). For the unsteady state non-equilibrium sorption model, the gas concentration on the outer boundary of the matrix and the fracture pressure satisfy Equation (11). The following conditions exist on the inner boundary of the matrix.
C r m = 0 .
The initial condition of the pseudo-steady-state non-equilibrium sorption model is
p f ( x , 0 ) = p m ( x , 0 ) = p d ( 0 ) 0 < x < L ,   p f ( 0 , 0 ) = p u ( 0 ) .
The initial condition of the unsteady state non-equilibrium sorption model is
p f ( x , r m , 0 ) = p d ( 0 ) 0 < x < L ,   p f ( 0 , R m , 0 ) = p u ( 0 ) .
In the non-equilibrium models, the adsorption in fractures is neglected. The subsequent analysis will indicate that the basic conclusions cannot be affected, even if that is considered.

3. Sensitivity Analysis

To consider the changes of the gas properties, the normalized pseudo-pressure is defined as:
p p = ( μ Z ) i p i 0 p p μ Z d p ,
where the subscript p and i denote the normalized pressure and the reference status, respectively. The dimensionless variables are defined as:
t D = k f t μ φ c t 0 L 2 ,   x D = x L ,   p D = p p p p d ( 0 ) p p u ( 0 ) p p d ( 0 ) , A u = V p c t 0 V u ( c g 0 + c V u ) ,   A d = V p c t 0 V d ( c g 0 + c V d ) ,
where the subscript 0 and D denote the initial status and the dimensionless variable, respectively.
If the newly defined equivalent total compressibility c t e (Equation (3)) is used instead of the abovementioned conventionally-defined total compressibility ct = cg + cf in Equation (19), a new dimensionless definition can be obtained, which will be referred to as the new dimensionless definition and the old dimensionless definition, respectively.
In the latter analysis using the numerical methods presented in Appendix A, Appendix B and Appendix C, the testing gas is methane, and its physical parameters are computed by the PVT formulae. The absorbed density is ρ = 374 kg/m3 [29], the rock apparent density is ρs = 2600 kg/m3, the rock pore compressibility is cf = 1.0 × 10⁻³ MPa−1 and the vessel compressibility is cVu = cVd = 10−5 MPa−1.

3.1. Equilibrium Sorption Model

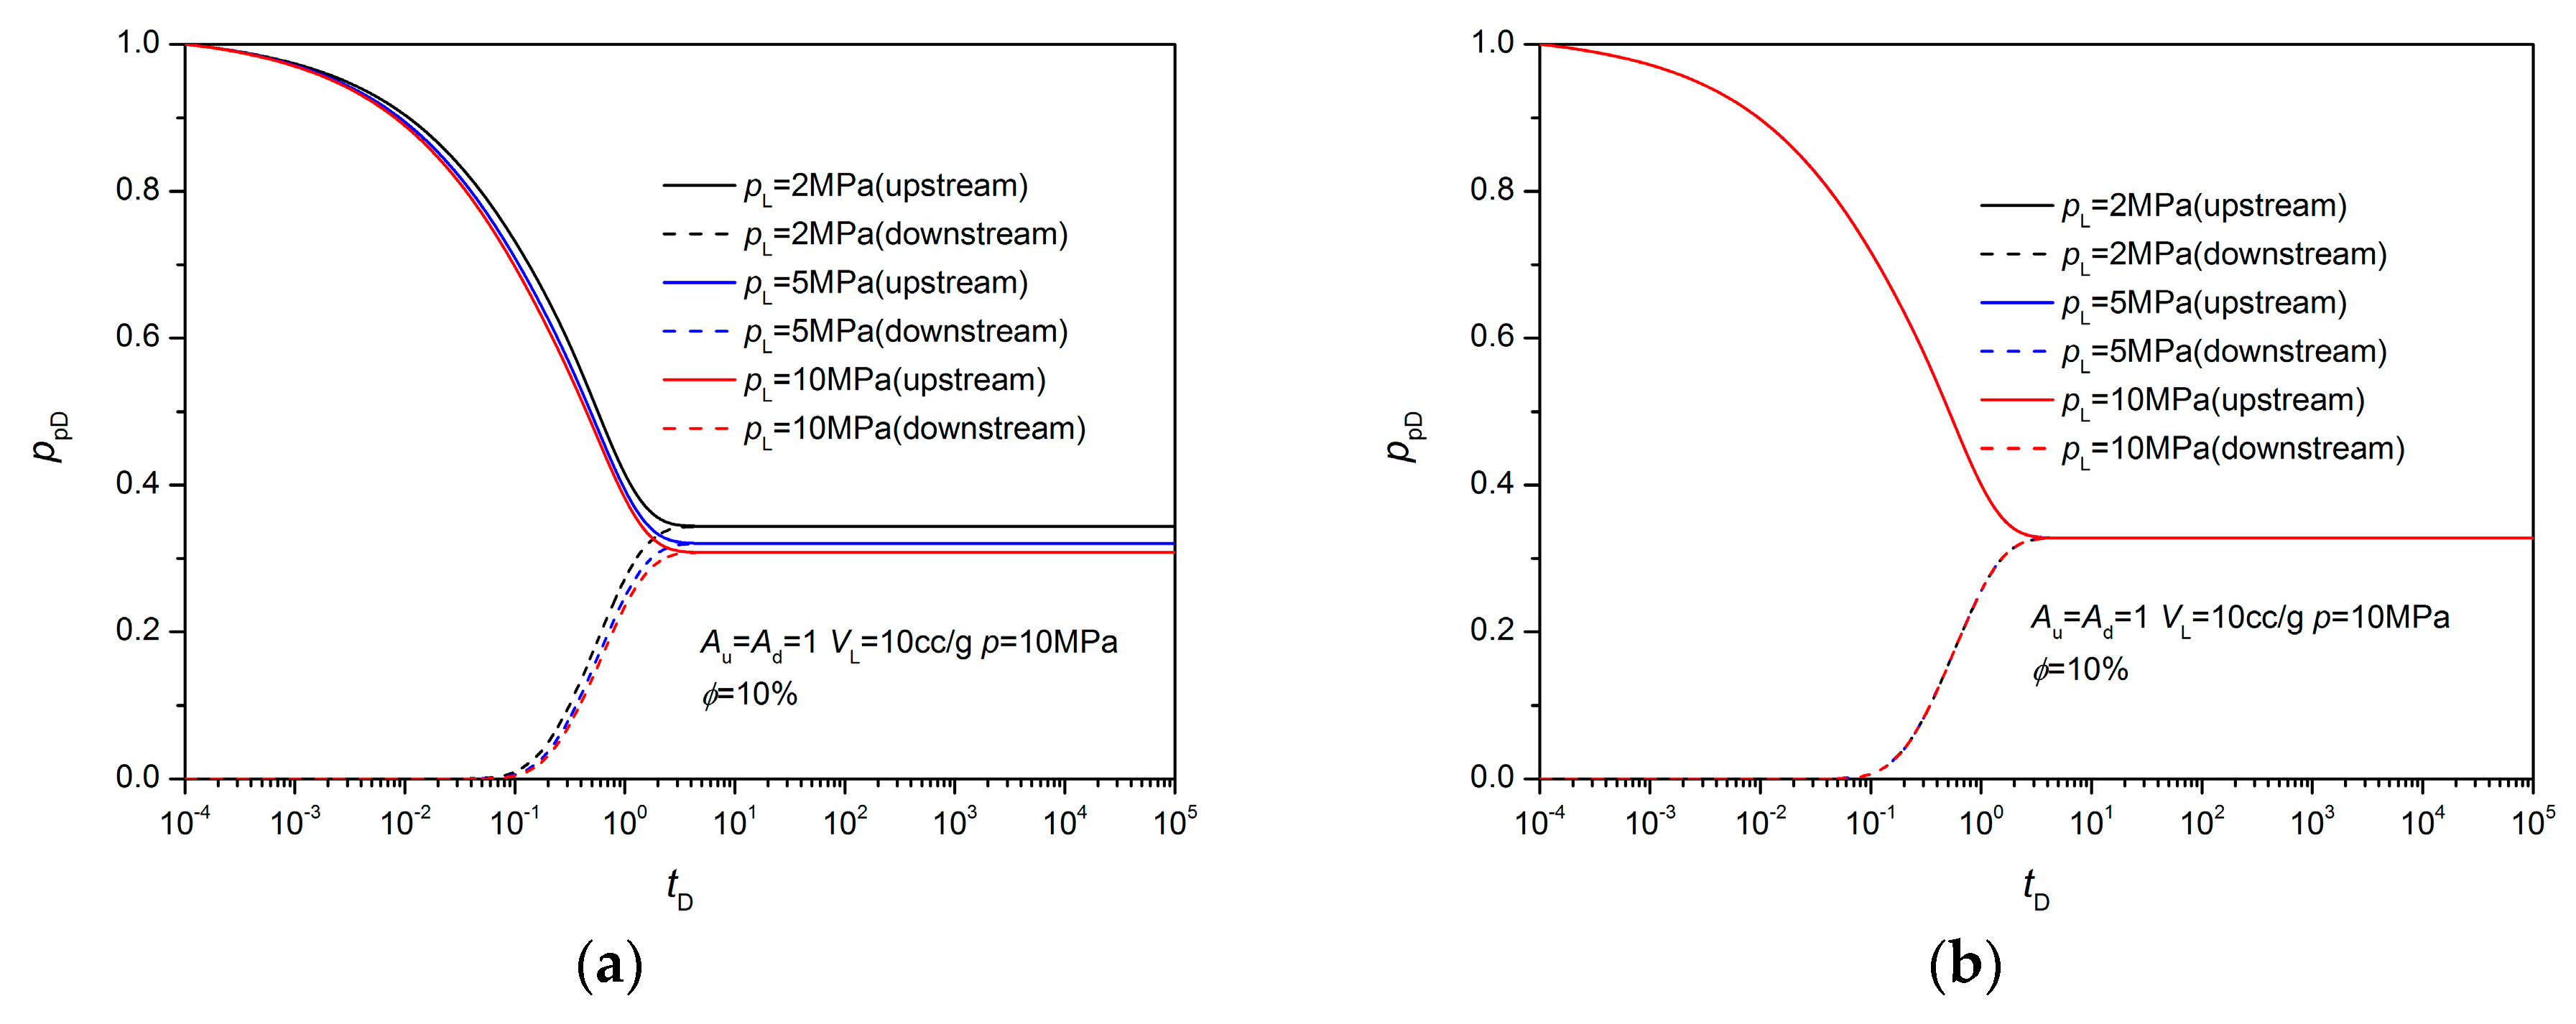
It can be seen that the shape of the pressure curve of the equilibrium sorption model is similar to that of the homogenous model (Figure 2, Figure 3 and Figure 4). If using the old dimensionless definitions, unlike the homogeneous model, the values of the dimensionless pseudo-pressure curves are impacted by the testing pressure and the Langmuir sorption parameters. The lower the testing pressure, the larger the Langmuir volume and pressure are, and the more rapidly the upstream pseudo-pressure decreases; the slower the downstream pseudo-pressure increases, the smaller the balanced pseudo-pressure (Figure 2a, Figure 3a and Figure 4a). When the Langmuir volume is 0, it becomes a homogenous model. Therefore, the gas adsorption speeds up the decrease of the pseudo-pressure of the upstream vessel, and reduces the increase of that of the downstream vessel. When using the new dimensionless definition, for the same Au and Ad, the pulse decay test curves for different Langmuir pressure, Langmuir volume and test pressure, are almost completely coincident, and they are the same as that of the homogenous model (Figure 2b, Figure 3b and Figure 4b). Therefore, the equivalent total compressibility defined in this study is reasonable.

3.2. Non-Equilibrium Sorption Model

For non-equilibrium models, the dimensionless definitions in Equation (19) can be changed to the follow definitions.
t D = k f t μ L 2 ,   A u = V p φ V u ( c g 0 + c V u ) ,   A d = V p φ V d ( c g 0 + c V d ) .
Meanwhile, the following is defined.
= V ic ρ 0 ( p p u 0 p p d 0 ) + ( φ c t ) f 0 ,   V D = V V ic ,   C D = C V ic , pseudo - storativity   ratio   ω = ( φ c tf ) 0 ,
where Vic is the initial total gas mass occurring in the matrix in kg/m3. For the unsteady state of the non-equilibrium sorption model, the pseudo-interporosity flow coefficient is defined as follows.
λ D = 6 D m π 2 μ 0 L 2 R m 2 k f 0 .
For the pseudo-steady-state model, it is defined as follows.
λ D = 3 D m μ 0 L 2 R m 2 k f 0 .
It should be noted that in order to get the same dimensionless pressure for the different fracture porosity at equilibrium stages, the following definition is used in the following figures.
= V ic ρ 0 p p d 0 + ( φ c t ) f 0 .
Because of the small change of the testing pressure, the gas compressibility and viscosity can be assumed as a constant in the testing. Therefore, the dimensionless governing equations of the pseudo-steady-state model can be written as:
ω p p fD t D = x D ( p p f D x D ) ( 1 ω ) V D t D ,
V D t D = λ ( C ED C D ) .
The dimensionless governing equations of the unsteady state model are:
ω p p fD t D = x D ( p p fD x D ) ( 1 ω ) λ D C D r mD | r mD = 1 ,
V D t D = λ D 3 1 r mD 2 r mD ( r mD 2 C D r mD ) .
It can be found that the governing equations for the unsteady state and the pseudo-steady-state non-equilibrium sorption models are similar in the forms to the unsteady and the pseudo-steady-state dual-porosity models, respectively, which have similar matrix-fracture exchange terms. The difference is that the dual-porosity model does not consider gas adsorption, and the flow in the matrix conforms to Darcy's law, but the non-equilibrium sorption model considers it to comply with Fick's law of diffusion. In the meantime, their initial and boundary conditions can be easily found to be the same [28]. Hence, their properties are almost the same for pulse decay tests.
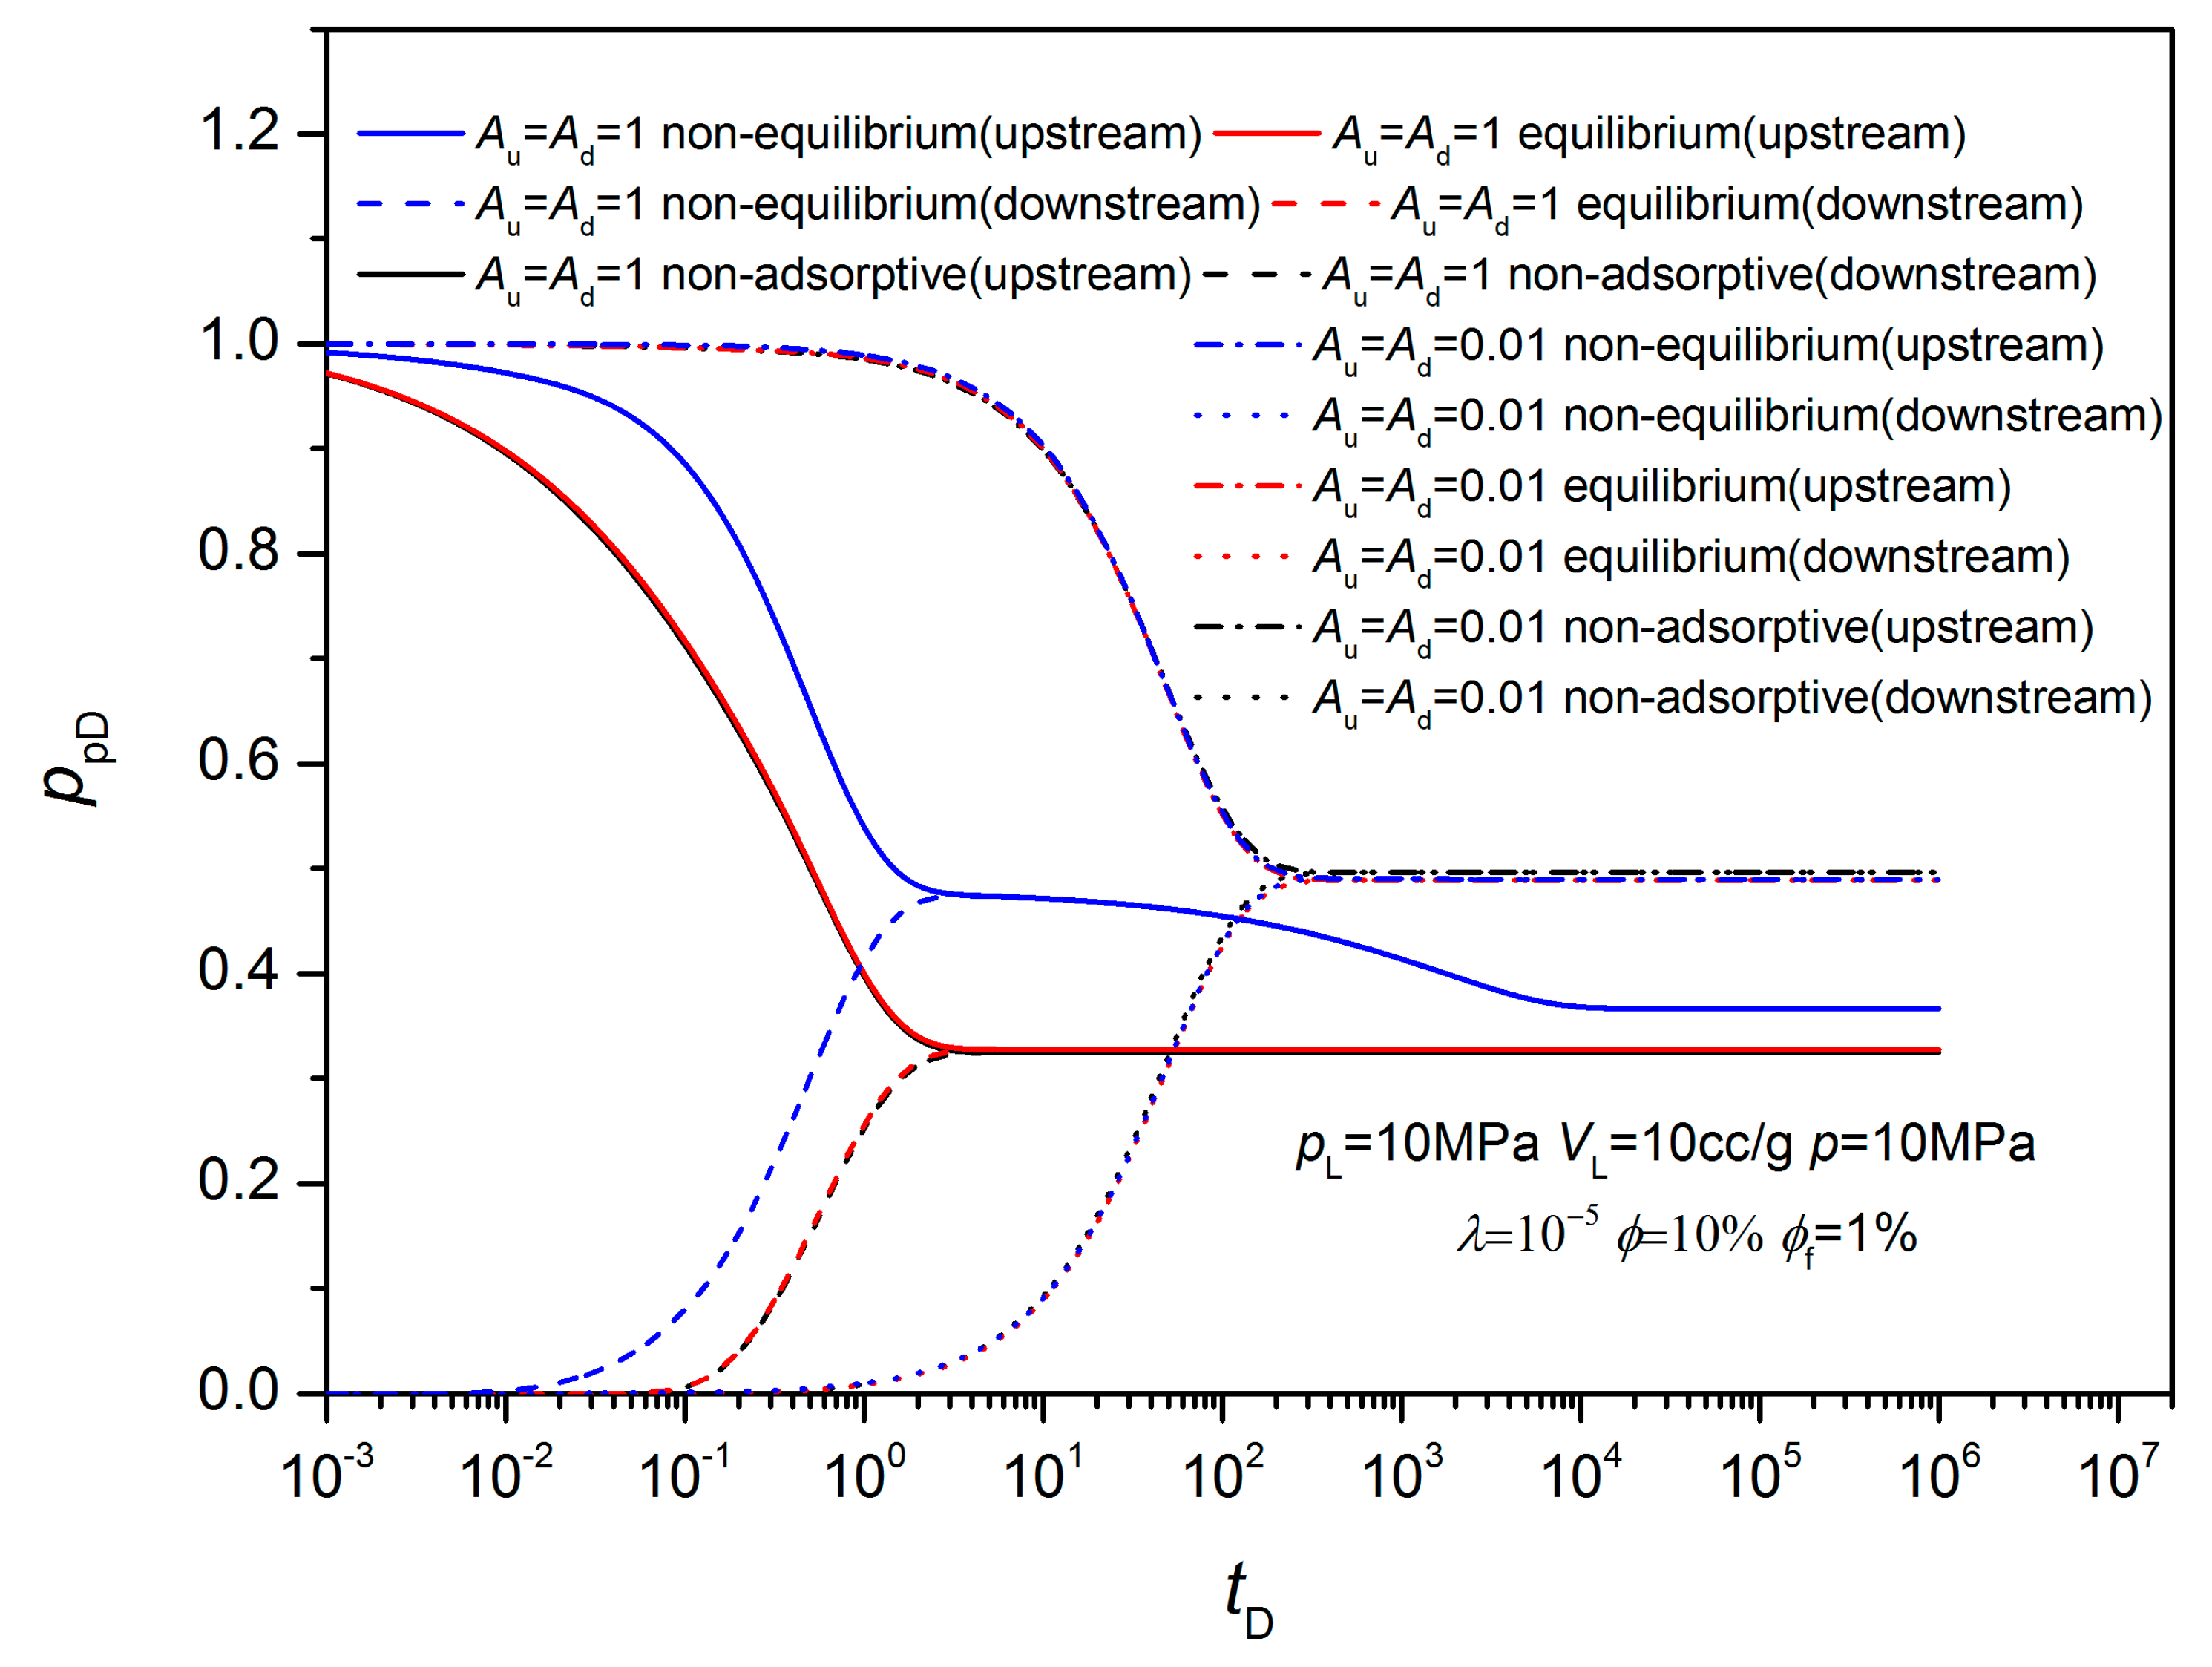
Figure 5 shows that the shape of the pseudo-pressure curves of the non-equilibrium sorption model is not similar to that of the equilibrium sorption model. After the upstream and downstream pseudo-pressures of the non-equilibrium adsorption model are balanced, they will continue to fall together until the system pseudo-pressure is at equilibrium. This finding is similar to of the feature of the pressure curves of the dual-porosity models, and is consistent with the previous analysis of the mathematical models [28]. Under the same conditions presented in the figure, the decrease (tD < 3) of the upstream vessel pseudo-pressure of the non-equilibrium sorption model is slower than that of the equilibrium sorption model, but the upstream vessel pseudo-pressure is contrary. In addition, the balanced pseudo-pressure and the equilibrium pseudo-pressure of the non-equilibrium sorption models are higher than those of the equilibrium sorption model (Figure 5). This is due to the different definitions of their dimensionless parameters. As used herein, the balanced pseudo-pressure refers to the pseudo-pressure at which the upstream and downstream vessel pressures initially become equal; the equilibrium pseudo-pressure refers to the pseudo-pressure at which all pressures no longer change.
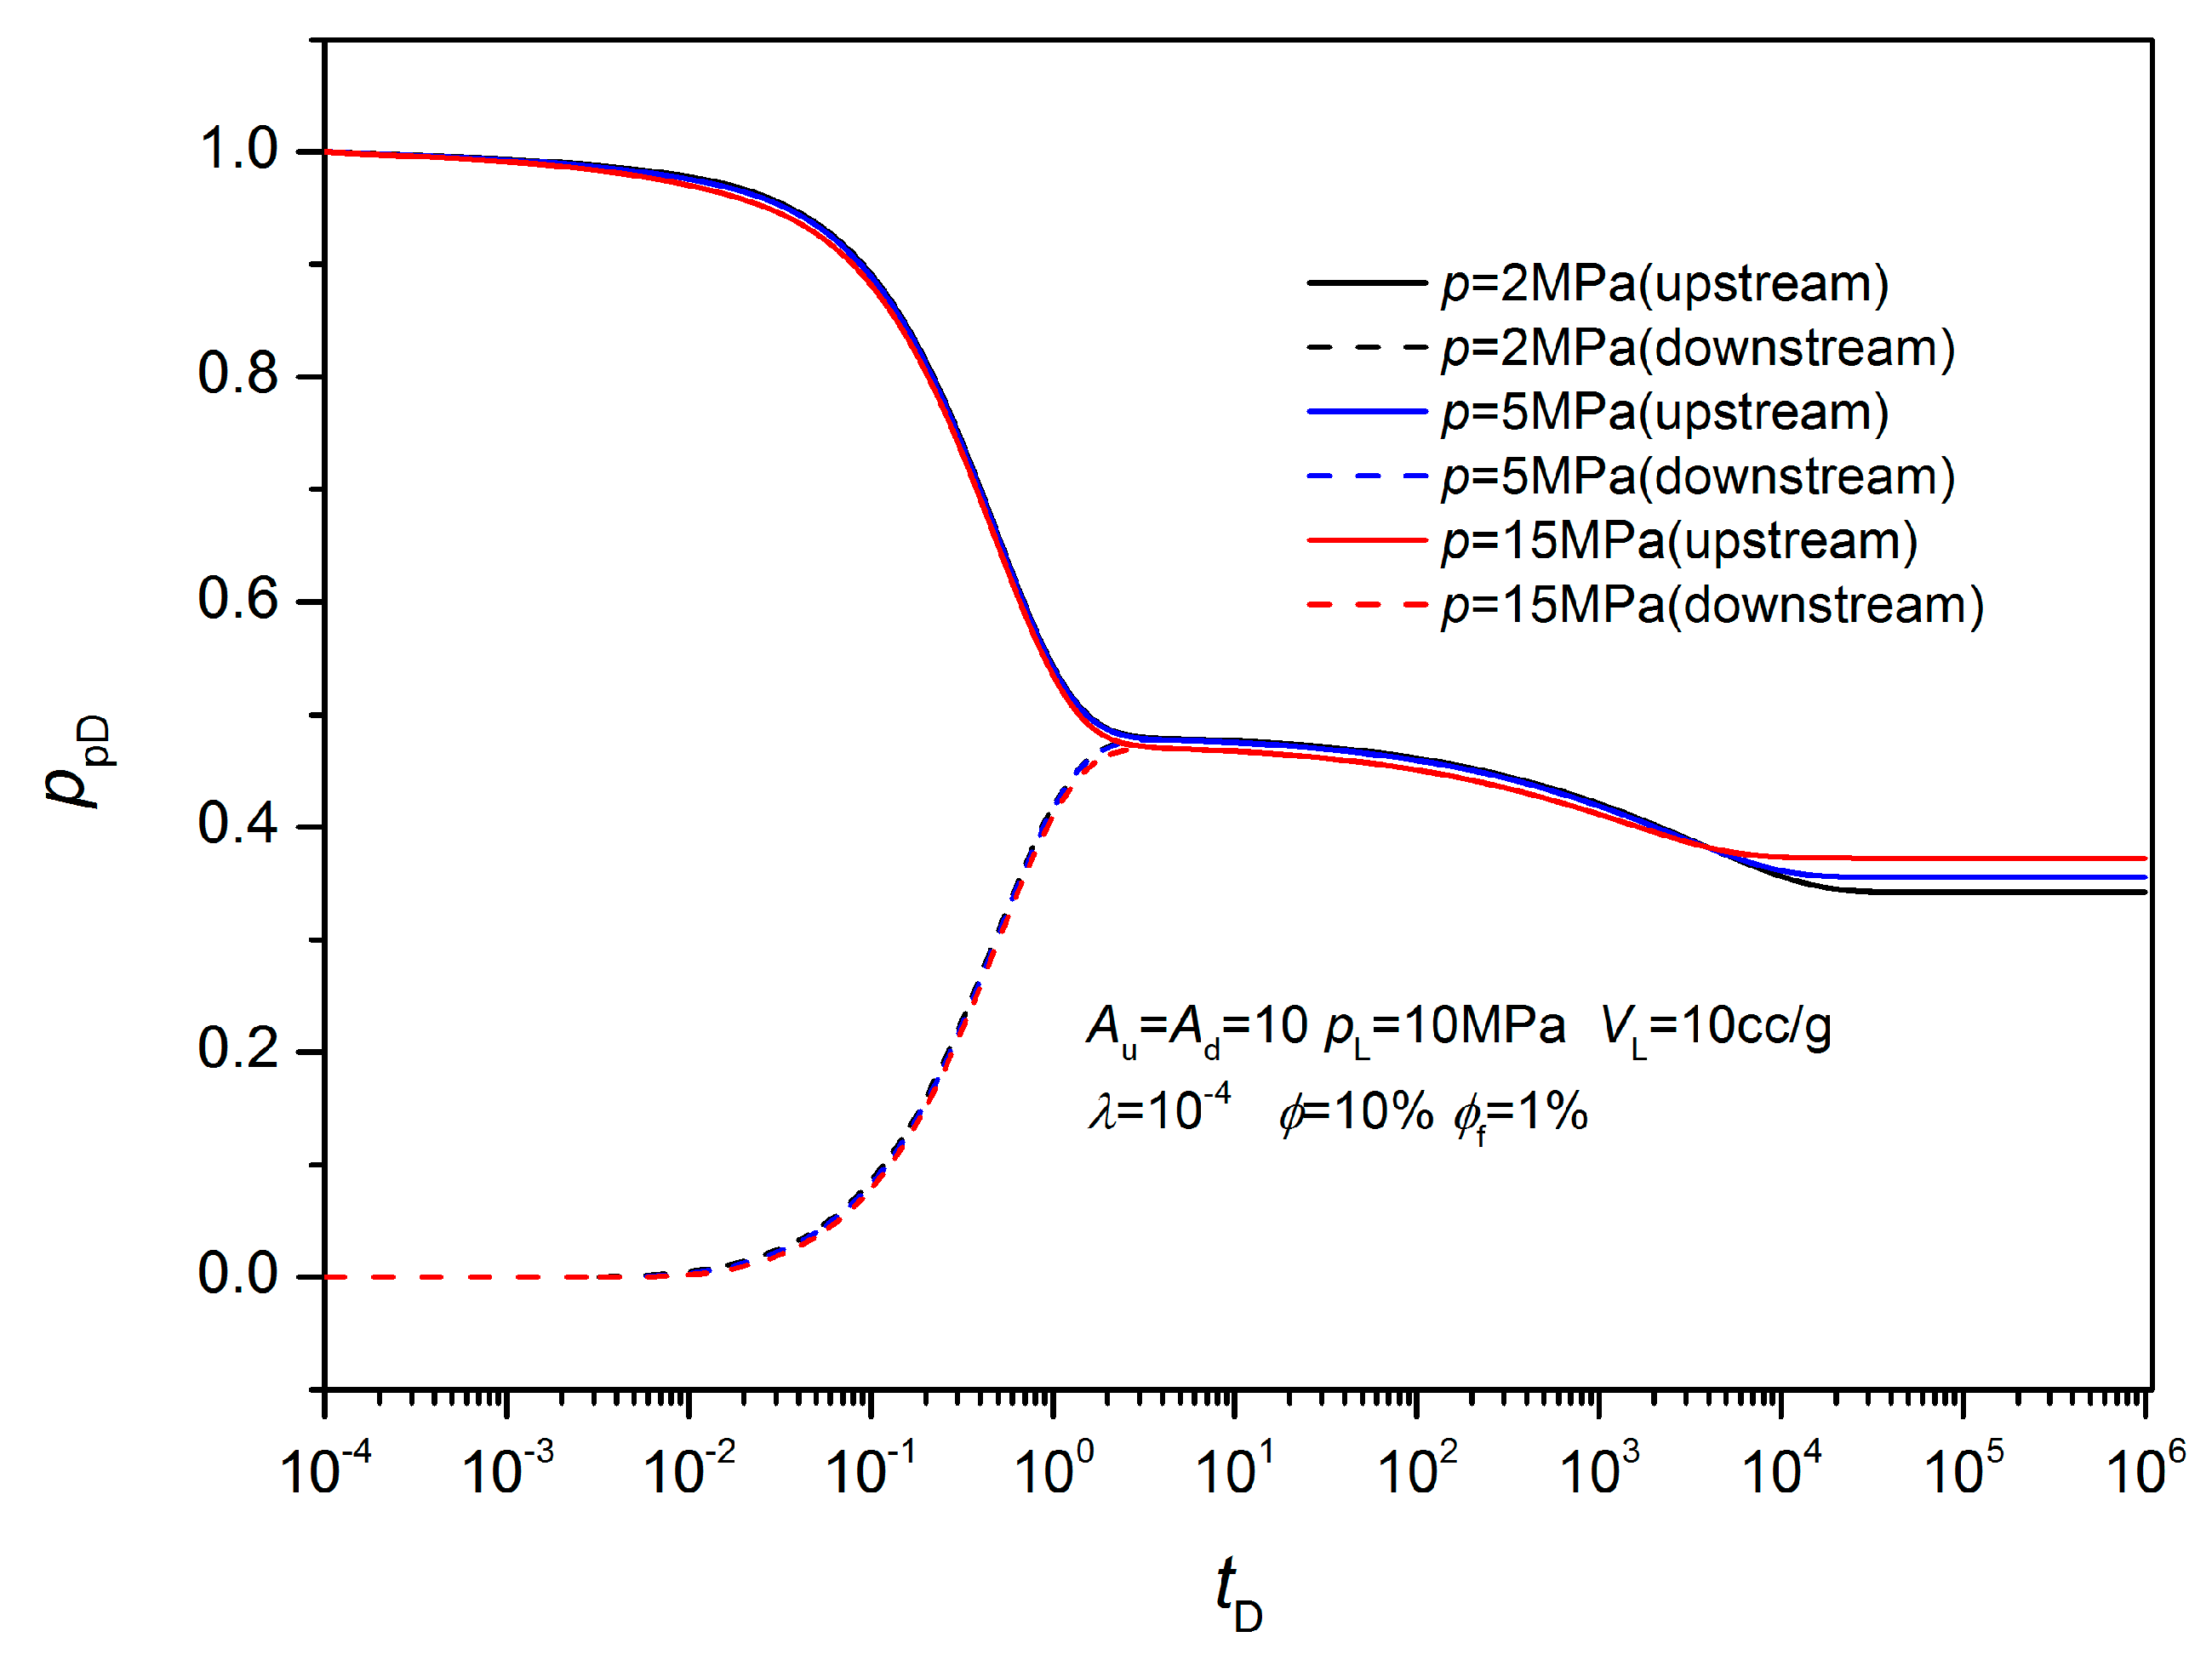
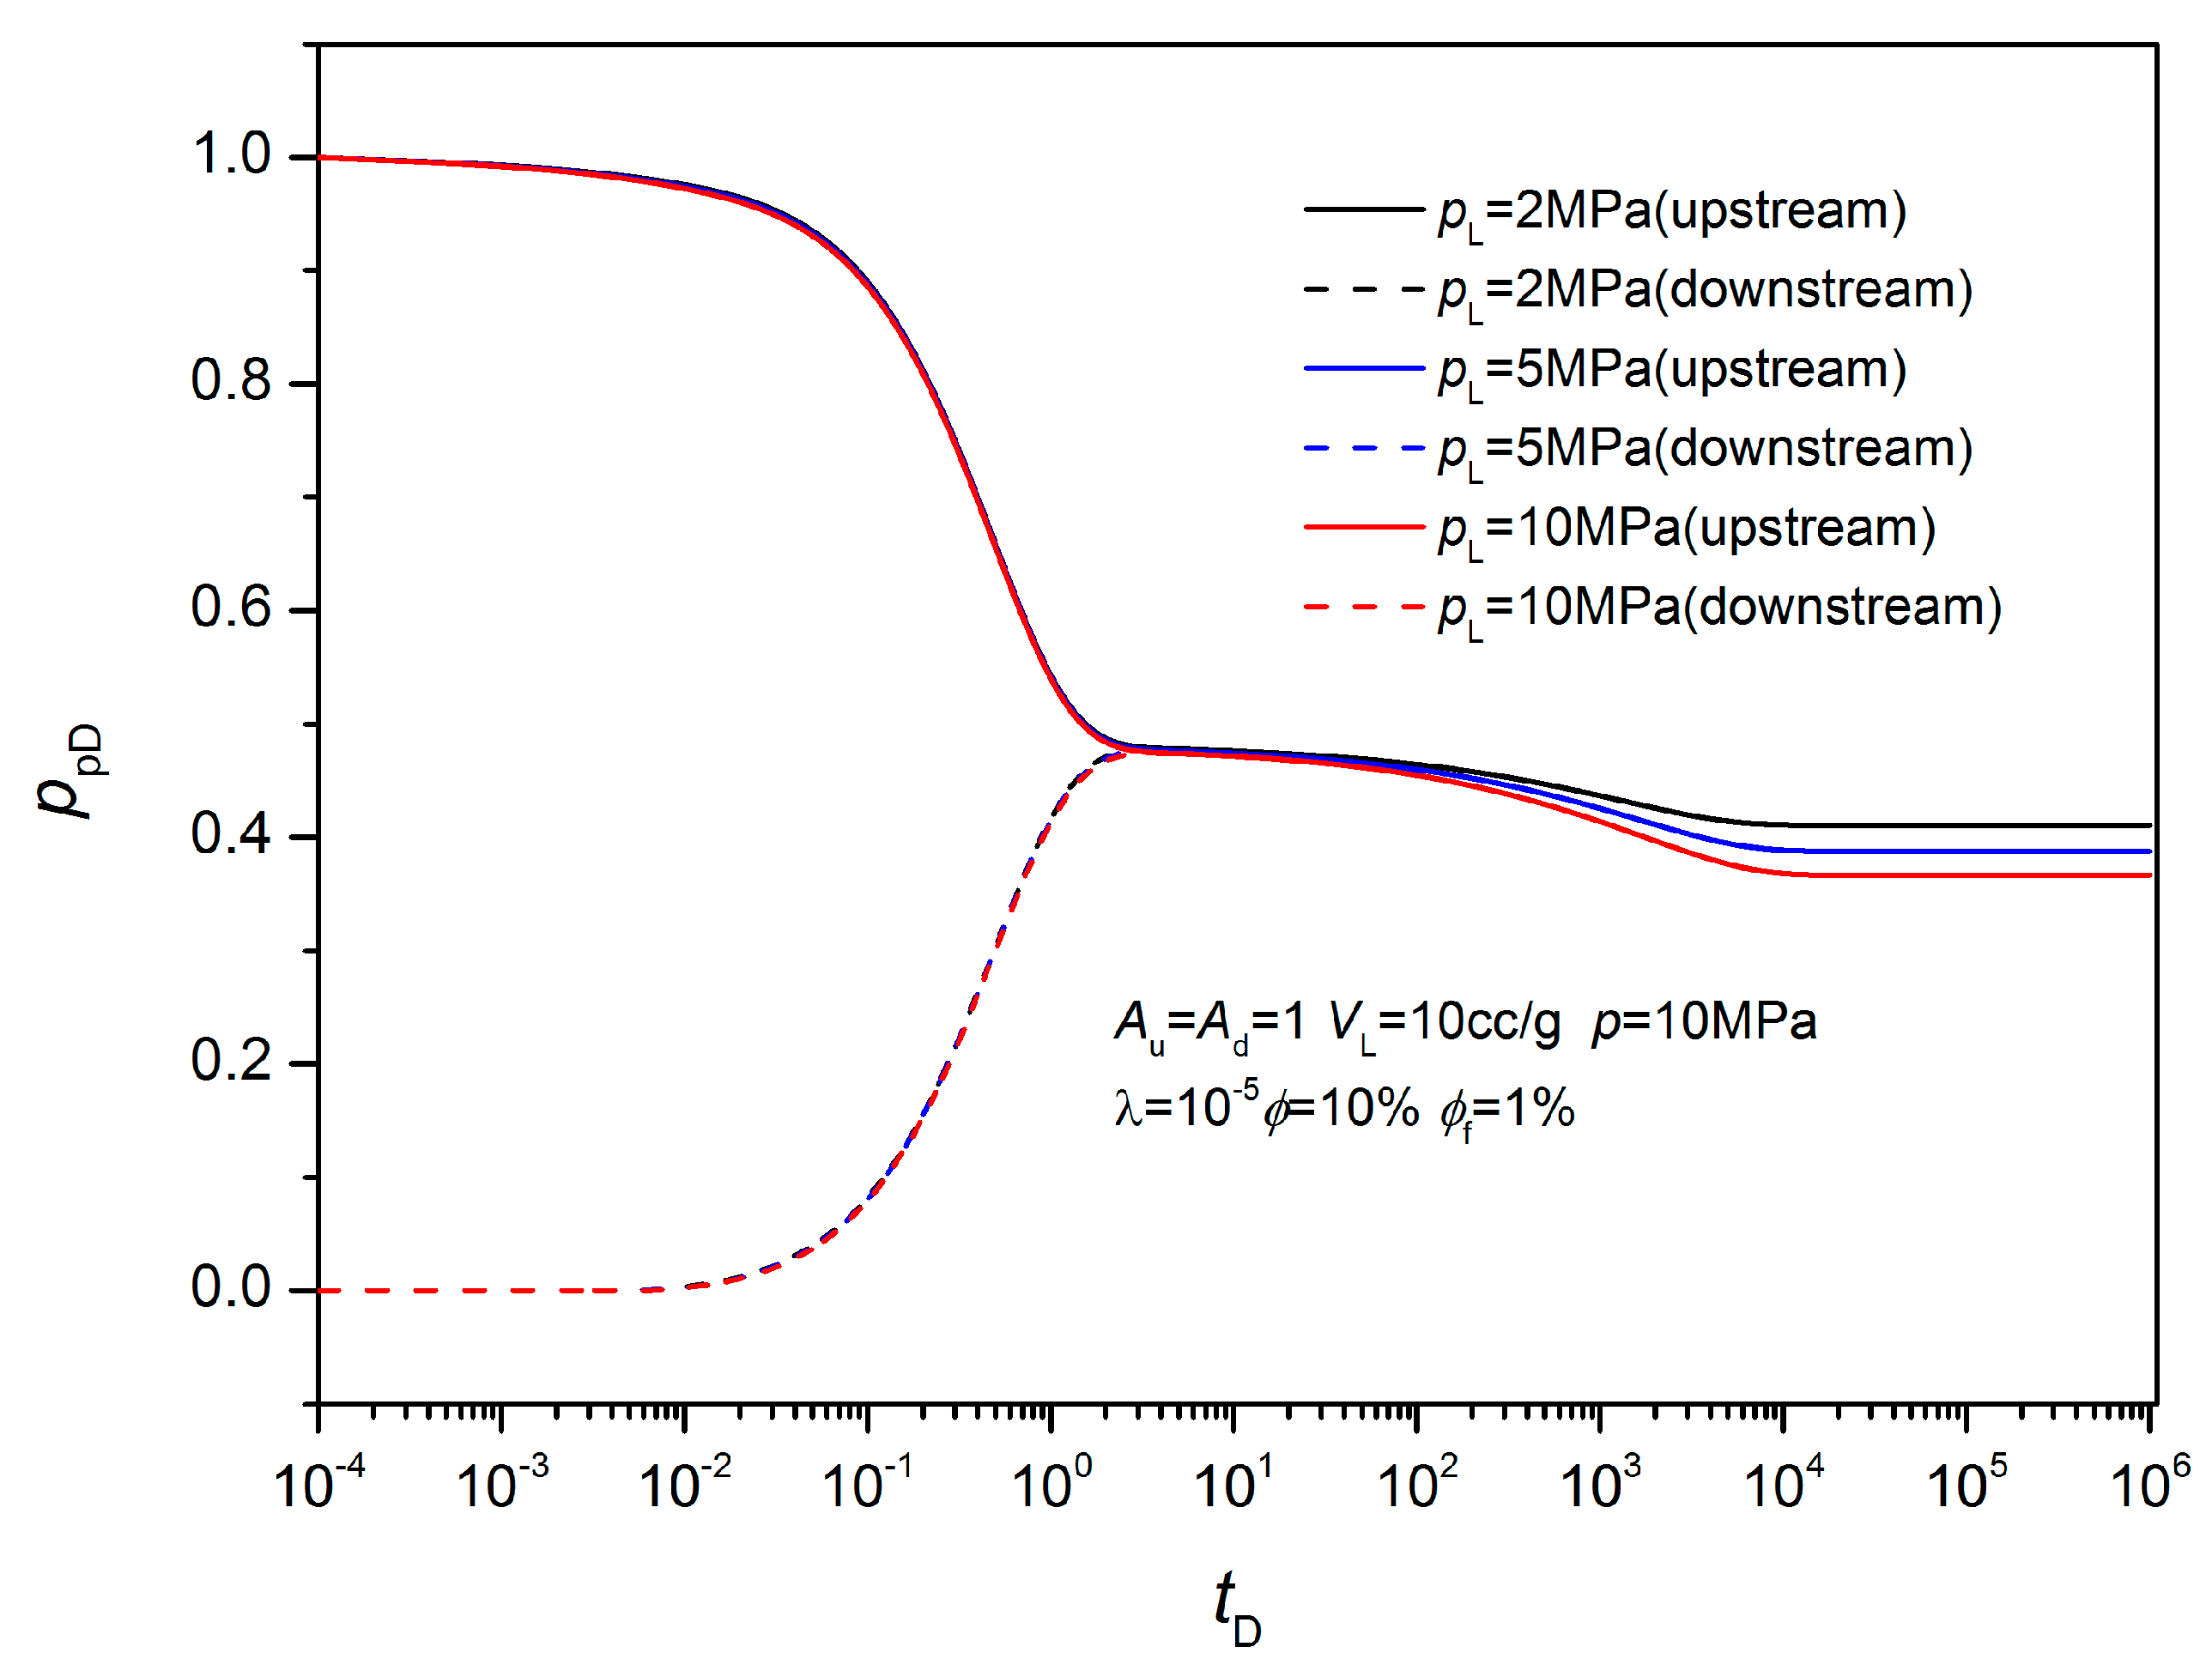
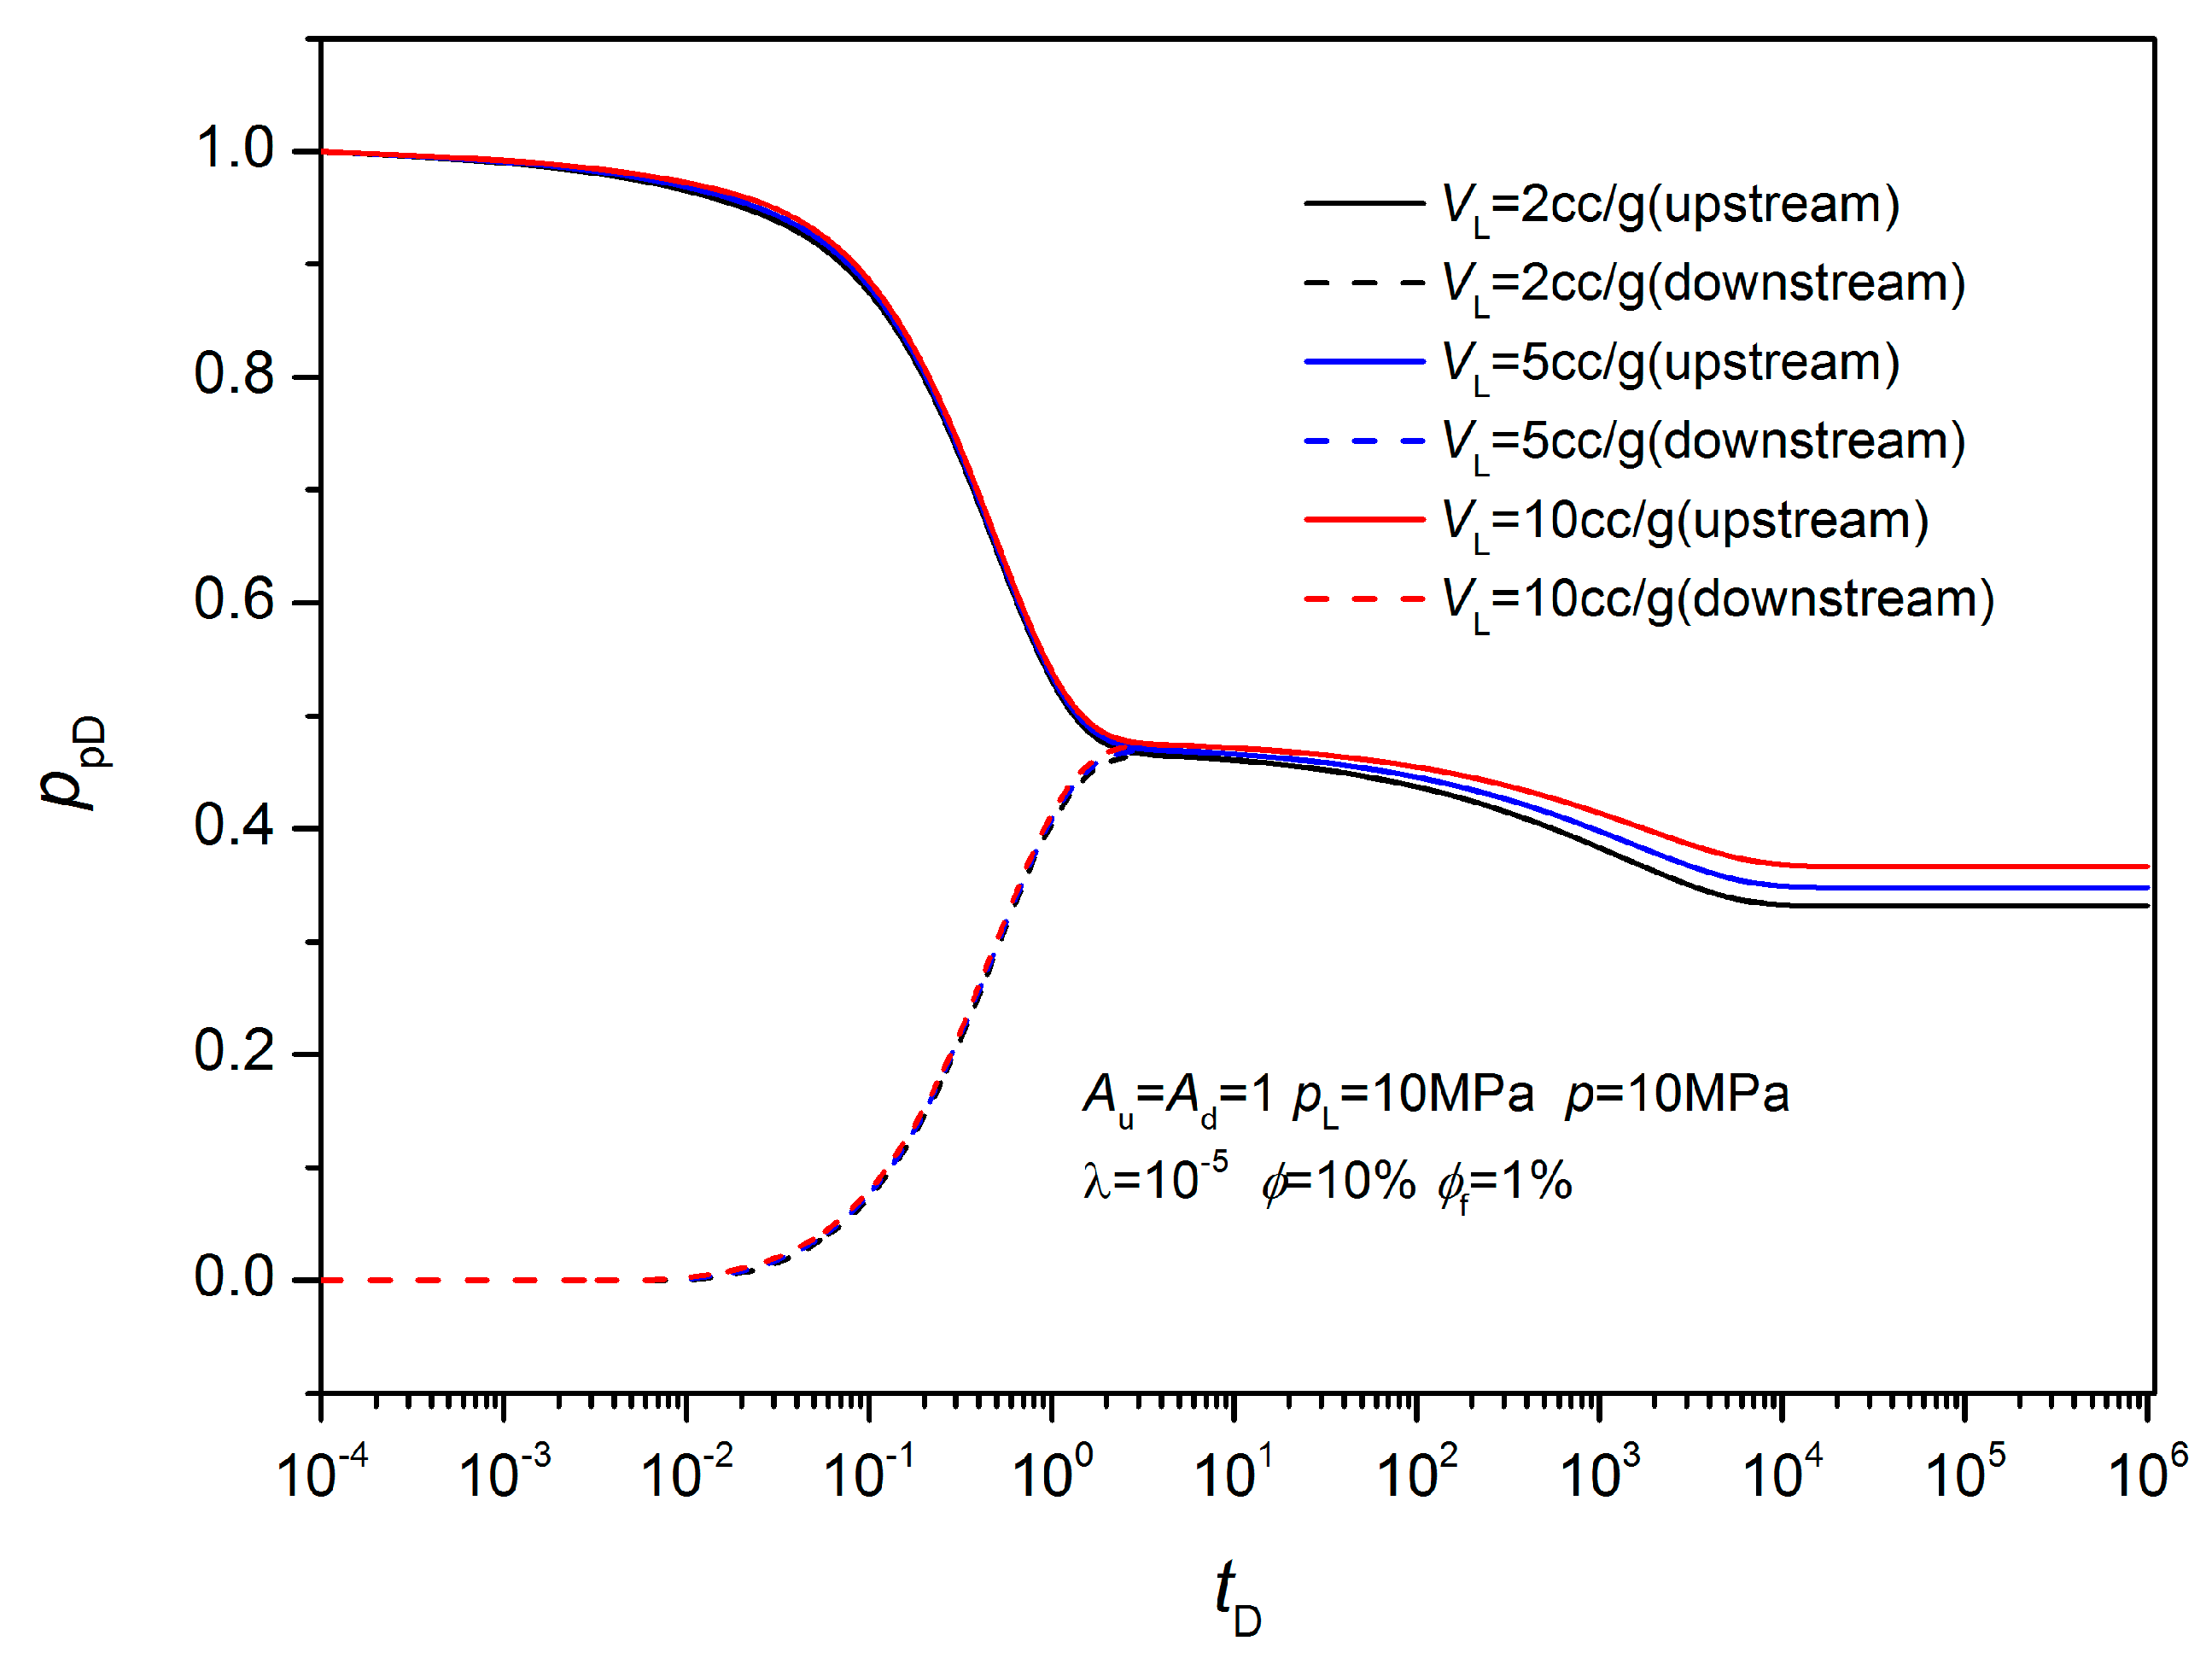
The sensitivity analysis of the fracture porosity, testing pressure, Langmuir volume and pressure and vessel volumes on the pulse decay tests, were simulated by the numerical methods in the Appendix B and Appendix C. If the total porosity is constant, the balanced pseudo-pressure of the non-equilibrium sorption model decreases with the increase of the fracture porosity. Meanwhile, the pseudo-pressure of the upstream vessel decreases more rapidly, and the downstream vessel pseudo-pressure increases more slowly with the increase of the fracture porosity. However, the final equilibrium pseudo-pressure was not affected (Figure 6). The final equilibrium pseudo-pressure increased with the increase of the testing pressure and the Langmuir volumes, and decreased with the increase of the Langmuir pressures (Figure 7, Figure 8 and Figure 9). With the increase of the vessel volumes, the pseudo-pressure curves of the equilibrium and non-equilibrium sorption model approaches that of no adsorption (Figure 10). Therefore, when the vessel volumes are big enough, the influence of gas adsorption can be ignored, and the non-equilibrium and equilibrium models cannot be distinguished.

4. The Analysis Method for Adsorptive Gas

4.1. Equilibrium Sorption Model

According to the analysis in Section 3.1, if the total compressibility ct of the homogeneous model is replaced by the equivalent total compressibility c t e , it can be used to analyze the pulse decay test data of the equilibrium sorption. Therefore, the equilibrium sorption model is essentially a homogenous model. Thus it can be inferred that ignoring adsorption in the fracture in the previous section does not change the characteristics of the non-equilibrium sorption model, and the total compressibility of the fracture can be substituted for by the equivalent total compressibility to account for the adsorption in the fractures. Cui et al. [21] corrected the porosity to involve gas absorption, but their correction does not consider the influence of the absorbed phase volume. The Cui-correction is equivalent to a total compressibility correction, which leads to the same permeability. Here, it is named the Cui-correction as well, and the corrected equivalent total compressibility is as follows:
c t Cui = c f + c g + ρ sc ρ s V L p L ρ φ ( p L + p ) 2 .
In the following, the equivalent total compressibility and permeability determined by the Cui-correction and our new correction are compared with those of no correction. The errors in the following figures are relative to our new correction.
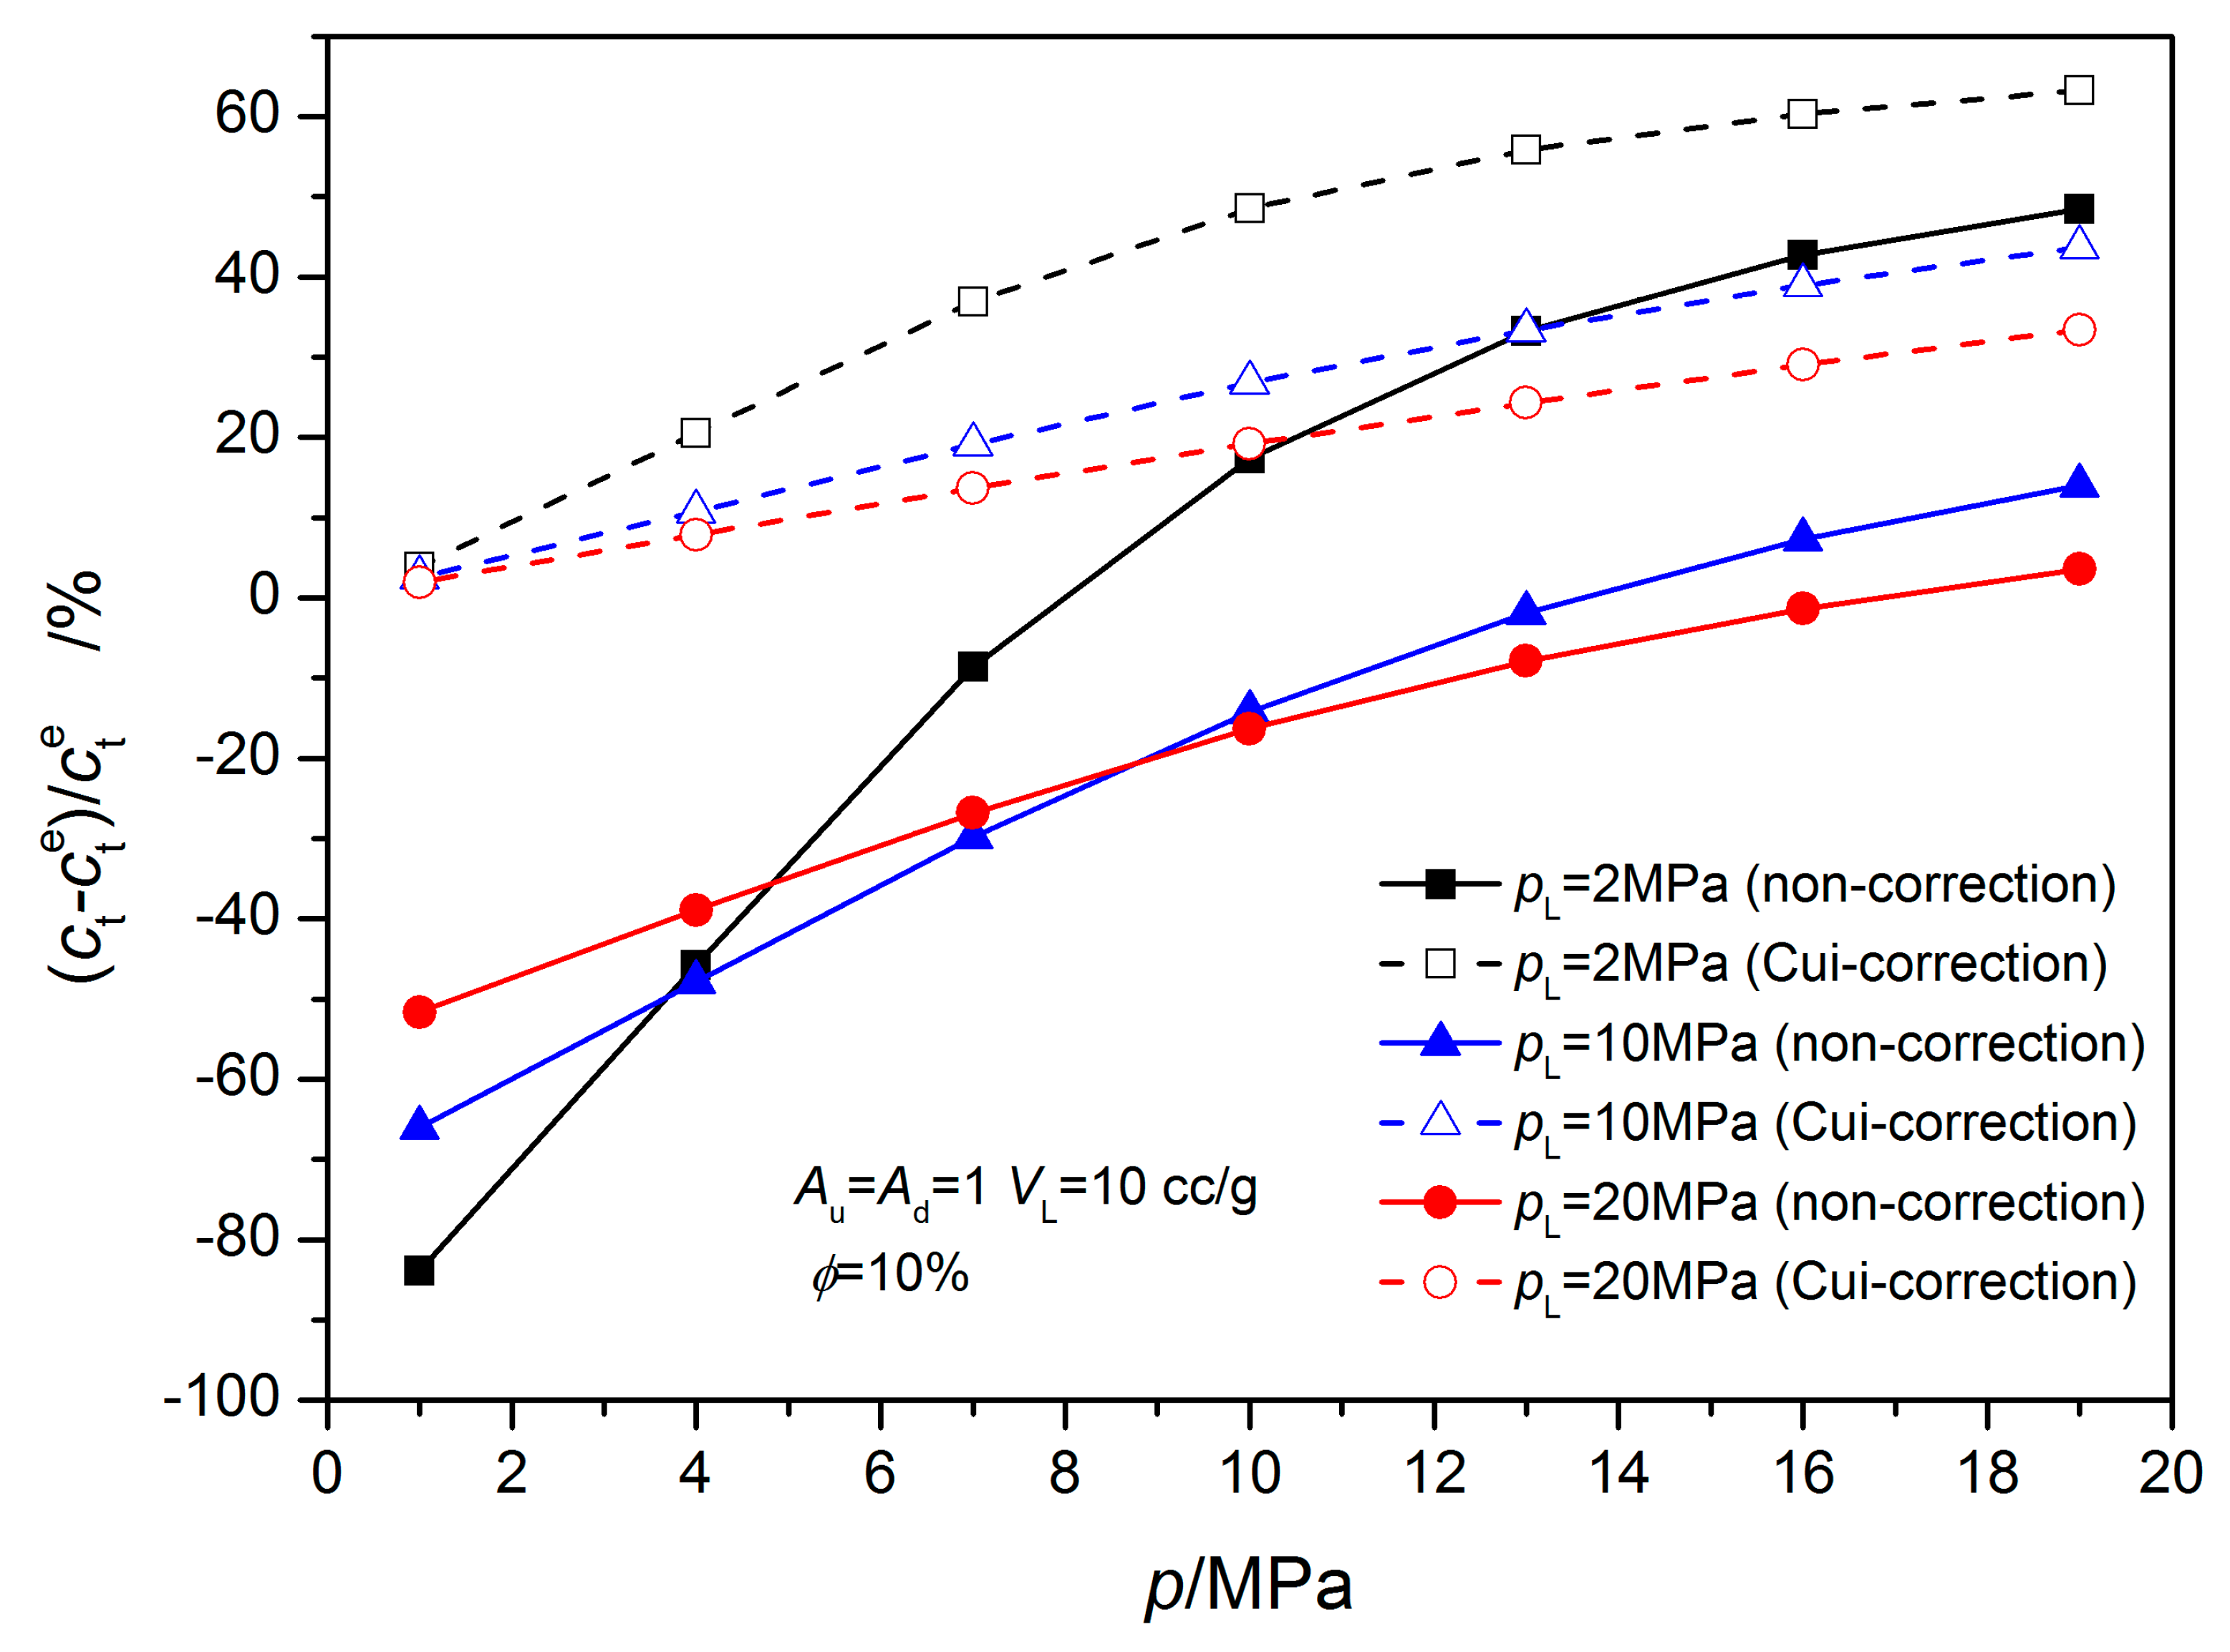
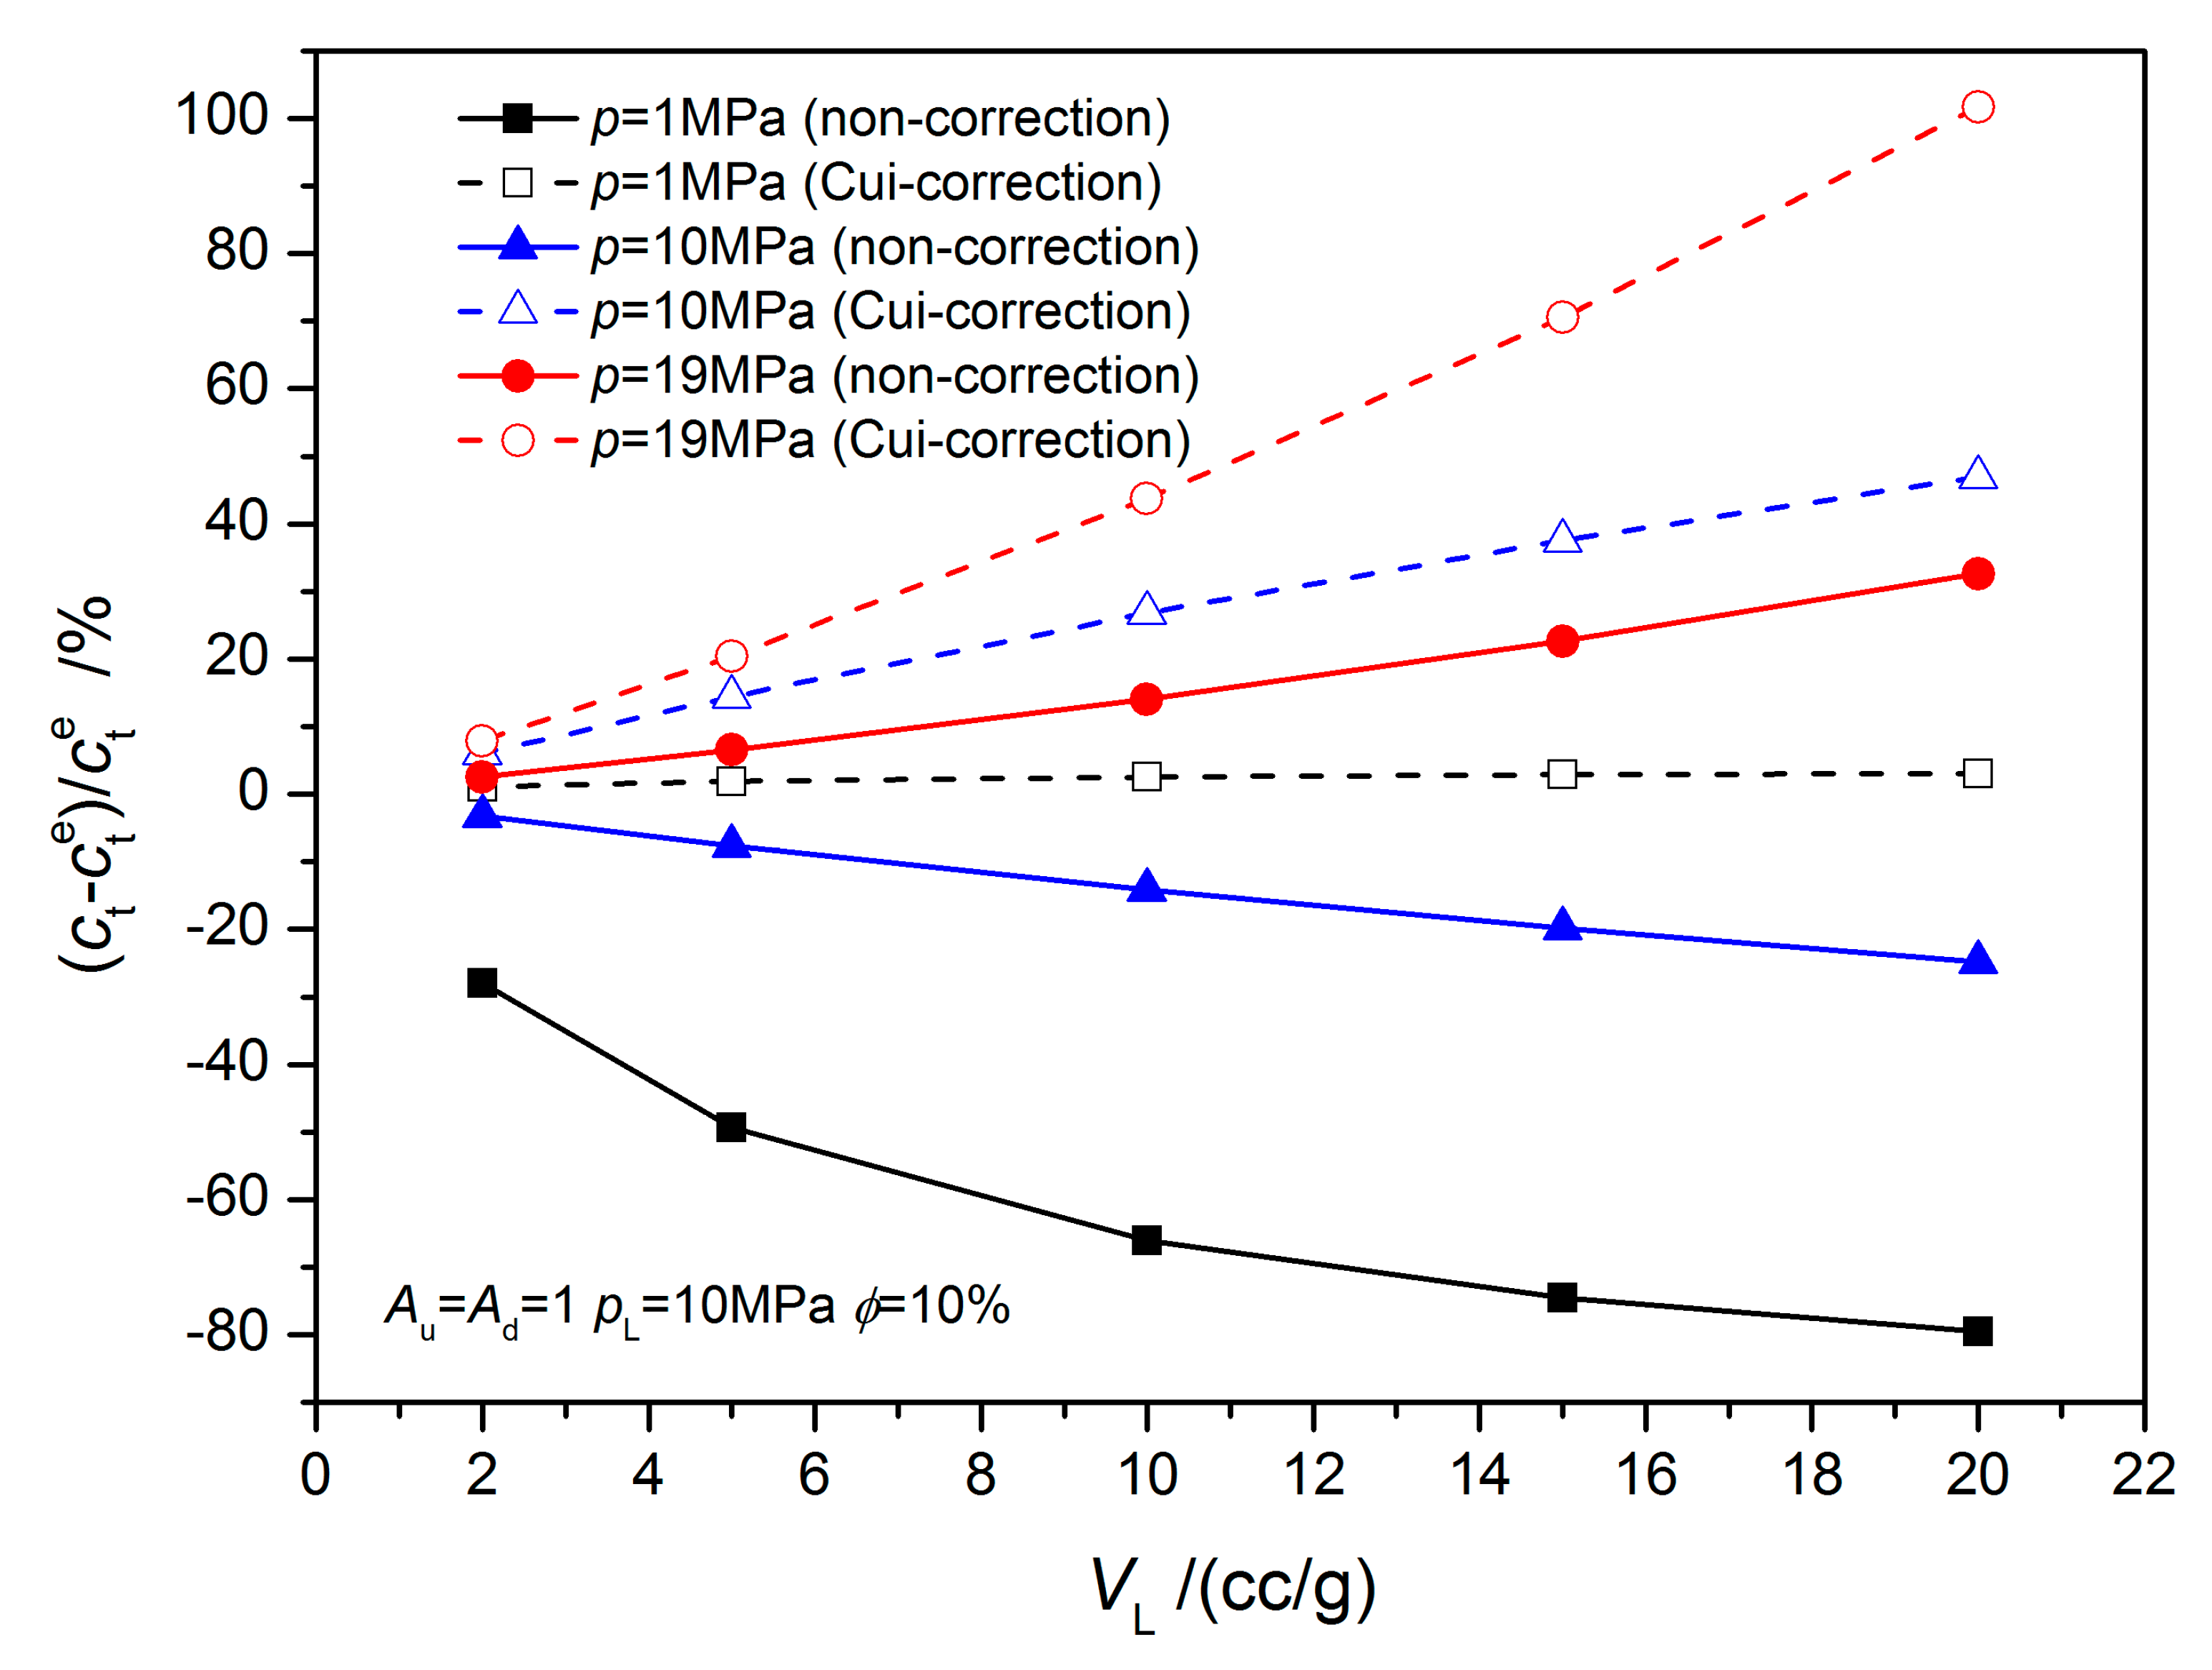
If the testing pressure is low, the non-correction total compressibility is less than the equivalent total compressibility, which is contrary at high pressure (Figure 11 and Figure 12). Therefore, these two total compressibilities are close at certain pressures. Their difference increases with the increase of VL, and could be larger than 80%. Figure 11 shows that the influence of pL is not monotonous. When the testing pressure is very large or very small, the difference decreases with pL.
Figure 11 and Figure 12 show that the Cui-correction total compressibility is larger than the equivalent total compressibility. The difference increases with the testing pressure and VL, and decreases with pL, and it can be more than 100% (Figure 11 and Figure 12).
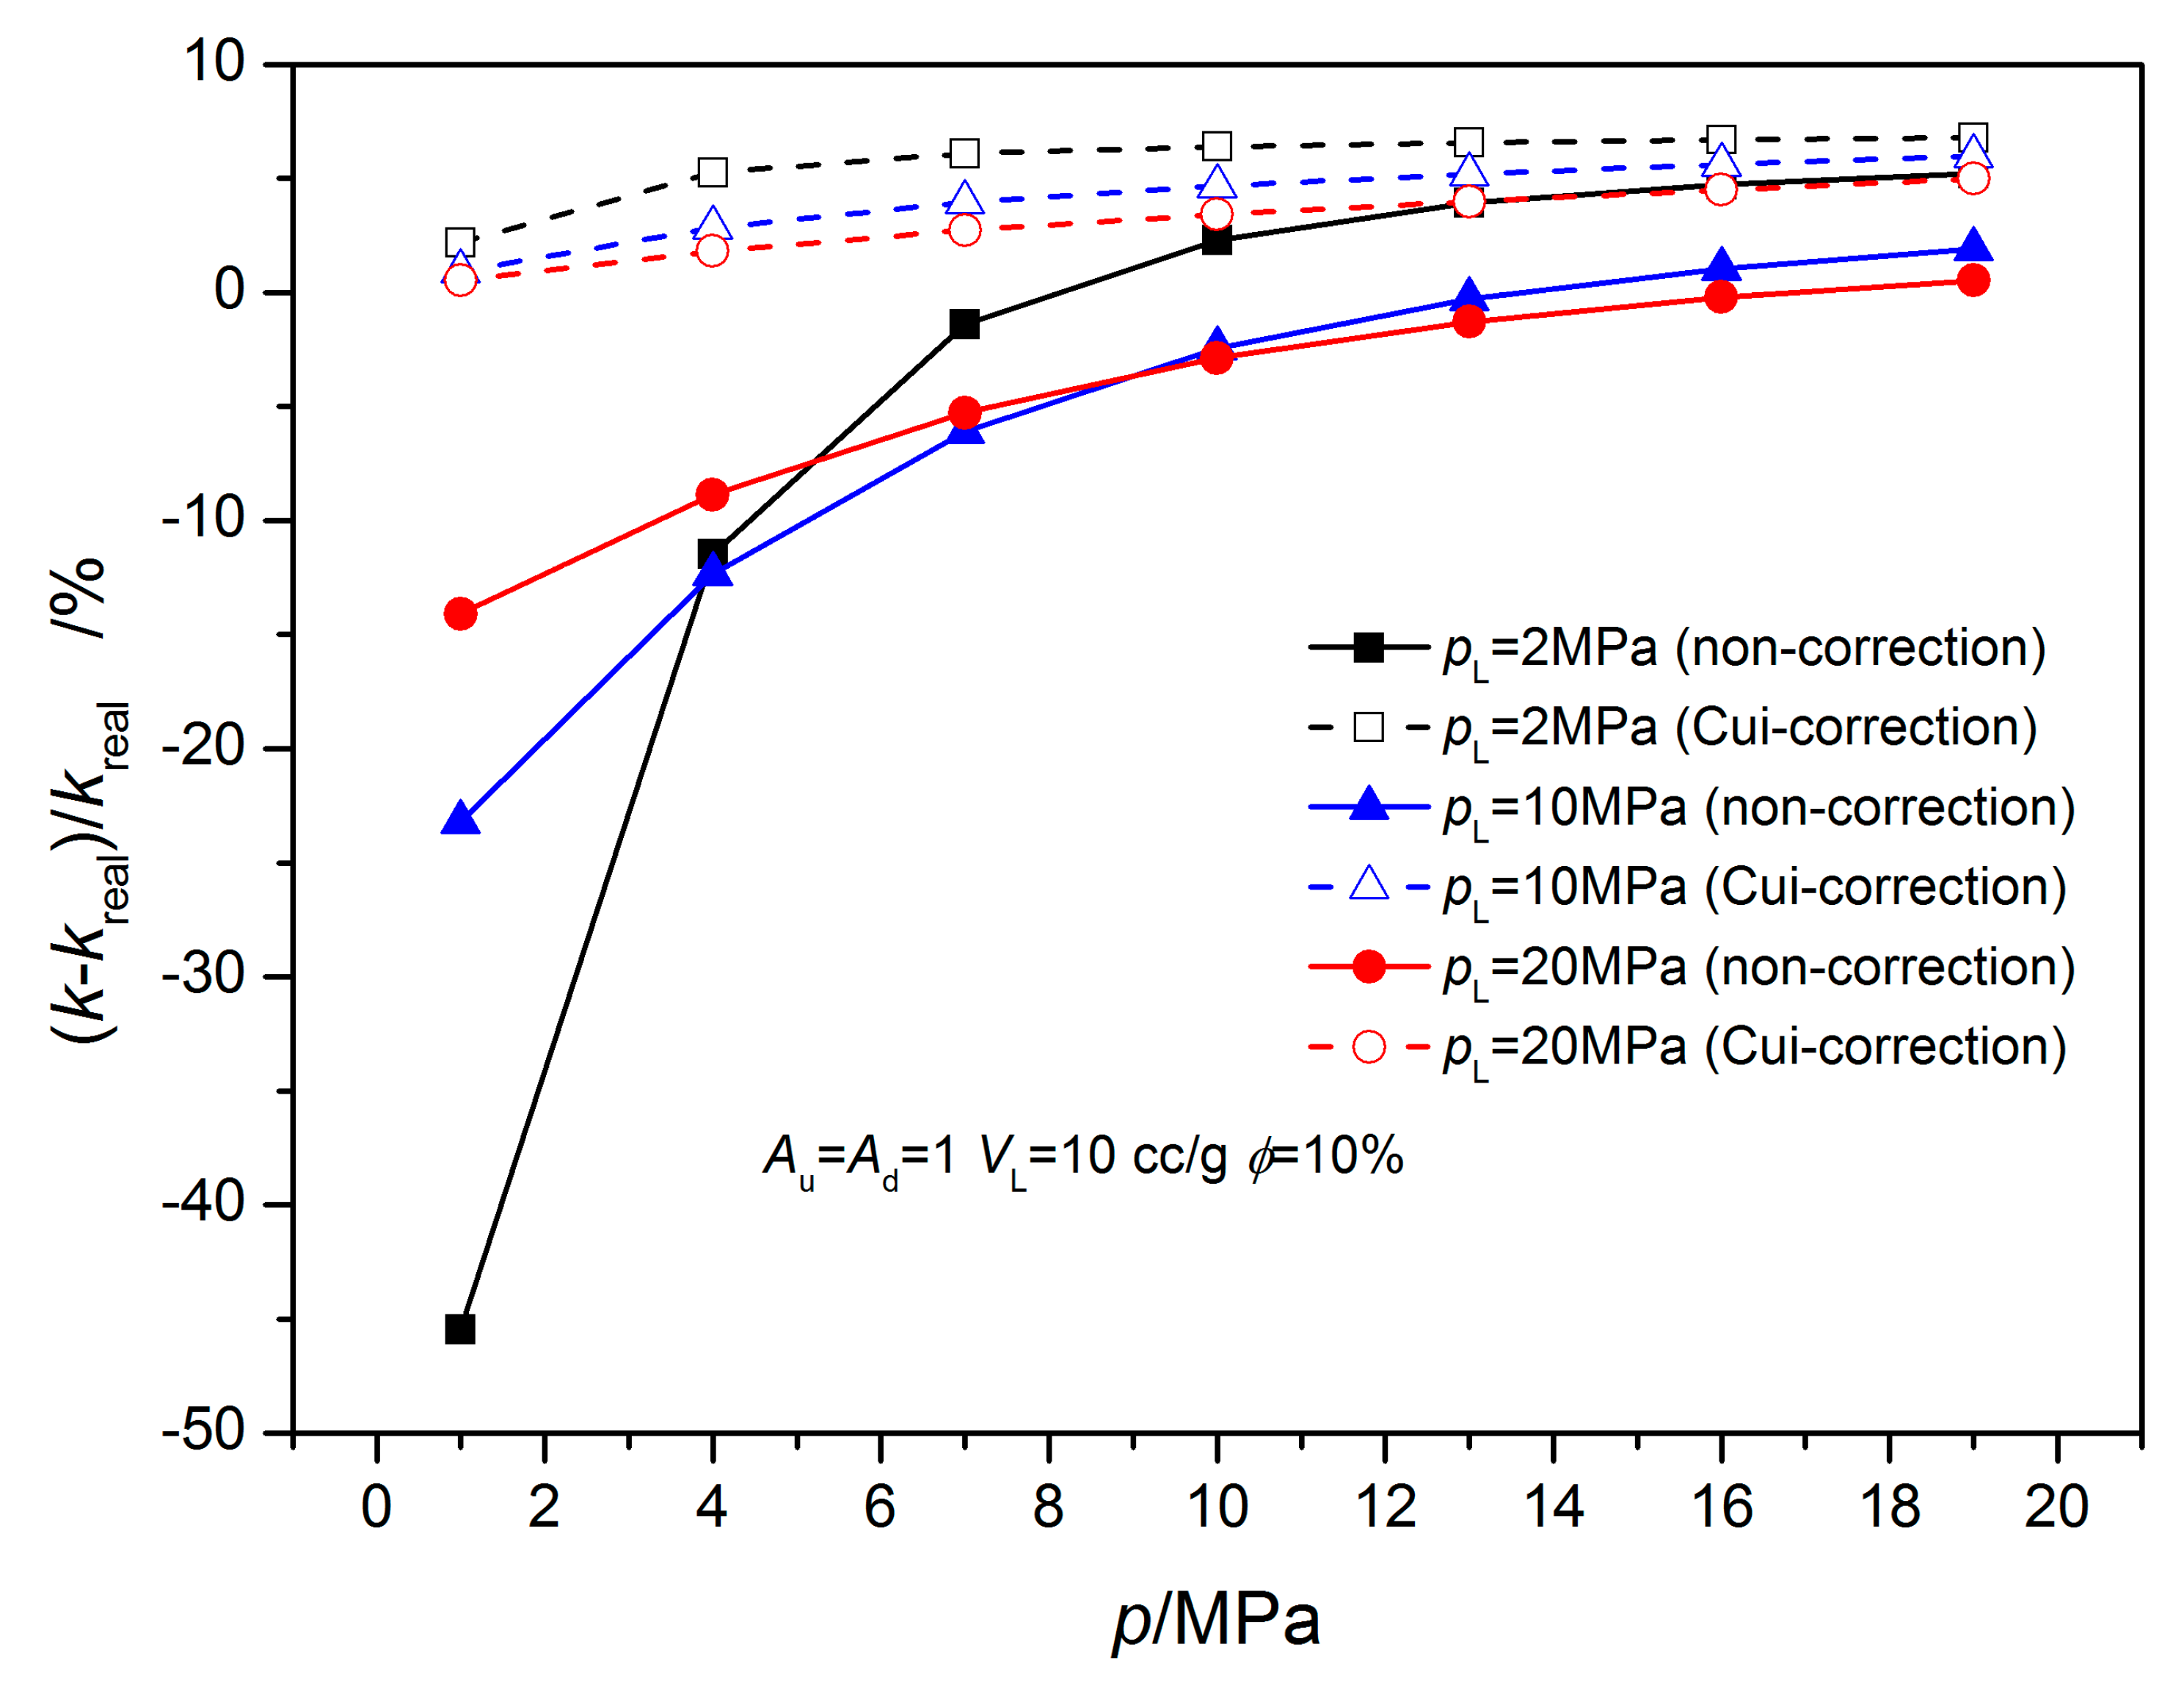
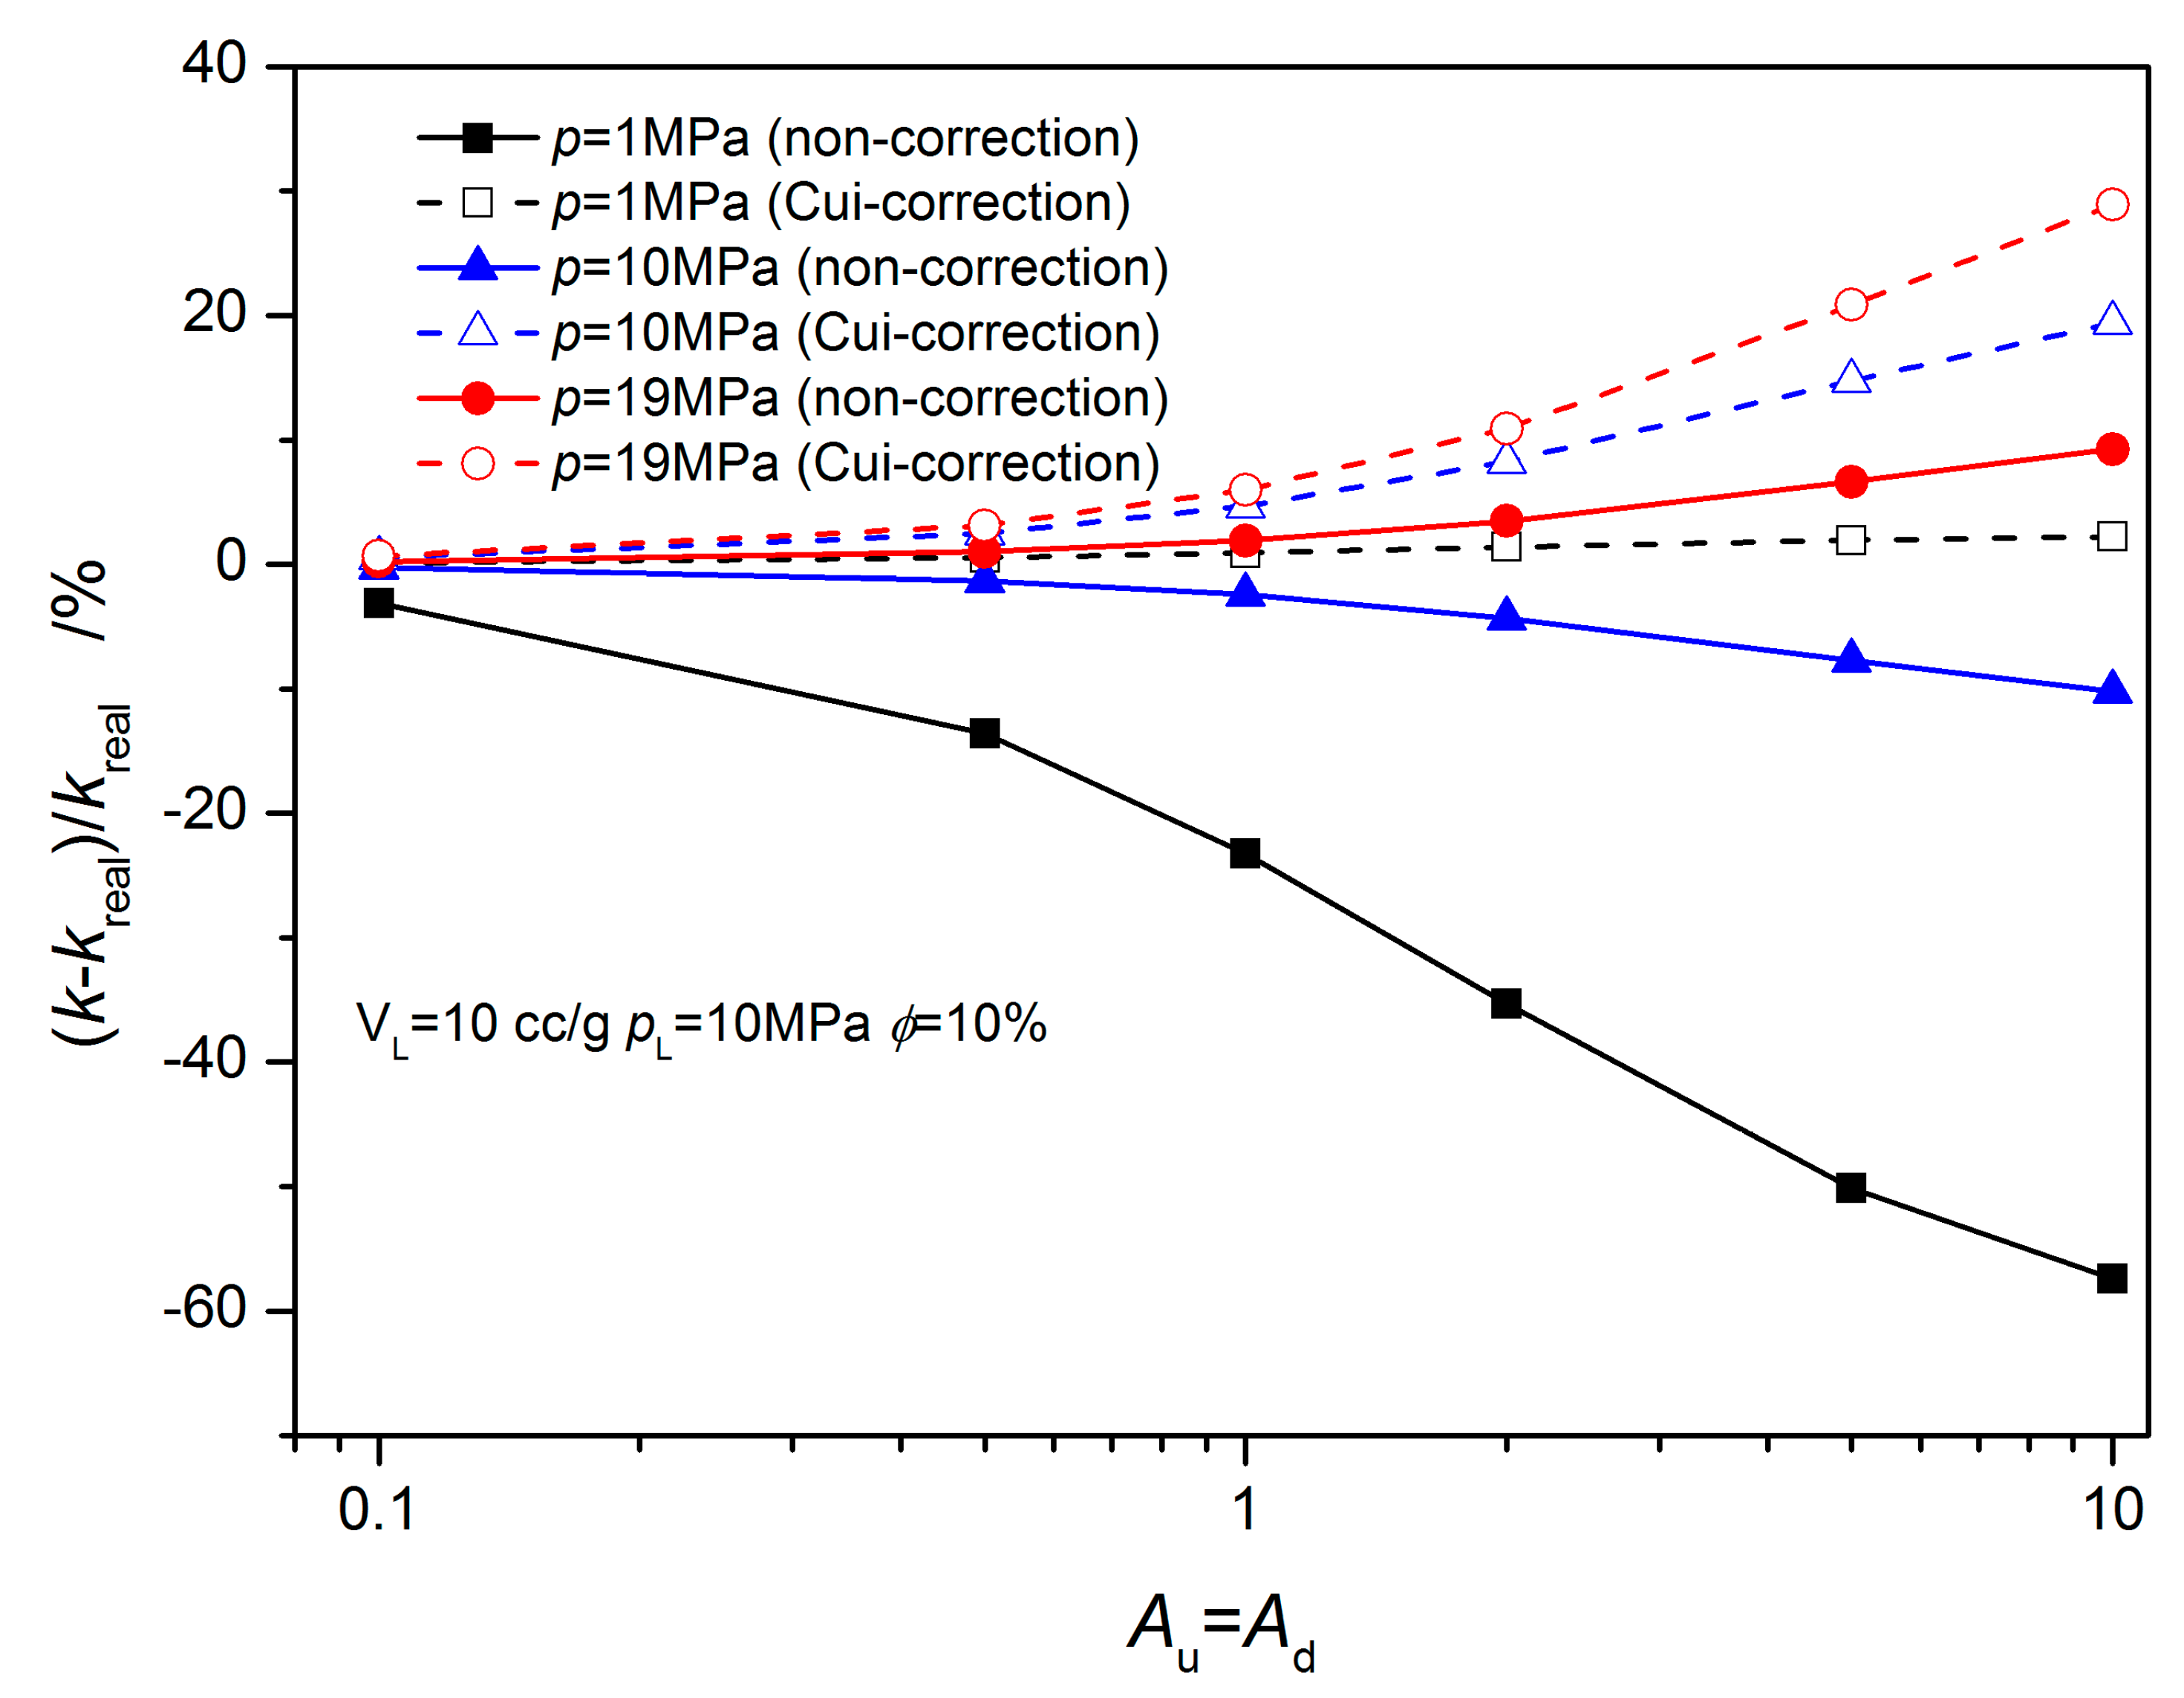
The Cui-correction method is excessive. Only when the testing pressure of VL is very small, the Cui-correction method works well. It can be found that the influences of the testing pressure, VL and pL, on the permeability, follow the same law for total compressibility shown in Figure 13 and Figure 14. Although, the influence of gas adsorption on permeability is not as intense as on the total compressibility, it still can generate an error of more than 45% (Figure 13 and Figure 14).
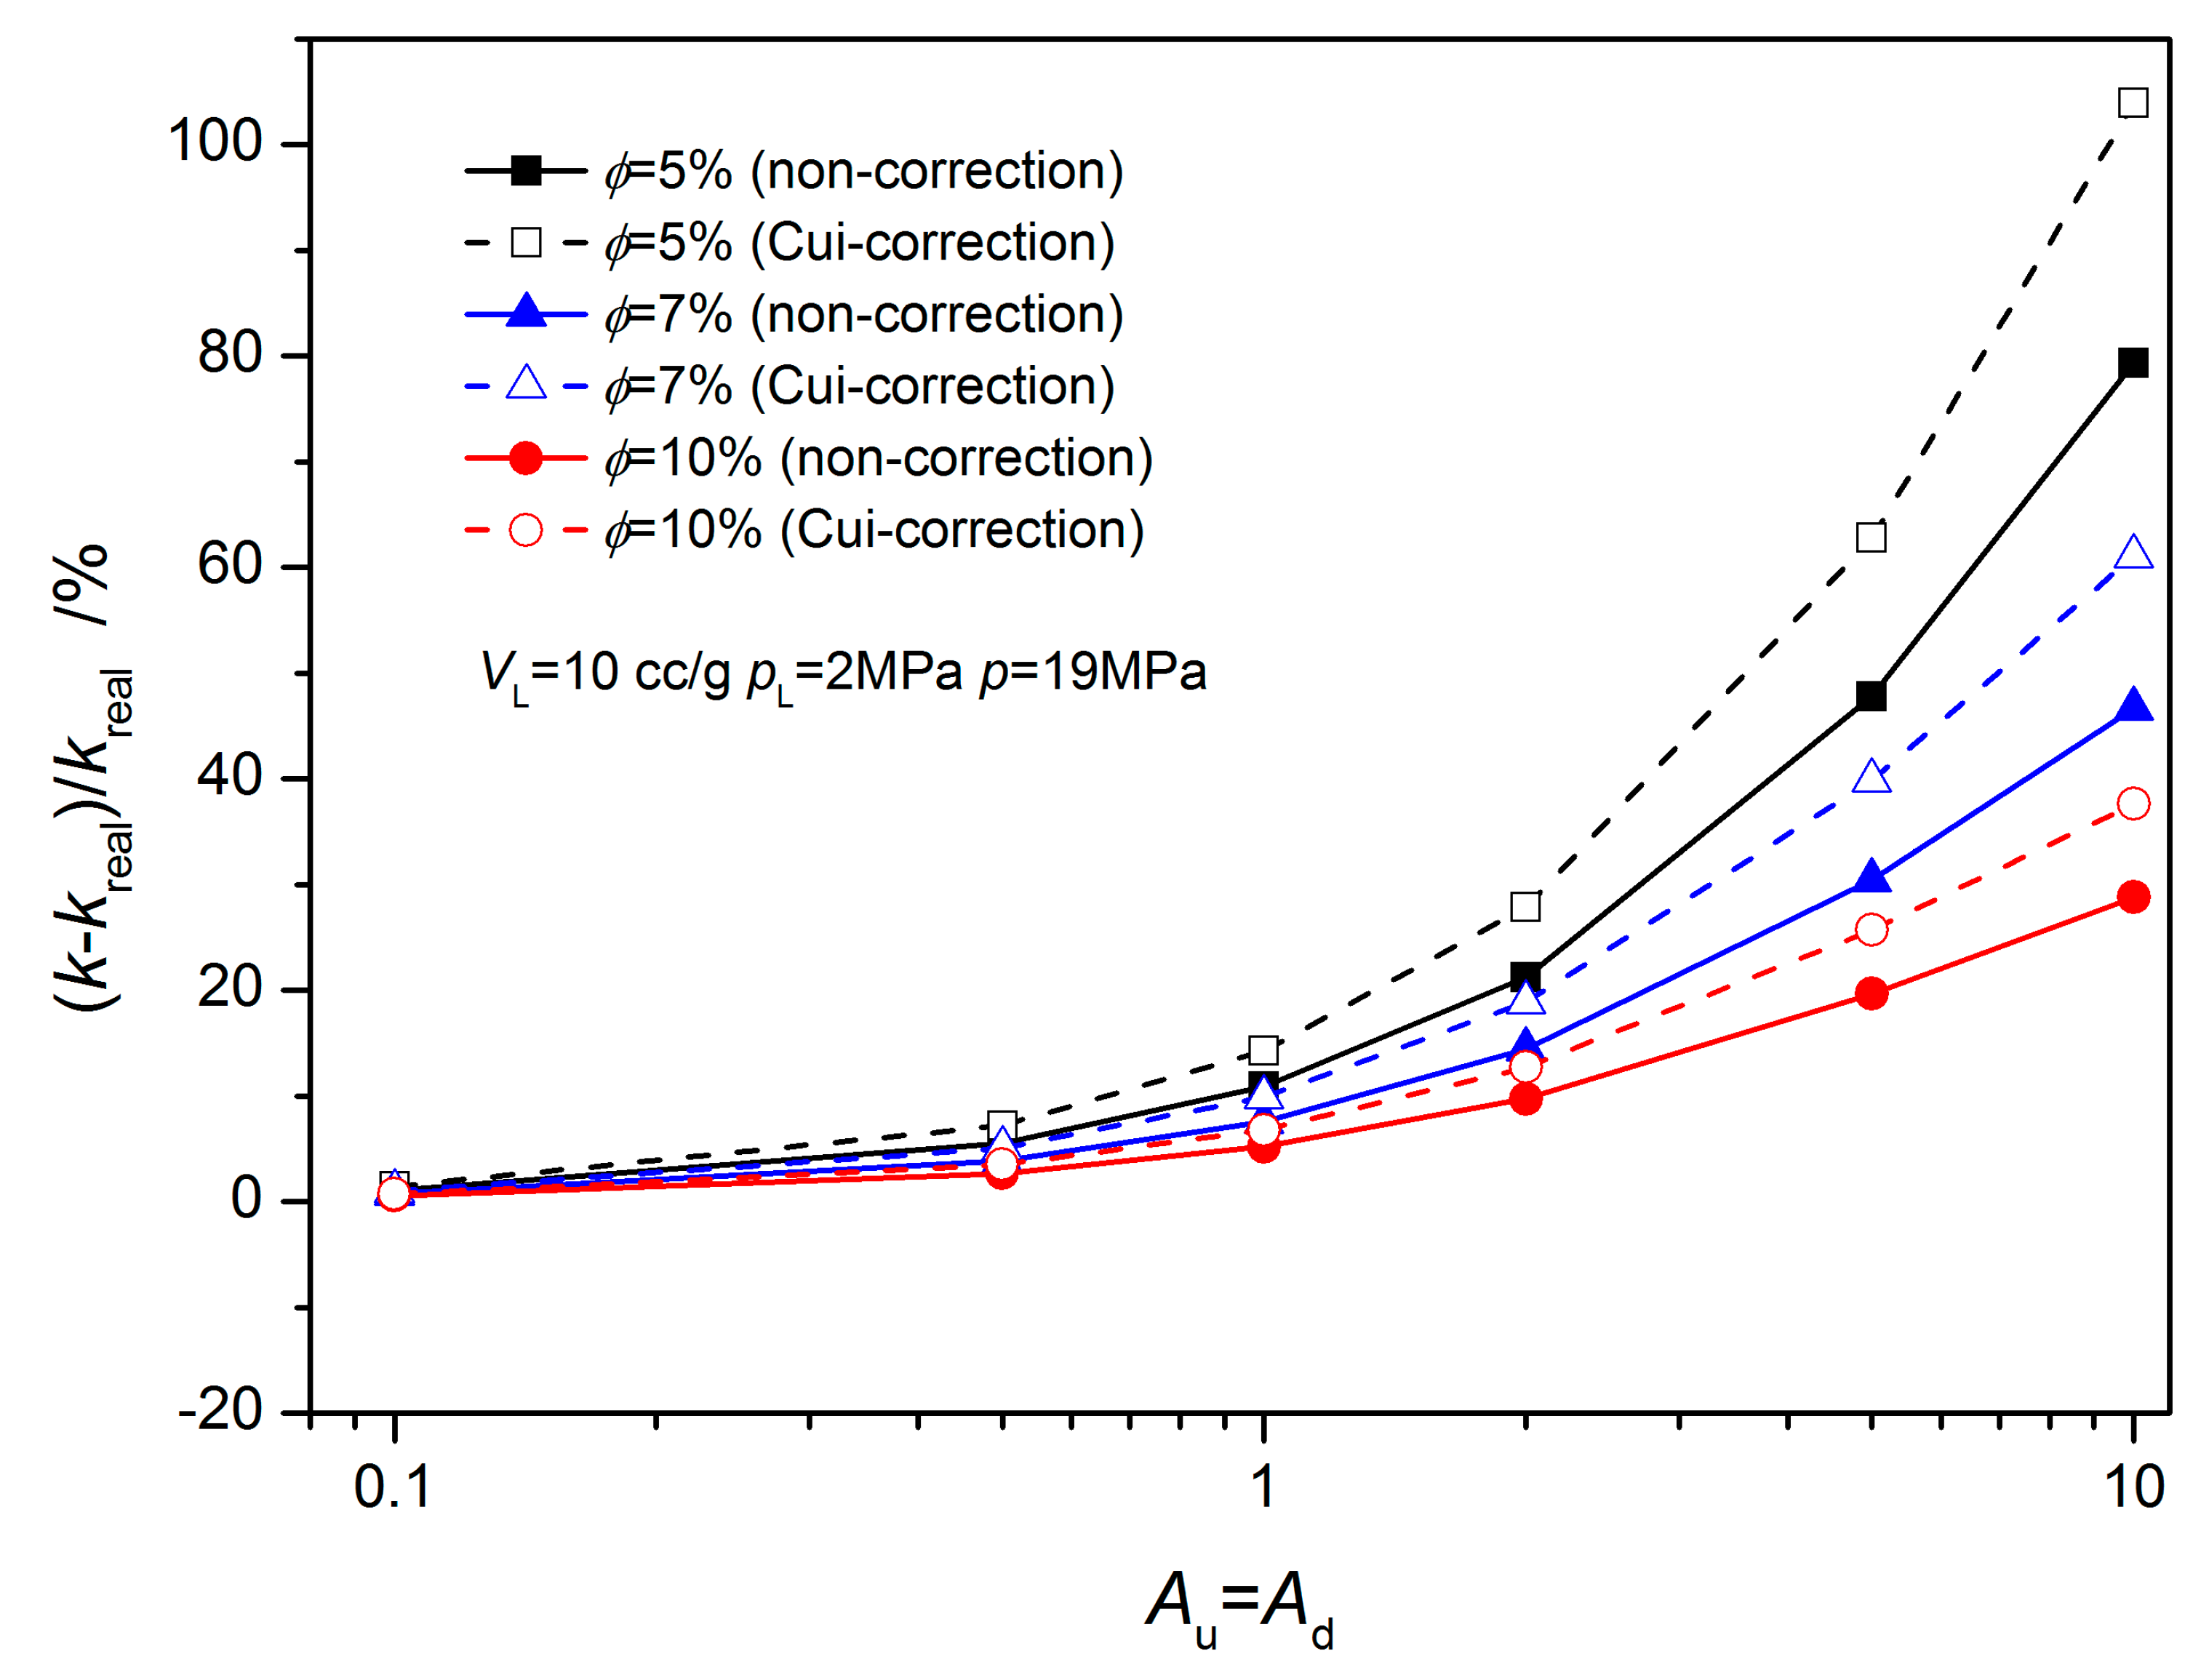
Figure 15 and Figure 16 show that the bigger the vessel volume is, the larger the error of non-correction permeability is. If Au = Ad = 0.1, the error is less than 1%. Therefore, if the vessel volume is very large, it does not need to be corrected. The permeability error of the Cui-correction method increases with the decrease of the vessel volumes. When Au = Ad = 10, φ = 10%, and p = 19 MPa, the error is approximately 30%. When Au = Ad = 1, φ = 5%, and p = 19 MPa, the error is also larger than 14%. When the testing pressure is very high, the result of the Cui-correction method is worse than that of the uncorrected, and it intensifies with the decrease of the vessel volume (Figure 16).
When the testing pressure is very low, the error of non-correction is large, and the result of the Cui-correction method is appropriate. Therefore, when the testing pressure is very large, the permeability needs to be determined by the equivalent total compressibility involving the adsorbed phase density in Equation (3), instead of by the total compressibility.

4.2. Non-Equilibrium Sorption Model

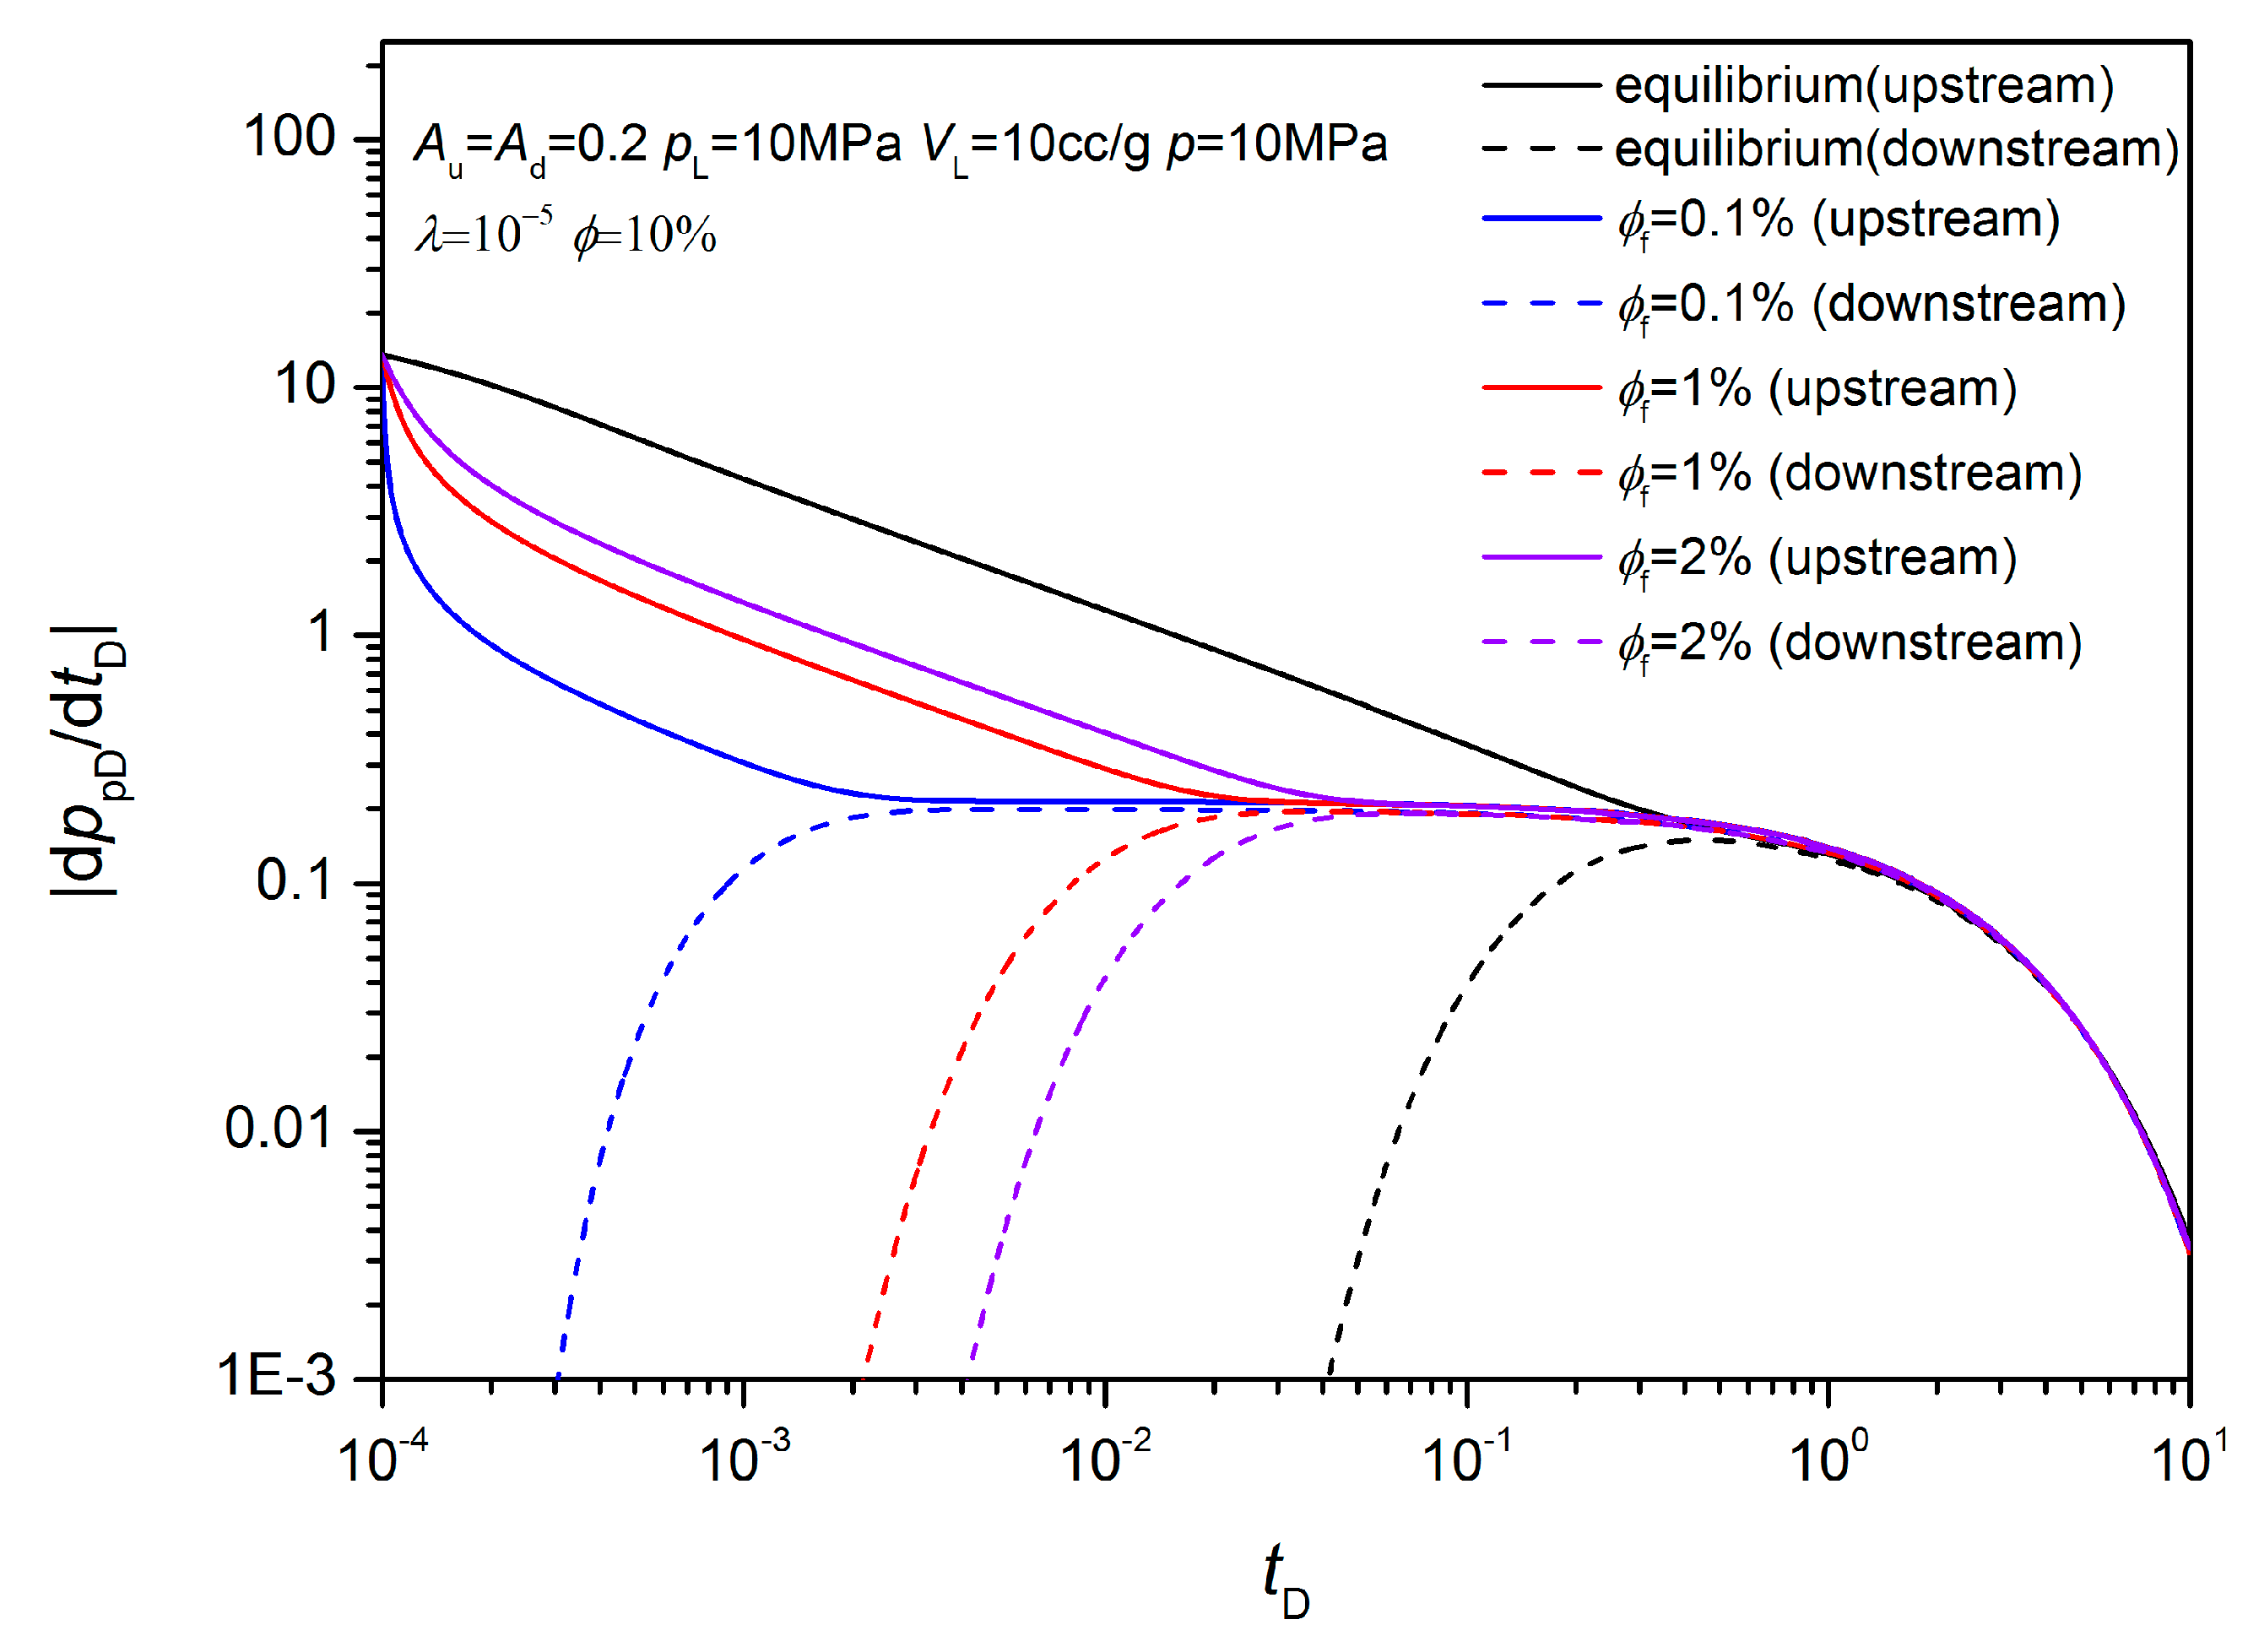
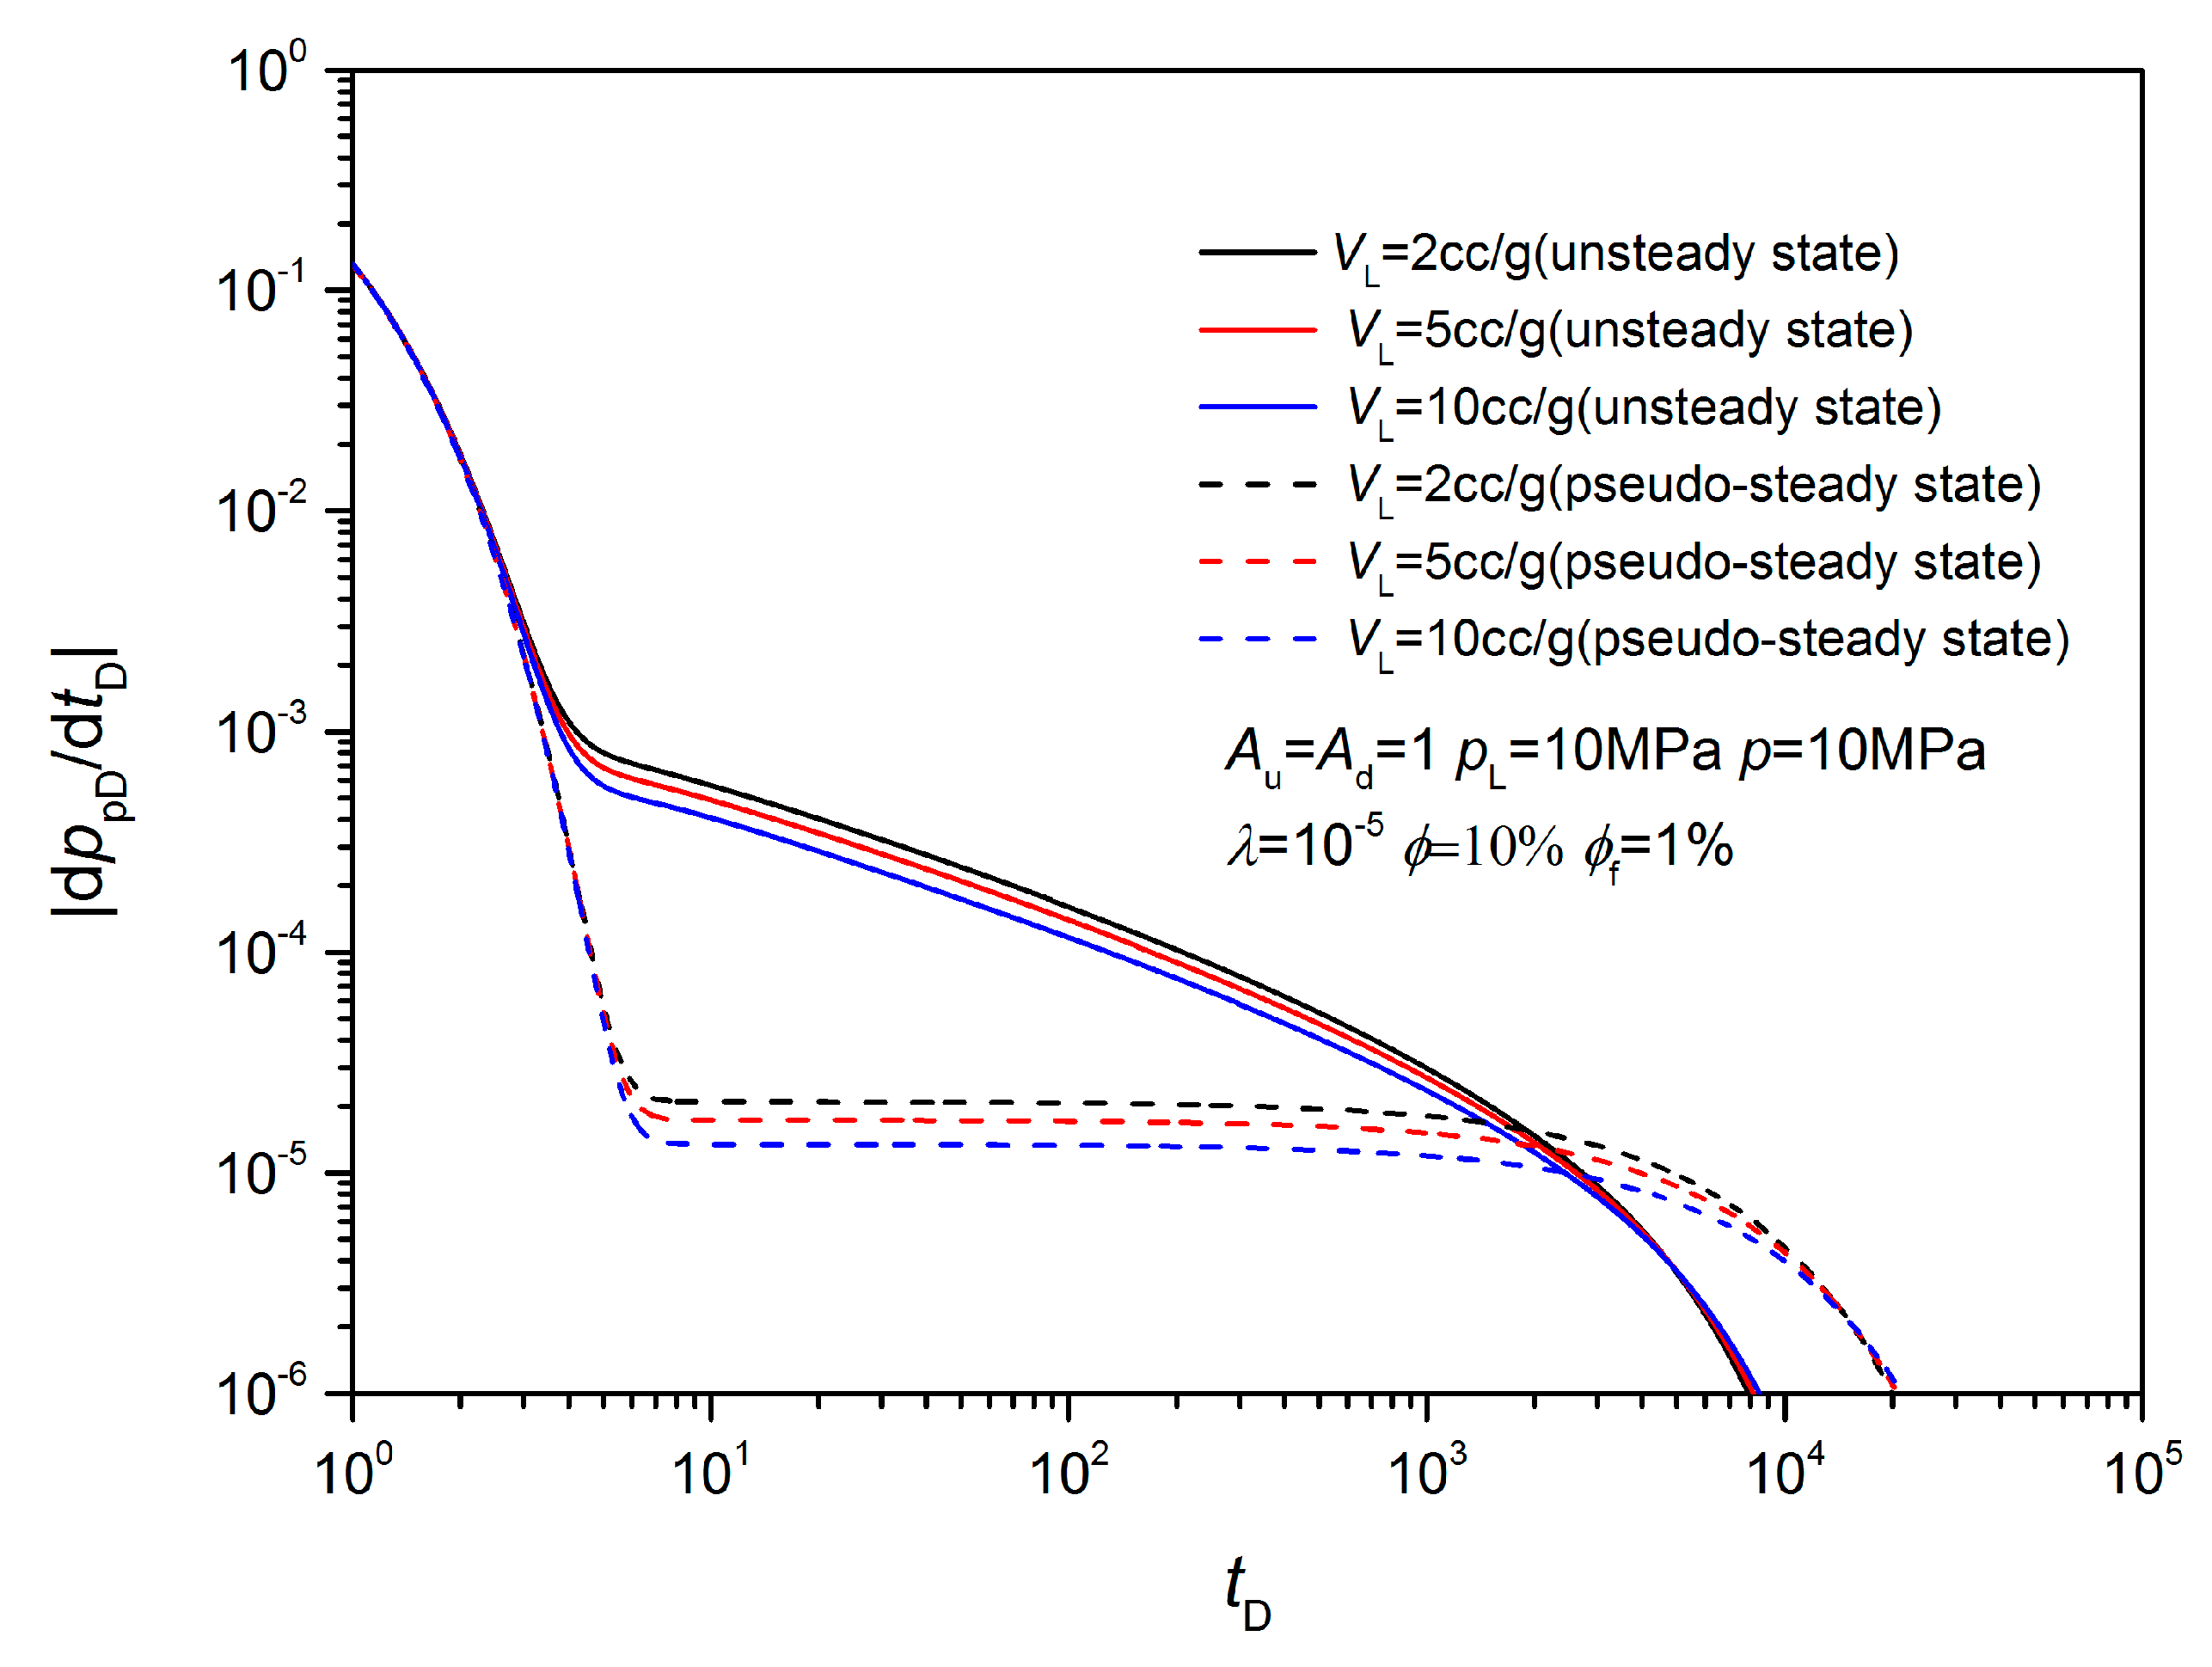
Figure 17 shows that the pseudo-pressure derivative curve of the non-equilibrium sorption model has a plateau under the proper vessel volume. However, this is not true for the equilibrium sorption model. These patterns are similar with the dual-porosity models [28]. Therefore, the pseudo-pressure derivative at the early stage can be used to differentiate the equilibrium and the non-equilibrium sorption models. If there is a plateau on the pseudo-pressure derivative curve, it means that the non-equilibrium sorption model is suitable, and the test must be continued to determine the diffusion coefficient. When there is gas sorption, besides the vessel volume, the adsorption parameters and the testing pressure also affect the pseudo-pressure derivative plateau, which is different from the dual-porosity media. Therefore, the vessel volumes should be chosen according to the core adsorption property and the testing pressure before the test. The unsteady state and the pseudo-steady state sorption model can also be identified by the pseudo-pressure derivative at the late stage. There is a plateau at the late stage on the pseudo-pressure derivative curve of pseudo-steady-state sorption model, and a lean straight line for the unsteady state sorption model (Figure 18). Since an analysis method similar to dual-porosity cores can be used, it will not be described in more detail herein [28].
For the two non-equilibrium sorption models, the pseudo-pressure derivative decreases with the Langmuir volume, which is the opposite observed for the pseudo-pressure (Figure 19). The influences of the Langmuir pressure and the testing pressure have similar impacts upon the pseudo-pressure derivative. These influences will not be detailed here.

5. Case Study

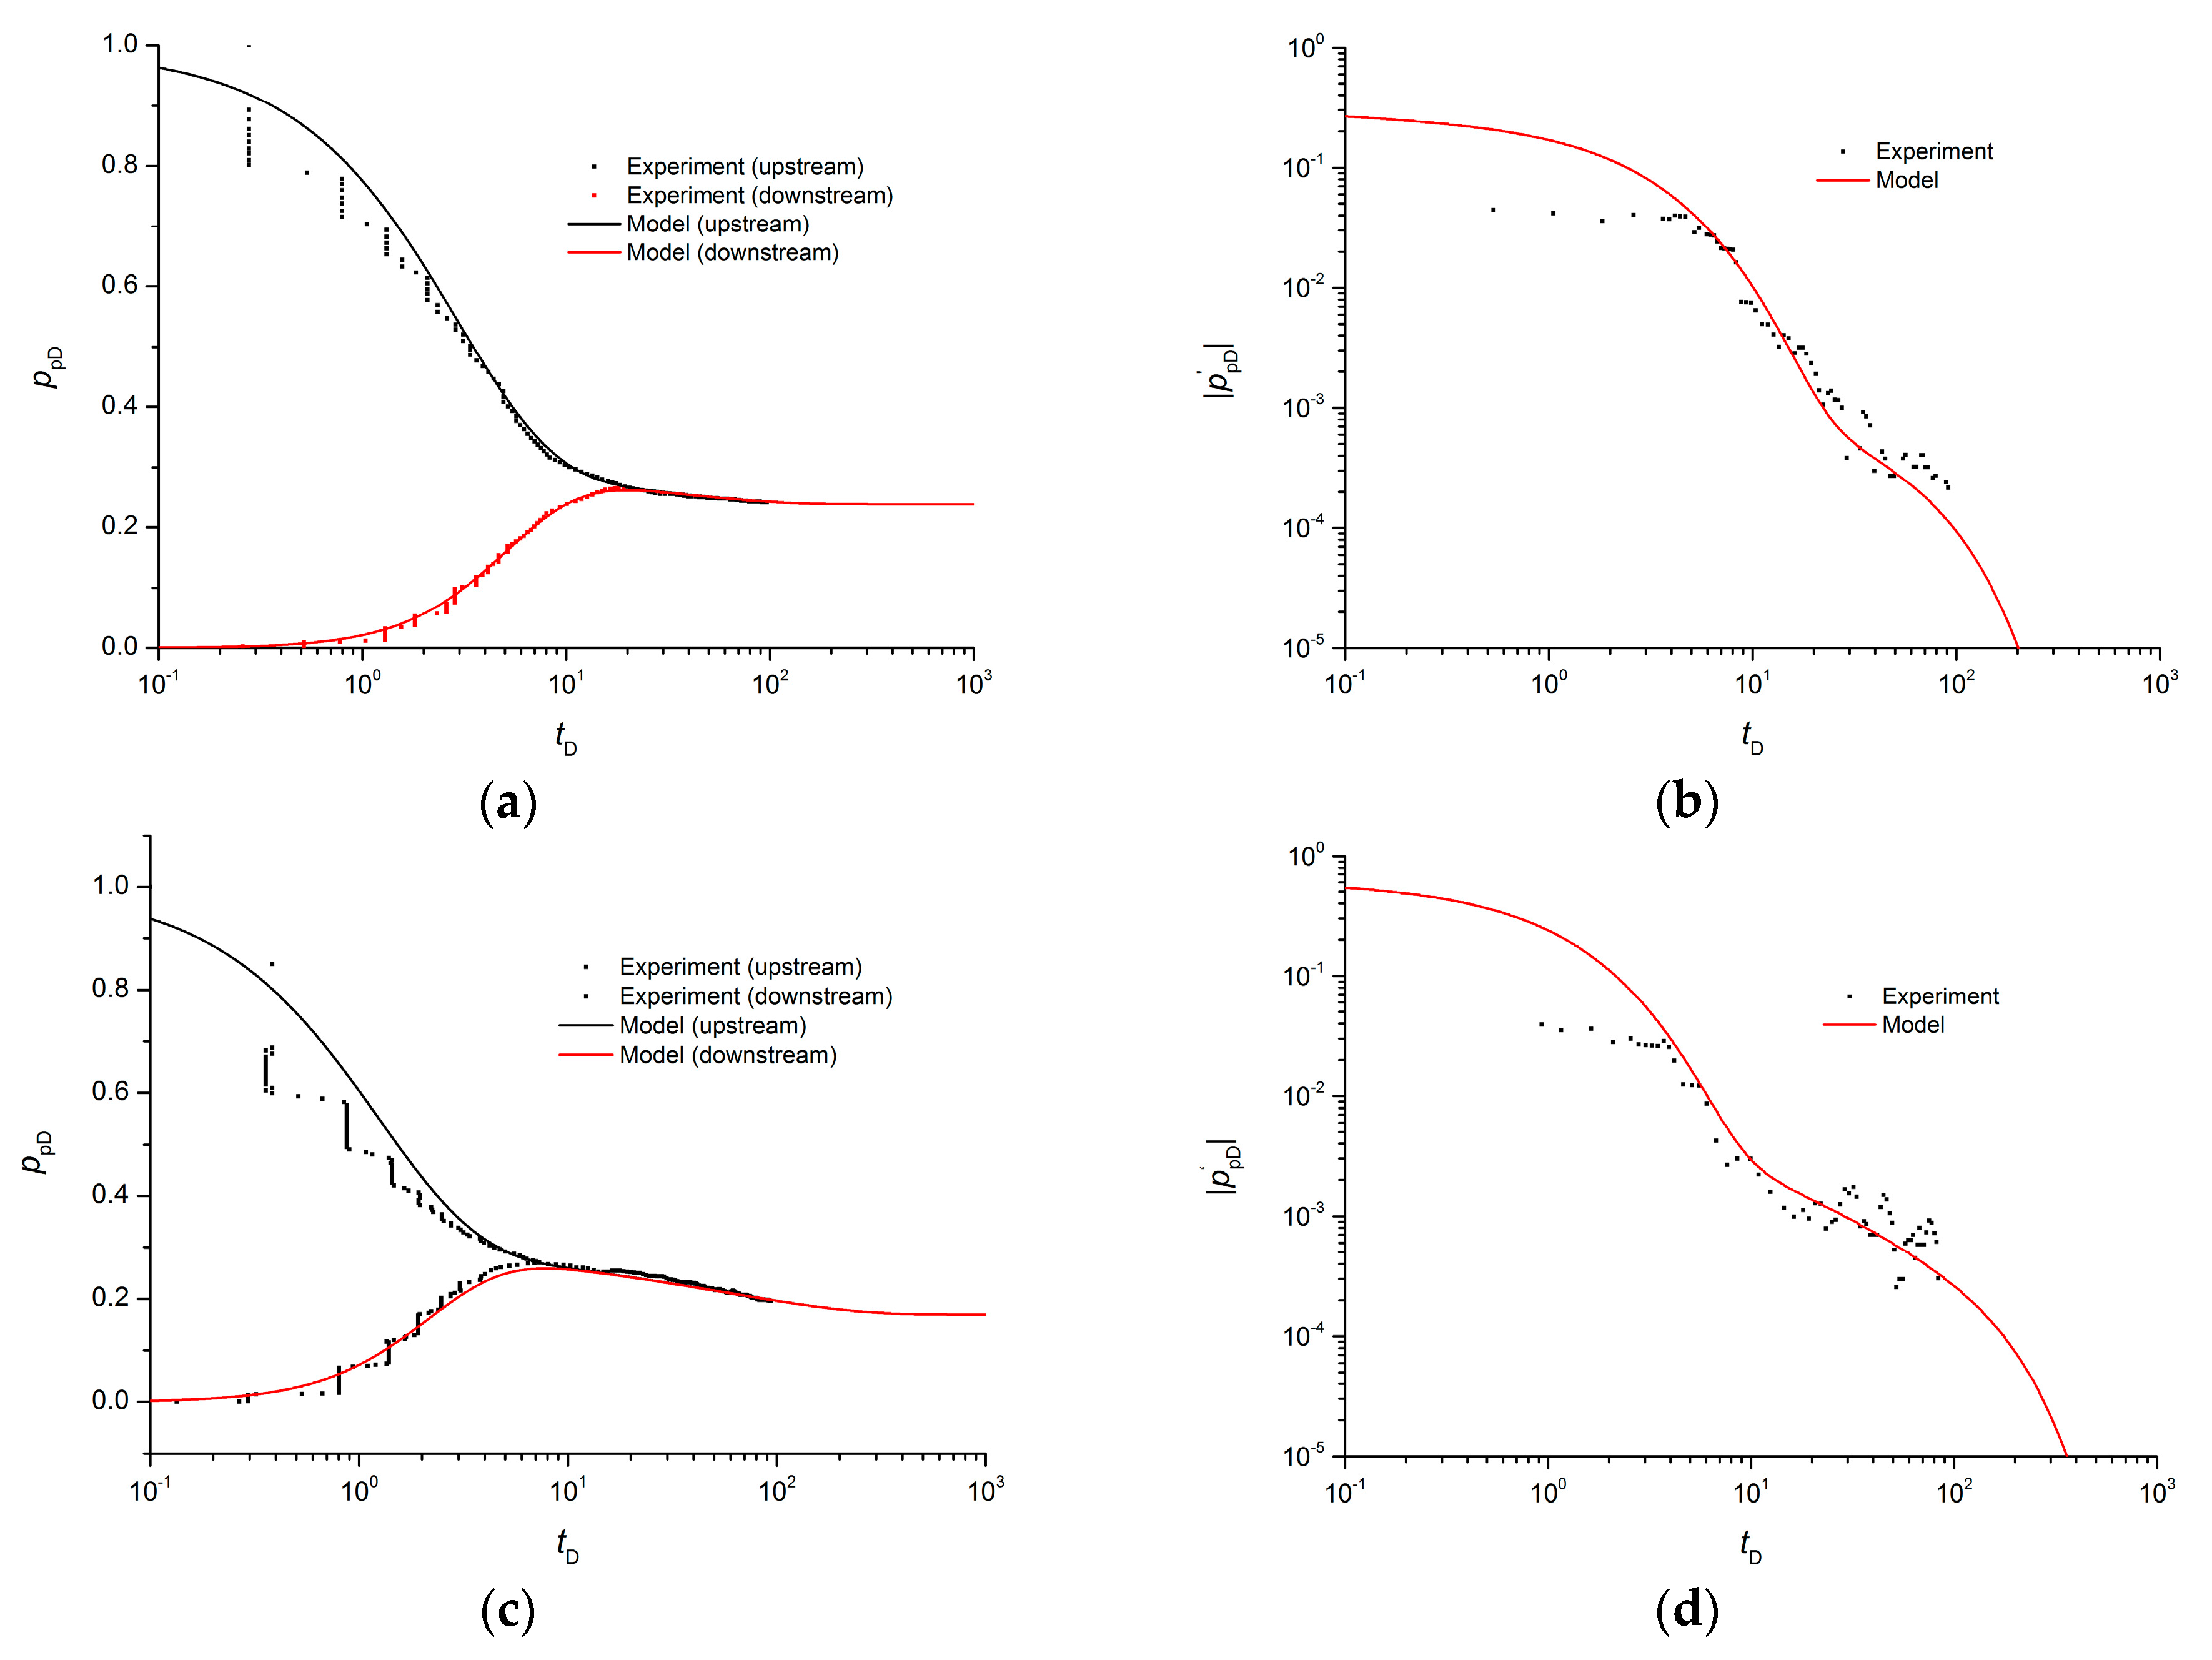
Pulse decay test data of N2 and CH4 for shale were extracted from Figure 6 of Aljamaan et al. [16]. Since the adsorption behavior of H2 and CO2 do not conform to the Langmuir model, which is used in this study, their data were not extracted. The pressure history and the pressure derivative history of N2 and CH4 were fitted using the method proposed in this study. The results are shown in Figure 20. The pressure derivative plots indicate that the unsteady state non-equilibrium sorption model is more suitable for this sample. The fitting quality of the early time is lower. Because the early pressure in the original figures changes almost vertically, it is hard to extract the data exactly in this period.
In addition, the time coordinate of Figure 20 is logarithmic, which leads to dispersed data at an early time. However, overall, the fitting results are sufficient. The parameters of the adsorption isotherm for CH4 and N2 measured by Aljamaan et al. [16] were used for fitting. Since the size of the sample was not specifically explained by Aljamaan et al. [16], the commonly used size was utilized in the simulation (the diameter is 2.54 cm (one inch) and the length is 5.08 cm (two inches)). The fitting results for N2 are the fracture permeability kf = 11 μD and λ = 3.8 × 10⁻⁴. The results for CH4 are the fracture permeability kf = 14.5 μD and λ = 4.0 × 10⁻⁴. In the fittings for these two gases, φf = 0.3% and φm = 4.4% were used. However, near this value, the fitting result is not sensitive to the fracture porosity, so the results of the fracture porosity may have large errors.
According to the parameters of the slippage effect measured by Aljamaan et al. [16], the apparent permeability of N2 and CH4 should be 7.98 μD (equilibrium pressure 53.01 psi) and 8.02 μD (equilibrium pressure 47.92 psi), respectively. These values are close to the results of this study, but there are obvious differences. Han et al. [28] points out that using a homogeneous model to analyze the permeability of dual-porosity cores may lead to significant error. A similar problem exists in the results of Aljamaan et al. [16], when using the approach of the Cui et al. [21] model to analyze non-equilibrium sorption. From the view of basic parameters, the sample length assumed in this study may differ from the actual. Furthermore, the adsorption isotherm fitted by Aljamaan et al. [16] deviates significantly from the measured point in the range of 0–100 psi (see Figure 9 in Aljamaan et al. [16]). These factors may lead to the difference between these two results. This example preliminarily validates the analysis method proposed for non-equilibrium sorption models. In order to more rigorously verify the methods proposed in this study, more pulse decay tests with gas adsorption are needed in the future.

6. Conclusions

Absorptive gases are sometimes used in pulse decay tests, and the influence of gas adsorption must be considered in data analysis. In this study, the volume of the adsorbed phase is considered, and the conventional models of adsorbing gas flow in porous media are modified to simulate the performance of pulse decay tests for equilibrium sorption, unsteady state and pseudo-steady-state non-equilibrium sorption.
For a pulse decay test of the equilibrium sorption model, an equivalent total compressibility is defined, resulting in the same form as the homogeneous model. Therefore, the pseudo-pressure curve of an equilibrium sorption model is similar to the homogeneous model. Numerical simulation also proves this conclusion. By using this equivalent total compressibility instead of the total compressibility of the analysis method for the homogeneous model, a correction method involving the absorbed phase volume is proposed. Further error analysis indicates that the model does not need any correction when the vessel volumes are very large. The Cui-correction method is excessive, and it is suitable only when the testing pressure is very low. If the testing pressure is very high, the error of the Cui-correction method cannot be ignored.
By defining appropriate dimensionless quantities, a dimensionless form of the non-equilibrium sorption equation similar to dual-porosity models can be obtained. Numerical simulations also show that the unsteady state and pseudo-steady state non-equilibrium sorption models are similar to the unsteady state and pseudo-steady state dual-porosity models, respectively. Like dual-porosity media, the equilibrium and non-equilibrium sorption models can be identified by the pseudo-pressure derivative at the early stage. When the non-equilibrium sorption models are affirmed to be the suitable model, the test must be continued to determine the model parameters. The unsteady state and the pseudo-steady state sorption models can also be identified by the pseudo-pressure derivative at the late stage. To use the pseudo-pressure derivative successfully, the suitable vessel volumes must be chosen according to the core sorption property, the testing pressure and the porosity. This proposed method was verified by a case study.

Author Contributions

Conceptualization, G.H. and X.L.; validation, Y.C.; formal analysis, G.H.; investigation, Y.C. and X.L.; writing—original draft preparation, G.H.; writing—review and editing, Y.C. and X.L.; funding acquisition, G.H.

Funding

This research was funded by the National Natural Science Foundation of China, grant number 11602276 and the Key Laboratory for Mechanics in Fluid Solid Coupling Systems, CAS.

Conflicts of Interest

The authors declare no conflict of interest.

Nomenclature

p,pfpressure and fracture pressure [Pa];
ttime [s];
xcoordinate along the sample, takes the upstream vessel as the origin [m];
Llength of the sample [m];
Vu, Vd, Vpthe volume of the upstream vessel, downstream vessels and the sample pore, respectively [m3];
V, Victotal gas mass occurred and initial total gas mass occurred in the matrix [kg/m3];
C, CEgas concentration in the matrix and equivalent gas concentration in the fracture, respectively [kg/m3];
VL, pLLangmuir volume and pressure respectively [m3/kg, Pa];
cg, cfcompressibility of testing gas and pore volume, respectively [Pa−1];
ct, c t e sample total compressibility and equivalent total compressibility [Pa−1];
cVd, cVucompressibilities of upstream and downstream vessels respectively [Pa−1];
k, kf, kmpermeability, permeabilities of fractures and matrix respectively [m2];
Dmgas diffusion coefficient [m2/s];
Rm, rmthe radius and coordinate of the spherical matrix respectively [m];
Mmolecular molar mass [kg/mol];
Zgas deviator factor;
RUniversal Gas Constant [J/(mol∙K)];
Ttemperature [K]
Greeks
φ, φa, φf, φmporosity, porosity of the adsorbed phased, fracture and matrix, respectively [%];
μviscosity [Pa∙s];
ρ, ρa, ρsc, ρsdensity of the testing gas, adsorbed gas, gas at the standard condition and apparent density of samples [kg/m3];
λDpseudo-interporosity flow coefficient;
ωpseudo-storativity ratio;
Subscripts
f, mmacropores and micropores respectively;
u, dupstream and downstream vessels respectively;
aadsorbed phase;
ireference status;
0initial status;
pnormalized pseudo-pressure;
Ddimensionless variable

Appendix A. Numerical Solution for Equilibrium Sorption Model

For the convenience of writing, the following parameters are defined.
θ = Δ t Δ x , τ = Δ t Δ x 2 , E = k f ( c g + c V d ) μ φ L V p V d , F = k f ( c g + c V d ) μ φ L V p V d , H = ρ φ c t e , G = ρ k μ
Therefore, the governing equation Equation (4) and the boundary conditions Equations (5)–(7) of the equilibrium sorption model can be written as follows.
H p t = x ( G p x )
d p u d t = E p x | x = 0 , t > 0
d p d d t = F p x | x = L , t > 0
The sample is divided into N segments with element length ∆x and is numbered from 0 to N. The finite difference method was used to discretize the equations. The governing equation Equation (A3) of the equilibrium sorption model can be discretized as follows.
H j ( s ) p j ( s + 1 ) p j n Δ t = 1 Δ x ( G j + 1 / 2 ( s ) p j + 1 ( s + 1 ) p j ( s + 1 ) Δ x G j 1 / 2 n p j ( s + 1 ) p j 1 ( s + 1 ) Δ x )
The subscript n and s represent the nth time step and the sth iteration in one time step, respectively. The subscript j represents the jth node. The boundary conditions of the upstream and downstream vessels can be discretized as follows.
p 0 ( s + 1 ) p 0 n Δ t = E 1 / 2 ( s ) p 1 ( s + 1 ) p 0 ( s + 1 ) Δ x
p N ( s + 1 ) p N n Δ t = F N 1 / 2 ( s ) p N ( s + 1 ) p N 1 ( s + 1 ) Δ x
The above Equations (A5) to (A7) can be simplified to the following Equations (A8) to (A10), respectively.
τ G j + 1 / 2 ( s ) p j + 1 ( s + 1 ) + ( τ G j + 1 / 2 ( s ) + τ G j 1 / 2 ( s ) + H j ( s ) ) p j ( s + 1 ) τ G j 1 / 2 ( s ) p j 1 ( s + 1 ) = H j ( s ) p j n
θ E 1 / 2 ( s ) p 1 ( s + 1 ) + ( θ E 1 / 2 ( s ) + 1 ) p 0 ( s + 1 ) = p 0 n
( θ F N 1 / 2 ( s ) + 1 ) p N ( s + 1 ) θ F N 1 / 2 ( s ) p N 1 ( s + 1 ) = p N n
The initial condition Equation (5) can be discretized as:
p j ( 0 ) = p d ( 0 ) 0 < j N + 1 ,   p 0 ( 0 ) = p u ( 0 ) .
There is an unknown variable pj on each node for a total of N + 1 unknown variables. There are a total of N + 1 equations: N − 1 equations on N − 1 internal nodes with Equation (A8), and Equations (A9) and (A10) on the two boundary nodes. They form a matrix of N + 1 rank, which can be iteratively solved in combination with the initial condition Equation (A11).

Appendix B. Numerical Solution for the Pseudo-Steady-State Non-Equilibrium Sorption Model

In addition to the definition of Equation (A1), the following parameters are defined for the pseudo-steady-state non-equilibrium sorption model.
H = ρ ( φ c t ) f ,   G = ρ k f μ ,   W = 6 D m π 2 R m 2 .
Therefore, the governing equations Equations (9) and (10) of the pseudo-steady-state non-equilibrium sorption model can be written as:
H p f t = x ( G p f x ) V t ,
V t = W ( C E C ) .
Like the equilibrium adsorption model, the sample can be divided into N segments with element length ∆x, and the node number is from 0 to N. Using the finite difference method, the governing Equations (A13) and (A14) can be discretized into:
H j ( s ) p f , j ( s + 1 ) p f , j n Δ t = 1 Δ x ( G j + 1 / 2 ( s ) p f , j + 1 ( s + 1 ) p f , j ( s + 1 ) Δ x G j 1 / 2 ( s ) p f , j ( s + 1 ) p f , j 1 ( s + 1 ) Δ x ) V j ( s + 1 ) V j n Δ t ,
V j s + 1 V j n Δ t = W ( C E , j s + 1 C j s + 1 ) .
The governing Equations (A15) and (A16) can be simplified into the following forms, respectively.
τ G j + 1 / 2 ( s ) p f , j + 1 ( s + 1 ) + ( τ G j + 1 / 2 ( s ) + τ G j 1 / 2 ( s ) + H j ( s ) ) p f , j ( s + 1 ) τ G j 1 / 2 ( s ) p f , j 1 ( s + 1 ) + W Δ t C E , j ( s + 1 ) W Δ t C j ( s + 1 ) = H j ( s ) p f , j n ,
W Δ t C E , j ( s + 1 ) + W Δ t C j ( s + 1 ) + V j ( s + 1 ) = V j n
The discretized equations for the boundary conditions and the initial conditions can be directly obtained by using pf instead of p in Equations (A9)–(A11). CE,j can be written as a function of pf,j, thereby reducing one variable. There are three unknown variables, pf,j, Vj and Cj, on each node, and Vj and Cj can be written as a function of the same pressure, thereby reducing one unknown variable on every node. Therefore, there is a total of 2 (N + 1) unknown variables.
There are 2 (N − 1) equations on N − 1 internal nodes with Equations (A17) and (A18), and four equations on two boundary nodes with Equation (A18) and Equations (A9)–(A11). Hence, a matrix of rank 2(N + 1) can be formed. A numerical solution can be iteratively obtained by adding the initial conditions Equation (A11).

Appendix C. Numerical Solution for the Unsteady State Non-Equilibrium Sorption Model

In addition to the definitions of Equations (A1) and (A12), the following parameters are defined.
θ m = Δ t Δ r m ,   τ m = Δ t Δ r m 2 ,   W = 3 D m R m .
Therefore, the governing equation, that is, Equation (12) for the unsteady state non-equilibrium sorption model, can be written as:
H p f t = x ( G p f x ) W C r m | r m = R .
For the unsteady state non-equilibrium sorption model, the sample is divided into N segments with fracture element length ∆x, and the node number is from 0 to N. In addition, the matrix needs to be divided into M segments with an element length ∆rm, and the node number is from 0 to M. Using the finite difference method, the governing equations, Equations (A20) and (13) for the unsteady state non-equilibrium sorption model, can be discretized into:
H j ( s ) p f , j ( s + 1 ) p f , j n Δ t = x ( G j + 1 / 2 ( s ) p f , j + 1 ( s + 1 ) p f , j ( s + 1 ) Δ x G j 1 / 2 ( s ) p f , j ( s + 1 ) p f , j 1 ( s + 1 ) Δ x ) W C M ( s + 1 ) C M 1 n Δ r m ,
V j , i ( s + 1 ) V j , i n Δ t = 1 r m , i 2 1 Δ r m ( r m , i + 1 / 2 2 D m C j , i + 1 ( s + 1 ) C j , i ( s + 1 ) Δ r m r m , i 1 / 2 2 D m C j , i ( s + 1 ) C j , i 1 ( s + 1 ) Δ r m ) .
where subscript i indicates the node number of the matrix. The matrix boundary conditions Equation (14) can be discretized into:
C j , 1 n C j , 0 n Δ r m = 0 .
The above Equations (A21)–(A23) can be simplified to:
τ G j + 1 / 2 ( s ) p f , j + 1 ( s + 1 ) + ( τ G j + 1 / 2 ( s ) + τ G j 1 / 2 ( s ) + H j ( s ) ) p f , j ( s + 1 ) τ G j 1 / 2 ( s ) p f , j 1 ( s + 1 ) + W θ m ( C M ( s + 1 ) C M 1 ( s + 1 ) ) = H j ( s ) p f , j n .
D m τ m r m , i + 1 / 2 2 r m , i 2 C j , i + 1 ( s + 1 ) + ( D m τ m r m , i + 1 / 2 2 r m , i 2 + D m τ m r m , i 1 / 2 2 r m , i 2 ) C j , i ( s + 1 ) + V j , i ( s + 1 ) D m τ m r m , i 1 / 2 2 r m , i 2 C j , i 1 ( s + 1 ) = V j , i n .
C j , 1 n C j , 0 n = 0 .
The discretized equations for the boundary and initial conditions can be directly obtained by replacing p into Equations (A9)–(A11) with pf. For each fracture node, there are M + 1 matrix unknown variables, Cj,i and Vj,i, and one fracture unknown variable pf,j, totaling (2M + 3) unknown variables. If the (M + 1)th matrix node unknown variable is written as a function of the fracture pressure at that location, an unknown variable can be reduced for every fracture node. Also note that Cj and Vj can be written as a function of the same pressure. Therefore, there are a total of (M + 1) × (N + 1) unknown variables. There are M − 1 Equation (A25) on matrix internal nodes, and Equation (A26) on the matrix inner boundary node for each fracture node. There are N − 1 equations on inner fracture nodes with Equation (A24), and Equations (A9) and (A10) on boundary nodes. They make up a (M + 1)(N + 1) rank equation group. Combined with the initial condition Equation (A11), a matrix of (N + 1) (M + 1) order can be formed for solving.
The following calculation strategy is taken in each time step: For the calculation of the fracture pressure, the gas concentration of the matrix is fixed; for the calculation of the concentration in the matrix, the fracture pressure is fixed. This approach can reduce the rank of the matrix by iteratively solving N + 1 M-rank matrices and one (N + 1)-rank matrix. In addition, the chasing method can be used to improve the calculation speed.
It should be pointed out that in order to improve the calculation accuracy of fracture-matrix exchange, the MINC modeling techniques and random walks methods were proposed in the literature [30,31].

References

  1. Brace, W.F.; Walsh, J.B.; Frangos, W.T. Permeability of granite under high pressure. J. Geophys. Res. 1968, 73, 2225–2236. [Google Scholar] [CrossRef]
  2. Bourbie, T.; Walls, J. Pulse decay permeability: Analytical solution and experimental test. SPE J. 1982, 22, 719–921. [Google Scholar] [CrossRef]
  3. Hsieh, P.A.; Tracy, J.V.; Neuzil, C.E.; Bredehoeft, J.D.; Silliman, S.E. A transient laboratory method for determining the hydraulic properties of ‘tight’ rocks—I. Theory. Int. J. Rock Mech. Min. Sci. Geomech. Abstr. 1981, 18, 245–252. [Google Scholar] [CrossRef]
  4. Chen, T.; Stagg, P.W. Semilog analysis of the pulse decay technique of permeability measurement. SPE J. 1984, 24, 639–642. [Google Scholar] [CrossRef]
  5. Jones, S.C. A technique for faster pulse-decay permeability measurements in tight rocks. SPE Form. Eval. 1997, 12, 19–25. [Google Scholar] [CrossRef]
  6. Pan, Z.; Ma, Y.; Connell, L.D.; Down, D.I.; Camilleri, M. Measuring anisotropic permeability using a cubic shale sample in a triaxial cell. J. Nat. Gas Sci. Eng. 2015, 26, 336–344. [Google Scholar] [CrossRef]
  7. Jang, H.; Lee, W.; Kim, J.; Lee, J. Novel apparatus to measure the low-permeability and porosity in tight gas reservoir. J. Pet. Sci. Eng. 2016, 142, 1–12. [Google Scholar] [CrossRef]
  8. Firouzi, M.; Alnoaimi, K.; Kovscek, A.; Wilcox, J. Klinkenberg effect of predicting and measuring helium permeability in gas shales. Int. J. Coal Geol. 2014, 123, 62–68. [Google Scholar] [CrossRef]
  9. Heller, R.; Vermylen, J.; Zoback, M. Experimental investigation of matrix permeability of gas shales. AAPG Bull. 2014, 98, 975–995. [Google Scholar] [CrossRef]
  10. Mokhtari, M.; Tutuncu, A.N. Characterization of anisotropy in the permeability of organic-rich shales. J. Pet. Sci. Eng. 2015, 133, 496–506. [Google Scholar] [CrossRef]
  11. Zhang, R.; Ning, Z.; Yang, F.; Wang, X.; Zhao, H.; Wang, Q. Impacts of nanopore structure and elastic properties on stress-dependent permeability of gas shales. J. Nat. Gas Sci. Eng. 2015, 26, 1663–1672. [Google Scholar] [CrossRef]
  12. Cronin, M.B.; Flemings, P.B.; Bhandari, A.R. Dual-permeability microstratigraphy in the Barnett Shale. J. Pet. Sci. Eng. 2016, 142, 119–128. [Google Scholar] [CrossRef]
  13. Cao, C.; Li, T.; Shi, J.; Zhang, L.; Fu, S.; Wang, B.; Wang, H. A new approach for measuring the permeability of shale featuring adsorption and ultra-low permeability. J. Nat. Gas Sci. Eng. 2016, 30, 548–556. [Google Scholar] [CrossRef]
  14. Zhang, R.; Ning, Z.; Yang, F.; Zhao, H.; Wang, Q. A laboratory study of the porosity-permeability relationships of shale and sandstone under effective stress. Int. J. Rock Mech. Min. Sci. 2016, 81, 19–27. [Google Scholar] [CrossRef]
  15. Alnoaimi, K.R.; Duchateau, C.; Kovscek, A.R. Characterization and measurement of multiscale gas transport in shale-core samples. SPE J. 2016, 21, 573–588. [Google Scholar] [CrossRef]
  16. Aljamaan, H.; Al Ismail, M.; Kovscek, A.R. Experimental investigation and Grand Canonical Monte Carlo simulation of gas shale adsorption from the macro to the nano scale. J. Nat. Gas Sci. Eng. 2017, 48, 119–137. [Google Scholar] [CrossRef]
  17. Alnoaimi, K.R.; Kovscek, A.R. Influence of microcracks on flow and storage capacities of gas shales at core scale. Transp. Porous Media 2019, 127, 53–84. [Google Scholar] [CrossRef]
  18. Ghanizadeh, A.; Gasparik, M.; Amann-Hildenbrand, A.; Gensterblum, Y.; Krooss, B.M. Experimental study of fluid transport processes in the matrix system of the European organic-rich shales: I. Scandinavian Alum Shale. Mar. Pet. Geol. 2014, 51, 79–99. [Google Scholar] [CrossRef]
  19. Ghanizadeh, A.; Amann-Hildenbrand, A.; Gasparik, M.; Gensterblum, Y.; Krooss, B.M.; Littke, R. Experimental study of fluid transport processes in the matrix system of the European organic-rich shales: II. Posidonia Shale (Lower Toarcian, northern Germany). Int. J. Coal Geol. 2014, 123, 20–33. [Google Scholar] [CrossRef]
  20. Gensterblum, Y.; Ghanizadeh, A.; Krooss, B.M. Gas permeability measurements on Australian subbituminous coals: Fluid dynamic and poroelastic aspects. J. Nat. Gas Sci. Eng. 2014, 19, 202–214. [Google Scholar] [CrossRef]
  21. Cui, X.; Bustion, A.M.M.; Bustion, R.M. Measurements of gas permeability and diffusivity of tight reservoir rocks: Different approaches and their applications. Geofluids 2009, 9, 208–223. [Google Scholar] [CrossRef]
  22. Civan, F.; Rai, C.S.; Sondergeld, C.H. Shale permeability determined by simultaneous analysis of multiple pressure-pulse measurements obtained under different conditions. In Proceedings of the North American Unconventional Gas Conference and Exhibition, The Woodlands, TX, USA, 14–16 June 2011. [Google Scholar] [CrossRef]
  23. Anbarci, K.; Ertekin, T. A comprehensive study of pressure transient analysis with sorption phenomena for single-phase gas flow in coal seams. In Proceedings of the SPE Annual Technical Conference and Exhibition, New Orleans, LA, USA, 23–26 September 1990. [Google Scholar] [CrossRef]
  24. Kolesar, J.E.; Ertekin, T.; Obut, S.T. The unsteady-state nature of sorption and diffusion phenomena in the micropore structure of coal: Part 1-theroy and mathematical formulation. SPE Form. Eval. 1990, 5, 81–97. [Google Scholar] [CrossRef]
  25. Yuan, W.; Pan, Z.; Li, X.; Yang, Y.; Zhao, C.; Connell, L.D.; Li, S.; He, J. Experimental study and modelling of methane adsorption and diffusion in shale. Fuel 2014, 117, 509–519. [Google Scholar] [CrossRef]
  26. Jia, B.; Tsau, J.S.; Barati, R. Evaluation of core heterogeneity effect on pulse-decay experiment. In Proceedings of the International Symposium of the Society of Core Analysts, Vienna, Austria, 27 August–1 September 2017. [Google Scholar]
  27. Jia, B.; Tsau, J.S.; Barati, R. Experimental and numerical investigations of permeability in heterogeneous fractured tight porous media. J. Nat. Gas Sci. Eng. 2018, 58, 216–233. [Google Scholar] [CrossRef]
  28. Han, G.; Sun, L.; Liu, Y.; Zhou, S. Analysis method of pulse decay tests for dual-porosity cores. J. Nat. Gas Sci. Eng. 2018, 59, 274–286. [Google Scholar] [CrossRef]
  29. Haydel, J.J.; Kobayashi, R. Adsorption equilibria in the Methane-Propane-Silica gel system at high pressures. Ind. Eng. Chem. Fundam. 1967, 6, 546–554. [Google Scholar] [CrossRef]
  30. Ding, D.Y.; Farah, N.; Bourbiaux, B.; Wu, Y.S.; Mestiri, I. Simulation of matrix/fracture interaction in low-permeability fractured unconventional reservoirs. SPE J. 2018, 23, 1–389. [Google Scholar] [CrossRef]
  31. Noetinger, B.; Estebenet, T.; Landereau, P. A direct determination of the transient exchange term of fractured media using a continuous time random walk method. Transp. Porous Media 2001, 44, 539–557. [Google Scholar] [CrossRef]
Figure 1. Schematic diagram for the arrangement of pulse decay tests.
Energies 12 02562 g001
Figure 2. The influence of the testing pressure on the pseudo-pressure curves of the equilibrium sorption model. (a) Old dimensionless definition. (b) New dimensionless definition.
Energies 12 02562 g002
Figure 3. The influence of the Langmuir volume on the pseudo-pressure curves of the equilibrium sorption model. (a) Old dimensionless definition. (b) New dimensionless definition.
Energies 12 02562 g003
Figure 4. The influence of the Langmuir pressure on the pseudo-pressure curves of the equilibrium sorption model. (a) Old dimensionless definition. (b) New dimensionless definition.
Energies 12 02562 g004
Figure 5. The comparison of the curves of the equilibrium sorption and the non-equilibrium sorption models.
Energies 12 02562 g005
Figure 6. The influence of the fracture porosity on the curve of the non-equilibrium sorption model.
Energies 12 02562 g006
Figure 7. The influence of the testing pressure on the curve of the non-equilibrium sorption model.
Energies 12 02562 g007
Figure 8. The influence of the Langmuir pressures on the pseudo-pressure the non-equilibrium sorption.
Energies 12 02562 g008
Figure 9. The influence of the Langmuir pressure on the pseudo-pressure curves of the non-equilibrium sorption model.
Energies 12 02562 g009
Figure 10. The influences of the vessel volumes on the pseudo-pressure curves.
Energies 12 02562 g010
Figure 11. The influence of pL on the total compressibility.
Energies 12 02562 g011
Figure 12. The influence of VL on the total compressibility.
Energies 12 02562 g012
Figure 13. The influence of pL on the tested permeability.
Energies 12 02562 g013
Figure 14. The influence of VL on the tested permeability.
Energies 12 02562 g014
Figure 15. The influence of vessel volumes on the tested permeability.
Energies 12 02562 g015
Figure 16. The influence of porosity on the tested permeability.
Energies 12 02562 g016
Figure 17. The pseudo-pressure derivative at the early stage.
Energies 12 02562 g017
Figure 18. The pseudo-pressure derivative at the late stage.
Energies 12 02562 g018
Figure 19. The influence of VL on the pseudo-pressure derivative curves at the late stage.
Energies 12 02562 g019
Figure 20. Comparisons between the simulation results and the experiment of Barnett 26-Ha. (a) Pressure histories of N2. (b) Pressure derivative histories of N2. (c) Pressure histories of CH4. (d) Pressure derivative histories of CH4. (Experimental data from Aljamaan et al. [16])
Energies 12 02562 g020