Abstract
This paper reports an experimental investigation into the effects of fuel composition on the exhaust emission of toxic polycyclic aromatic hydrocarbons (PAHs) from a diesel engine, operated at both constant fuel injection and constant fuel ignition modes. The paper quantifies the US EPA (United State Environmental Protection Agency) 16 priority PAHs produced from combustion of fossil diesel fuel and several model fuel blends of n-heptane, toluene and methyl decanoate in a single-cylinder diesel research engine based on a commercial light duty automotive engine. It was found that the level of total PAHs emitted by the various fuel blends decreased with increasing fuel ignition delay and premixed burn fraction, however, where the ignition delay of a fuel blend was decreased with use of an ignition improving additive the level of particulate phase PAH also decreased. Increasing the level of toluene present in the fuel blends decreased levels of low toxicity of two to four ring PAH, while displacing n-heptane with methyl decanoate increased particulate phase adsorbed PAH. Overall, the composition of the fuels investigated was found to have more influence on the concentration of exhaust PAHs formed than that of combustion characteristics, including ignition delay, peak heat release rate and the extent of the premixed burn fractions.
1. Introduction
While diesel engines continue to be used due to their fuel economy and potential for high power output, they still suffer from high level of NOx and particulate emissions [1,2,3]. Even though the advent of EURO 6 emission legislation has so far aided the reduction of NOx and particulate levels via the incorporation of diesel particulate filters (DPF) and other exhaust after treatment systems in diesel engines, particulate emissions are still of great concern in terms of health effects [4,5,6]. The health effect of diesel particulates is principally owing to the polycyclic aromatic hydrocarbons (PAHs) associated with them.
Concurrent with greater awareness of the need to address the adverse impacts of diesel exhaust emissions on urban air quality and public health, is the continuing need to reduce greenhouse gas emissions from the transport sector [7]. In addition to improvements to both vehicle and powertrain efficiency, the use of renewable fuels for transport is now mandated by legislation in many countries; for example, the recently updated Renewable Energy Directive sets a new minimum of 14% average renewable fuels for road transport in all EU member states [8]. While this presents an opportunity to increase the range of biofuels utilized in transport, for example biogas from anaerobic digestions of organic wastes [9], biodiesel (fatty acid esters of vegetable and animal oils [10]) continues to be most commonly utilized for the displacement of fossil diesel. While biodiesels from a wide variety of possible renewable oil feedstocks have been considered [11,12,13,14], all differ from the components of fossil diesel in the oxygen content of the ester functional group.
PAHs are not directly regulated by diesel emissions regulations and are known to be human carcinogens [3,15]. They are precursors to soot particle formation and abundant in atmospheric aerosols [16]. Coarse soot particles of diameters (Dp) > 1 µm could potentially be deposited in the superior respiratory airways, while inhalable particles at sub-micron levels, bearing carcinogenic-PAHs, could reach into the human lung pulmonary alveoli causing various health complications [17].
PAHs can be found as constituents of fossil fuels (petro-genic PAHs) [18,19] and can also be generated during combustion (pyrogenic PAHs) [20,21]. Evidence has long been available on the survival of petro-genic PAHs during combustion and their tendency of being carried over to the engine exhaust [1,2,22]. This mostly happens to fossil fuels such as diesel which contains significant proportions of aromatic compounds, including PAHs. In the case of pyrogenic PAHs, they can be formed from a wide range of molecules in diesel fuel and their formation involves a complex series of reactions. These often begin with the formation of the first aromatic ring as a result of fuel breakdown and culminate in the formation of fused aromatic ring structures and PAHs through various reaction pathways [23,24]. Emission quantity of pyrogenic PAHs depend on the engine operating conditions [6,25] and the type of fuel used [17,26].
Fossil fuels with high poly-aromatic content have been reported to promote PAH formation [18,27]. However, no definitive conclusions have been reached, yet, regarding the effect of fuel mono-aromatic content on the formation of PAHs. There are divergent views in the literature on the effect of total aromatic content of fuels on PAH emissions, as outlined below.
Barbella et al. [28] investigated the effect of fuel aromatic content on PAH and soot emissions from a single cylinder direct injection diesel engine fueled with n-tetradecane, a mixture of 70% n-tetradecane + 30% toluene, and two diesel fuel oils of dissimilar aromatic contents. They observed that the concentration of the exhaust PAHs was dependent on the composition of the fuel tested. Barbella et al. also found higher PAH mass from combusting 70% n-tetradecane + 30% toluene as compared to combusting pure n-tetradecane. Diesel fuel oils produced the highest concentration of PAHs among all the fuels tested, and most of these PAHs were believed to have emanated from the unburned PAHs in the diesel fuel oils.
Mi et al. [27] studied the effect of total aromatic and poly-aromatic contents of fuels on the exhaust PAH emission from a heavy-duty diesel engine under steady state conditions. They added 10% of single ring toluene and 5% of the three ring PAH fluorene (by volume basis) to a base diesel fuel. The proportions of toluene and fluorene in the diesel blend represented mono-aromatic and poly-aromatic hydrocarbons respectively. Mi et al. reported that adding PAH fluorene to the diesel fuel increased the emission of total PAHs as well as the PAH fluorene itself. However, no significant change in PAH emission was observed by the authors when adding toluene to the diesel fuel. Borrás et al. [6] investigated PAH emissions from different reformulated diesel fuels in a light duty diesel engine. Their results showed that adding 5%–25% of mono-aromatics to low sulphur diesel and reference diesel fuels had no considerable effect on the exhaust PAH concentrations when compared with the concentration of exhaust PAHs from combusting pure reference diesel. However, the biodiesel rape oil methyl ester produced a greater range of PAHs but at considerably lower concentrations (~50% lower) than the PAHs in the reformulated diesel.
Research published in the literature leads to the conclusion that the poly-aromatic content of fuels has a greater effect on the exhaust PAHs than the mono-aromatics, but the extent to which the mono-aromatic content in the fuel affects PAH formation is not fully established. It is still not clear from the literature whether the mono-aromatics in the fuel influences the Group B2 PAHs (PAHs that are possible human carcinogens). Influence of combustion characteristics such as ignition delay (ID) and premixed burn fraction on the total PAH concentrations has not been studied in detail. Effect of ignition improver, which alters the combustible mixture ignition delay, on the concentrations of gas phase and particulate phase PAHs has not been investigated. The correlation between the soot particle sizes with the PAHs attached onto the soot particles has been rarely studied.
This paper reports an investigation into the influence of fuel composition and combustion characteristics (ignition delay, premixed burn fraction and heat release rate) on the exhaust emission of toxic PAHs from a compression ignition engine. Binary and ternary fuel mixtures of n-heptane, toluene and methyl decanoate were tested so as to investigate the effects of fuel aromatic and fatty acid ester content. The paper focuses on the US EPA 16 priority PAHs shown in Table 1, but attention was given to the Group B2 PAHs (PAHs with high toxicities). Influences of ignition delay, premixed burn fractions and heat rates on the exhaust PAHs were analyzed. Comparative effects of these combustion characteristics with those of composition of the fuels were discussed. The effect of adding ignition improver to the fuels on both exhaust gas-borne as well as particulate borne PAHs were reported.

Table 1.
List of 16 priority polycyclic aromatic hydrocarbons (PAHs) and their carcinogenic groups as classified by US EPA (1993). Group B2 are ‘possibly carcinogenic to humans’ while Group D are ‘unclassifiable as to carcinogenicity’ NA—Not available.
2. Experimental Approach
2.1. Test Fuels
The test fuels included reference fossil diesel (Halter-mann Carless Ltd, UK), heptane, toluene and methyl-decanoate (Sigma Aldrich, UK). The fossil diesel fuel had 22.2% total aromatics and 3.4% by mass of poly-aromatic contents. Table 2 shows the properties of the test fuels. In view of the complex composition of the fossil diesel fuel, heptane was also used for comparison of the results with fossil diesel fuel. Heptane has a cetane number close to that of the diesel fuel (see Table 2) and there is a significant body of information in the literature on PAH chemistry for heptane as well as for toluene [27,29]. Aromatics constitute a substantial proportion of commercial diesel fuel and toluene is a model to several of these aromatics; therefore, heptane/toluene blends have been recommended as convenient model fuels for compression ignition engines [30,31]. Methyl decanoate was chosen as a fatty acid methyl ester frequently studied as a surrogate for biodiesel. Qualitative PAH analysis of the diesel fuel and lubricating oil (Castrol Magnetic, SAE 10W-40) used in this work was carried-out using GC-MS (Gas Chromatography- Mass Spectrometry) prior to the analysis of the pyrogenic exhaust PAHs. Two PAHs (naphthalene and fluorene) were identified in the diesel fuel but no PAH was found in the fresh and used lubricating oil.
Table 2.
Properties of test fuels. Point of 50% (v/v) recovery obtained according ASTM D86 [32,33,34].
2.2. Experimental Layout and Conditions
Mixtures of single/binary/tertiary fuels were formulated by blending toluene and methyl-decanoate into heptane. The proportions of toluene and methyl-decanoate (on volume basis) added to heptane are shown in Table 3. The highest proportion of toluene added to the fuel mixtures was 22.5% and is similar to the percentage of mono-aromatics found in commercial diesel fuel [18]. Methyl decanoate was added to at a level of 20% vol/vol to a blend of 65% vol/vol n-heptane and 15% vol/vol toluene, intended to be representative of the highest level biodiesel and fossil diesel levels currently under consideration for commercial implementation. Fuel mixtures were combusted in the diesel engine and their ignition delays were noted. For all tests, the duration of ignition delay was taken as the period between the start of fuel injection and the first appearance of positive apparent net heat release rate. To assess the influence of ignition delay on exhaust PAHs, equalization of ignition delay durations for different blends was achieved by applying a given amount (in ppm) of an ignition improving additive (2-ethylhexylnitrate—2-EHN) to the fuel mixtures. The ignition improver was added at ppm levels in order not to change the bulk fuel composition. For example, it can be seen from Table 3 that 850 and 1500 ppm of 2-EHN were added to 77.5%H22.5%T to reach ignition delays of 9.8 and 9.4 Crank Angle Degrees (CAD) respectively. The equalized ignition delays only differed by approximately the resolution of the engine shaft encoder (0.2 CAD). The necessary dosages of the ignition improver that was added to the heptane/toluene mixtures to equalize ignition delay were found using an iterative procedure.
Table 3.
Fuel blend composition and experimental matrix for the test fuels run in a compression ignition engine at a constant indicated mean effective pressure (IMEP) of 7 bar and a fixed speed of 1200 rpm.
Two sets of experiments were conducted at a constant indicated mean effective pressure (IMEP) of 7 bar, a fixed engine speed of 1200 rpm and a constant fuel injection pressure of 450 bar:
- Constant injection timing tests were conducted on the engine with start of fuel injection at 10 crank-angle-degrees (CAD) before-top-dead-centre (BTDC).
- Constant ignition timing tests were conducted by maintaining the 10° CAD BTDC injection timing while also adding 2-EHN to the fuels to equalize the ignition delays.
The molecular structures of the fuels shown in Table 1 and the experimental conditions outlined in Table 3 allowed the following objectives to be achieved:
- Characterize the particulates produced from the combustion of the fuel mixtures in terms of mass, number and size using a DMS 500 instrument.
- Highlight the PAH distributions of fuel mixtures in (i) from the diesel engine and understand the influence of combustion characteristics of the fuels on PAH emissions.
- Determine the effect of ignition improver on the concentrations of gas phase and particulate phase PAHs.
- Assess the influence of ignition delays and premixed burn fraction on the total PAH concentrations.
2.3. Experimental Set-Up
The tests reported in this paper were conducted on a single cylinder, 4-stroke, compression-ignition engine. The schematic of the engine assembly is shown in Figure 1. Table 4 lists the specifications for the engine assembly. The cylinder head (including intake and exhaust valves), piston and connecting road, were taken from a 2.0 liter four-cylinder Ford Duratorq donor engine (a direct injection diesel engine utilized extensively in EURO IV compliant applications) and were mounted on a single cylinder Ricardo Hydra crankcase. The in-cylinder gas pressure was measured to a resolution of 0.2 CAD using a Kistler 6056A piezoelectric pressure transducer in conjunction with a Kistler 5018 charge amplifier, 1800 pulse per revolution (ppr) shaft encoder and a digital data acquisition system.
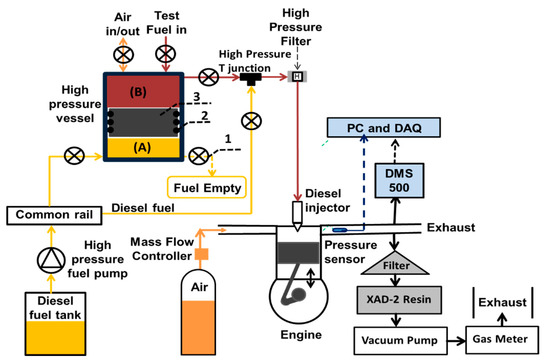
Figure 1.
Schematics of the engine sampling system: (1) high pressure needle valve (2) O-ring (3) free moving piston.
Table 4.
Engine specification.
The experimental set-up consisted of an existing special low volume, high pressure, fuel system which was used to deliver test fuels to the fuel injector at a common rail injection pressure previously described by Talibi et al. [35]. The fuel system facilitated the direct injection of the test fuels, which had low lubricity. Without the use of this low volume system, lubricity additives would have been required to avoid damage to the conventional common rail fuel circuit. Similarly, the use of this custom-made system, which required only low fuel volumes, reduced the cost of the fuel tests. Figure 1 shows the fuel system which consists of a stainless-steel vessel with capped ends and a free moving piston (3) with circumferential O-rings (2). The circumferential O-rings divided the high-pressure fuel vessel into two chambers (A and B). Chamber ‘A’ contained diesel fuel, while ‘B’ contained the test fuel.
A conventional diesel fuel system was used as a hydraulic system to deliver pressurized diesel fuel to chamber A of the fuel vessel. The pressurized diesel fuel acted as a hydraulic fluid which created pressure in the test fuel via the moveable free piston, as shown in Figure 1. The O-rings (2), installed circumferentially on the surface of the piston, ensured that there was no mixing of test fuel and the diesel fuel. The diesel fuel was pressurized to a precise level using the Emtronix EC-GEN 500 engine control system (ECU) and the free moving piston always communicated this pressure to the test fuel. A high-pressure filter was installed between the fuel vessel and the fuel injector to prevent any damage to the injector by potential debris in the test fuel. High pressure needle valves (1) were used to switch between the fossil diesel fuel and the test-fuels, with the diesel fuel providing baseline data and also used for flushing the fuel line and injector.
Pressures and temperatures were monitored in real-time and logged onto PCs using National Instruments (NI) data acquisition systems (DAQ). A NI LabVIEW program, developed in-house, evaluated the real-time in-cylinder pressure data to determine the net apparent heat release rates and IMEP. A Delphi DFI 1.3 six-hole, servo-hydraulic solenoid valve fuel injector was used to inject the liquid test and diesel fuels directly into the combustion chamber. The Emtronix engine control system was used to control the injection pressure, injection timing and duration of injection. The intake air flow rate was measured using a Romet G65 positive displacement volumetric air flow meter.
2.4. Generation and Sampling of Particulate and Gas Phase PAHs
Particulates and gas phase PAHs generated within the engine cylinder were sampled from the engine exhaust. Particulates phase (PP) and gas phase (GP) PAHs were sampled about 1000 mm downstream of the engine exhaust by means of a 12 mm diameter stainless steel tube connected to a vacuum pump, which provided a flow rate of 40 L/min through a particulate and gaseous PAH collection system (see Figure 1). To avoid condensation of gas phase PAHs and water vapor during sampling, the sampling probe was thermally insulated. The temperature of the soot sampling stainless steel probe that led to the filter housing was measured by K-type thermocouple and was always found be > 100 °C. Particulate filters and XAD-2 resin were employed in series, as previously used in a tube reactor reported in Dandajeh et al. [36], to collect the particulate and gaseous PAHs respectively. The cumulative volume of gas (Vg) that passed through the particulate filter and the XAD-2 resin was measured, at each test condition, using a volumetric gas meter (Bell flow Systems UK). The meter was at atmospheric pressure and temperature which were also monitored, allowing calculation of gas volume at STP (Standard Temperature and Pressure).
The particulate samples were collected on a glass micro fiber filter (70 mm diameter and 0.7 µm pore size) (Fisher Scientific UK). Before sampling, the filter was dried in a desiccator for 12 h and weighed using a high precision mass balance (± 0.001 mg). After sampling, the filter was re-dried in the desiccator for the same duration and re-weighed. The particulate mass collected on the filter (Ms) was recorded. The gravimetric filter mass measurements (Ms, mg) from the engine exhaust and calculated soot mass concentration (Ms/Vg, mg/ m3) of all the fuels tested are shown in Table 5 and Table 6, where Vg (m3) is the cumulative volume of gas that passed through the particulate and resin measured at each test condition using the cumulative volumetric gas meter. To avoid deterioration of the filter in the high temperature pulsating flow of the engine exhaust, the filter was supported by sandwiching it between two stainless steel wire meshes (0.026 mm aperture, 0.025 mm wire diameter) (The Mesh Company, UK), which were cut to the same diameter as the filter.
Table 5.
Filter soot mass measurements without 2-EHN ignition improver.
Table 6.
Filter soot mass measurements with 2-EHN ignition improver.
Particulates in the diesel engine exhaust were characterized at sub-micron levels using a fast differential mobility spectrometer (Cambustion DMS-500). The DMS-500 was used to determine real time outputs of the size, mass and number distributions of particulates in the range of 5–1000 nm. The exhaust gas was sampled about 300 mm downstream of the engine exhaust valves and conveyed to the particulate analyzer (DMS500) via a heated line maintained at 80 °C. Table 5 and Table 6 show the summary of the soot particle mean diameter and particle surface area as measured by the DMS 500 instrument. Engine test and subsequent PAH analysis for each test fuel was repeated twice and the average value of the test values is reported in this paper. A reference fossil diesel fuel was tested at the start and end of each daily test. These repeats produced a record of daily variabilities in engine performance and instrumentation as well as provision of baseline data for comparison with the results of the fuel blends. The cumulative standard deviations (δ) of the parameters investigated were thus generated from results of the daily fossil diesel fuel repeats.
2.5. Sample Preparation/GC-MS Analysis
The sample preparation (sample extraction and solvent evaporation) and GC-MS analysis has been described in detail previously in Dandajeh et al. [36,37]. The extraction of the PAHs from the soot particles and XAD-2 resin samples was carried out using accelerated solvent extraction (ASE) in dichloromethane as a solvent. The solvent was evaporated by bubbling nitrogen stream into the PAH extracts. The PAHs from the extracts were then identified using gas chromatography (GC) and thereafter analyzed using mass spectrometry (MS).
3. Results and Discussion
3.1. Soot Formation Characteristics at Constant Injection and Ignition Timings
The profiles of soot particle number concentrations for the test fuels, sampled using the DMS500 particle spectrometer are shown in Figure 2. Figure 2a,b presents the distributions of soot particle number concentrations for the fuels without and with 2-EHN, respectively. Figure 2a shows that the soot particle sizes for all the fuels ranged from 30 to 360 nm without 2-EHN and, similarly, the range was 13–316 nm when 2-EHN was added to the fuel blends.
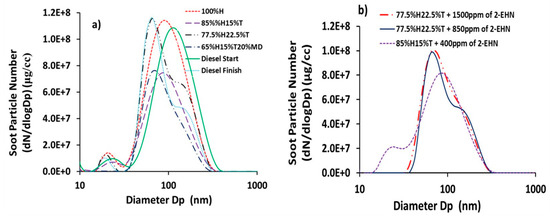
Figure 2.
Distribution of soot particle number concentrations (dN/dLogDp (cm−3)) for the fuel blends and reference diesel fuel (a) without 2-ethylhexylnitrate (2-EHN) (b) with 2-EHN.
The mean soot particle size and the soot volume-normalized surface area (µm2/cm3) of each test fuel without and with 2-EHN are also shown Table 5 and Table 6 respectively.
It is apparent from Table 5 that toluene addition to heptane slightly increased the mean size of the soot particles generated; from 176 nm for 100%H to 178 and 181 nm for 85%H15%T and 77.5%H22.5%T, respectively. The correlation coefficient (r) for the percentage of toluene addition as a function of soot particle mean size was high (r = 0.95), which suggests a strong statistical relationship. Increasing soot mean particle sizes subsequent to toluene addition to heptane was also reported by Wei et al. [31] for in-cylinder soot generated from toluene/n-heptane combustion in a diesel engine. Table 5 also shows the gravimetric filter measurements of soot masses (Ms) and calculated soot concentrations (Ms/Vg) of the test fuels as sampled from the engine exhaust. Vg is the cumulative volume of gas that passed through the particulate filter and the XAD-2 resin in series. It is pertinent to note here that the trend of the soot mass concentration based on the gravimetric filter soot mass measurements is consistent with the trend of soot mass concentration measured using the DMS 500 instrument.
Table 5 shows that the soot mass concentration of heptane/toluene blend increased from 40 to 45 mg/m3 when the proportion of toluene in heptane was increased from 15% to 22.5%. The soot concentration of 48 mg/m3 for 100%H was unexpectedly high and should be interpreted with caution. Table 5 shows a drastic reduction in soot concentration by 66%, mean particle size by 10% and soot surface area by 35%, when the 20% (by volume) of a C7 heptane in 85%H15%T blend was replaced with 20% (by volume) of a C11 methyl-deconoate (an ester molecule). This result was as expected since oxygenated fuels, such as alcohols and esters, were reported to have substantially lower particulate emissions when burned in internal combustion engines, compared with their alkanes/aromatic counterparts [38,39].
Generally, pyrolysis of n-heptane leads to generation of large quantities of C2-C6 species such as acetylene and propargyl radicals which are highly instrumental in the formation of the first aromatic ring [15,40] and subsequent PAH/soot surface growth. Additional support for this finding comes from the study of Alexiou and Williams [41] using reflected shock-tube pyrolysis, who reported a decrease in the sooting propensity of toluene, when heptane was blended into it. Toluene is a prolific soot producer owing to its nucleation rate increasing exponentially with temperature [42]. In diffusion flames, Ladommatos et al. [43] reported the soot propensity of toluene being substantially higher than heptane, with toluene having a threshold sooting index of 18.5 times higher than that of heptane.
Table 6 shows that adding 2-EHN to the heptane/toluene fuel blend decreased the mean soot particle diameter, soot surface area and, surprisingly, soot mass concentration. The decreasing trend of soot concentration after adding ignition improver is contrary to what was reported in earlier works [43,44]. This was partly because the experimental conditions employed in this work were different from those of Kidoguchi et al. [44] and Ladommatos et al. [45], who reported an increase in soot mass concentration when ignition improver was added to the fuel.
3.2. PAH Distributions from Diesel Engine Exhaust at Constant Injection Timing
This section focuses on the analysis of the EPA 16 priority PAHs collected from the diesel engine exhaust at constant fuel injection timing of 10 CAD before top dead centre (BTDC), speed of 1200 rpm and load of 7 bar. Figure 3 shows the distributions of exhaust PAHs following combustion of the fuels studied. Measured PAHs in the exhaust included both those in the gaseous phase as well as those on the particulate surfaces. The gaseous PAHs shown in Figure 3, were those extracted from the XAD-2 resin, and are designated as gas phase (GP) PAHs, whereas those PAHs extracted from the soot particles are designated as particle phase (PP) PAHs.
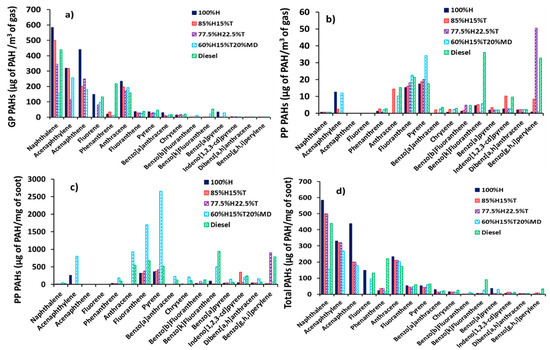
Figure 3.
The distributions of exhaust PAHs in diesel engine: (a) Gas Phase (GP, µg of PAH/m3 of gas), (b) Particle Phase (PP, µg of PAH/m3 of gas), (c) Particle Phase (ng of PAH/mg of soot) and (d) total PAHs (GP + PP, µg of PAH/m3 of gas).
The mass of gas phase PAHs was normalized with the volume of gas (Vg) passed through both the filter and the XAD-2 resin (positioned in series with the filter) and is shown in Figure 3a. The mass of PAH extracted from the soot particles was also normalized with volume of gas (Vg) passed through the filter and the XAD-2 resin and is shown in Figure 3b. Figure 3c shows the PAH mass extracted from the soot particles but this time normalized with the soot particle mass (Ms) (see Table 5). Lastly, Figure 3d shows the total PAH (sum of gas and particle phase) and this was normalized by the volume of gas (Vg) passed through the filter and the XAD-2 resin.
In Figure 3a, the most abundant exhaust PAHs found in the gas phase (GP) had two and three rings, irrespective of the fuel combusted. These PAHs included NPH, ACY, ACN, FLU, PHN and ATR. It is interesting to note the six most abundant PAHs listed above are group D members and, therefore considered to be non-mutagenic. The total sum of these six PAHs in the GP accounted for the bulk of the total PAHs in the case of all the fuels. For example, 91% in the case of the fuel 100%H, 94% in the case of the fuel 85%H15%T, 91% in the case of the fuel 77.5%H22.5%T, 80% in the case of the fuel 65%H15%T20%MD and 83% in the case of the fossil diesel fuel. These results of high proportions of the six PAHs (NPH, ACY, ACN, FLU, PHN and ATR) are consistent with those observed by He et al. [46] in a diesel engine fueled with biodiesel and diesel.
It is interesting to note that in Figure 3a, only four heavier PAHs having four and five rings (CRY, B(b)F, B(k)F and B(a)P) were detected in the GP in low concentrations, and these four PAHs are highly mutagenic (Group B2 members). It can be further observed in Figure 3a that the GP PAH concentrations decreased to near-zero when the number of PAH rings increased from five to six regardless of the fuel investigated. The observation of decreasing PAH concentrations in the GP with increasing molecular weight of the PAHs (increasing number rings) resembled those observed by Dandajeh et al. [37] in a tube reactor at a temperature of 1050 °C and under oxygen free pyrolysis conditions.
Figure 3b shows that the six smaller PAHs with two to three rings (NPH, ACY, ACN, FLU, PHN and ATR) detected earlier in the gas phase at high concentrations (see Figure 3a) were now identified in the particle phase at very low concentrations (lower by several orders of magnitude). These results suggest that the six lighter PAHs might have been consumed in the growth of larger PAHs and subsequently formed soot. Conversely, Figure 3b shows that the concentrations of PP PAHs increased with increasing molecular weight of the PAH regardless of the fuel combusted. This result also matched with observations in tube reactors in [36,47].
Figure 3c presents the concentration of PAHs adsorbed on the soot particles per unit mass of soot. It can be seen from Figure 3c that the PP PAH mass increased with increasing proportions of toluene added to heptane. This result can be anticipated since adding toluene to heptane could create more PAH formation routes which aid PAH growth. The trend in Figure 3c further exhibits a substantial increase in the PAH mass produced from diesel fuel combustion.
Abundance of PAHs produced from diesel combustion is not surprising, since the fossil diesel used in this work had up to 3.4% PAHs (including NPH, FLU and other alkylated PAHs). It is likely that the PAHs in the diesel fuel contributed to the pyrogenically formed exhaust PAHs. Some evidence to support this suggestion is the fact that the total NPH and FLU concentrations out of the total PAHs identified from diesel fuel combustion were unusually high; 34% in the case of NPH and 10% in the case of FLU. The implication of the above findings could be that some of the naphthalene and fluorene originally present in the fossil diesel could have survived combustion. Several studies have highlighted the possibility of petrogenic PAHs in a fuel surviving combustion. For example, Rhead and Pemberton [48] observed that 23.8% of the NPH detected in the exhaust of a direct injection diesel engine originated from the fuel combusted. Similarly, Tancell et al. [2] also reported high PAH survival rates of FLU (0.87%) and NPH (0.47%); and the survival rate of each PAH was found to proportionally increase with the energy level of the lowest un-occupied molecular orbital.
The concentrations of total PAH per unit volume of gas is shown in Figure 3d, and the figure corresponds to the sum of the gas phase PAHs in Figure 3a and the particle phase PAHs in Figure 3b. It can be seen from Figure 3d that the trend of the total PAH mass resembles to a significant extent, those of the GP PAHs in Figure 3a regardless of the fuel tested. It is also apparent from Figure 3d that the six PAHs (NPH, ACY, ACN, FLU, PHN and ATR), which were most abundant in the gas phase, also dominated the total PAH distribution. Four out of these six PAHs (NPH, FLU, PHN and ATR) constituted over 75% of the PAHs identified in the diesel combustion and, interestingly, this finding corresponds with those observed by Jin et al. [49] who reported that 50% to 92% of the exhaust PAHs of a heavy-duty diesel engine had two to three rings. The observation that two to three ring PAHs dominated the exhaust PAHs is also in agreement with the findings reported by Wang et al. [50], who researched in-cylinder and exhaust PAHs in a diesel engine fueled with heptane and heptane/toluene blends.
3.3. Total PAH Analysis at Constant Injection Timing
Figure 4 shows the total PAHs obtained by summing up all the EPA 16 priority PAHs produced for each fuel. The error bars denote standard deviations. Figure 4a shows the concentrations of total GP PAHs. It can be seen from the figure that the GP PAH mass for the 100%H was 1906 µg/m3. The PAH mass concentration decreased linearly to 1336 and 1067 µg/m3 when 15% and 22.5% of toluene were, respectively, blended into heptane.
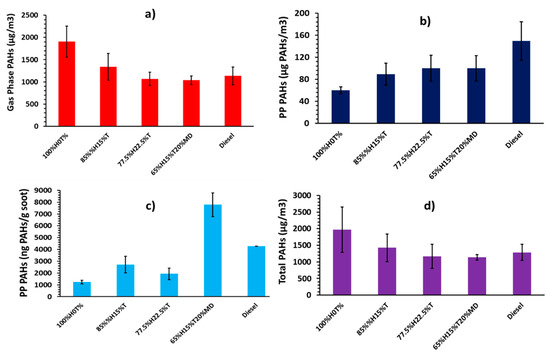
Figure 4.
Normalized total PAH concentrations in diesel engine: (a) Gas Phase (μg of PAH/m3 of gas), (b) Particle Phase (μg of PAH/m3 of gas), (c) Particle Phase (ng of PAH/ mg of soot) and (d) total PAH (μg of PAH/m3 of gas).
The total PP PAHs in Figure 3b shows increasing PP PAH concentrations with increasing proportion of toluene added into heptane. A comparison between Figure 4a,b suggest that toluene addition suppresses the formation of exhaust gaseous PAHs, and at the same time promotes the PAH to proceeding onto particulate. In order words, the GP PAHs were more rapidly consumed and converted to soot, following toluene addition to heptane. For example, the PP PAH concentration was 60 µg/m3 in the case of 100%H, and it later increased by 48% and 67% respectively, when 15% and 22.5% of toluene were respectively blended into heptane.
One unanticipated finding that emerged in Figure 4a,b is that the fuel blends of 77.5%H22.5%T and 65%H15%T20%MD exhibited roughly similar concentrations of GP and PP PAHs on volume of gas basis, considering the standard deviations. It is difficult to explain these results, but it might be related to the resulting opposing effects of both increasing the alkyl chain length from seven to 10 when displacing heptane with methyl decanoate in the heptane/toluene blend while also introducing oxygen to the fuel blend.
The particle phase PAH mass from diesel fuel combustion shown in Figure 4b was found to be higher than those from 100%H and in fact, this was the case for all the blends. The result for diesel PAH mass is consistent with observations from previous studies [28]. The propensity of the fossil diesel fuel used to form both soot and PP PAHs is believed to be attributable to the fossil diesel fuel having 22.2% total aromatic and 3.4% PAH content, which included several single ring aromatics (benzene and toluene) and alkylated PAHs (methyl-naphthalenes). The aromatics, originally from the diesel fuel, could have facilitated the formation of particle phase PAHs and soot, by serving as precursors to soot formation processes.
Comparing Figure 4b and Table 5, the particle phase PAH concentrations, regardless of the fuel combusted, are strongly positively correlated with the soot particle sizes onto which the PAHs were attached. Further comparison shows a negative correlation between the PP PAHs in Figure 4b and the soot surface area (µm2/cm3) (see Table 5) on to which the PAHs were deposited. These results suggest that more PP PAHs were present when particle surface area decreased, possibly due to decrease in soot mass concentration or an increase in mean particle diameter. Another possibility is that PAHs proceeded to soot rapidly, reducing their concentration in the gas phase for condensation onto soot particles.
Figure 4c shows the mass of PAHs (mostly group B2) extracted from the soot particles normalized with the mass of soot particles (see Table 5). The trends in the Figure 4c appear to correlate positively with those of peak in-cylinder pressures and peak heat release rates. However, this trend does not seem to apply in the case of 65%H15%T20%MD blend.
The total PAH concentrations shown in Figure 4d are the result of summing-up the GP and PP PAH concentrations. Comparing Figure 4a,b,d, suggests that the GP PAHs dominated the total PAHs in the diesel engine, regardless of the fuel combusted. For example, the proportion of GP PAHs generated during combustion of 100%H was 97%, while this proportion decreased to 94% and 91% when 15% and 22.5% of toluene were, respectively, blended into heptane, suggesting greater propensity of toluene towards PP PAHs. Combustion of fossil diesel generated only 88% of the GP PAHs. Similar proportions of GP PAHs were reported by He et al. [46] in a diesel engine fueled with diesel and biodiesel, as well as by Jin et al. [49] in a heavy duty diesel engine. Looking at Figure 4d, a clear decreasing trend of PAH concentrations can be seen with increasing proportions of toluene added to heptane. This result is in line with previous studies [50].
3.4. Effect of Ignition Delay and Premixed Phase on Total PAH Emissions
Figure 5a,b shows the variations of total PAHs with ignition delay and percentage premixed phase respectively. It is apparent from Figure 5a that increase in ignition delay due to corresponding increase in the proportion of toluene added to heptane was associated with decreased total PAH mass concentration. For example, the total PAH concentration for 100%H was 1966 µg/m3 and it decreased by 27% when the ignition delay was increased from 9.4 to 9.8 CAD in the case of 85%H15%T. This trend saw a further reduction by 41% in the total PAH emissions when the ignition delay was increased from 9.8 to 10.8 CAD in the case of 77.5%H22.5%T.
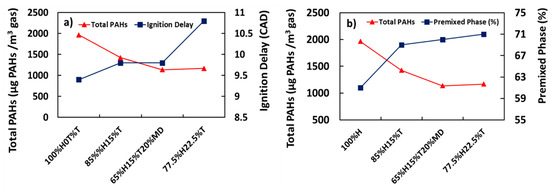
Figure 5.
Correlation of total PAH (µg PAH/m3 gas) with (a) ignition delay (Crank Angle Degrees, CAD) and (b) premixed phase (%).
The finding that the total PAH emission decreased with increasing ignition delay could be explained by the fact that the maximum average in-cylinder temperature was also observed to increase with increasing ignition delay [38]. This could be expected, since the total PAHs were reported to decrease with increasing temperatures [36,47]. Further extrapolation from these results would suggest that the relatively low in-cylinder temperature inhibits the consumption of PAHs. It is somewhat surprising that combusting 65%H15%T20%MD does not seem to affect the total PAH concentration significantly from those of 77.5%H22.5%T, even though the ignition delay was increased by 0.4 CAD.
In addition, also apparent from Figure 5b is the decreasing trend of total PAH concentration with increasing percentage of premixed phase. For example, it can be observed from Figure 5b that at lower premixed burnt fraction of 61% for example, combustion of 100%H produced the highest PAH mass, with the PAHs presumably made from significant concentration of free radicals generated via heptane pyrolysis at relatively low in-cylinder temperatures. As the proportion of the premixed phase increased and the diffusion phase decreased, it can be seen from Figure 5b that the total PAH concentration also decreased. This result matched those observed by Wang et al. [50]. Wang et al. reported a decrease in total in-cylinder PAH mass while the combustion mode shifted from premixed to diffusion and finally to late combustion phase, as crank angle progressed after TDC from 0 to 40 CAD.
Figure 6 presents the profiles of individual total concentrations of group D PAHs (PAHs with low toxicity factors) with percentage premixed phase. It can be seen from the figure that the concentration of the individual PAHs decreased with increasing percentage premixed burn fraction. Premixed phase is characterized by high temperature regime, where fuel and air react in a pre-mixed near-stoichiometric fuel air mixture [3]. Lower premixed percentage therefore signifies pockets of richer mixture and higher PAHs formed, since the concentration of PAH increases with increasing fuel concentration [51]. Closer inspection of Figure 6 shows progressive reduction in the PAH mass while increasing the number of PAH rings (from two to four rings) regardless of the premixed phase percentage.
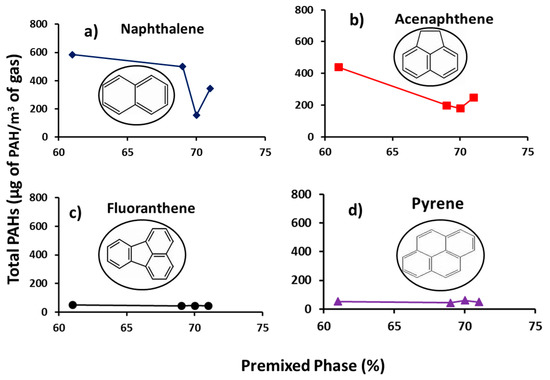
Figure 6.
Profiles of Group D individual total PAH (µg PAH/m3 gas) with premixed phase (%) (a) naphthalene, (b) acenaphthene, (c) fluoranthene and (d) pyrene.
Figure 7 shows the profiles of individual total concentrations of the group B2 PAHs (PAHs with high toxicity factors) with percentage premixed phase. The figure shows a decreasing trend of PAH mass with increasing percentage premixed phase, but at markedly lower concentrations (by a factor of 16) as compared with those in Figure 6 for group D PAHs. One striking feature of PAH concentrations at premixed phase of 70% is the low PAH mass in Figure 6 and comparatively higher PAH mass in Figure 7. This point is not likely to be an outlier, as it corresponds to a fuel blend with a slightly different molecular configuration due to addition of 20% methyl-decanoate to the heptane/toluene blend. The effects of the low and high PAHs concentrations at premixed phase of 70% in Figure 6 and Figure 7 respectively, were offset in the total PAH concentrations shown in Figure 5b.
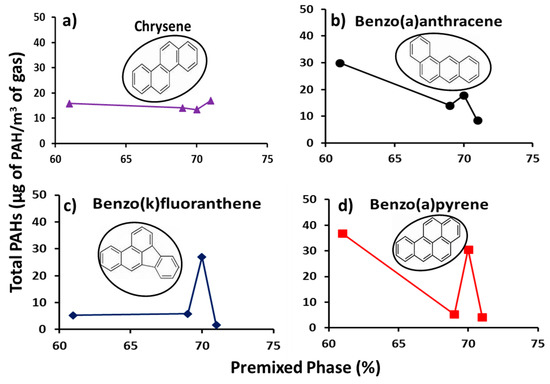
Figure 7.
Profiles of Group B2 individual total PAH (µg PAH/m3 gas) with premixed phase (%) (a) chrysene, (b) benzo(a)anthracene, (c) benzo(k)fluoranthene and (d) benzo(a)pyrene.
3.5. PAH Distribution at Constant Ignition Timing and Constant Ignition Delay
Figure 8 presents the total PAH distribution at constant ignition delay. Figure 8a,b shows the total PAH distribution at ignition delays of 9.4 and 9.8 CAD, respectively. It can be seen from the figure that equalizing the ignition delays for the heptane/toluene blends did not result in identical PAH concentrations as intuitively anticipated. Instead it reduced the mass of individual PAHs due to addition of ignition improving additive (2-EHN). For example, the total PAH concentration of naphthalene in Figure 3d for the 85%H15%T was 500 µg/m3 and it decreased by 20% in Figure 8a when 85%H15%T + 400 ppm of 2-EHN was combusted. A similar correlation applies to the naphthalene concentration of 77.5%H22.5%T fuel blend, as can be seen in Figure 3d.
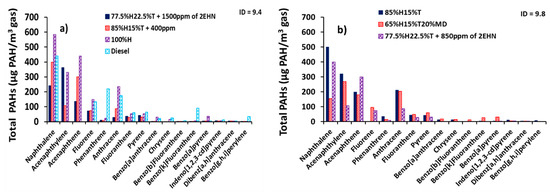
Figure 8.
Distributions of total exhaust PAHs (GP + PP) (µg of PAH/m3 of gas) at constant ignition delay (a) ignition delay (ID) = 9.4 CAD and (b) ID = 9.8 CAD.
Similarly, the total PAH concentration of naphthalene in Figure 6d for 77.5%H22.5%T was 500 µg/m3, and it decreased by 20% when 850 ppm of 2-EHN was added to 77.5%H22.5%T and 52% for when 1500 ppm of 2-EHN was added to 77.5%H22.5%T as shown in Figure 8a,b, respectively. Closer inspection of Figure 8a,b shows a decline in PAH concentration of most of the 16 PAHs due to addition of 2-EHN to fuel blends at both ignition delays of 9.4 and 9.8 CAD.
3.6. Total PAH Analysis at Constant Ignition Timing and Constant Ignition Delay
The total PAH concentration at constant ignition timing is shown in Figure 9 and was found by summing up all the EPA 16 priority PAHs at both gas and particulate phases. While Figure 8 shows reduction in concentration of the individual total PAH due to addition of 2-EHN, Figure 9 rather shows the cumulative reductions in PAH concentration after adding 2-EHN for each fuel.
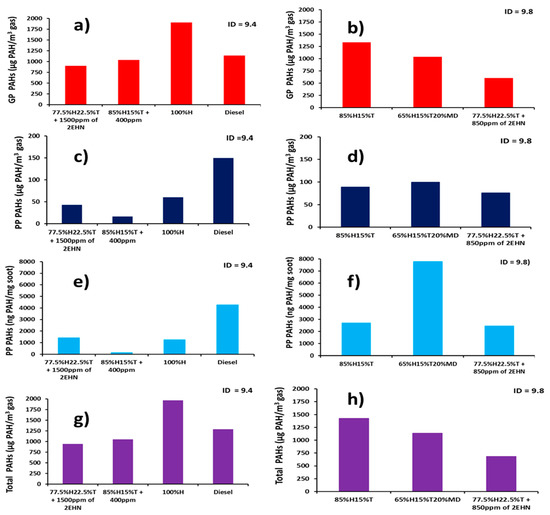
Figure 9.
Figure9. Normalized total PAH concentrations at constant ignition delays: (a) Gas Phase PAH at ID = 9.4, (b) Gas Phase PAH at ID = 9.8, (c) Particle Phase PAH at ID = 9.4, (d) Particle Phase PAH at ID = 9.8, (e) Particle Phase at ID = 9.4, (f) Particle Phase PAH at ID = 9.8, (g) total PAH at ID = 9.4 and (h) total PAH at ID = 9.8.
Comparing together Figure 9a–d, one can observe that adding 400 ppm of 2-EHN to 85%H15%T decreased the GP PAH concentration by 23% (Figure 9a,b) and the PP PAH concentration by 82% (Figure 9c,d). A similar observation can be seen when Figure 9e–h are compared. The PP PAH concentration on soot mass basis decreased by 95% (Figure 9e,f) while the total PAH concentration decreased by 26% (Figure 9g,h) when 400 ppm of 2-EHN was added to the 85%H15%T blend. The implication of this observation is that the addition of 2-EHN to the fuel blends results in early ignition reaction with high amount of energy liberated, and the PAHs associated with exhaust particulates and the gaseous species are considerably abated. However, it is interesting to note that addition of 2 EHN to any of the fuel blends appears, in most cases, to reduce PAH emissions, which could suggest a secondary effect on PAH formation. This is either through the presence of 2 EHN influencing, directly, the rates of PAH formation and growth reactions, or through the influence of 2 EHN on ignition delay.
Lastly, it can be observed when comparing Figure 5 and Figure 9 that, since equalizing, the ignition delays for the fuel blends did not result in identical PAH concentrations. It can be said, therefore, that fuel composition seems to have more influence on the propensity/identity of PAHs formed than the combustion characteristics such as ignition delay, heat release rates and premixed burnt fraction of the fuel.
4. Conclusions
The results presented for gas-phase and particle-phase PAHs generated from combustion of several fuel blends can be summarized as follows:
- Increasing toluene proportion in heptane/toluene mixture resulted in an increase in the mean soot particle sizes and decrease in overall soot surface area. An opposite decreasing trend of mean soot particle size and increasing soot surface area was observed when ignition improving additive was added to the heptane/toluene blend so as to keep ignition delay constant.
- The lower toxicity Group D PAHs (naphthalene, acenaphthylene, acenaphthene, fluorene, phenanthrene and anthracene) dominated the GP PAHs as well as the total PAH distributions (>90%) regardless of composition of the fuel tested. The fraction of group D PAHs in both the gas phase and total PAHs decreased with increase in the proportion of toluene blended into heptane. Fossil diesel had the lowest proportion of gas phase PAHs at 88% and, invariably, the highest particle phase PAHs.
- The total PAHs decreased with increase in the ignition delays and proportions of premixed phase of the various heptane/toluene blends. This suggests an influence on PAHs of the corresponding shift in combustion phasing from premixed to diffusion modes and subsequent changes in in-cylinder conditions.
- The apparent heat release rates of the heptane/toluene blends from diesel engine combustion may have an influence on the concentrations of the higher toxicity Group B2 PAHs deposited onto the soot particles, and their corresponding weighted carcinogenicities.
- The particle phase PAHs were observed to be strongly positively correlated with the soot particle sizes from which the PAHs were extracted, regardless of the fuel combusted.
- The total PAH concentration decreased with increase in the amount of ignition improver (2-ethylhexyl nitrate) added to the heptane/toluene fuel blend. Ignition improving additive impacted more significantly on the reduction of particle bound PAHs than those PAHs in the gas phase.
- Fuel composition seems to have more influence on the concentration of PAHs formed than the combustion characteristics (ignition delay, heat release rates and premixed burn fractions).
Author Contributions
Conceptualization, H.D, M.T, N.L. and P.H.; methodology, H.D, M.T, N.L. and P.H.; formal analysis, H.D.; investigation, H.D. and M.T.; writing—original draft preparation, H.D. and N.L.; writing—review and editing, H.D, M.T, N.L. and P.H.; supervision, N.L. and P.H.; project administration, H.D. and N.L.; funding acquisition, H.D., P.H. and N.L.
Funding
This research was funded by the UK Engineering and Physical Sciences Research Council (EPSRC), grant numbers EP/M007960/2 and EP/M009424/1.
Acknowledgments
The first author, H.D., wishes to gratefully acknowledge the Petroleum Technology Development Fund (PTDF) for sponsoring his research studies at University College London (UCL). The authors would like to express sincere gratitude to the Researcher Links programme of the British Council for the financial support of this publication.
Conflicts of Interest
The authors declare no conflict of interest.
References
- Williams, P.T.; Abbass, M.K.; Andrews, G.E.; Bartle, K.D. Diesel particulate emissions: The role of unburned fuel. Combust. Flame 1989, 75, 1–24. [Google Scholar] [CrossRef]
- Tancell, P.J.; Rhead, M.M.; Pemberton, R.D.; Braven, J. Survival of Polycyclic Aromatic Hydrocarbons during Diesel Combustion. Environ. Sci. Technol. 1995, 29, 2871–2876. [Google Scholar] [CrossRef] [PubMed]
- Dec, J.E. Advanced compression-ignition engines—Understanding the in-cylinder processes. Proc. Combust. Inst. 2010, 32, 2727–2742. [Google Scholar] [CrossRef]
- Knecht, W. Diesel engine development in view of reduced emission standards. Energy 2008, 33, 264–271. [Google Scholar] [CrossRef]
- Tree, D.R.; Svensson, K.I. Soot processes in compression ignition engines. Prog. Energy Combust. Sci. 2007, 33, 272–309. [Google Scholar] [CrossRef]
- Borrás, E.; Tortajada-Genaro, L.A.; Vázquez, M.; Zielinska, B. Polycyclic aromatic hydrocarbon exhaust emissions from different reformulated diesel fuels and engine operating conditions. Atmos. Environ. 2009, 43, 5944–5952. [Google Scholar] [CrossRef]
- Golubeva, A.; Magaril, E.; Magaril, R.; Panepinto, D.; Viggiano, F. Managing the environmental adaptation of vehicle operations. WIT Trans. Ecol. Environ. 2017, 223, 161–169. [Google Scholar] [CrossRef]
- EU Science Hub. Renewable Energy—Recast to 2030 (RED II) | EU Science Hub n.d. Available online: https://ec.europa.eu/jrc/en/jec/renewable-energy-recast-2030-red-ii (accessed on 21 June 2019).
- Ravina, M.; Castellana, C.; Panepinto, D.; Zanetti, M.C. MCBioCH4, A computational model for biogas and biomethane evaluation. J. Clean. Prod. 2019, 227, 739–747. [Google Scholar] [CrossRef]
- Hellier, P.; Ladommatos, N. The influence of biodiesel composition on compression ignition combustion and emissions. Proc. Inst. Mech. Eng. Part A J. Power Energy 2015, 229, 714–726. [Google Scholar] [CrossRef]
- Singh, S.P.; Singh, D. Biodiesel production through the use of different sources and characterization of oils and their esters as the substitute of diesel: A review. Renew. Sustain. Energy Rev. 2010, 14, 200–216. [Google Scholar] [CrossRef]
- Chuah, L.F.; Yusup, S.; Aziz, A.R.A.; Klemeš, J.J.; Bokhari, A.; Abdullah, M.Z. Influence of fatty acids content in non-edible oil for biodiesel properties. Clean Technol. Environ. Policy 2016, 18, 473–482. [Google Scholar] [CrossRef]
- Efthymiopoulos, I.; Hellier, P.; Ladommatos, N.; Mills-Lamptey, B. Transesterification of high-acidity spent coffee ground oil and subsequent combustion and emissions characteristics in a compression-ignition engine. Fuel 2019, 247, 257–271. [Google Scholar] [CrossRef]
- Hellier, P.; Jamil, F.; Zaglis-Tyraskis, E.; Al-Muhtaseb, A.H.; Al Haj, L.; Ladommatos, N. Combustion and emissions characteristics of date pit methyl ester in a single cylinder direct injection diesel engine. Fuel 2019, 243, 162–171. [Google Scholar] [CrossRef]
- Richter, H.; Howard, J.B. Formation of polycyclic aromatic hydrocarbons and their growth to soot—A review of chemical reaction pathways. Prog. Energy Combust. Sci. 2000, 26, 565–608. [Google Scholar] [CrossRef]
- Ballesteros, R.; Hernández, J.J.; Lyons, L.L. An experimental study of the influence of biofuel origin on particle-associated PAH emissions. Atmos. Environ. 2010, 44, 930–938. [Google Scholar] [CrossRef]
- Pedersen, P.S.; Ingwersen, J.; Nielsen, T.; Larsen, E. Effects of fuel, lubricant, and engine operating parameters on the emission of polycyclic aromatic hydrocarbons. Environ. Sci. Technol. 1980, 14, 71–79. [Google Scholar] [CrossRef]
- Aakko, P. PAH content of diesel fuels. Concawe. Rev. 2005, 14, 18. [Google Scholar]
- Collier, A.R.; Rhead, M.M.; Trier, C.J.; Bell, M.A. Polycyclic aromatic compound profiles from a light-duty direct-injection diesel engine. Fuel 1995, 74, 362–367. [Google Scholar] [CrossRef]
- Ang, K.P.; Gunasingham, H.; Tay, B.T. Polycyclic aromatic hydrocarbons in diesel exhaust emissions. Int. J. Environ. Stud. 1985, 26, 91–96. [Google Scholar] [CrossRef]
- Kado, N.Y.; Okamoto, R.A.; Kuzmicky, P.A.; Kobayashi, R.; Ayala, A.; Gebel, M.E.; Rieger, P.L.; Maddox, C.; Zafonte, L. Emissions of toxic pollutants from compressed natural gas and low sulfur diesel-fueled heavy-duty transit buses tested over multiple driving cycles. Environ. Sci. Technol. 2005, 39, 7638–7649. [Google Scholar] [CrossRef]
- Rhead, M.M.; Hardy, S.A. The sources of polycyclic aromatic compounds in diesel engine emissions☆. Fuel 2003, 82, 385–393. [Google Scholar] [CrossRef]
- Frenklach, M. Reaction mechanism of soot formation in flames. Phys. Chem. Chem. Phys. 2002, 4, 2028–2037. [Google Scholar] [CrossRef]
- Shukla, B.; Koshi, M. Comparative study on the growth mechanisms of PAHs. Combust. Flame 2011, 158, 369–375. [Google Scholar] [CrossRef]
- Vojtisek-Lom, M.; Pechout, M.; Dittrich, L.; Beránek, V.; Kotek, M.; Schwarz, J.; Vodička, P.; Milcová, A.; Rossnerová, A.; Ambrož, A.; et al. Polycyclic aromatic hydrocarbons (PAH) and their genotoxicity in exhaust emissions from a diesel engine during extended low-load operation on diesel and biodiesel fuels. Atmos. Environ. 2015, 109, 9–18. [Google Scholar] [CrossRef]
- Lim, M.C.H.; Ayoko, G.A.; Morawska, L.; Ristovski, Z.D.; Jayaratne, E.R. Effect of fuel composition and engine operating conditions on polycyclic aromatic hydrocarbon emissions from a fleet of heavy-duty diesel buses. Atmos. Environ. 2005, 39, 7836–7848. [Google Scholar] [CrossRef]
- Mi, H.H.; Lee, W.J.; Chen, C.B.; Yang, H.H.; Wu, S.J. Effect of fuel aromatic content on PAH emission from a heavy-duty diesel engine. Chemosphere 2000, 41, 1783–1790. [Google Scholar] [CrossRef]
- Barbella, R.; Ciajolo, A.; Anna, A.D. Effect of Fuel Aromaticity on Diesel Emissions. Combust. Flame 1989, 277, 267–277. [Google Scholar] [CrossRef]
- Sivaramakrishnan, R.; Tranter, R.S.; Brezinsky, K. High-pressure, high-temperature oxidation of toluene. Combust. Flame. 2004, 139, 340–350. [Google Scholar] [CrossRef]
- Wei, J.; Song, C.; Lv, G.; Song, J.; Wang, L.; Pang, H. A comparative study of the physical properties of in-cylinder soot generated from the combustion of n-heptane and toluene/n-heptane in a diesel engine. Proc. Combust. Inst. 2014, 35, 1939–1946. [Google Scholar] [CrossRef]
- Luo, J.; Yao, M.; Liu, H.; Yang, B. Experimental and numerical study on suitable diesel fuel surrogates in low temperature combustion conditions. Fuel 2012, 97, 621–629. [Google Scholar] [CrossRef]
- Halterman Carless, UK. Certificate of Analysis of Diesel Fuel. No C. Certificate 100000067345, 2016, 2–3. Available online: https://www.haltermann-carless.com/certificates (accessed on 4 July 2019).
- Hellier, P.; Ladommatos, N.; Allan, R.; Rogerson, J. Combustion and emissions characteristics of toluene/n-heptane and 1-octene/n-octane binary mixtures in a direct injection compression ignition engine. Combust. Flame 2013, 160, 2141–2158. [Google Scholar] [CrossRef]
- Knothe, G. Designer Biodiesel: Optimizing Fatty Ester Composition to Improve Fuel Properties. Energy Fuels 2008, 22, 1358–1364. [Google Scholar] [CrossRef]
- Talibi, M. Co-Combustion of Diesel and Gaseous Fuels with Exhaust Emissions Analysis and in-Cylinder Gas Sampling. Ph.D. Thesis, University College London, London, UK, 2015. [Google Scholar]
- Dandajeh, H.A.; Ladommatos, N.; Hellier, P.; Eveleigh, A. Effects of unsaturation of C2 and C3 hydrocarbons on the formation of PAHs and on the toxicity of soot particles. Fuel 2017, 194, 306–320. [Google Scholar] [CrossRef]
- Dandajeh, H.A.; Ladommatos, N.; Hellier, P.; Eveleigh, A. Influence of carbon number of C1–C7 hydrocarbons on PAH formation. Fuel 2018, 228, 140–151. [Google Scholar] [CrossRef]
- Koivisto, E.; Ladommatos, N.; Gold, M. Systematic study of the effect of the hydroxyl functional group in alcohol molecules on compression ignition and exhaust gas emissions. Fuel 2015, 153, 650–663. [Google Scholar] [CrossRef]
- Koivisto, E.; Ladommatos, N.; Gold, M. The influence of various oxygenated functional groups in carbonyl and ether compounds on compression ignition and exhaust gas emissions. Fuel 2015, 159, 697–711. [Google Scholar] [CrossRef]
- Ding, J.; He, G.; Zhang, L. Detailed Temperature-dependent Study of n-Heptane Pyrolysis at High Temperature. Chin. J. Chem. Phys. 2013, 26, 329. [Google Scholar] [CrossRef]
- Alexiou, A.; Williams, A. Soot formation in shock tube pyrolysis of toluene-n-heptane and toluene-iso-octane mixtures. Fuel 1995, 74, 153–158. [Google Scholar] [CrossRef]
- Division, D.; Group, F.P.; Engineering, M.; Waterloo, A.W. Modeling Study of the Soot Formation Process from Toluene Pyrolysis behind Reflected Shockwaves. In Proceedings of the 4th European Combustion Meetings, Vienna, Austria, 14–17 April 2009. [Google Scholar]
- Ladommatos, N.; Rubenstein, P.; Bennett, P. Some effects of molecular structure of single hydrocarbons on sooting tendency. Fuel 1996, 75, 114–124. [Google Scholar] [CrossRef]
- Kidoguchi, Y.; Yang, C.; Kato, R.; Miwa, K. Effects of fuel cetane number and aromatics on combustion process and emissions of a direct-injection diesel engine. JSAE Rev. 2000, 21, 469–475. [Google Scholar] [CrossRef]
- Ladommatos, N.; Parsi, M.; Knowles, A. The effect of fuel cetane improver on diesel pollutant emissions. Fuel 1996, 75, 8–14. [Google Scholar] [CrossRef]
- He, C.; Ge, Y.; Tan, J.; You, K.; Han, X.; Wang, J. Characteristics of polycyclic aromatic hydrocarbons emissions of diesel engine fueled with biodiesel and diesel. Fuel 2010, 89, 2040–2046. [Google Scholar] [CrossRef]
- Sánchez, N.E.; Callejas, A.; Millera, Á.; Bilbao, R.; Alzueta, M.U. Polycyclic aromatic hydrocarbon (PAH) and soot formation in the pyrolysis of acetylene and ethylene: Effect of the reaction temperature. Energy Fuels 2012, 26, 4823–4829. [Google Scholar] [CrossRef]
- Rhead, M.M.; Pemberton, R.D. of Sources Naphthalene in Diesel Exhaust Emissions. Energy Fuels 1996, 10, 837–843. [Google Scholar] [CrossRef]
- Jin, T.; Qu, L.; Liu, S.; Gao, J.; Wang, J.; Wang, F.; Zhang, P.; Bai, Z.; Xu, X. Chemical characteristics of particulate matter emitted from a heavy duty diesel engine and correlation among inorganic and PAH components. Fuel 2014, 116, 655–661. [Google Scholar] [CrossRef]
- Wang, X.; Song, C.; Lv, G.; Song, J.; Li, H.; Li, B. Evolution of in-cylinder polycyclic aromatic hydrocarbons in a diesel engine fueled with n-heptane and n-heptane/toluene. Fuel 2015, 158, 322–329. [Google Scholar] [CrossRef]
- Sánchez, N.E.; Millera, Á.; Bilbao, R.; Alzueta, M.U. Polycyclic aromatic hydrocarbons (PAH), soot and light gases formed in the pyrolysis of acetylene at different temperatures: Effect of fuel concentration. J. Anal. Appl. Pyrolysis 2013, 103, 126–133. [Google Scholar] [CrossRef]


© 2019 by the authors. Licensee MDPI, Basel, Switzerland. This article is an open access article distributed under the terms and conditions of the Creative Commons Attribution (CC BY) license (http://creativecommons.org/licenses/by/4.0/).