Article

Investigations on Performance Enhancement Measures of the Bidirectional Converter in PV–Wind Interconnected Microgrid System

by
Rajvikram Madurai Elavarasan
1,*,
Aritra Ghosh
2,*,
Tapas K. Mallick
2,*,
Apoorva Krishnamurthy
1 and
Meenal Saravanan
1
1
Department of Electrical and Electronics Engineering, Sri Venkateswara College of Engineering, Chennai 602117, India
2
Environmental and Sustainability Institute, University of Exeter, Penryn Campus, Cornwall TR109FE, UK
*
Authors to whom correspondence should be addressed.
Energies 2019, 12(14), 2672; https://doi.org/10.3390/en12142672
Submission received: 28 May 2019 / Revised: 29 June 2019 / Accepted: 5 July 2019 / Published: 11 July 2019
(This article belongs to the Section F: Electrical Engineering)

Abstract

:
In this work, a hybrid microgrid framework was created with the assistance of a photovoltaic (PV) and wind turbine (WT) generator. Additionally, bidirectional control mechanisms were implemented where an AC system was integrated with permanent magnet synchronous generator (PMSG)-based WT and a DC system was integrated with a sliding mode algorithm controlled maximum power point tracker (MPPT)-integrated PV system. The wind and PV interconnected microgrid system was mathematically modeled for steady-state conditions. This hybrid microgrid model was simulated using the MATLAB/SIMULINK platform. Optimal load management strategy was performed on a chosen hybrid microgrid system. Various case studies pertaining to connection and disconnection of sources and loads were performed on the test system. The outcomes establish that the system can be kept up in a steady-state condition under the recommended control plans when the network is changed, starting with one working condition then onto the next.

1. Introduction

Enhanced power demand increases more and more CO2 emission, causing more damage to the environment. To maintain the commitment made at the Paris climate meet, energy generation from renewable energy sources is essential [1]. The intermittency and uncertainty of renewable resources limit their operation independently or when connected to the utility grid. Thus, the microgrid concept incorporating renewable energy sources such as wind turbines (WT) and photovoltaics (PV) systems into the electric power supply is needed. Microgrids is a single unit interconnection between loads, integrated renewable energy and storage system in the same grid, which improves grid utility by improving power flow in the distribution network and decreases power losses in the transmission line [2]. The microgrid can operate at grid-connected mode where the grid determines the voltage and frequency of microgrid, supplies deficit energy, and extract excess energy and islanding mode where renewable energy sources and storage system supply the deficit and maintain the power balance. The microgrid includes AC, DC or hybrid types [3,4]. The AC microgrid ensures synchronization with the main grid, maintains contact points power exchange, and offers stable voltage and frequency at the load ends by performing active and reactive power control of the renewable energy sources [5]. WTs generate AC power, and it is thus simpler to connect them to a conventional AC grid. Protection of AC microgrids is a major challenge during islanded and grid-connected operation, which can be overcome by employing optimum settings of directional overcurrent relays [6]. A DC microgrid is advantageous due to its high efficiency, reliability, lack of frequency and reactive power issues, and simpler connection to DC renewable sources. Due to the presence of only active power, the wire sizes and the DC link capacitor can be reduced [7]. Application of DC microgrid includes residential buildings, data centers, island power supplies, communication systems, electric vehicles, and metro tractions [8]. For a DC microgrid, DC loads are connected through a DC bus. A PV system is an ideal renewable source for a DC microgrid, which generates benign electricity directly from sunlight [9,10]. The converter can boost the PV output voltage level to match the DC bus and maximum power point trackers extract the maximum power from PV during normal and shading effect and temperature variation [11,12]. A hybrid AC/DC microgrid combines both AC and DC in the same distribution grid and offers direct integration of both AC- and DC-based renewable energy sources and loads. The hybrid microgrid reduces the conversion stages and therefore the energy losses, uses a minimum number of interface elements, without the need for synchronization of generation and storage units, as they are directly connected either to the AC or DC network [13]. Hence, the control strategy for this device is simplified. The modification of voltage levels can be performed in a simple manner at the AC side by the use of transformers. At the DC side, the conversion is performed through the use of DC–DC converters. The cost of a hybrid microgrid is reduced if the number of attached devices is increased [14]. Further, they possess few drawbacks, such as lack of DC protection devices, low reliability, and overall system complexity. A typical hybrid microgrid is shown in Figure 1.
The most popular architecture for hybrid microgrids consists of WTs, PVs, and batteries [15,16]. In different works, hydropower [17], fuel cells [18,19], biomass reactors [20], and hydrogen tanks [21] were employed for renewable sources as well as diesel [22] and biodiesel generators. Battery, supercapacitor [23,24], and flywheel [25] were employed as storage [26] devices in a hybrid microgrid. A hybrid microgrid including WTs, PVs, and lead–acid batteries and tidal current that exists in the straits between the island of Evia and mainland Greece was investigated. This type of hybrid microgrid configuration is suitable for the Mediterranean coastline and islands, where low velocity tidal and marine currents exist along with substantial solar and/or wind energy potential [27]. The transformation and upgrade of a traditional AC distribution network using Z-transformers was performed for a hybrid microgrid and its power router using the MATLAB/Simulink simulation platform [28]. Optimization for small reverse osmosis (RO)-based desalination plants driven by PV and wind-based microgrid was investigated. In addition, the probability of power interruption was used to measure the reliability of hybrid schemes [29]. Sizing between PV, wind, and battery bank was presented using the hybrid Big Bang–Big Crunch algorithm [15].
Most often, hybrid microgrid performance is investigated in stable operation mode. However, the critical issue occurs in the switching mode operation, as it is responsible for maintaining voltage and frequency regulation without the support of the utility grid. Similar problems occur during islanding mode operation of a microgrid system. Thus, the smooth-mode transition is essential for stable and reliable microgrid operation. Nonsynchronization between microgrid and utility grid during the transition from islanding mode to grid-connected mode can damage the devices. Thus, the control strategy is essential to control the instability of the microgrid. Control of the microgrid is a challenging but essential task. Droop control, model predictive control, and multiagent systems are the available control methods for the microgrid [30]. For a smooth transition, a multidrop control strategy involving mitigating voltage and frequency variations during mode transition has been developed to mitigate voltage and frequency variations during mode transition [31]. In another work, thermal and demand responses were optimized using an incorporated microgrid control algorithm [32,33].
The bidirectional converter in a microgrid is essential as it monitors the overall functions of the grid, acts as a static compensator (STATCOM)m injecting reactive power to build stability in the system, and improves the power factor for lossless and efficient operation [34,35]. By estimating the frequency of the AC microgrid and voltage of the DC microgrid and utilizing the droop characteristics, the power governance procedure gives power to the controller in the bidirectional converter in between the AC and DC microgrids to share the power request between the AC and DC microgrids [36]. Bidirectional converters are mostly designed to aid in a higher voltage conversion ratio and low switching noise [37]. They can work effectively with the aid of pulse width modulation (PWM) and offer a higher rate of voltage ratio conversion and better current balancing capacity [38]. However, the converter control topology for the bidirectional converter must properly be selected in order to reduce the level of total harmonic distortion [39]. For the hybrid microgrid, multidevice interleaved DC–DC [40], multiparallel [41], single inductor multiple ports [42], and a bidirectional converter were employed.
In a hybrid microgrid, the intermittent power generation from photovoltaic and the wind turbine systems create complications in network integration. Further, in the case of existing hybrid microgrids, problems occur due to repetitive conversions and owing to excess power conversions in the case of existing traditional converter topologies. A suitable scheme that can facilitate the fast entrance of sustainable power sources is always under search.
In this work, we tried to:
  • Build a hybrid AC/DC microgrid along with a low-cost bidirectional converter to counter repetitive conversions and optimal load management strategy. The low-cost bidirectional converter was included to allow the battery to recharge, battery energy infusion into the AC network, and battery energy for AC power control adjustment.
  • Develop a novel programmed unified microgrid controller in charge of checking the steady expansion of new loads guaranteeing a highlight, while the AC system was integrated with a permanent magnet synchronous generator (PMSG)-based WT, and the DC system was integrated with a maximum power point tracker (MPPT)-integrated PV system.

2. Methodology for Hybrid Microgrid Architecture

2.1. Renewable Sources and Bidirectional Converter

This work introduces an effective operation strategy of a wind/solar hybrid power system with a bidirectional converter introduced in between to achieve optimal load management using a dynamic modeling and control system fueled by wind and PV renewable energy resources, as shown in Figure 2. It can run either in a connected or a disconnected mode from the microgrid, and thus, it can operate both in grid-connected or island mode. It consists of a solar PV panel (an array of 4 kW panels) of rating 120 V which produces a power output of 4 kW. The PV panel is thus associated with a sliding mode controller to boost the power extraction under all conditions.
Wind energy was obtained from a wind energy-controlled system (WECS) which included a wind turbine, a generator, interconnection apparatus, and control systems. The PMSG has more advantages when compared to another generator like Doubly Fed Induction Generator (DFIG) [43]. The WECS consists of a direct-driven permanent magnet synchronous generator (PMSG) because it supports gearless operation and enables small scale residential powered applications and transforms power with high effectiveness and maximum power density. Moreover, its mechanical structure is flexible, and its support cost is low. It is designed with the AC/DC/AC converter at the stator side, which is capable of maintaining DC link voltage, reactive power control, and speed control of the system. The pitch control mechanism is implemented in the wind energy conversion system for obtaining maximum real power output [44].
The proposed microgrid system also consists of a utility grid connection which can provide power in case of deficiency from sustainable energy sources. However, the proposed work not only creates power exclusively from the sustainable power source but also infuses surplus capacity to the utility grid during ordinary activity. Blackout possibility in this power framework is nearly zero, since it is profoundly improbable that both winds as well as solar sources are unavailable in the microgrid at the same time, which improves the unwavering quality of the framework. In addition to that, the proposed microgrid system does not require any fuel for the distributed generation units, since it is controlled by inherently available renewable energy sources. Thus, with enough local energy storage, it does not depend on lifesavers—e.g., transport via roads and railways—which makes it a self-reliable power system network to provide power in ordinary as well as amid outrageous conditions. The microgrid energy supervision process is demonstrated as a Markov decision process (MDP) with a target of limiting the day by day working expense as in [45]. Smart grid advances that consider two-path correspondence between the utility and its clients, and progressed sensing along the transmission lines, assume a vital job in the modernization procedure [46]. This system includes an AC and DC bus, which are interlinked by a bi-directional converter that manages the power flow between two buses, i.e., AC to DC and DC to AC. It is responsible for monitoring and controlling the active and reactive power flow between the AC and DC side bus whenever demand on either side rises beyond the generation limit. The principle goal of this converter is to give a powerful quality voltage to basic and delicate loads associated with the microgrid. In addition to that, it ensures a specialized feature in a way that load can either be added or removed from the existing network without reengineering the entire power system network.
The solar PV panel relates to the DC bus, and the wind power conversion system is coupled to the AC bus as shown in Figure 2. MPPT can be attained using the fuzzy logic controller, which traces the reference speed of the generator to derive maximum power at various wind turbine speed. This method will be effective and best suited for high-speed operations [47,48]. Separate AC load and DC load is connected to the AC and DC bus, respectively. The battery is employed to store the excess power produced in the system.

2.2. Optimal Load Management Algorithm

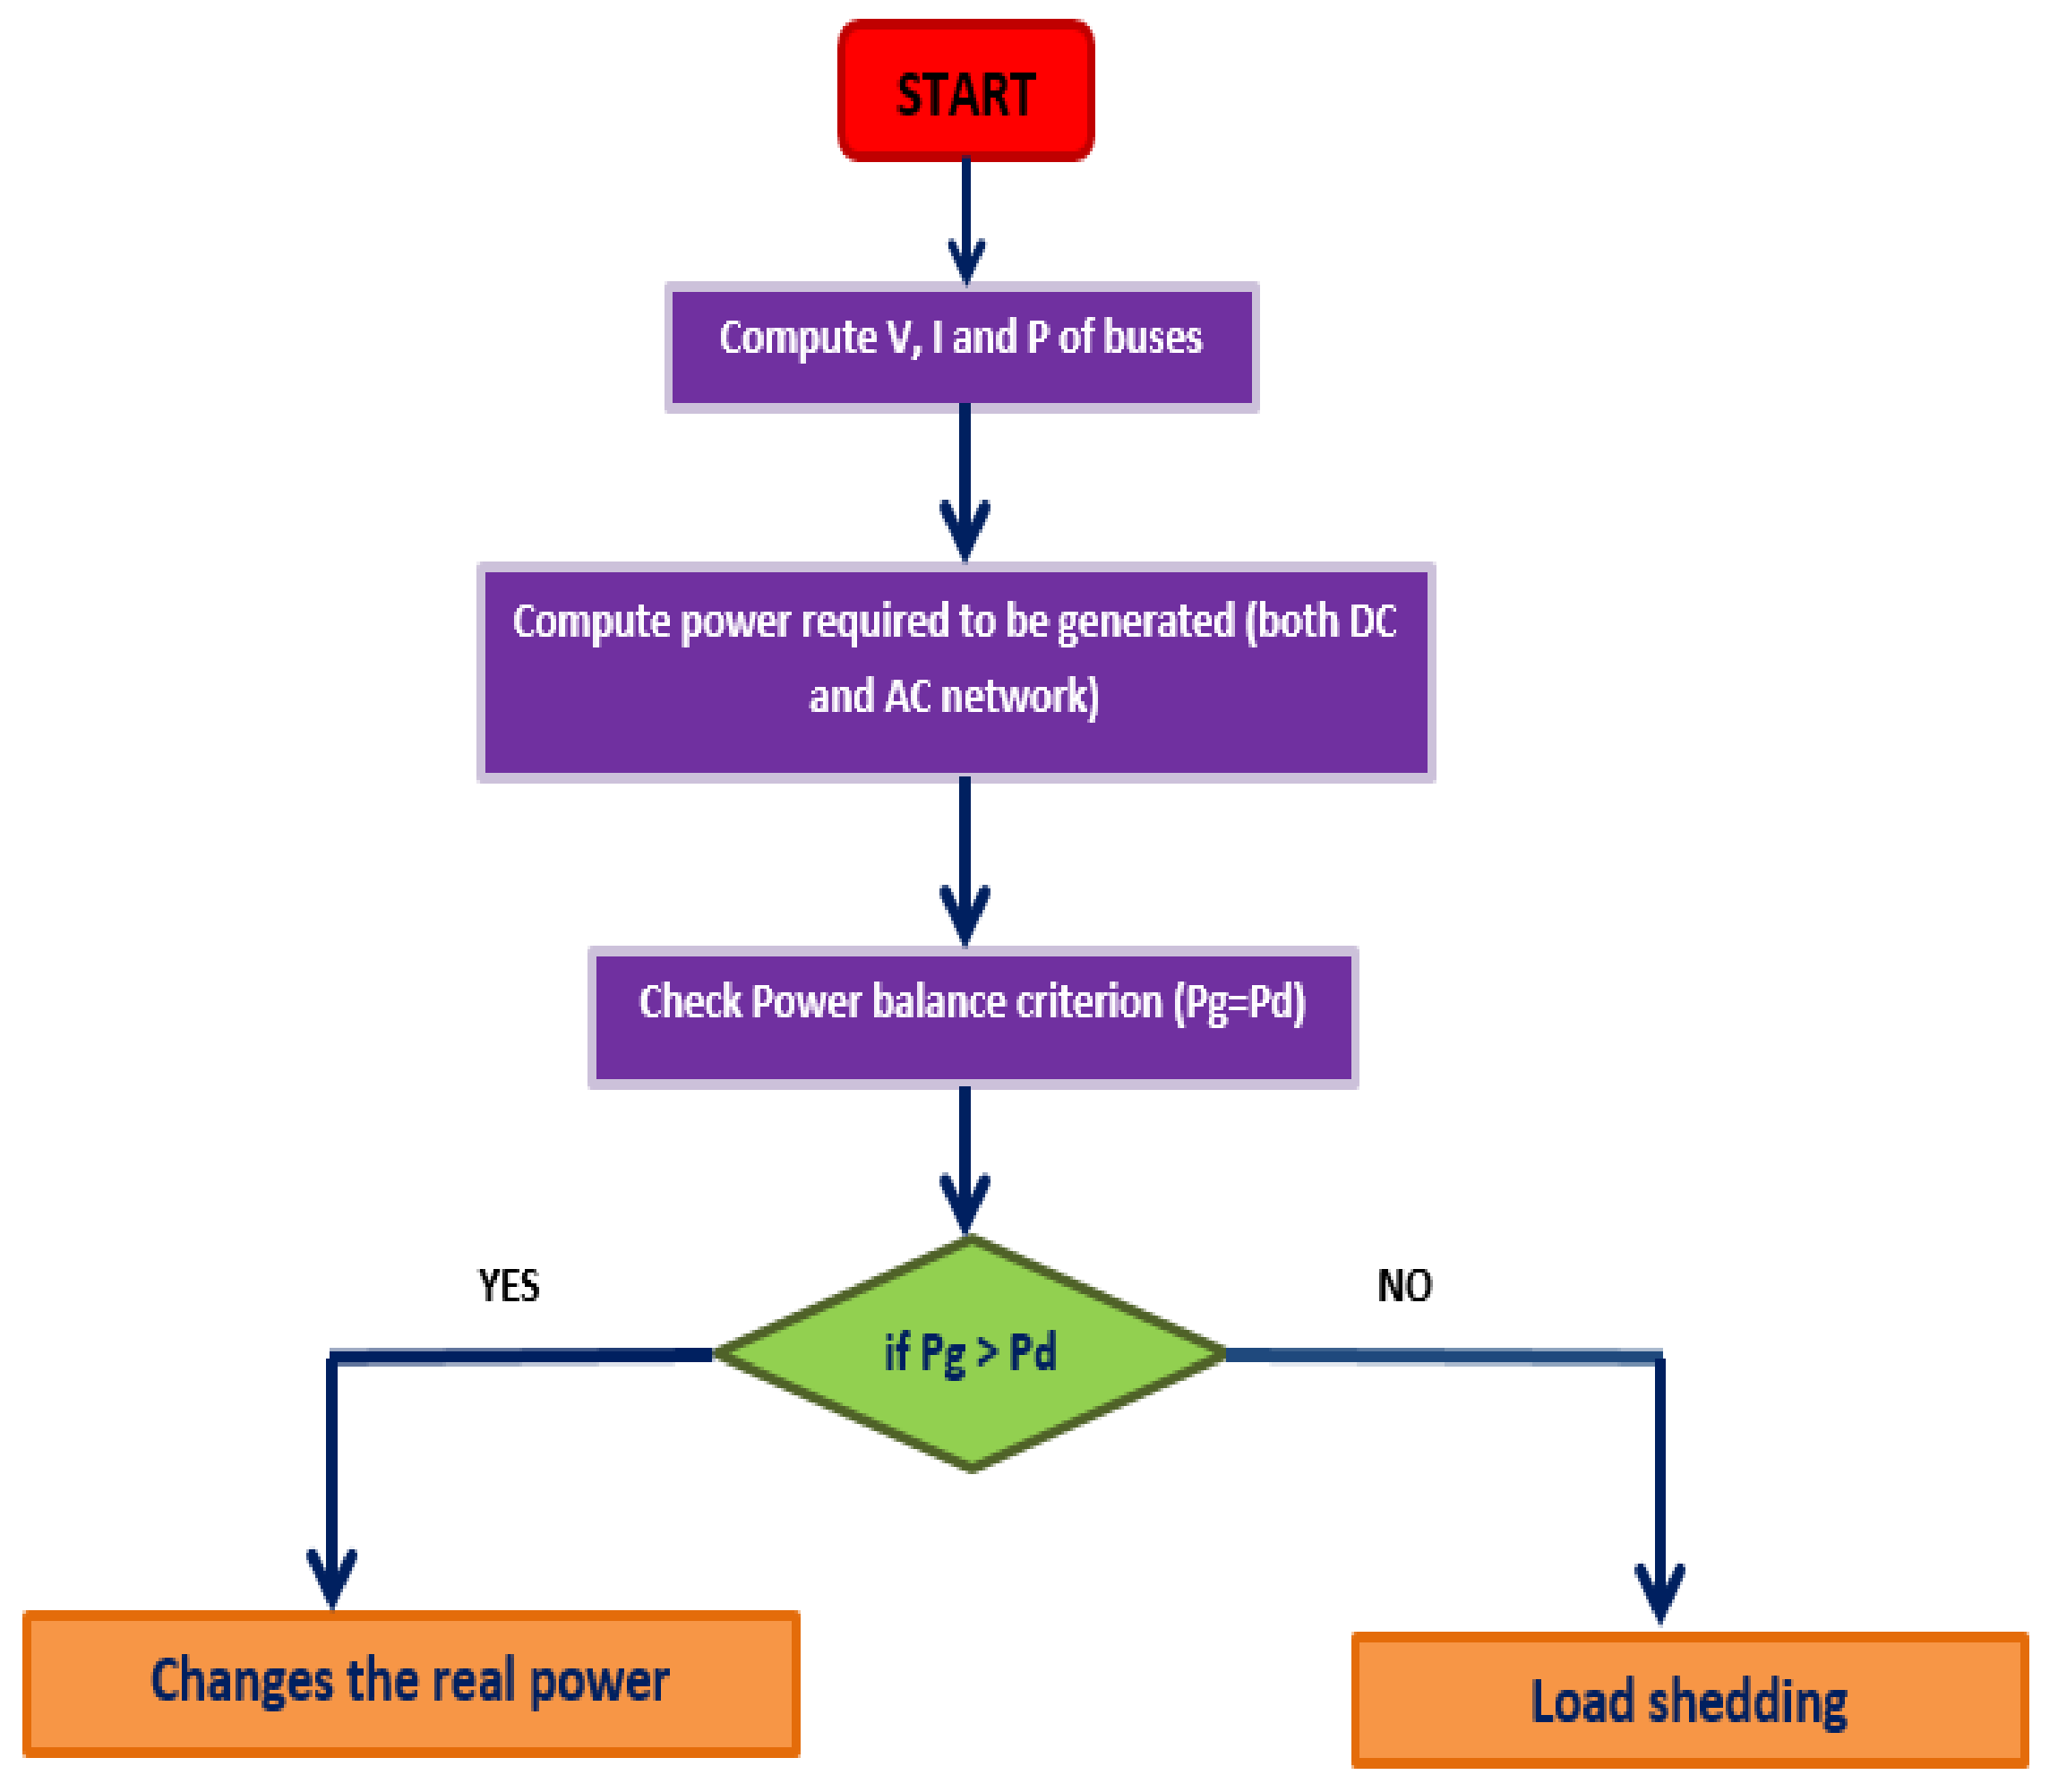
The load management algorithm is shown as a flowchart in Figure 3.
Step 1
Start the process of computation.
Step 2
Collect the information relating to voltage, current, and power values of both AC and DC bus.
Step 3
Compute power required to be generated on both sides of the network.
Step 4
Check the power balance criterion.
Pg = Pd
Total power generated can be estimated as:
P g = P p v + P w ,
where Pg is total power generated (kW); Ppv is power generated from the solar PV panel (kW); and Pw is power generated from the wind turbine (kW).
Step 5
If Pg > Pd, then change the real power reference value.
Step 6
If Pg < Pd, then load shedding will take place.
Step 7
If Pg = Pd, the system is balanced, then jump onto step 8 or else jump on to step 5.
Step 8
Stop.

2.2.1. Modelling of PV System

The total power output of PV module is given by:
P p v = N s N p P m ,
where Ns is number of cells connected in series; Np is the number of cells connected in parallel; Pm is the power of each module; and DC power output of the solar PV panel is based on:
P p v = η p v g A p v g G t ,
where η pvg is the efficiency of PV generation; Apvg is Effective surface area of PV generator; and Gt is effective solar irradiation (W/ m 2 ). The efficiency of PV generation defined as:
η p v g = η r η p c 1 β T c T c r e f ,
where η pc is the efficiency of power conditioning (equals 1 when MPPT used); B is the temperature coefficient; t η r is the efficiency of the reference module; and Tcref is the temperature of the reference cell in °C. The reference temperature can be given as:
T c = T a + C T G t
C T = N O C T 20 800 ,
where Ta is ambient temperature and NOCT is nominal operating cell temperature.

2.2.2. Modelling of Wind Power System

Mechanical power generated from the wind turbine is given by:
P w = c p λ , β ρ A 2 V w 3 ,
λ = ω r V ,
where cp is power coefficient; A is intercepting area of the rotor blades ( m 2 ); ρ is air density (kg/ m 2 ); the theoretical maximum value of Cp is 0.593, also called as Betz’s coefficient; ω is the angular velocity (rad/s); r is the radius of WTG (m); and Vw and V is average wind speed (m/s). The output power of the wind turbine depends on the power output curve, wind speed, and the height of the hub, which can be written as:
P w v = P R υ υ C υ R υ C υ c υ υ R
= P R υ R υ υ F
= 0 υ υ c   a n d   υ υ F .
vc is cut in wind speed; vF is cut-off wind speed; vR is rated wind speed; and PR is rated electrical power output.

3. Simulation Results and Discussion

The proposed hybrid microgrid system consists of a separate AC and DC bus, while the AC and DC sources are a wind and PV system, respectively. AC network parameters and DC network parameters for simulation and modelling are represented in Table 1 and Table 2 respectively. The AC source and 3 phase AC load are connected to the AC bus, whereas the DC source and DC load (buck converter) are connected to the DC bus. Both the buses connected via the bidirectional converter constitute the hybrid photovoltaic/wind (AC/DC) microgrid system operating in the grid-tied mode as represented in Figure 4.

3.1. PV Integrated with Maximum Power Point Tracking

An array of 4 kW panels of rating 120 V was associated with a sliding mode controller to boost the power extraction under all conditions [35]. A variety of MPPT techniques has been analyzed and performed to increase the operating efficiency of the panel [49], such as the perturb and observe (P&O) strategy, the incremental conductance calculation, and neural systems procedures [50,51,52,53]. Based on the disadvantages of several methods proposed, the sliding mode control algorithm technique has gained attention due to its simple implementation procedure and higher stability [54]. This control algorithm consists of two parts:
  • Inner sliding mode loop (fast loop);
  • Outer loop (slow loop).
Each part creates a separate algorithmic loop responsible for its own function, as shown in Figure 5. This algorithm is suitable for systems with the imprecise model. It is because they are based on prediction. The proposed methodology is demonstrated to be fit for working under changing states of sun-based irradiance, temperature, and burden, withstanding when the varieties are sudden. This is a significant element that a productive MPPT must have since the nearness of mists or trees, for example, may corrupt the output of specific controllers [55].
The inner loop utilizes the inductor current as of the primary state variable, as the energy output from the converter is an immediate result of the inductor current. It is characteristically overcurrent secured, withstanding heavy currents during start-up or transient conditions. It is likewise steady over a wide scope of voltages. The transient response is improved by including an inward control loop with an extensive data transfer capacity [56]. Since the greater part of the tracking is done by the inward loop, MPPT does not require many iterations.
The outer loop determines the voltage and current from the PV panel and computes power. This power is then compared with the optimal power to extract maximum power.
The sliding mode controller tracks the highest power output from the PV panel by comparing the actual panel voltage (terminal voltage) with the optimum voltage, as shown in Figure 6. In this work, the voltage output due to solar insolation is the optimal voltage. For this particular work, the solar insolation was kept constant at 950 W/m2, while the open circuit voltage and voltage at the maximum power were found to be 22.2 V and 17.2 V, respectively.
Case 1
If terminal voltage < optimal voltage, then output = 0.
Case 2
If terminal voltage > optimal voltage, then output = 1.
It constantly compares with the ratio between Vpmax and Voc to produce the output control signal as either 1 or 0, as shown in Figure 7a. For instance, the ratio of voltage at the maximum power to open circuit voltage be 0.7745.
Voltage at the maximum power = 17.2 = 0.7745
Open circuit voltage = 22.2 V
The yield from the solar panel (147.4 V) is associated as a contribution to the buck support converter to help the voltage yield from the PV panel to 200 V, as shown in Figure 7b. It provides a regulated DC output voltage. The output voltage magnitude depends on the duty cycle. Here, the duty cycle is found to be 0.8 by the trial and error method to get an output voltage of 200 V.
The available voltage from the solar PV is not suitable for the system being supplied. Thus, the yield voltage of the buck–boost converter (154.1 V) is given as a contribution to the boost converter, which supports the voltage up to 700 V, as shown in Figure 7c. Figure 8 shows the schematic representation of the photovoltaic system coupled with the DC bus.

3.2. Wind Energy Conversion System

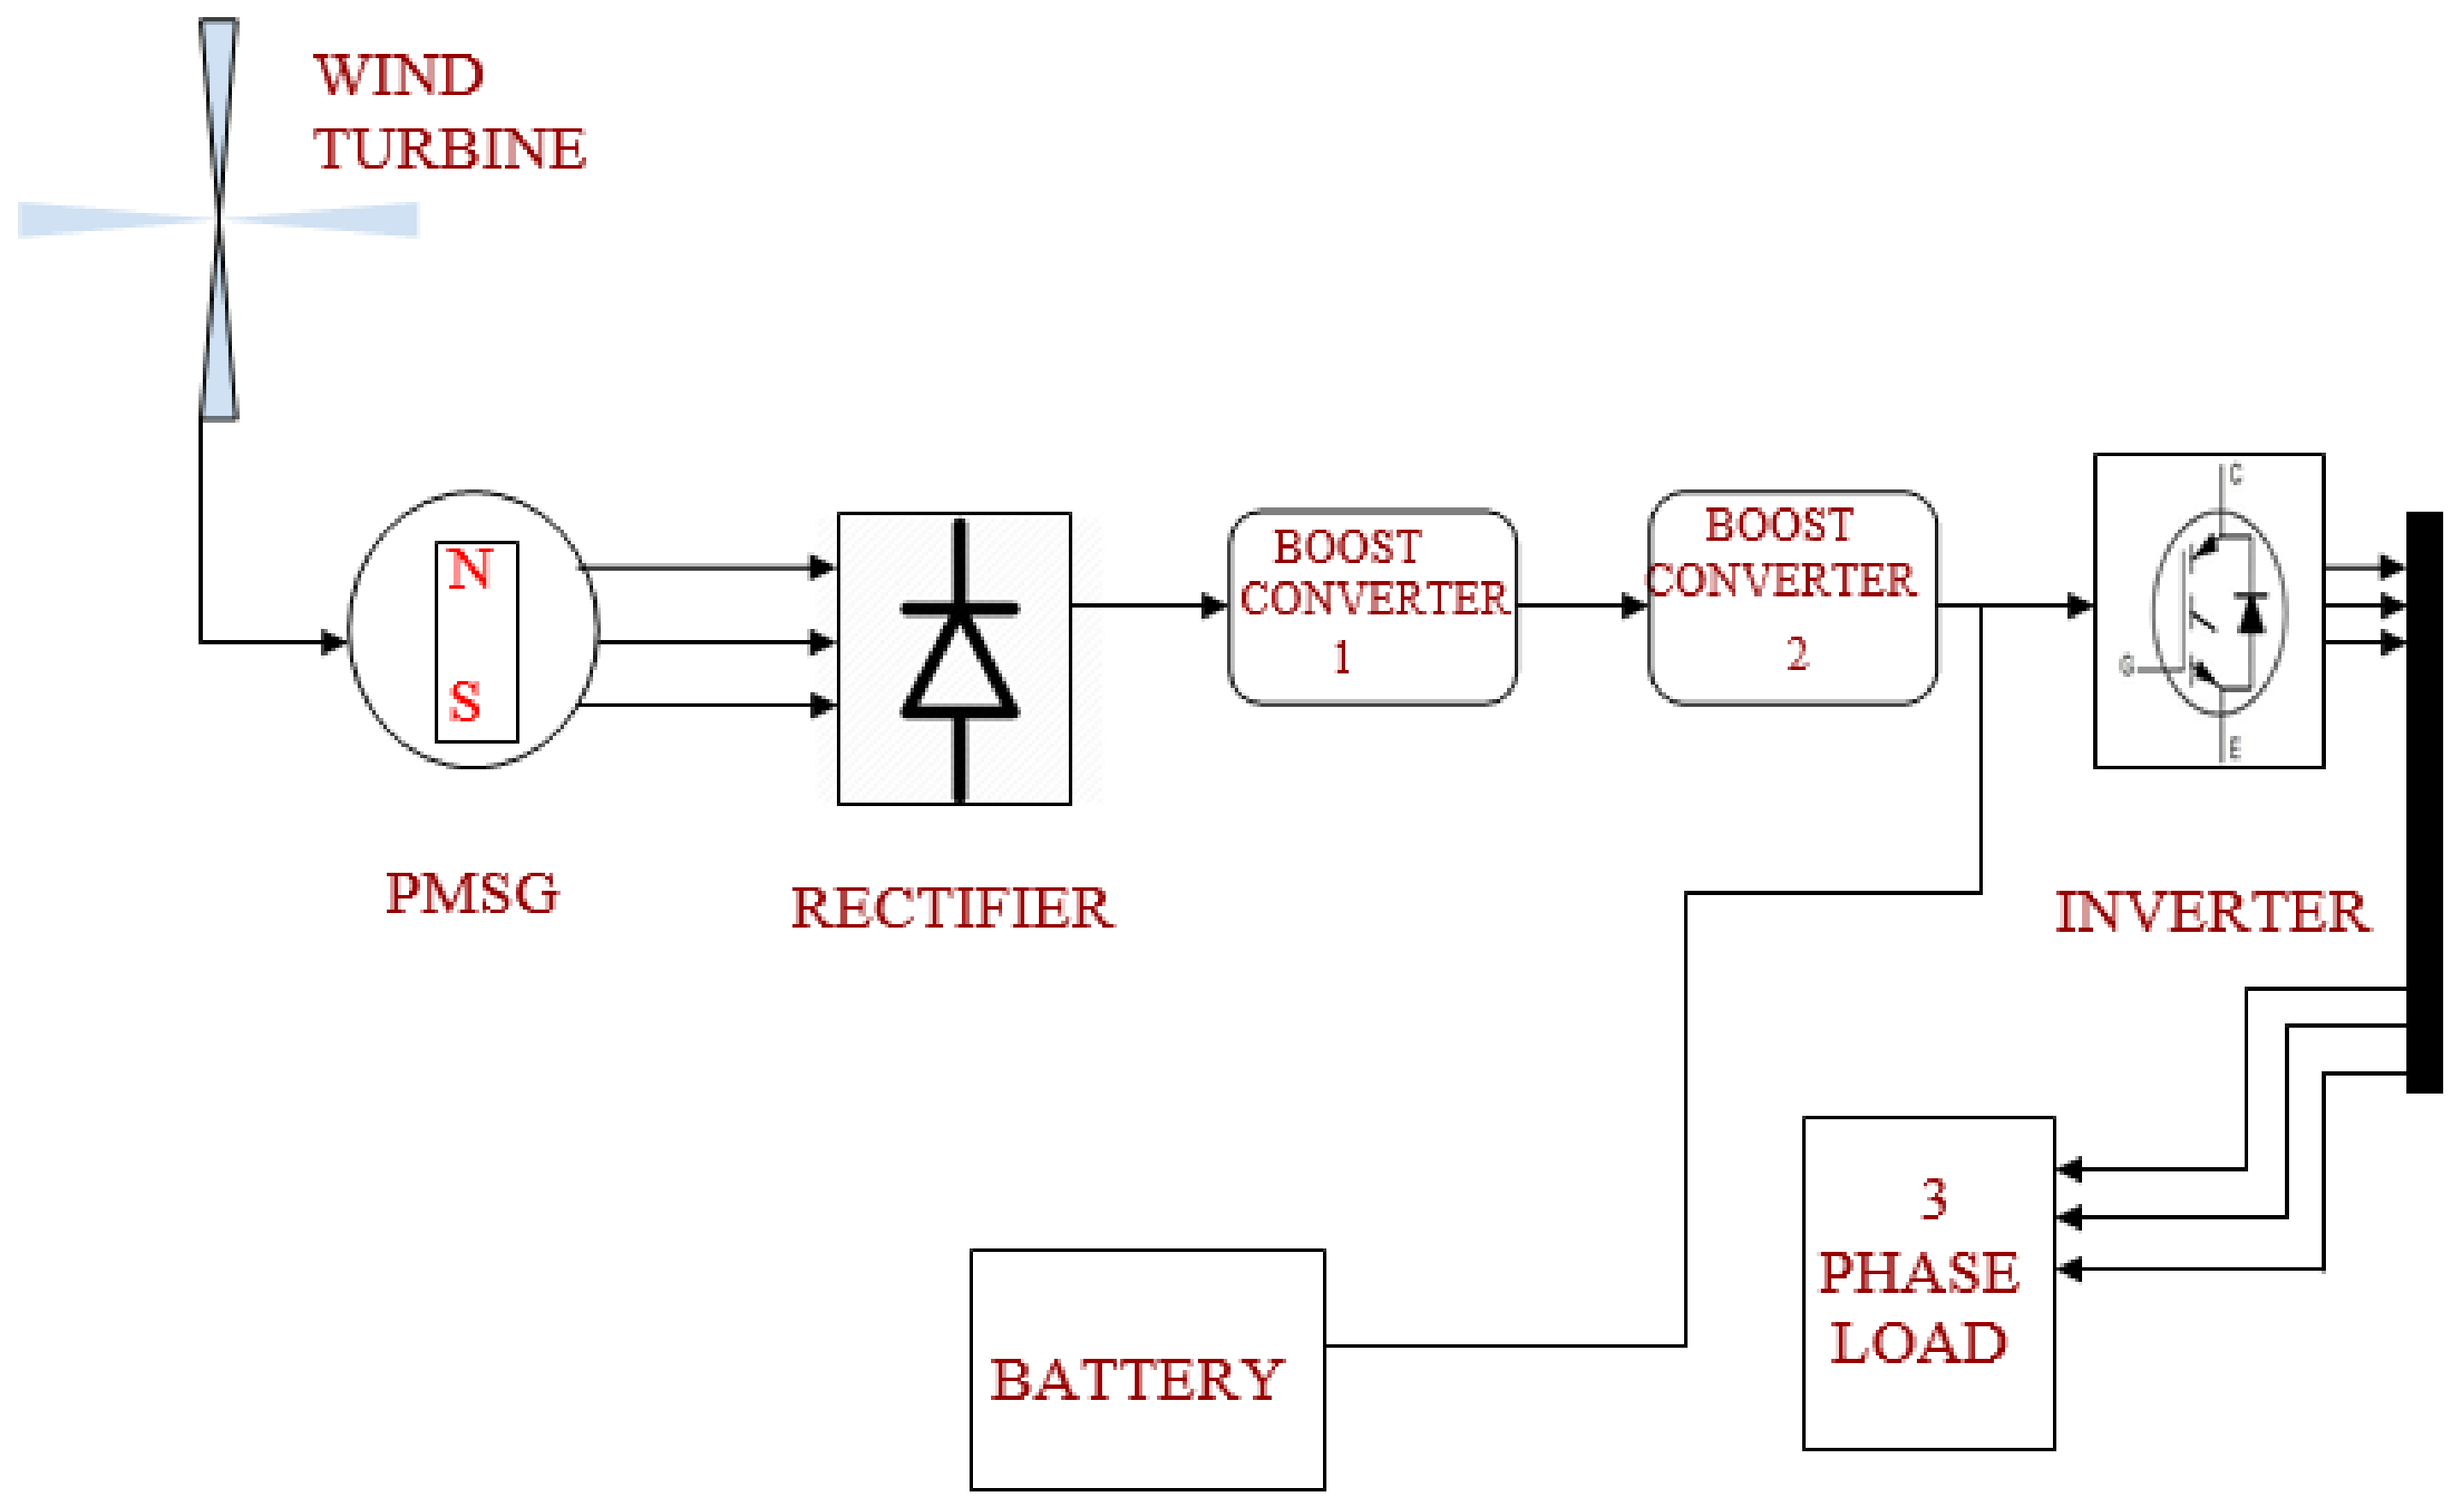
The main components of a typical WECS include a wind turbine, a generator, interconnection apparatus, and control systems. The PMSG-based wind energy conversion system is represented in Figure 9. The wind turbine is modeled to run at a speed of 9 m/s to get peak power from it. The nominal power of the wind turbine considered is 3 kW. In order to extract the peak power from the wind energy conversion system, the speed of the turbine should be varied in accordance with the wind speed. The base wind speed is considered as 9 m/s. When the wind speed is equal to the base speed, i.e., 9 m/s, the turbine speed should be 1 pu in order to obtain the maximum power, i.e., 100 percent of the nominal power. In cases where the wind speed is decreased to 7 m/s, the turbine speed should be 0.8 pu to obtain the maximum power, which will be 40% of the nominal power. This is similar to changing the terminal voltage of the solar panel depending on the solar irradiance. A wind turbine is opted in this system for providing mechanical torque to PMSG. Thus, 3-phase power is generated from this system. However, the output voltage from the PMSG is not of the desired value, i.e., 380 V, and hence, it is changed accordingly, using back to back converters as shown in Figure 10. The power electronic converters are used as such devices.
The back to back converters include a machine-side converter (MSC) and a grid side converter (GSC) with a DC voltage link between these converters. For the selected wind turbine system, a 3-phase full wave rectifier and a 3-phase three-level voltage source inverter are used for MSC and GSC, respectively. The available AC voltage from the PMSG output is rectified into DC output. The main purpose of this conversion into DC power is that it is easier to manipulate DC waveforms which are basically a straight line than sinusoidal AC waveforms. It is then stepped up to the desired DC level using two-level boost converters. The AC–DC converter is also responsible for controlling the active power generation and thus tracks the maximum available power. A DC link capacitor is used to sustain the DC voltage at the desired level. The capacitor operates with the rectifier and goes about as a storage device for DC power and filters out the variations of the DC voltage prior to the further processing of the inverter section. To accompany the capacitor in the DC link, a battery might be utilized as a storage gadget (DC voltage is now fixed). The percentage of state of charging of the battery in volts in y axis and Time (ms) in x axis is shown in Figure 11.
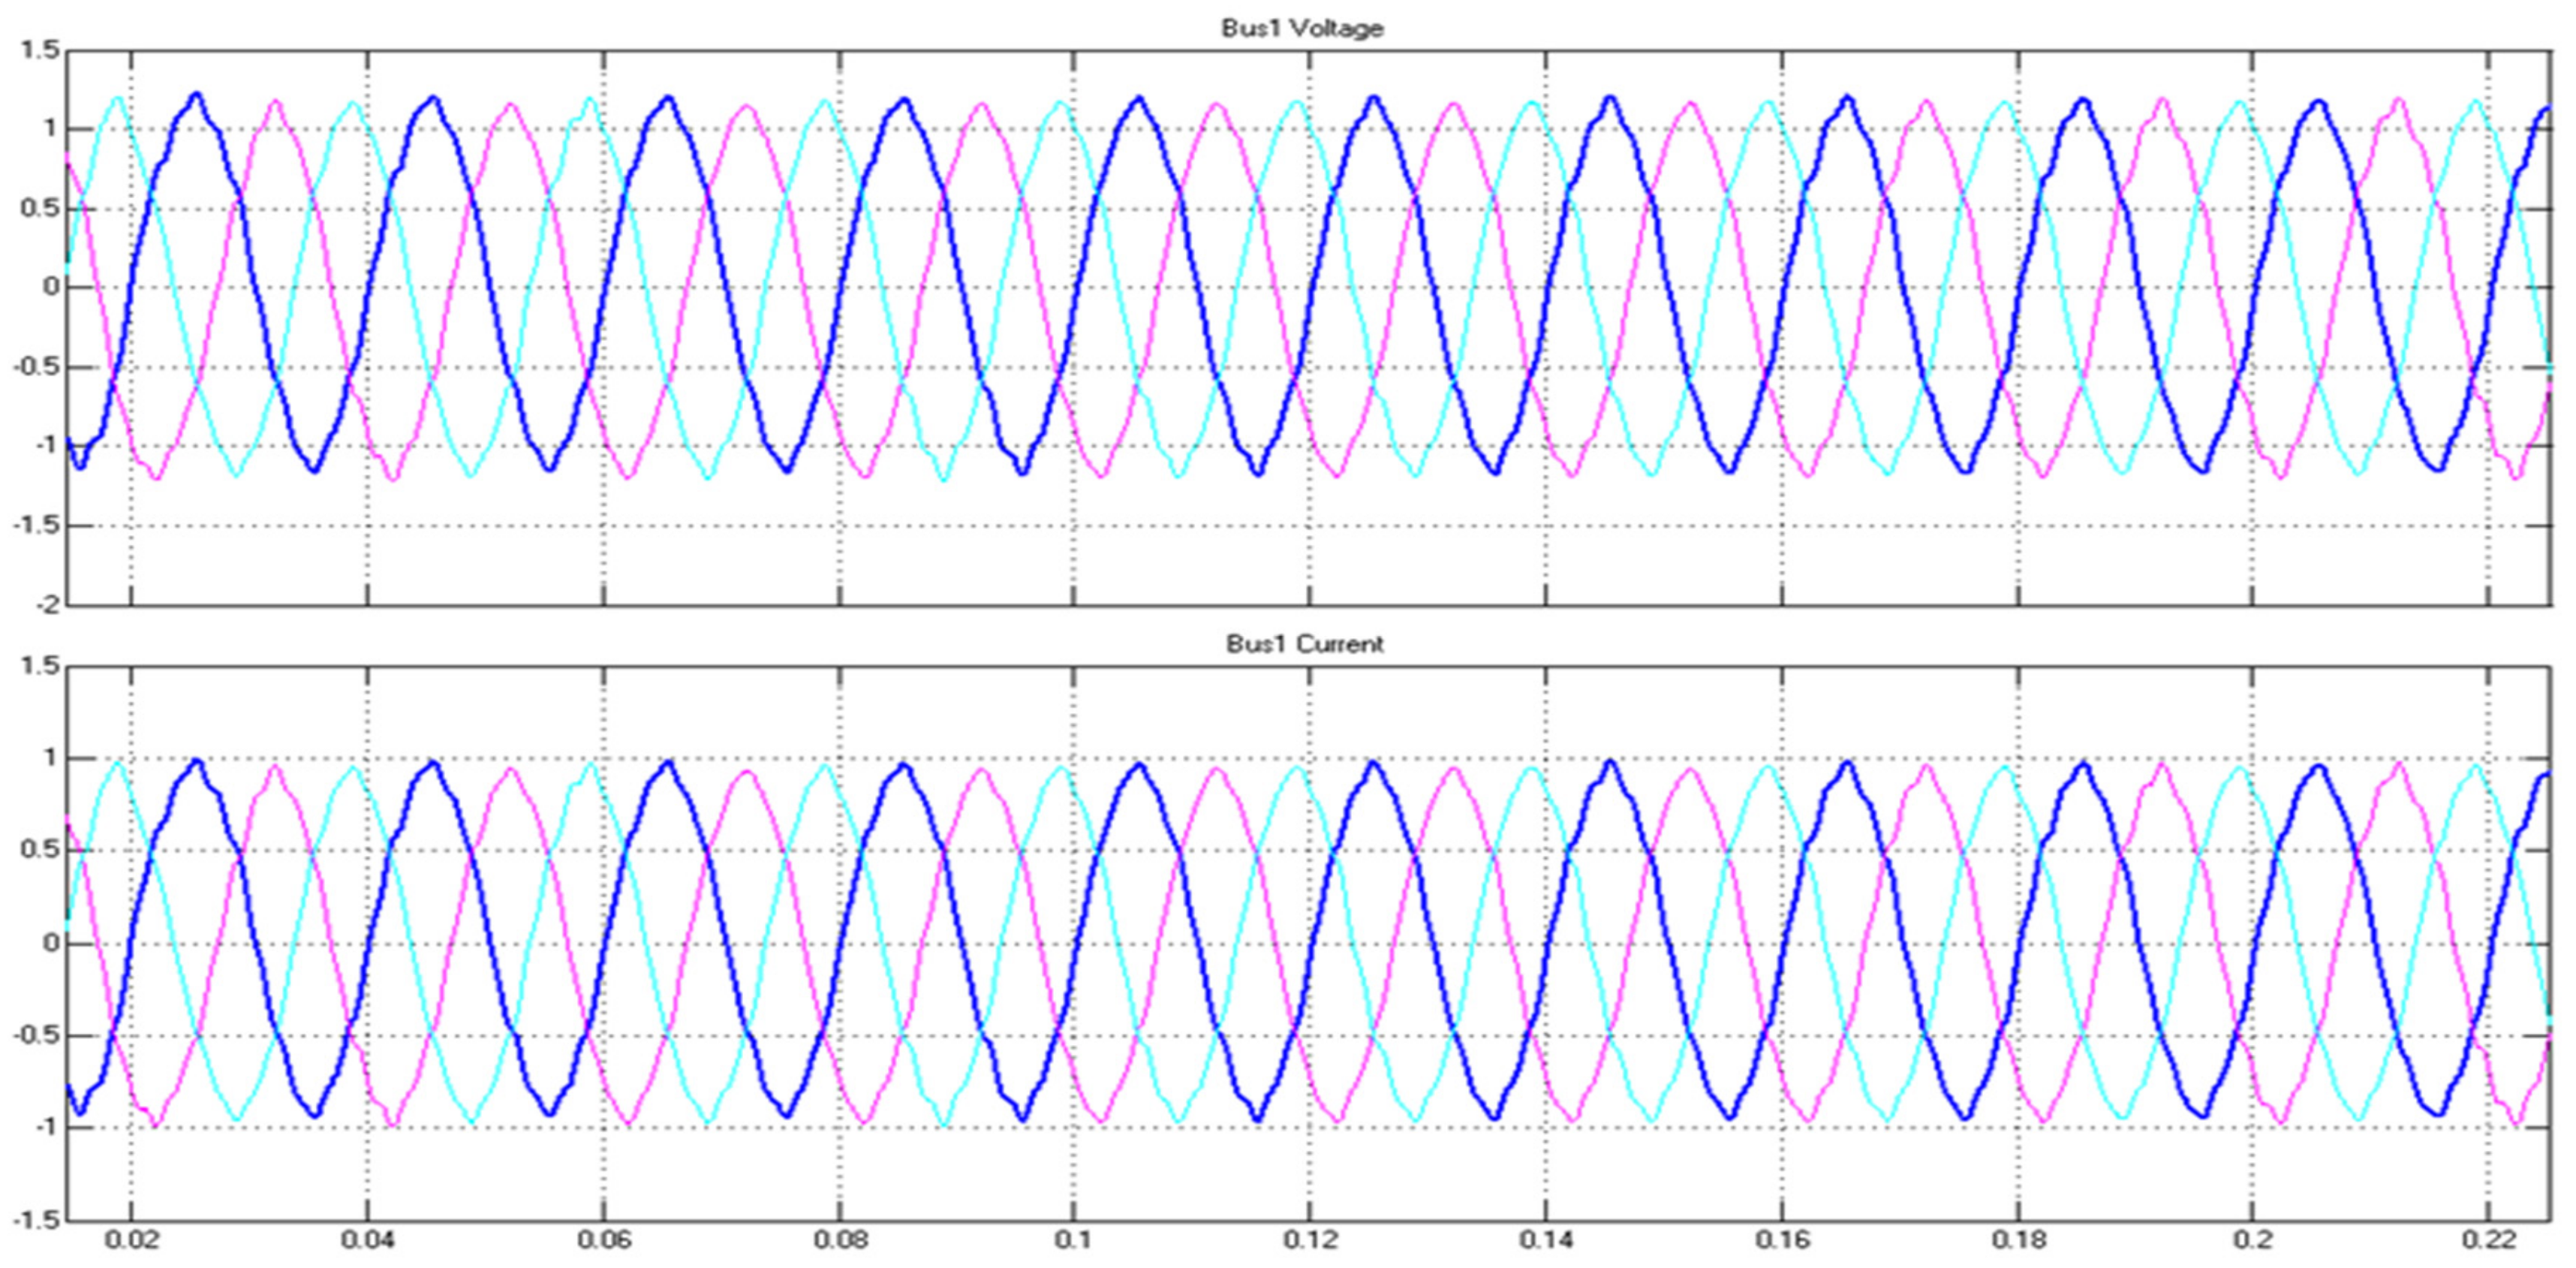
The accessible DC yield can be utilized to charge batteries for a few applications. The filtered DC power from the DC link is then fed into the inverter section. The DC-AC conversion using a three- level Space Vector Pulse Width Modulation (SVPWM) controlled inverter has been used. The main function of the grid side converter is to control and regulate the DC link voltage at a predefined reference value. Thus, the output voltage from the inverter is of 380 Vrms value, as shown in Figure 12, which is filtered and then fed to the DC bus.
The obtained output voltage from the inverter contains harmonics, which is then filtered out using a second order filter, as shown in Figure 13. The second order filter consists of two first order filters cascaded together with amplification. A three-phase AC load of rating 3 kW is associated with the AC bus. The load considered here is the RL (Resistance-Inductance) load.

4. Case Studies Having Different Generation and Demand Values

In order to achieve the optimal load management, we are introducing a bidirectional converter in between the AC and DC bus. Based on the requirement, the real and reactive power transfer will be varying in each case. Here we are verifying whether the load management is taking place properly by performing different case studies using the MATLAB environment. Each case differs from one another, i.e., sources and the loads will be changed in each case and checked to see whether the generation meets the demands.

4.1. Case I

In case I, a DC source (PV panel) is connected and a 3 phase AC load is connected through a bidirectional converter, as represented in Figure 14. At this time, the real power and reactive power generation from the AC side are zero, as shown in Figure 15 and Figure 16, since only DC load is considered, and thus, the power factor is also zero. Since only the AC load of rating 3 kW is considered, the total demand is 3.13 kW, as shown in Figure 17. Reactive power demand from the load side is represented in Figure 18.The total power generated from a solar panel is 4 kW, and thus, the bidirectional converter transfers power of about 3.13 kW to the AC side to meet the AC side load demand, as shown in Figure 19. Reactive power delivered from the bidirectional converter is shown in Figure 20. In addition to that, the bidirectional converter also injects reactive power in order to improve the power factor so that losses are minimized, as shown in Table 3.
Real power demand and output from bidirectional converter:
Real power demand = Base MVA ∗ Real power transferred 30 × 10 3 × 0.00313 = 0.939   kW   f o r   1   p h a s e = 3   kW   f o r   3   p h a s e
Reactive power demand and output from bidirectional converter:
Reactive power demand = Base MVA ∗ Reactive power transferred 30 × 10 3 × 0.003093 = 0.9272   kVAR   f o r   1   p h a s e = 2.8   kVAR   f o r   3   p h a s e

4.2. Case II

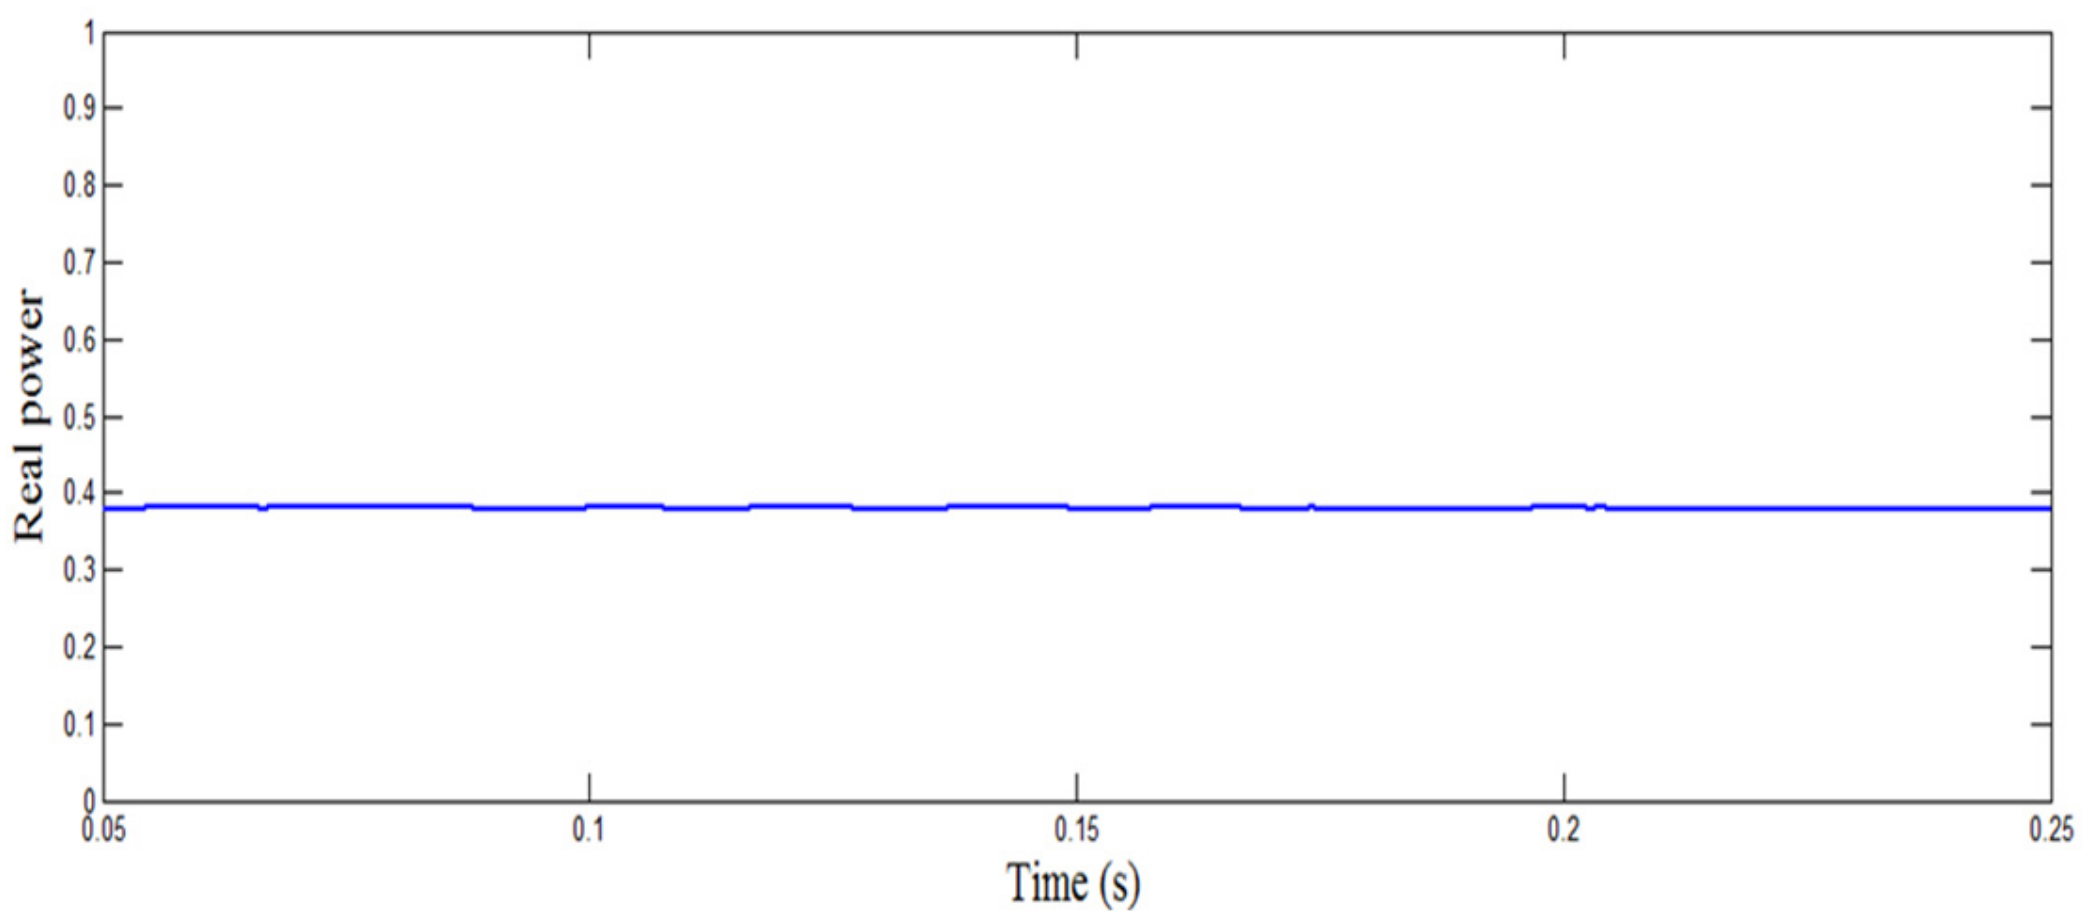
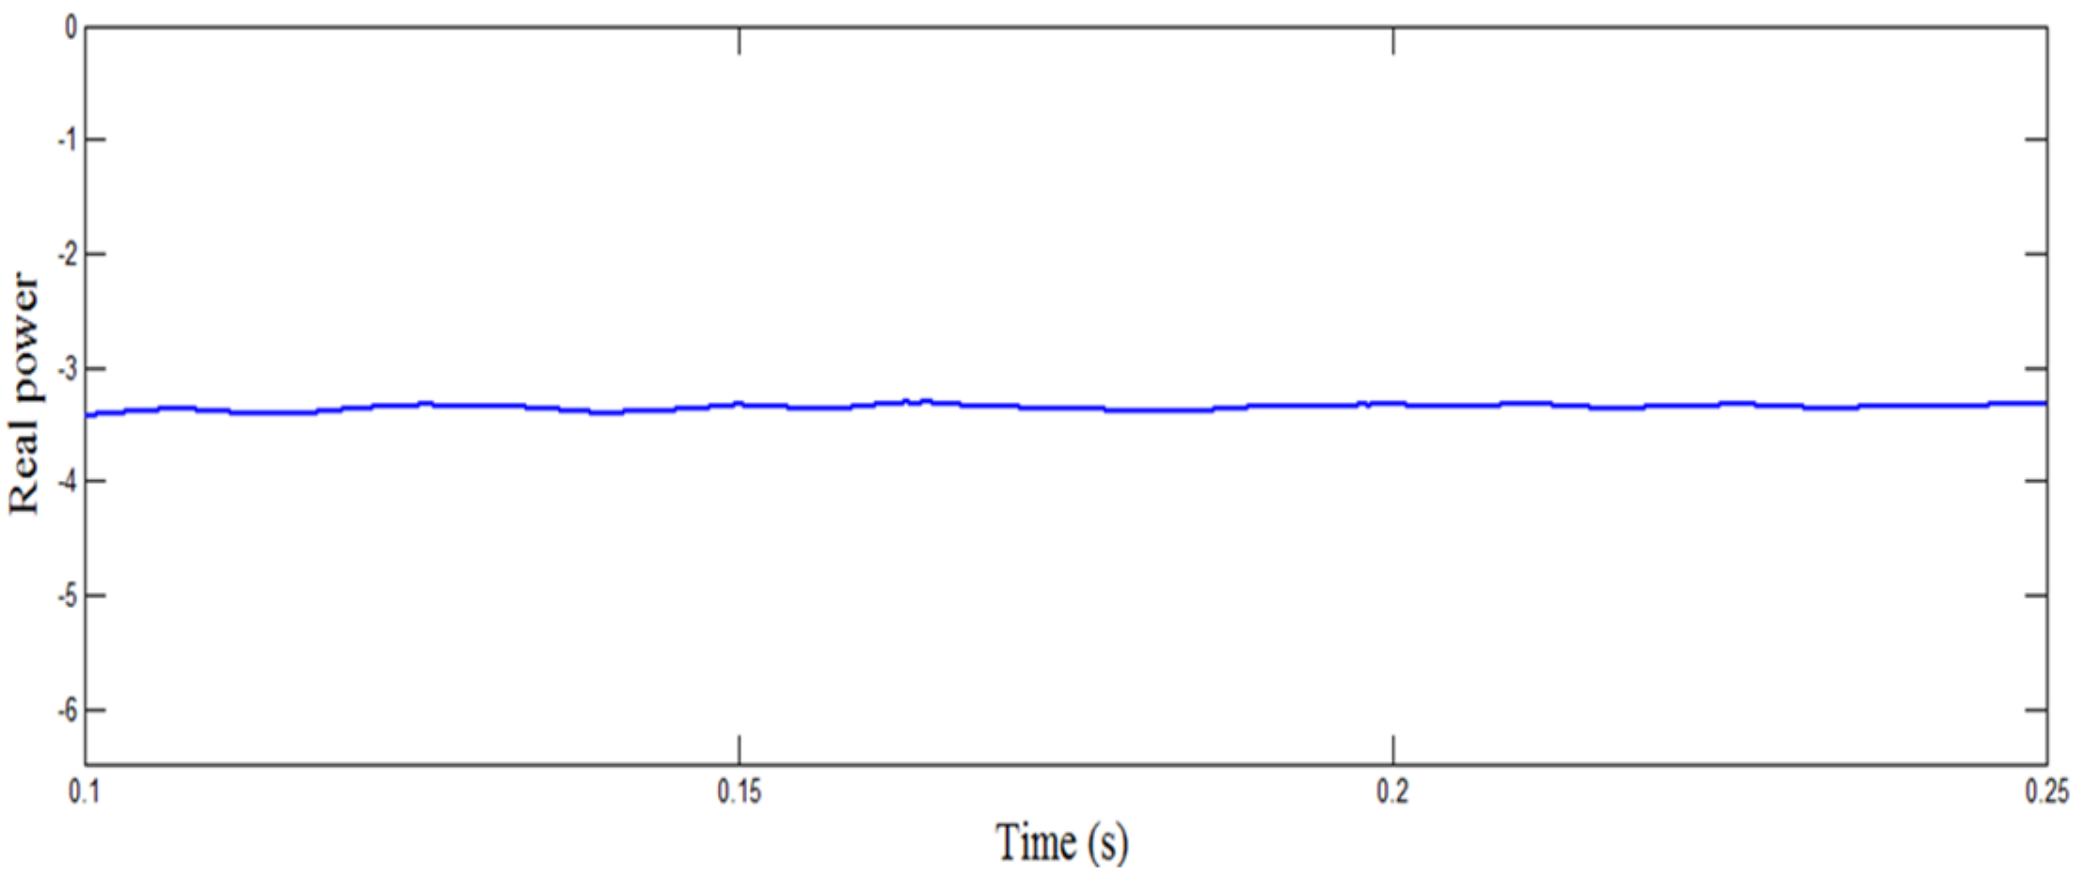
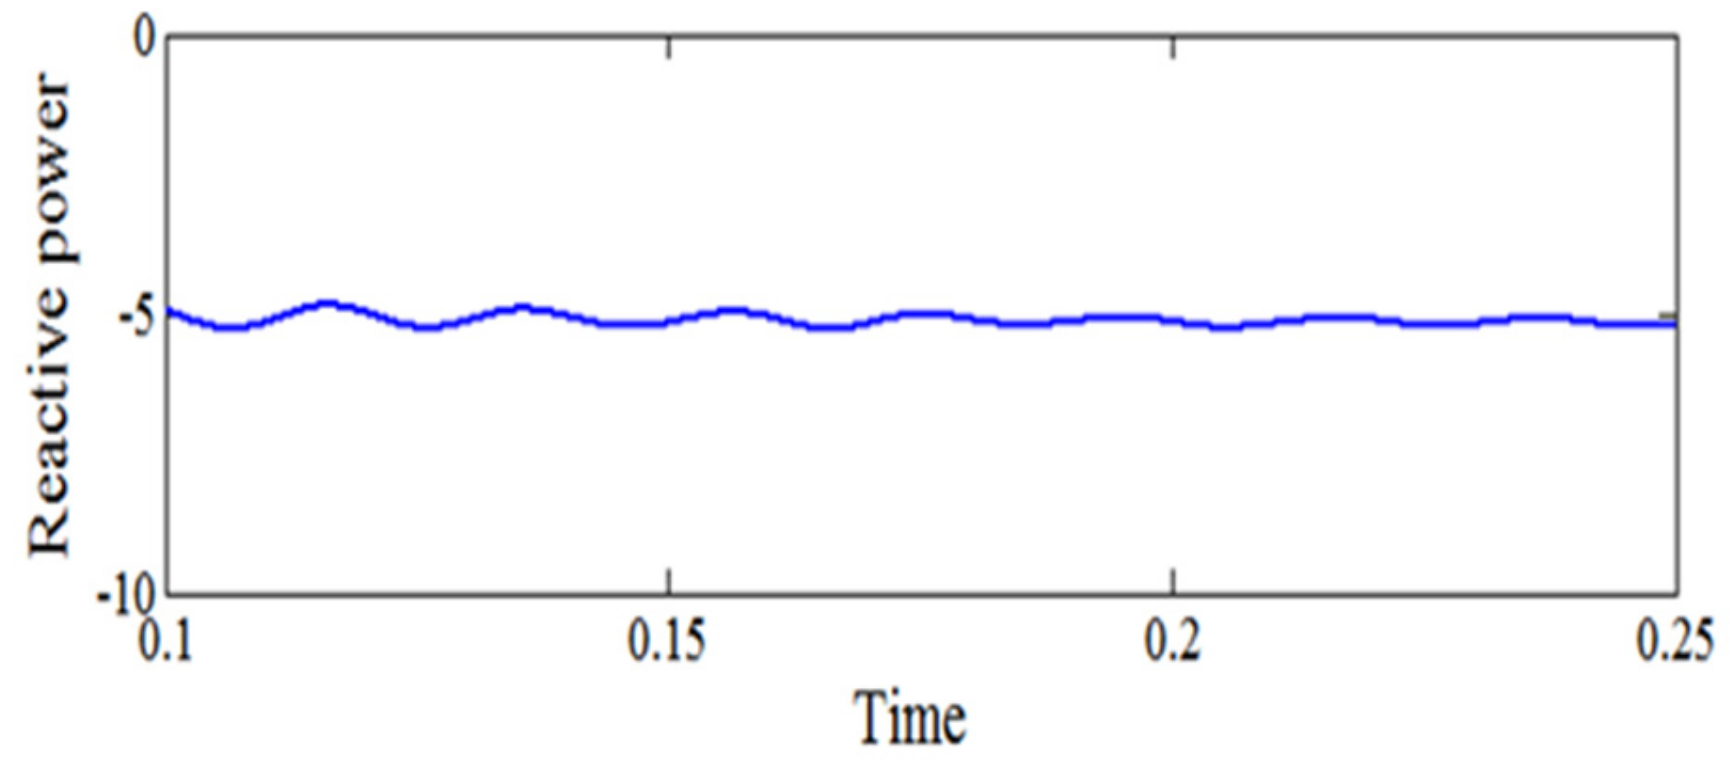
In case II, an AC source (wind turbine) is connected and a DC load is connected through a bidirectional converter, as represented in Figure 21. At this time, the real power and reactive power generation from the AC side is 4.395 kW, as shown in Figure 22, and 5.202 kVAR, as shown in Figure 23. The power factor at the source side is 0.6454. Since only 4 kW DC load is considered, the total demand is 4 kW, as shown in Figure 24. The reactive power demand from the load side is represented in Figure 25. The total power generated from a solar panel is 4 kW, and thus, the bidirectional converter transfers power of about 3.32 kW to the AC side to meet the AC side load demand shown in Figure 26. The delivered reactive power from the bidirectional converter is shown in Figure 27. In addition to that, the bidirectional converter also injects reactive power in order to improve the power factor so that losses are minimized, as shown in Table 3.
Real power and Reactive power demand:
Real power demand = Base MVA ∗ Real power transferred 5 × 10 3 × 0.3786 = 1.89   kW
Reactive power demand = Base MVA ∗ Reactive power transferred 5 × 10 3 × 0.3786 = 2 kVAR
Real power output from bidirectional converter = Base MVA ∗ Real power transferred 5 × 10 3 × 0.3786 = 1.660   kW

4.3. Case III

In case III, a wind source is connected with an AC and a DC load through a bidirectional converter, as shown in Figure 28. At this time, the real power and reactive power generation from wind side are 4.73 kW, as shown in Figure 29, and 4.746 kVAR, as shown in Figure 30. The power factor at the source side is 0.5, since only the wind source is considered; the total demand is 7 kW as shown in Figure 31. Reactive power demand from the load side is shown in Figure 32. The total power generated from a wind source is 9 kW, and thus, the bidirectional converter transfers power of about 3.462 kW to the DC side to meet the DC side load demand, as shown in Figure 33. The delivered reactive power from the bidirectional converter is shown in Figure 34. In addition to that, the bidirectional converter also injects reactive power in order to improve the power factor so that losses are minimized, as shown in Table 3.

4.4. Case IV

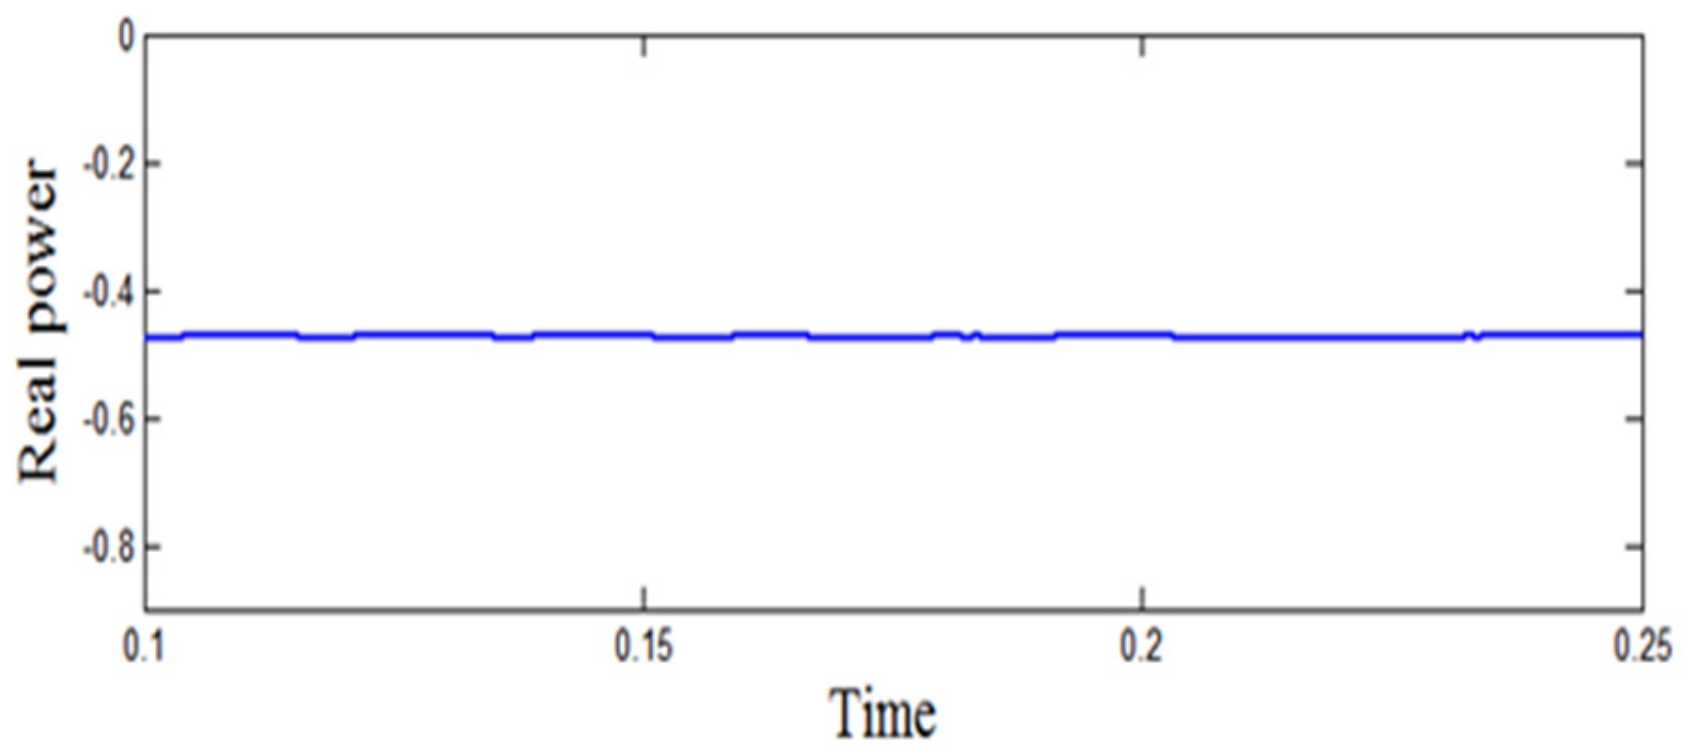
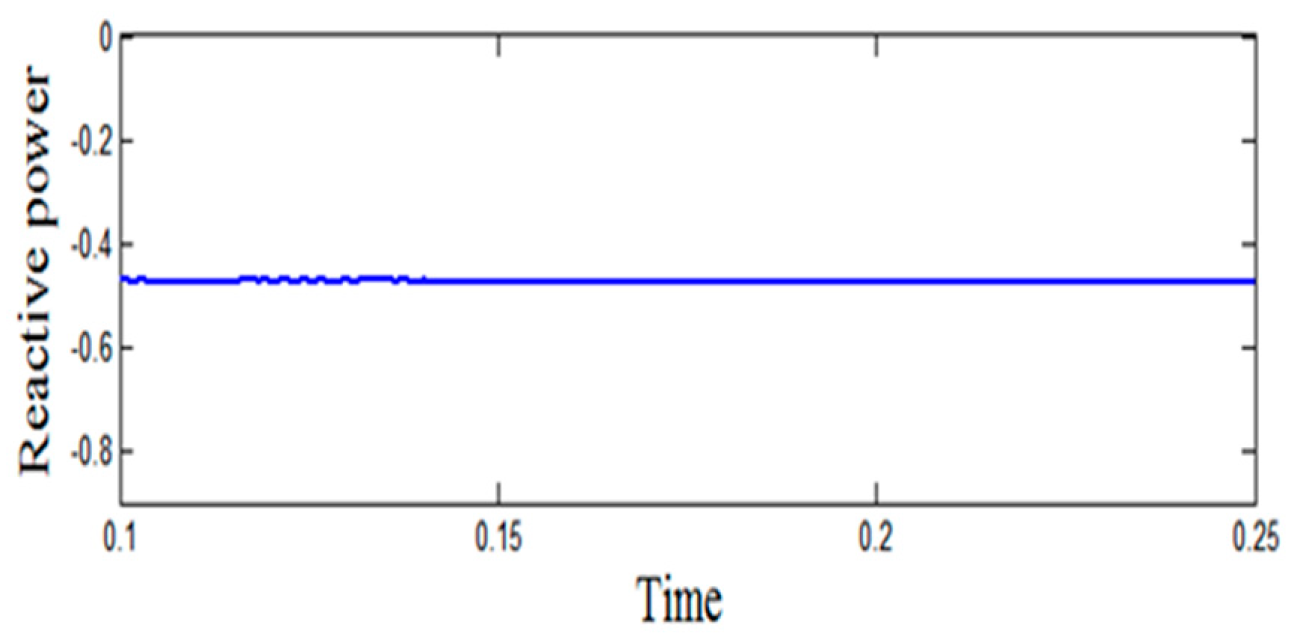
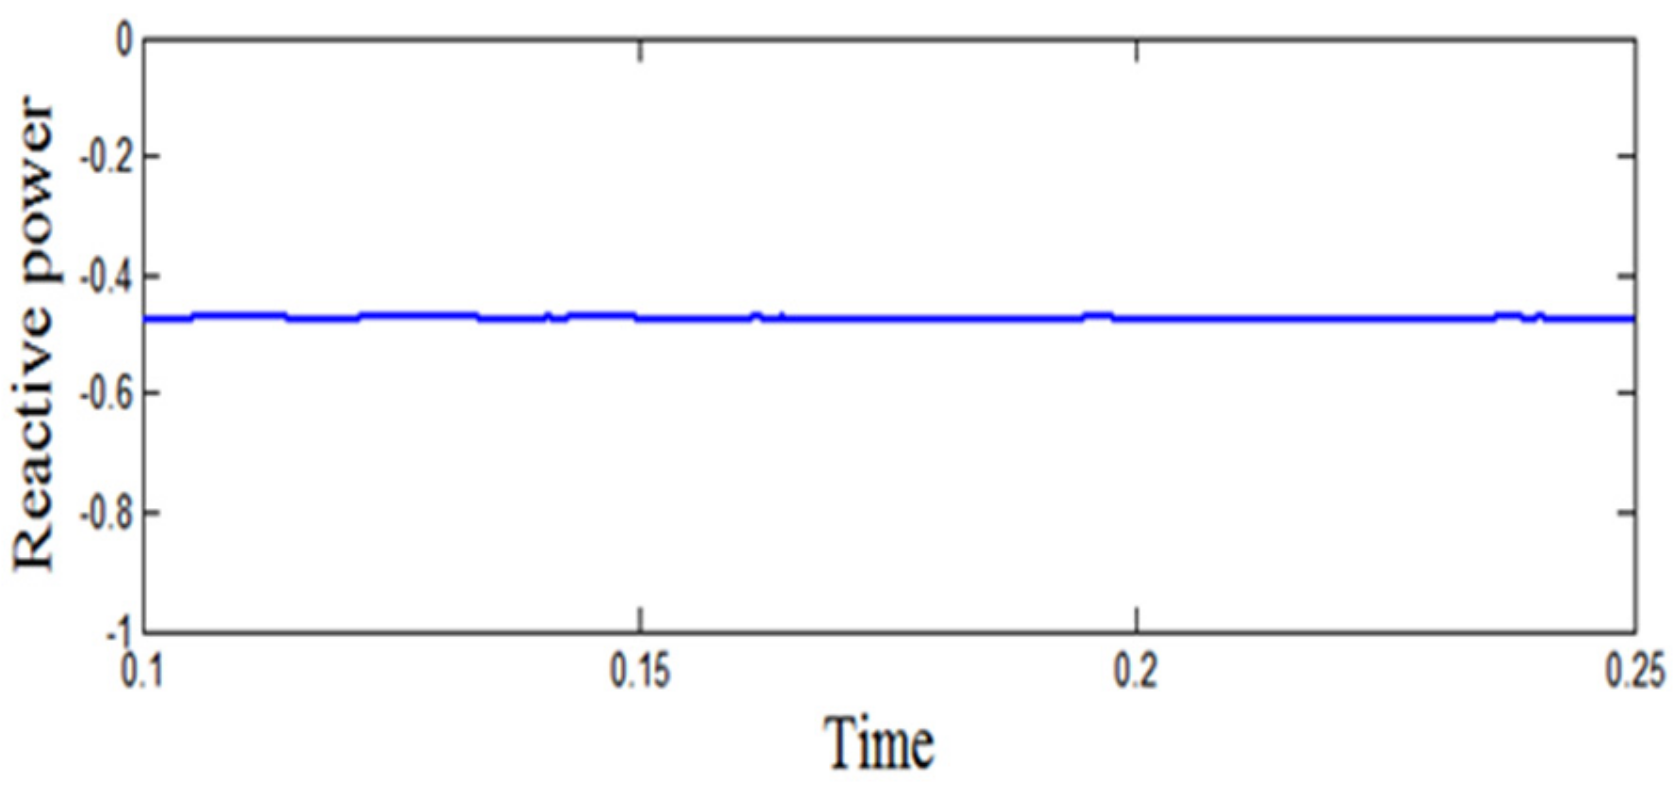
In case IV, a wind source is connected with an AC and a DC load through a bidirectional converter, as shown in Figure 35. At this time, the real power and reactive power generation from wind side are 3.832 kW, as shown in Figure 36, and 4.021 kVAR, as shown in Figure 37. The power factor at the source side is 0.645, since only the wind source is considered; the total demand is 7 kW, as shown in Figure 38. Reactive power demand from the load side is represented in Figure 39. The total power generated from a wind source is 15 kW, and thus, the bidirectional converter transfers power of about 5.204 kW to the DC side to meet the DC side load demand, as shown in Figure 40. Real power delivered from the bidirectional converter is represented in Figure 41.
In addition to that, the bidirectional converter also injects reactive power in order to improve the power factor so that losses are minimized, as shown in Table 3. The performance of the test system is analyzed via four case studies pertaining to various performance indices, such as real power generated, real power transferred, and power factor enhancement, clearly illustrated in Table 3.

5. Conclusions

In this work, a microgrid system comprising a photovoltaic and wind energy conversion system employing PMSG integrated with a battery energy storage system was investigated using an optimal load management technique. A sliding mode controlled MPPT algorithm was employed to track the higher performance of PV at a constant temperature and irradiation, which overcomes the drawbacks in [57]. Additionally, it can also be noted that in most of the existing literature, power factor enhancement is attained only in the range of 10% to 15% for a 3 kW AC system. In the proposed work for the same 3 kW system, the power factor enhancement was attained between 20% to 40%. The simulation results from the converter-based model affirm the solidness of the converter and the way that the control framework can track the reference waveform with great dynamic execution. The wind energy conversion system with PMSG has been implemented to obtain reduced size and weight, absence of gearbox, no field copper loss, and lower maintenance cost. Power variation due to intermittent wind energy was flattened using battery storage. Use of bidirectional converter satisfies the load demand, and the generated power accordingly increases the system efficiency and saves power. By estimating the AC microgrid frequency and the DC microgrid voltage and utilizing the proposed bidirectional converter, the power administration system gives the power reference to the controller to share the power request between the current power sources in both AC and DC microgrids. Further, when solar and wind power systems were employed together, the reliability of the system was enhanced. This also lessens the reliance on a single source and has expanded the reliability. Moreover, the controller parameters have been investigated under a few working conditions with different generation and demand values. Along these lines, the productivity of the framework increments is contrasted with that of a single generation unit.

Author Contributions

Conceptualization, Software validation and Writing-original draft—R.M.E.; Data Curation—A.K. and M.S.; Review & Editing—T.K.M. and A.G.

Funding

This research received no external funding.

Conflicts of Interest

The authors declare no conflicts of interest.

Nomenclature

PgTotal power generated (kW)
PpvPower generated from the solar PV panel (kW)
PwPower generated from the wind turbine (kW)
NsNumber of cells connected in series
NpThe number of cells connected in parallel
PmThe power of each module
η pvgThe efficiency of PV generation
ApvgEffective surface area of PV generator
GtEffective solar irradiation (W/ m 2 )
η pcThe efficiency of power conditioning (Equals to 1 when MPPT used)
BThe temperature coefficient
η rThe efficiency of the reference module
TcrefThe temperature of the reference cell in ° C
TaAmbient temperature
NOCTNominal operating cell temperature
WECSWind Energy Conversion System
SMCSliding Mode Control
DFIGDoubly Fed Induction Generator
PMSGPermanent Magnet Synchronous Generator
SOCState of Charging
SVPWMSpace Vector Pulse Width Modulation
RLResistance Inductance
cpPower coefficient
AIntercepting area of the rotor blades ( m 2 )
ρ Air density (kg/ m 2 )
ωThe angular velocity (rad/s)
rThe radius of WTG (m)
VwAverage wind speed (m/s)
vcCut in wind speed
vFCut off wind speed
vRRated wind speed
PRRated electrical power output
p.uper unit

References

  1. Bauer, A.; Menrad, K. Standing up for the Paris Agreement: Do global climate targets influence individuals’ greenhouse gas emissions? Environ. Sci. Policy 2019, 99, 72–79. [Google Scholar] [CrossRef]
  2. Atwa, Y.M.; El-Saadany, E.F.; Salama, M.M.A.; Seethapathy, R. Optimal renewable resources mix for distribution system energy loss minimization. IEEE Trans. Power Syst. 2010, 25, 360–370. [Google Scholar] [CrossRef]
  3. Hirsch, A.; Parag, Y.; Guerrero, J. Microgrids: A review of technologies, key drivers, and outstanding issues. Renew. Sustain. Energy Rev. 2018, 90, 402–411. [Google Scholar] [CrossRef]
  4. Rajvikram, M. The motivation for Renewable Energy and its Comparison with Other Energy Sources: A Review. Eur. J. Sustain. Dev. Res. 2019, 3, em0076. [Google Scholar]
  5. Justo, J.J.; Mwasilu, F.; Lee, J.; Jung, J.W. AC-microgrids versus DC-microgrids with distributed energy resources: A review. Renew. Sustain. Energy Rev. 2013, 24, 387–405. [Google Scholar] [CrossRef]
  6. Alam, M.N. Overcurrent protection of AC microgrids using mixed characteristic curves of relays. Comput. Electr. Eng. 2019, 74, 74–88. [Google Scholar] [CrossRef]
  7. Van den Broeck, G.; Stuyts, J.; Driesen, J. A critical review of power quality standards and definitions applied to DC microgrids. Appl. Energy 2018, 229, 281–288. [Google Scholar] [CrossRef]
  8. Kumar, J.; Agarwal, A.; Agarwal, V. A review on overall control of DC microgrids. J. Energy Storage 2019, 21, 113–138. [Google Scholar] [CrossRef]
  9. Correa-Betanzo, C.; Calleja, H.; Aguilar, C. Photovoltaic-based DC microgrid with partial shading and fault tolerance. J. Mod. Power Syst. Clean Energy 2019, 7, 340–349. [Google Scholar] [CrossRef]
  10. Rajvikram, M.; Leoponraj, S. A method to attain power optimality and efficiency in solar panel. Beni Suef Univ. J. Basic Appl. Sci. 2018, 7, 705–708. [Google Scholar] [CrossRef]
  11. Elfeqy, H.; Shahin, M.; Al-Rumaihi, A.; Massoud, A.; Gastli, A. A highly efficient PV power system for DC MicroGrids. In Proceedings of the 2016 IEEE Symposium on Computer Applications & Industrial Electronics, Batu Feringghi, Malaysia, 30–31 May 2016; pp. 183–188. [Google Scholar]
  12. Rajvikram, M.; Leoponraj, S.; Ramkumar, S.; Akshaya, H.; Dheeraj, A. Experimental investigation on the abasement of operating temperature in solar photovoltaic panel using PCM and aluminium 2019. Sol. Energy J. 2019, 188, 327–338. [Google Scholar]
  13. Loh, P.C.; Li, D.; Chai, Y.K.; Blaabjerg, F. Autonomous control of interlinking converter with energy storage in hybrid AC-DC microgrid. IEEE Trans. Ind. Appl. 2013, 49, 1374–1382. [Google Scholar] [CrossRef]
  14. Unamuno, E.; Barrena, J.A. Hybrid ac/dc microgrids-Part I: Review and classification of topologies. Renew. Sustain. Energy Rev. 2015, 52, 1251–1259. [Google Scholar] [CrossRef]
  15. Ahmadi, S.; Abdi, S. Application of the Hybrid Big Bang-Big Crunch algorithm for optimal sizing of a stand-alone hybrid PV/wind/battery system. Sol. Energy 2016, 134, 366–374. [Google Scholar] [CrossRef]
  16. Kaabeche, A.; Belhamel, M.; Ibtiouen, R. Sizing optimization of grid-independent hybrid photovoltaic/wind power generation system. Energy 2011, 36, 1214–1222. [Google Scholar] [CrossRef]
  17. Kane, S.N.; Mishra, A.; Dutta, A.K. Preface: International Conference on Recent Trends in Physics (ICRTP 2016). J. Phys. Conf. Ser. 2016, 755. [Google Scholar] [CrossRef]
  18. Maleki, A.; Rosen, M.A.; Pourfayaz, F. Optimal operation of a grid-connected hybrid renewable energy system for residential applications. Sustainability 2017, 9, 1314. [Google Scholar] [CrossRef]
  19. Wu, H.; Locment, F.; Sechilariu, M. Experimental Implementation of a Flexible PV Power Control Mechanism in a DC Microgrid. Energies 2019, 12, 1233. [Google Scholar] [CrossRef]
  20. Sarkar, T.; Bhattacharjee, A.; Samanta, H.; Bhattacharya, K.; Saha, H. Optimal design and implementation of solar PV-wind-biogas-VRFB storage integrated smart hybrid microgrid for ensuring zero loss of power supply probability. Energy Convers. Manag. 2019, 191, 102–118. [Google Scholar] [CrossRef]
  21. Zhang, W.; Maleki, A.; Rosen, M.A.; Liu, J. Sizing a stand-alone solar-wind-hydrogen energy system using weather forecasting and a hybrid search optimization algorithm. Energy Convers. Manag. 2019, 180, 609–621. [Google Scholar] [CrossRef]
  22. Shi, W.; Xie, X.; Chu, C.C.; Gadh, R. Distributed Optimal Energy Management in Microgrids. IEEE Trans. Smart Grid 2015, 6, 1137–1146. [Google Scholar] [CrossRef]
  23. Choudar, A.; Boukhetala, D.; Barkat, S.; Brucker, J.M. A local energy management of a hybrid PV-storage based distributed generation for microgrids. Energy Convers. Manag. 2015, 90, 21–33. [Google Scholar] [CrossRef]
  24. Yang, L.; Hu, Z.; Xie, S.; Kong, S.; Lin, W. Adjustable virtual inertia control of supercapacitors in PV-based AC microgrid cluster. Electr. Power Syst. Res. 2019, 173, 71–85. [Google Scholar] [CrossRef]
  25. Arani, A.A.K.; Karami, H.; Gharehpetian, G.B.; Hejazi, M.S.A. Review of Flywheel Energy Storage Systems structures and applications in power systems and microgrids. Renew. Sustain. Energy Rev. 2017, 69, 9–18. [Google Scholar] [CrossRef]
  26. Hajiaghasi, S.; Salemnia, A.; Hamzeh, M. Hybrid energy storage system for microgrids applications: A review. J. Energy Storage 2019, 21, 543–570. [Google Scholar] [CrossRef]
  27. Angelopoulos, A.; Ktena, A.; Manasis, C.; Voliotis, S. Impact of a Periodic Power Source on a RES Microgrid. Energies 2019, 12, 1900. [Google Scholar] [CrossRef]
  28. Gai, X.; Wang, Y.; Chen, R.; Zou, L. Research on Hybrid Microgrid Based on Simultaneous AC and DC Distribution Network and Its Power Router. Energies 2019, 12, 1077. [Google Scholar] [CrossRef]
  29. Zhang, G.; Wu, B.; Maleki, A.; Zhang, W. Simulated annealing-chaotic search algorithm based optimization of reverse osmosis hybrid desalination system driven by wind and solar energies. Sol. Energy 2018, 173, 964–975. [Google Scholar] [CrossRef]
  30. Olivares, D.E.; Mehrizi-Sani, A.; Etemadi, A.H.; Cañizares, C.A.; Iravani, R.; Kazerani, M.; Hajimiragha, A.H.; Gomis-Bellmunt, O.; Saeedifard, M.; Palma-Behnke, R.; et al. Trends in microgrid control. IEEE Trans. Smart Grid 2014, 5, 1905–1919. [Google Scholar] [CrossRef]
  31. Meegahapola, L.G.; Robinson, D.; Agalgaonkar, A.P.; Perera, S.; Ciufo, P. Microgrids of commercial buildings: Strategies to manage mode transfer from grid connected to islanded mode. IEEE Trans. Sustain. Energy 2014, 5, 1337–1347. [Google Scholar] [CrossRef]
  32. Korkas, C.D.; Baldi, S.; Michailidis, I.; Kosmatopoulos, E.B. Occupancy-based demand response and thermal comfort optimization in microgrids with renewable energy sources and energy storage. Appl. Energy 2016, 163, 93–104. [Google Scholar] [CrossRef]
  33. Korkas, C.D.; Baldi, S.; Michailidis, I.; Kosmatopoulos, E.B. Intelligent energy and thermal comfort management in grid-connected microgrids with heterogeneous occupancy schedule. Appl. Energy 2015, 149, 194–203. [Google Scholar] [CrossRef]
  34. Loh, P.C.; Li, D.; Chai, Y.K.; Blaabjerg, F. Hybrid AC-DC microgrids with energy storages and progressive energy flow tuning. IEEE Trans. Power Electron. 2013, 28, 1533–1543. [Google Scholar] [CrossRef]
  35. Herisanu, N.; Marinca, V.; Madescu, G.; Dragan, F. Dynamic Response of a Permanent Magnet Synchronous Generator to a Wind Gust. Energies 2019, 12, 915. [Google Scholar] [CrossRef]
  36. Eghtedarpour, N.; Farjah, E. Power control and management in a Hybrid AC/DC microgrid. IEEE Trans. Smart Grid 2014, 5, 1494–1505. [Google Scholar] [CrossRef]
  37. Huang, C.-C.; Tsai, T.-L.; Hsieh, Y.-C.; Chiu, H.-J. A Bilateral Zero-Voltage Switching Bidirectional DC-DC Converter with Low Switching Noise. Energies 2018, 11, 2618. [Google Scholar] [CrossRef]
  38. Lin, B.-R.; Huang, Y.-C. Bidirectional DC Converter with Frequency Control: Analysis and Implementation. Energies 2018, 11, 2450. [Google Scholar] [CrossRef]
  39. Fernández, E.; Paredes, A.; Sala, V.; Romeral, L. A Simple Method for Reducing THD and Improving the Efficiency in CSI Topology Based on SiC Power Devices. Energies 2018, 11, 2798. [Google Scholar] [CrossRef]
  40. Tricarico, T.; Gontijo, G.; Neves, M.; Soares, M.; Aredes, M.; Guerrero, J.M. Control design, stability analysis and experimental validation of new application of an interleaved converter operating as a power interface in hybrid microgrids. Energies 2019, 12, 437. [Google Scholar] [CrossRef]
  41. Lin, P.; Wang, P.; Jin, C.; Xiao, J.; Li, X.; Guo, F.; Zhang, C. A Distributed Power Management Strategy for Multi-Paralleled Bidirectional Interlinking Converters in Hybrid AC/DC Microgrids. IEEE Trans. Smart Grid 2019. [Google Scholar] [CrossRef]
  42. Wang, B.; Xian, L.; Manandhar, U.; Ye, J.; Zhang, X.; Gooi, H.B.; Ukil, A. Hybrid energy storage system using bidirectional single-inductor multiple-port converter with model predictive control in DC microgrids. Electr. Power Syst. Res. 2019, 173, 38–47. [Google Scholar] [CrossRef]
  43. Rajvikram, M. Solutions for Voltage SAG in a Doubly Fed Induction Generator Based Wind Turbine: A review. Power Res. J. 2018, 14, 73–77. [Google Scholar] [CrossRef]
  44. Rajvikram, M.; Renuga, P.; Aravind Kumar, G.; Bavithra, K. Fault Ride-through Capability of Permanent Magnet Synchronous Generator Based Wind Energy Conversion System. Power Res. J. 2016, 12, 531–538. [Google Scholar]
  45. Mousa, M.; Majid, G.; Sumper, A.; Domínguez-García, J.L. Experimental validation of a real-time energy management system using multi-period gravitational search algorithm for microgrids in islanded mode. Appl. Energy 2014, 128, 164–174. [Google Scholar] [Green Version]
  46. Mousa, M.; Seyedeh, S.G.; Hasan, U.; Terrence, F. A real-time evaluation of energy management systems for smart hybrid home Microgrids. Electr. Power Syst. Res. 2017, 143, 624–633. [Google Scholar]
  47. Rajvikram, M.; Renuga, P.; Swathisriranjani, M. Fuzzy based MPPT controller’s role in extraction of maximum power in wind energy conversion system. In Proceedings of the International Conference of Control, Instrumentation, Communication and Computational Technologies IEEE, Kumaracoil, India, 16–17 December 2016; pp. 713–719. [Google Scholar]
  48. Rajvikram, M. Role of Dual Input Fuzzy Controller for the Better Production of Real Power in Wind System. J. Electr. Eng. 2019, 9. Available online: http://www.jee.ro/covers/editions.php?act=art&art=WW1529480547W5b2a056302e88 (accessed on 25 April 2019).
  49. Esram, T.; Chapman, P.L. Comparison of Photovoltaic Array Maximum Power Point Tracking Techniques. IEEE Trans. Energy Convers. 2007, 22, 439–449. [Google Scholar] [CrossRef]
  50. Babaa, S.E.; Armstrong, M.; Pickert, V. Overview of Maximum Power Point Tracking Control Methods for PV Systems. J. Power Energy Eng. 2014, 2, 59–72. [Google Scholar] [CrossRef] [Green Version]
  51. Kollimalla, S.K.; Mishra, M.K. Variable perturbation size adaptive P&O MPPT algorithm for sudden changes in irradiance. IEEE Trans. Sustain. Energy 2014, 5, 718–728. [Google Scholar] [CrossRef]
  52. Elgendy, M.A.; Zahawi, B.; Atkinson, D.J. Operating characteristics of the P&O algorithm at high perturbation frequencies for standalone PV systems. IEEE Trans. Energy Convers. 2015, 30, 189–198. [Google Scholar] [CrossRef]
  53. Pathy, S.; Subramani, C.; Sridhar, R.; Thamizh Thentral, T.M.; Padmanaban, S. Nature-inspired MPPT algorithms for partially shaded PV systems: A comparative study. Energies 2019, 12, 1451. [Google Scholar] [CrossRef]
  54. Chu, C.C.; Chen, C.L. Robust maximum power point tracking method for photovoltaic cells: A sliding mode control approach. Sol. Energy 2009, 83, 1370–1378. [Google Scholar] [CrossRef]
  55. Wu, X.; Wang, Z.; Ding, T.; Li, Z. Hybrid AC/DC Microgrid Planning with Optimal Placement of DC Feeders. Energies 2019, 12, 1751. [Google Scholar] [CrossRef]
  56. Kim, I.S. Sliding mode controller for the single-phase grid-connected photovoltaic system. Appl. Energy 2006, 83, 1101–1115. [Google Scholar] [CrossRef]
  57. Peri, P.G.V.; Paliwal, P.; Joseph, F.C. ACMC-based hybrid AC/LVDC micro-grid. IET Renew. Power Gener. 2016, 11, 521–528. [Google Scholar] [CrossRef]
Figure 1. Hybrid microgrid architecture.
Energies 12 02672 g001
Figure 2. Typical hybrid AC/DC microgrid.
Energies 12 02672 g002
Figure 3. Power generation control flowchart.
Energies 12 02672 g003
Figure 4. Hybrid photovoltaic/wind (AC/DC) microgrid system in MATLAB Simulink environment.
Energies 12 02672 g004
Figure 5. Schematic representation of the Sliding Mode Control algorithm.
Energies 12 02672 g005
Figure 6. Mode controller in MATLAB Simulink environment.
Energies 12 02672 g006
Figure 7. Simulation results of (a) sliding mode controller output; (b) buck-boost converter output voltage (Boost Mode); (c) Buck converter output voltage.
Energies 12 02672 g007
Figure 8. The photovoltaic system coupled with the DC bus.
Energies 12 02672 g008
Figure 9. Permanent magnet synchronous generator (PMSG)-based wind energy conversion system (WECS).
Energies 12 02672 g009
Figure 10. Schematic diagram of PMSG connected to back to back converters.
Energies 12 02672 g010
Figure 11. State of Charging (%) of wind-powered battery.
Energies 12 02672 g011
Figure 12. Output waveforms from PMSG.
Energies 12 02672 g012
Figure 13. Three phase output voltage with filter.
Energies 12 02672 g013
Figure 14. Block diagram of Case I.
Energies 12 02672 g014
Figure 15. Real power from generation.
Energies 12 02672 g015
Figure 16. Reactive power from generation.
Energies 12 02672 g016
Figure 17. Real power demand from the load side.
Energies 12 02672 g017
Figure 18. Reactive power demand from the load side.
Energies 12 02672 g018
Figure 19. Real power from the bidirectional converter.
Energies 12 02672 g019
Figure 20. Reactive power from the bidirectional converter.
Energies 12 02672 g020
Figure 21. Block diagram of Case II.
Energies 12 02672 g021
Figure 22. Real power from generation.
Energies 12 02672 g022
Figure 23. Power from generation.
Energies 12 02672 g023
Figure 24. Real power demand from the load side.
Energies 12 02672 g024
Figure 25. Reactive power demand from the load side.
Energies 12 02672 g025
Figure 26. Real power from the bidirectional converter.
Energies 12 02672 g026
Figure 27. Reactive power from the bidirectional converter.
Energies 12 02672 g027
Figure 28. Block diagram of case III.
Energies 12 02672 g028
Figure 29. Real power from generation.
Energies 12 02672 g029
Figure 30. Reactive power from generation.
Energies 12 02672 g030
Figure 31. Real power demand from the load side.
Energies 12 02672 g031
Figure 32. Reactive power demand from the load side.
Energies 12 02672 g032
Figure 33. Real power from bidirectional converter.
Energies 12 02672 g033
Figure 34. Reactive power from bidirectional converter.
Energies 12 02672 g034
Figure 35. Block diagram of Case IV.
Energies 12 02672 g035
Figure 36. Real power from generation.
Energies 12 02672 g036
Figure 37. Reactive power from generation.
Energies 12 02672 g037
Figure 38. Real power demand from the load side.
Energies 12 02672 g038
Figure 39. Reactive power demand from the load side.
Energies 12 02672 g039
Figure 40. Real power from bidirectional converter.
Energies 12 02672 g040
Figure 41. Real power from bidirectional converter.
Energies 12 02672 g041
Table 1. AC network parameters.
Sl. NoElementsParameter Value
1Bus 1380 V
2PMSG3 kW
Table 2. DC network parameters.
Sl. NoElementsParameters Value
1Bus 1120 V
2Bus 2700 V
3PV array 14 kW, 120 V
4Buck-boost converter200 V/120 V, 1 kW
5Boost converter700 V/200 V, 1 kW
6Load700 V/200 V, 4 kW
7DC link bus voltage700 V
Table 3. Results for the case study.
Different CasesAC LoadDC LoadTotal LoadReal Power GeneratedReal Power TransferredPower Factor Enhancement (%)
I: Solar + Bidirectional Converter + AC Load3 kW03 kW4 kW3.13 kW71
II: Wind + Bidirectional Converter + DC Load04 kW4 kW4.395 kW3.32 kW8
III: Wind + Bidirectional Converter +AC Load + DC Load3 kW4 kW7 kW9 kW3.462 kW41
IV: Wind + Bidirectional Converter + AC Load + DC Load + Utility3 kW4 kW7 kW15 kW5.204 kW9