1. Introduction
Over the past century, energy consumption reduction has received much attention in various research fields. In heat transfer systems such as heat exchangers and electronic components, many researchers have focused on the reduction of energy consumption called heat transfer enhancement [
1,
2]. As recent systems are becoming compact in size, shape, and weight, traditional methods of heat transfer are inadequate. To improve heat transfer performance in miniaturized systems, nanofluids, which are liquids containing nanometer-sized particles called nanoparticles, were introduced in 1995 by Choi and Eastman [
3]. Nanofluids showed better thermal characteristics than base fluids. Since then, various studies have been widely conducted in the research fields of heat transfer using nanofluids, and it is found that the addition of nanoparticles affects thermo-physical properties such as thermal conductivity, viscosity, and surface tension [
4,
5,
6,
7,
8,
9,
10,
11,
12,
13].
In addition to conductive heat transfer related to thermo-physical properties, convective heat transfer using nanofluids has also been studied [
13,
14,
15,
16,
17]. The Nusselt number for nanofluids is different to that for base fluids. This means that the addition of nanoparticles alters the convective heat transfer mechanism. To design an efficient heat exchanger with nanofluid convection, a prerequisite is precise understanding of the mechanism. Therefore, many researchers have proposed several mechanisms including the effect of Brownian motion, thermophoresis, and aggregation to explain the alteration of convective heat transfer due to the suspension of nanoparticles in a simple fluid [
13,
17,
18]. These theories were derived based on the investigation of flow phenomena using numerical simulation because convective heat transfer is closely related to mass transfer by flows. However, these theories have not been experimentally validated because there is no detailed experimental flow information yet.
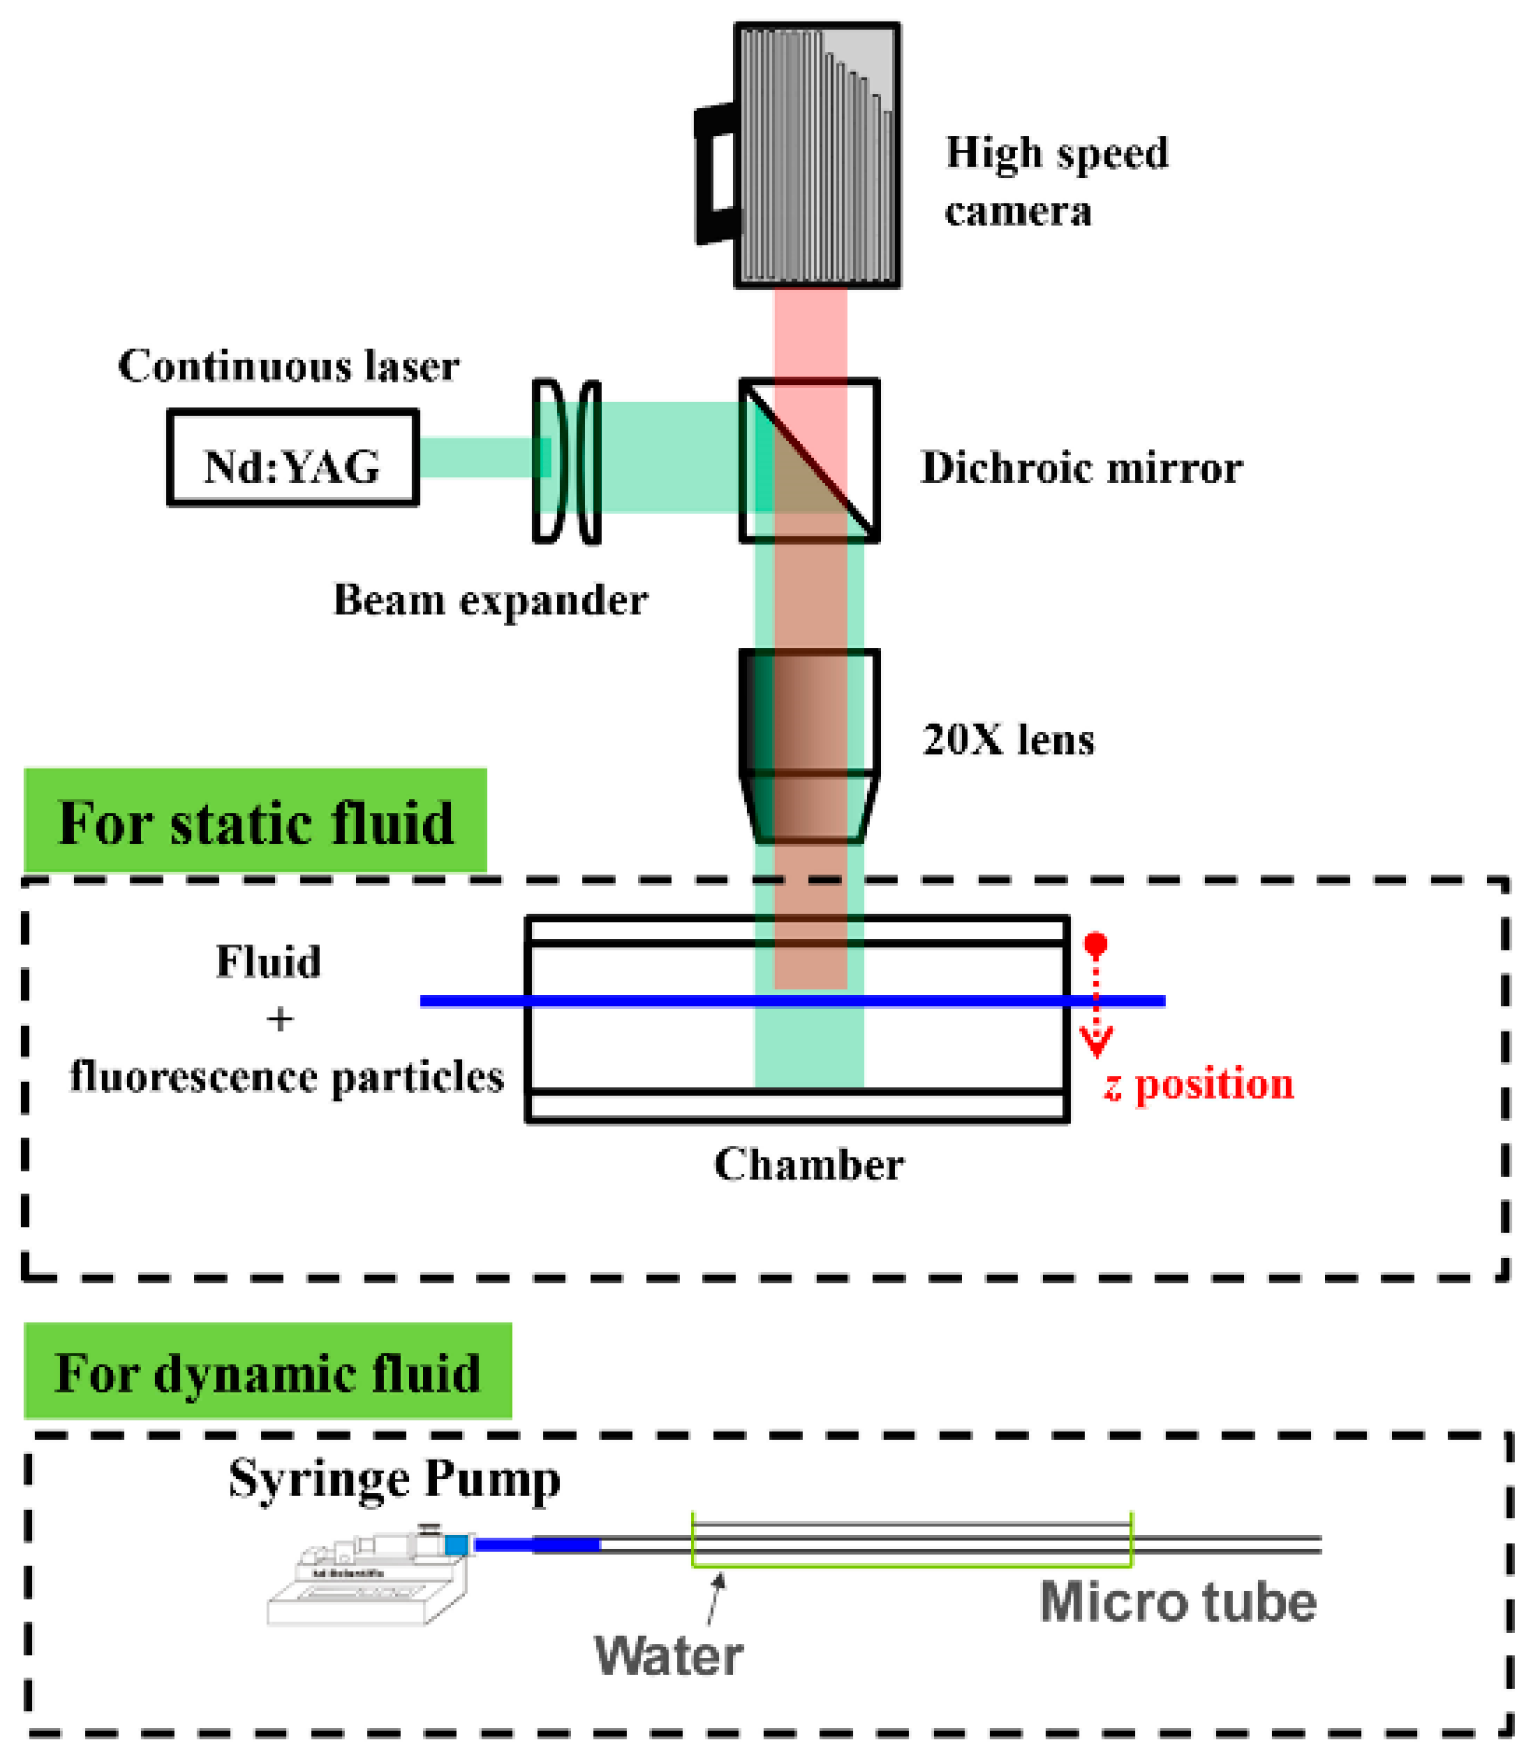
To measure the quantitative velocities of fluid flows, various techniques including hot wire, pitot tube, laser Doppler velocimetry (LDV), and particle image velocimetry (PIV) have been commonly employed [
19]. The hot-wire and pitot-tube methods use a probe, which can disturb flows. LDV is a non-intrusive measurement method. However, it is not suitable for measuring information about the entire velocity field of fluid flows because it is a point-wise measurement technique. PIV is a non-intrusive optical technique measuring two-dimensional velocity fields with a high spatial resolution. Recently, PIV using tracing particles seeded in a working fluid has come to be utilized as a powerful and reasonable velocity field information measurement technique [
20]. In a conventional PIV technique, a thin light sheet generated by laser and optics illuminates a plane in the flow and scattered light from a seeded particle is recorded using a camera with a macro lens. The incident laser light sheet is not retained owing to light absorption, diffraction, and refraction caused by the suspended nanoparticles in the nanofluids. Therefore, the conventional PIV technique using a laser sheet is inapplicable to measure the velocity field information of nanofluids.
Santiago et al. [
21] introduced a micro-PIV (μ-PIV) system in which a microscope was implemented as a key element. In the μ-PIV technique, light is illuminated on the volume instead of a thin light sheet. The location and thickness of the measurement plane are determined by the focal plane and numerical aperture of an objective lens, respectively. To our knowledge, only Walsh et al. [
22] attempted to measure nanofluid flows using the μ-PIV technique. Although the study suggested the measurement feasibility with a qualitative observation, no research has been reported on the velocity field measurement of nanofluid flows using the μ-PIV technique since then because of the lack of systematic quantitative analysis of the measurement accuracy, which is essential for practical use.
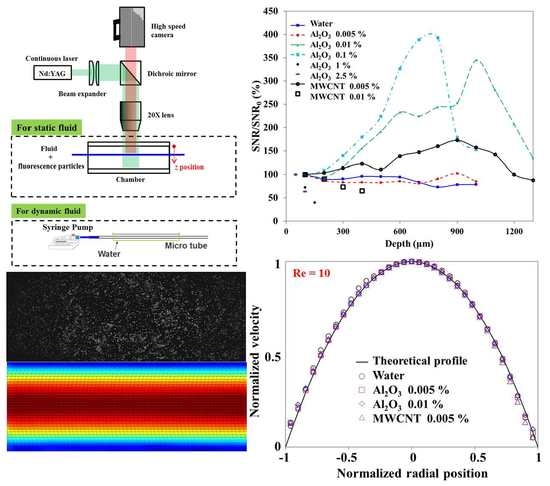
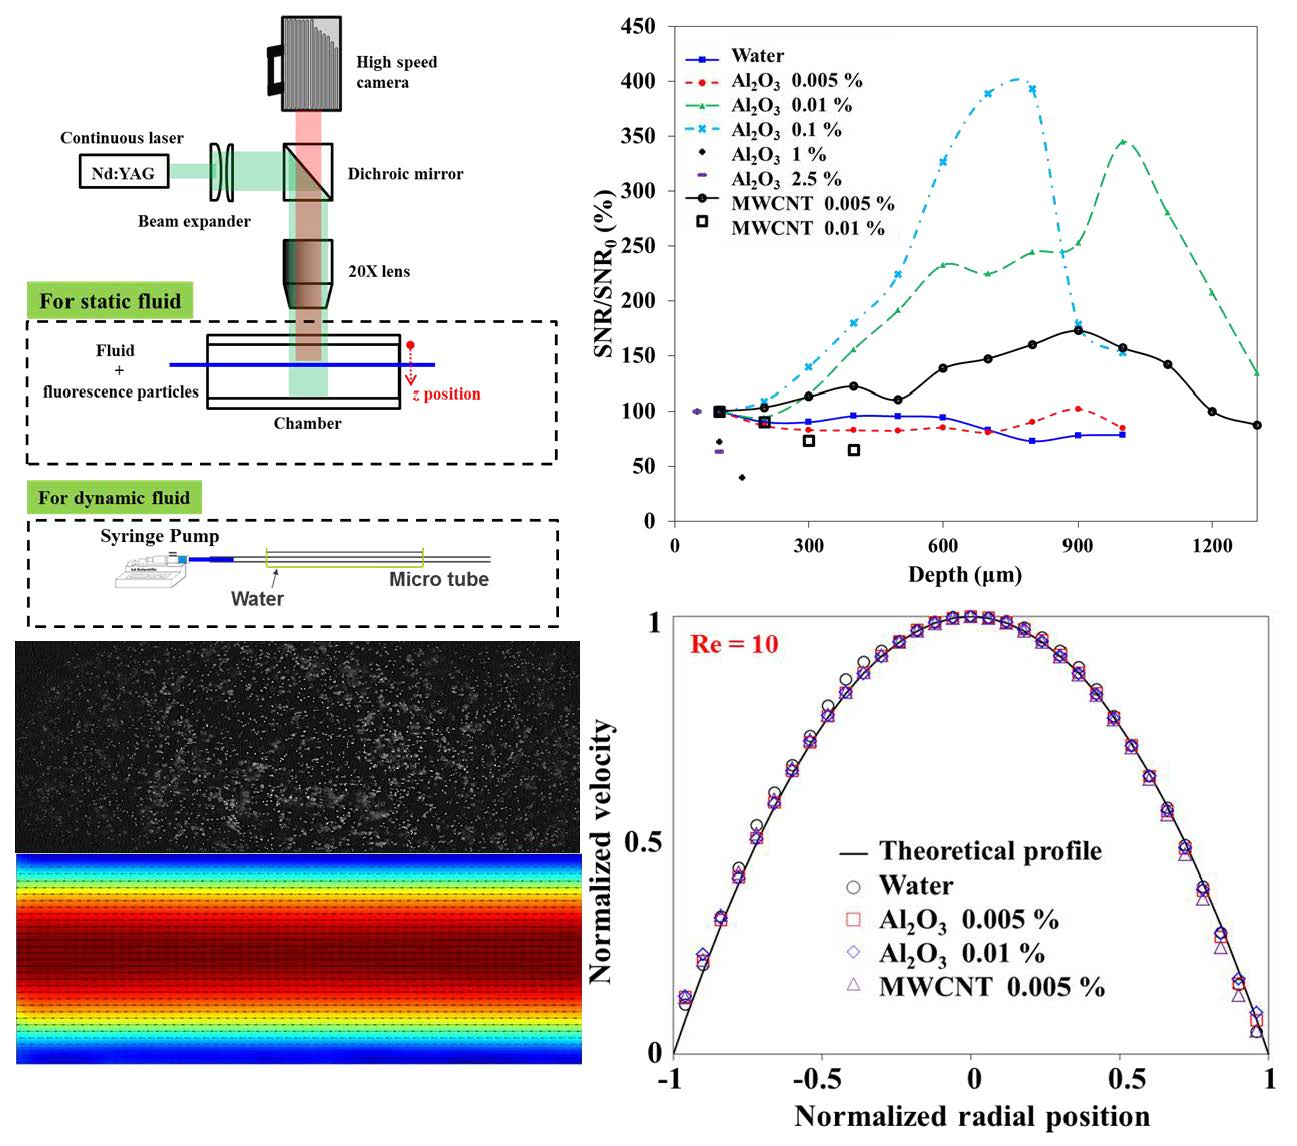
In this study, we systematically analyze the measurement accuracy of the μ-PIV technique for measuring nanofluid flows. Al2O3 and multi-walled carbon nanotube (MWCNT) nanofluids at various concentrations are used as test samples. To quantify the effect of focal depth on the measurement accuracy, a cross-correlation signal-to-noise ratio (SNR) is calculated using static images acquired at various depths. Velocity fields of simple tube flows are measured to investigate the effects of particle motion and velocity gradient on the measurement accuracy.
3. Results and Discussion
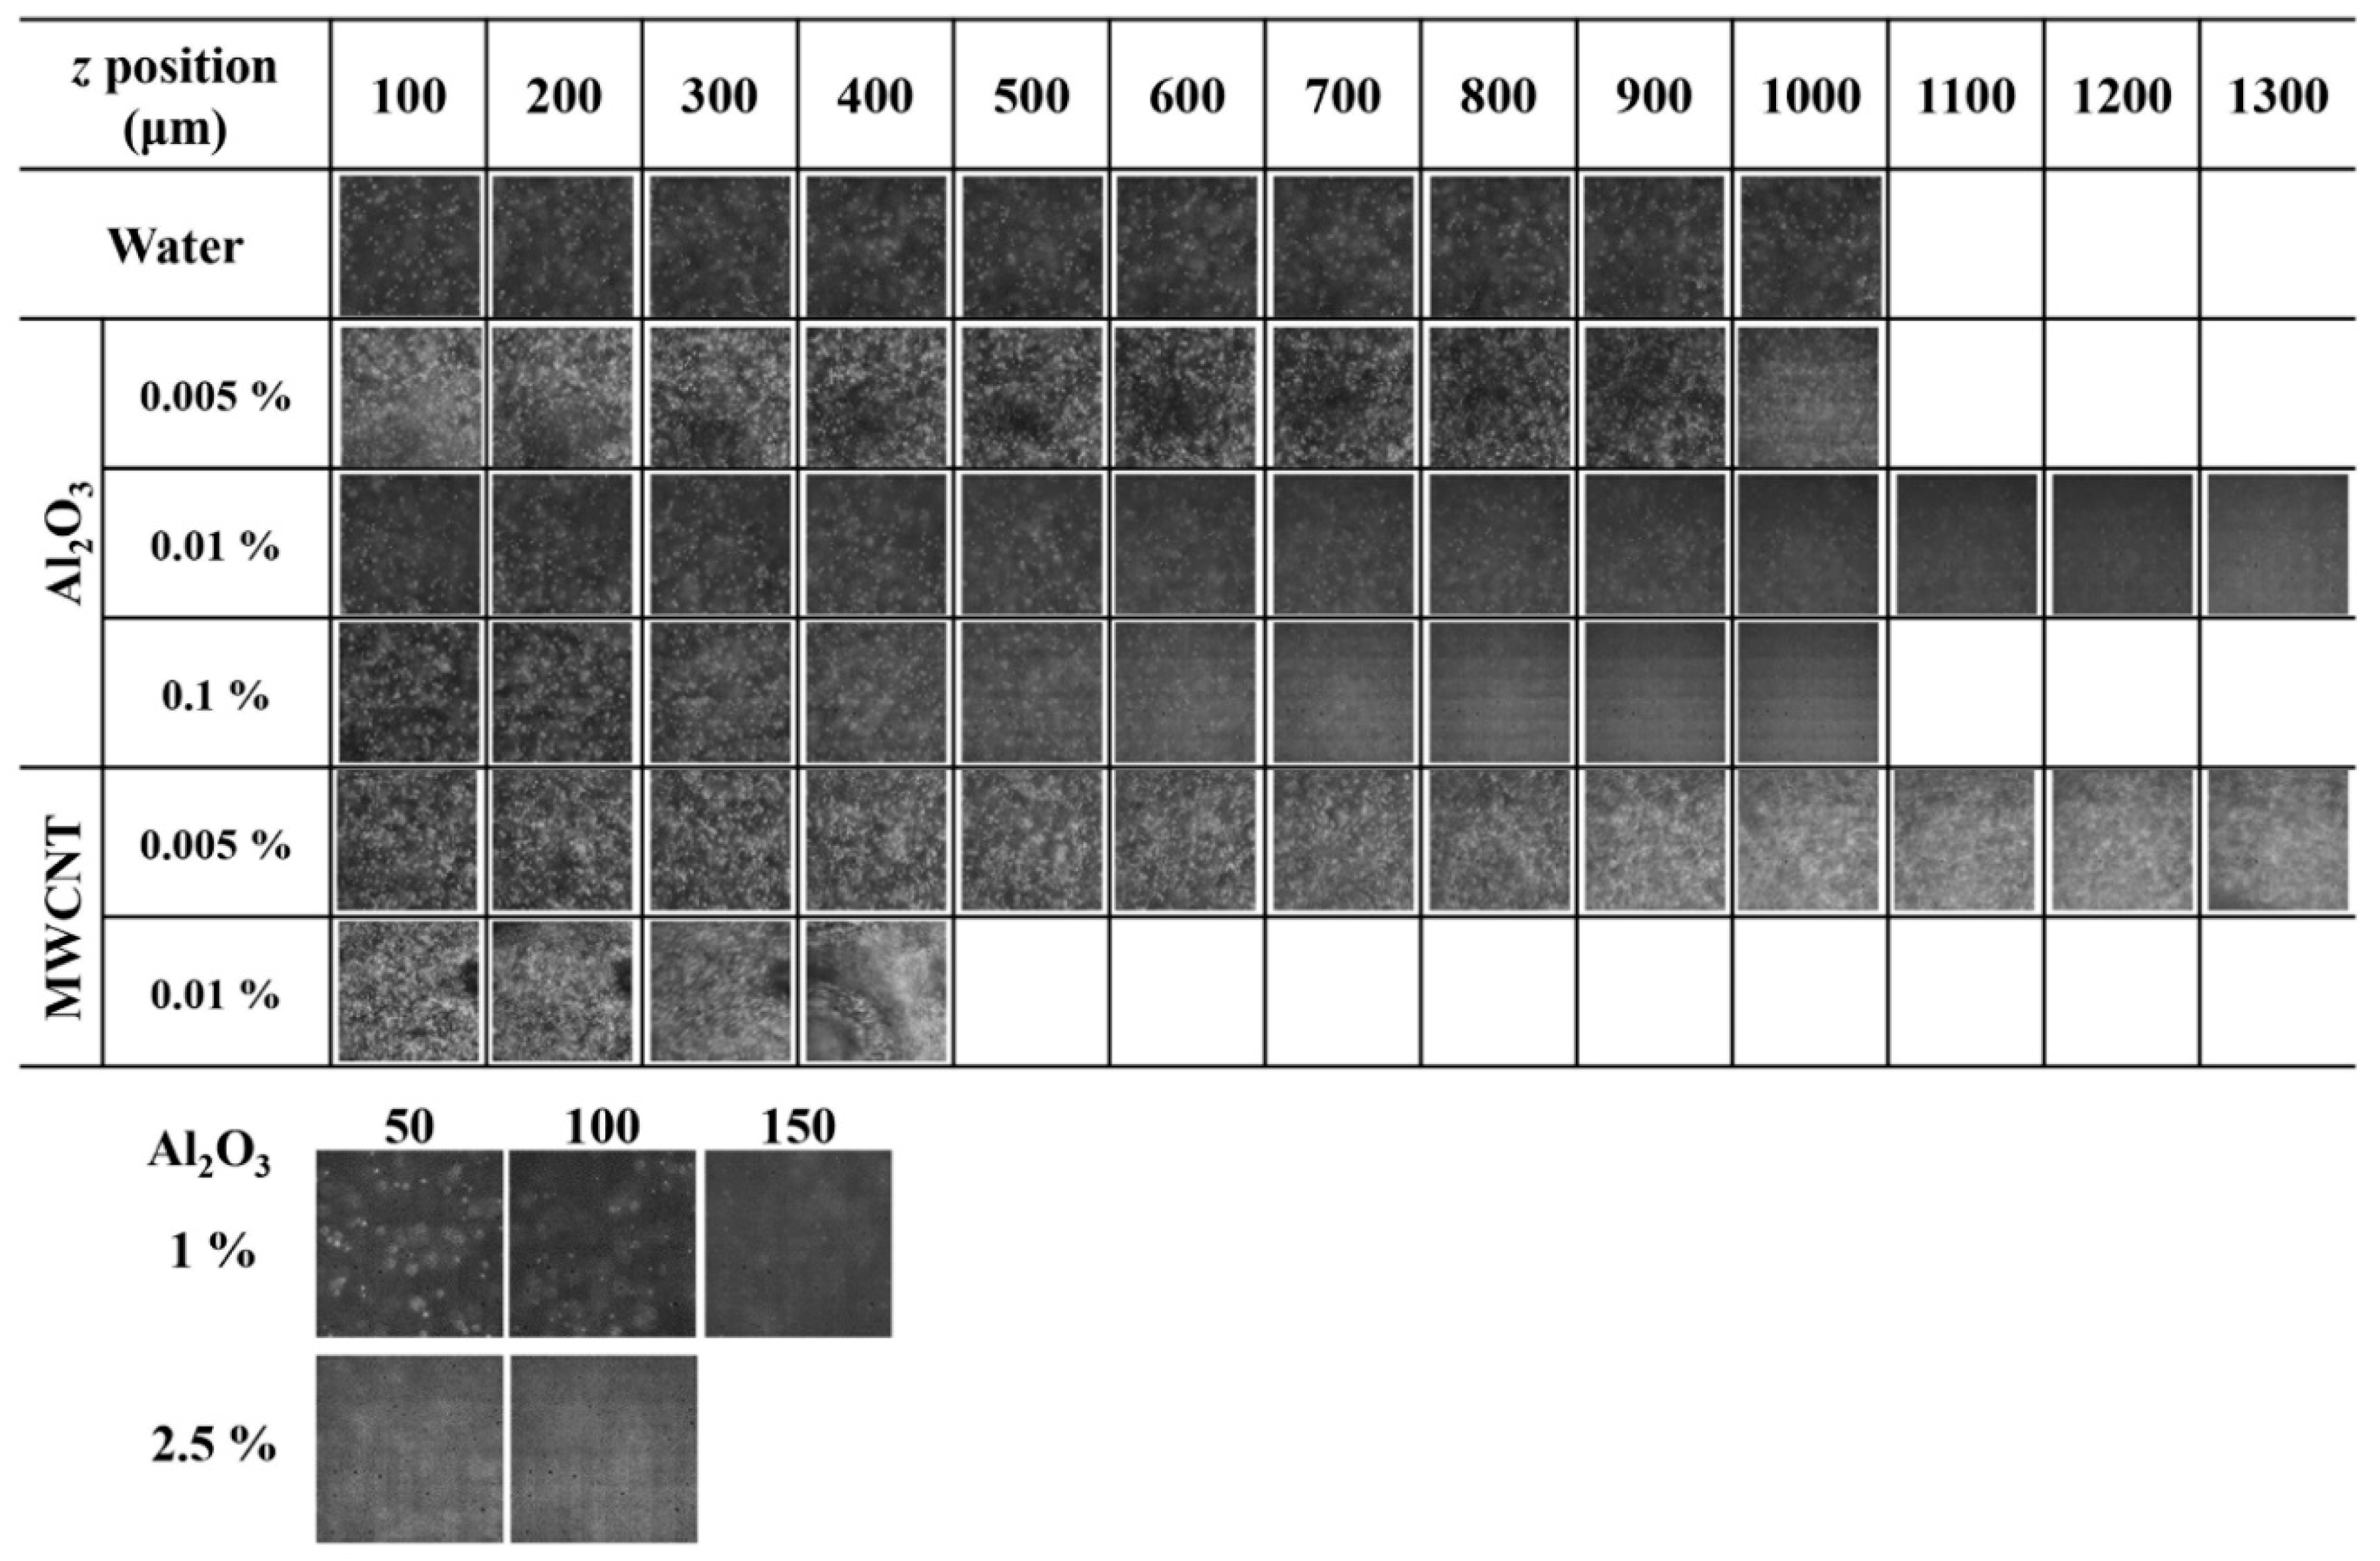
Images of the fluids with fluorescent particles were acquired at
z ranging from 100 to 1500 μm and the images are compared in
Figure 2. Images of DI water were also recorded for comparison standards. Bright spots are caused by light from the fluorescent particles and no obvious change in the image quality in water is observed with increasing depth. In contrast, image qualities of nanofluids are strongly influenced by the depth of the imaging plane regardless of the concentration and material of nanoparticles. All images of the nanofluids become blurred and no bright spots are observed when
z is higher than a specific depth value. Light intensity gradually decreases when light travels through nanofluids because they are semi-transparent. Therefore, nanofluids have a critical depth at which sufficient light for the PIV measurement is introduced into the camera. The depth depends on the concentration and type of nanofluid. For high concentrations (higher than 1%), bright spots are diminished even if the depth of focal plane is less than 100 μm.
At low concentrations, as the depth increases, bright spots initially become sharp and disappear thereafter. In μ-PIV, fluorescent light from the entire volume enters into the microscope because volume illumination is employed. Background noise occurs owing to fluorescence light from the other planes except for the focal plane. As aforementioned, light intensity decreases in nanofluids, which means that the semi-transparent property acts like an optical filter. Therefore, fluorescence light from the out-of-focus plane is filtered out and this effect makes the bright spots sharp. However, the brightness smears and no bright spot is observed as z becomes large because light intensity from the focal plane is reduced.
In PIV measurements, various sources such as number of particles, mean particle diameter, focal plane thickness, and in-plane and out-of-plane motion of particles generally influence the measurement uncertainty. The resultant effect of these factors is represented in the cross-correlation plane, which is used for seeking the displacement of particles. Various error sources, which govern the estimation of a particle pattern displacement, contribute to the loss of correlation. In other words, the coupled effects of the various error sources are expressed in the correlation plane. Therefore, a method was established to directly quantify PIV measurement accuracy from the information included in the cross-correlation plane [
27]. The accuracy and uncertainty of PIV measurements are calculated by the SNR strength of the PIV cross-correlation plane. The models for the uncertainty estimation are developed using three kinds of SNR metrics including peak to root mean square ratio, primary peak ratio, and peak to correlation energy (PCE). In this study, PCE is used for investigating the SNR variations with changes in the focal plane depth. PCE is calculated as
where
Cmax is the height of the primary peak.
Ec is the correlation energy calculated as follows:
where
S is the size of the correlation plane.
To quantify the effect of focal plane depth on the measurement accuracy, artificial image pairs were generated by shifting the images obtained at various depths (
z) as shown in
Figure 1. The distance between artificial image pairs was 8 pixels in both the horizontal and vertical directions. PCE and displacement difference were obtained by applying interrogation windows of size 32 × 32 pixels.
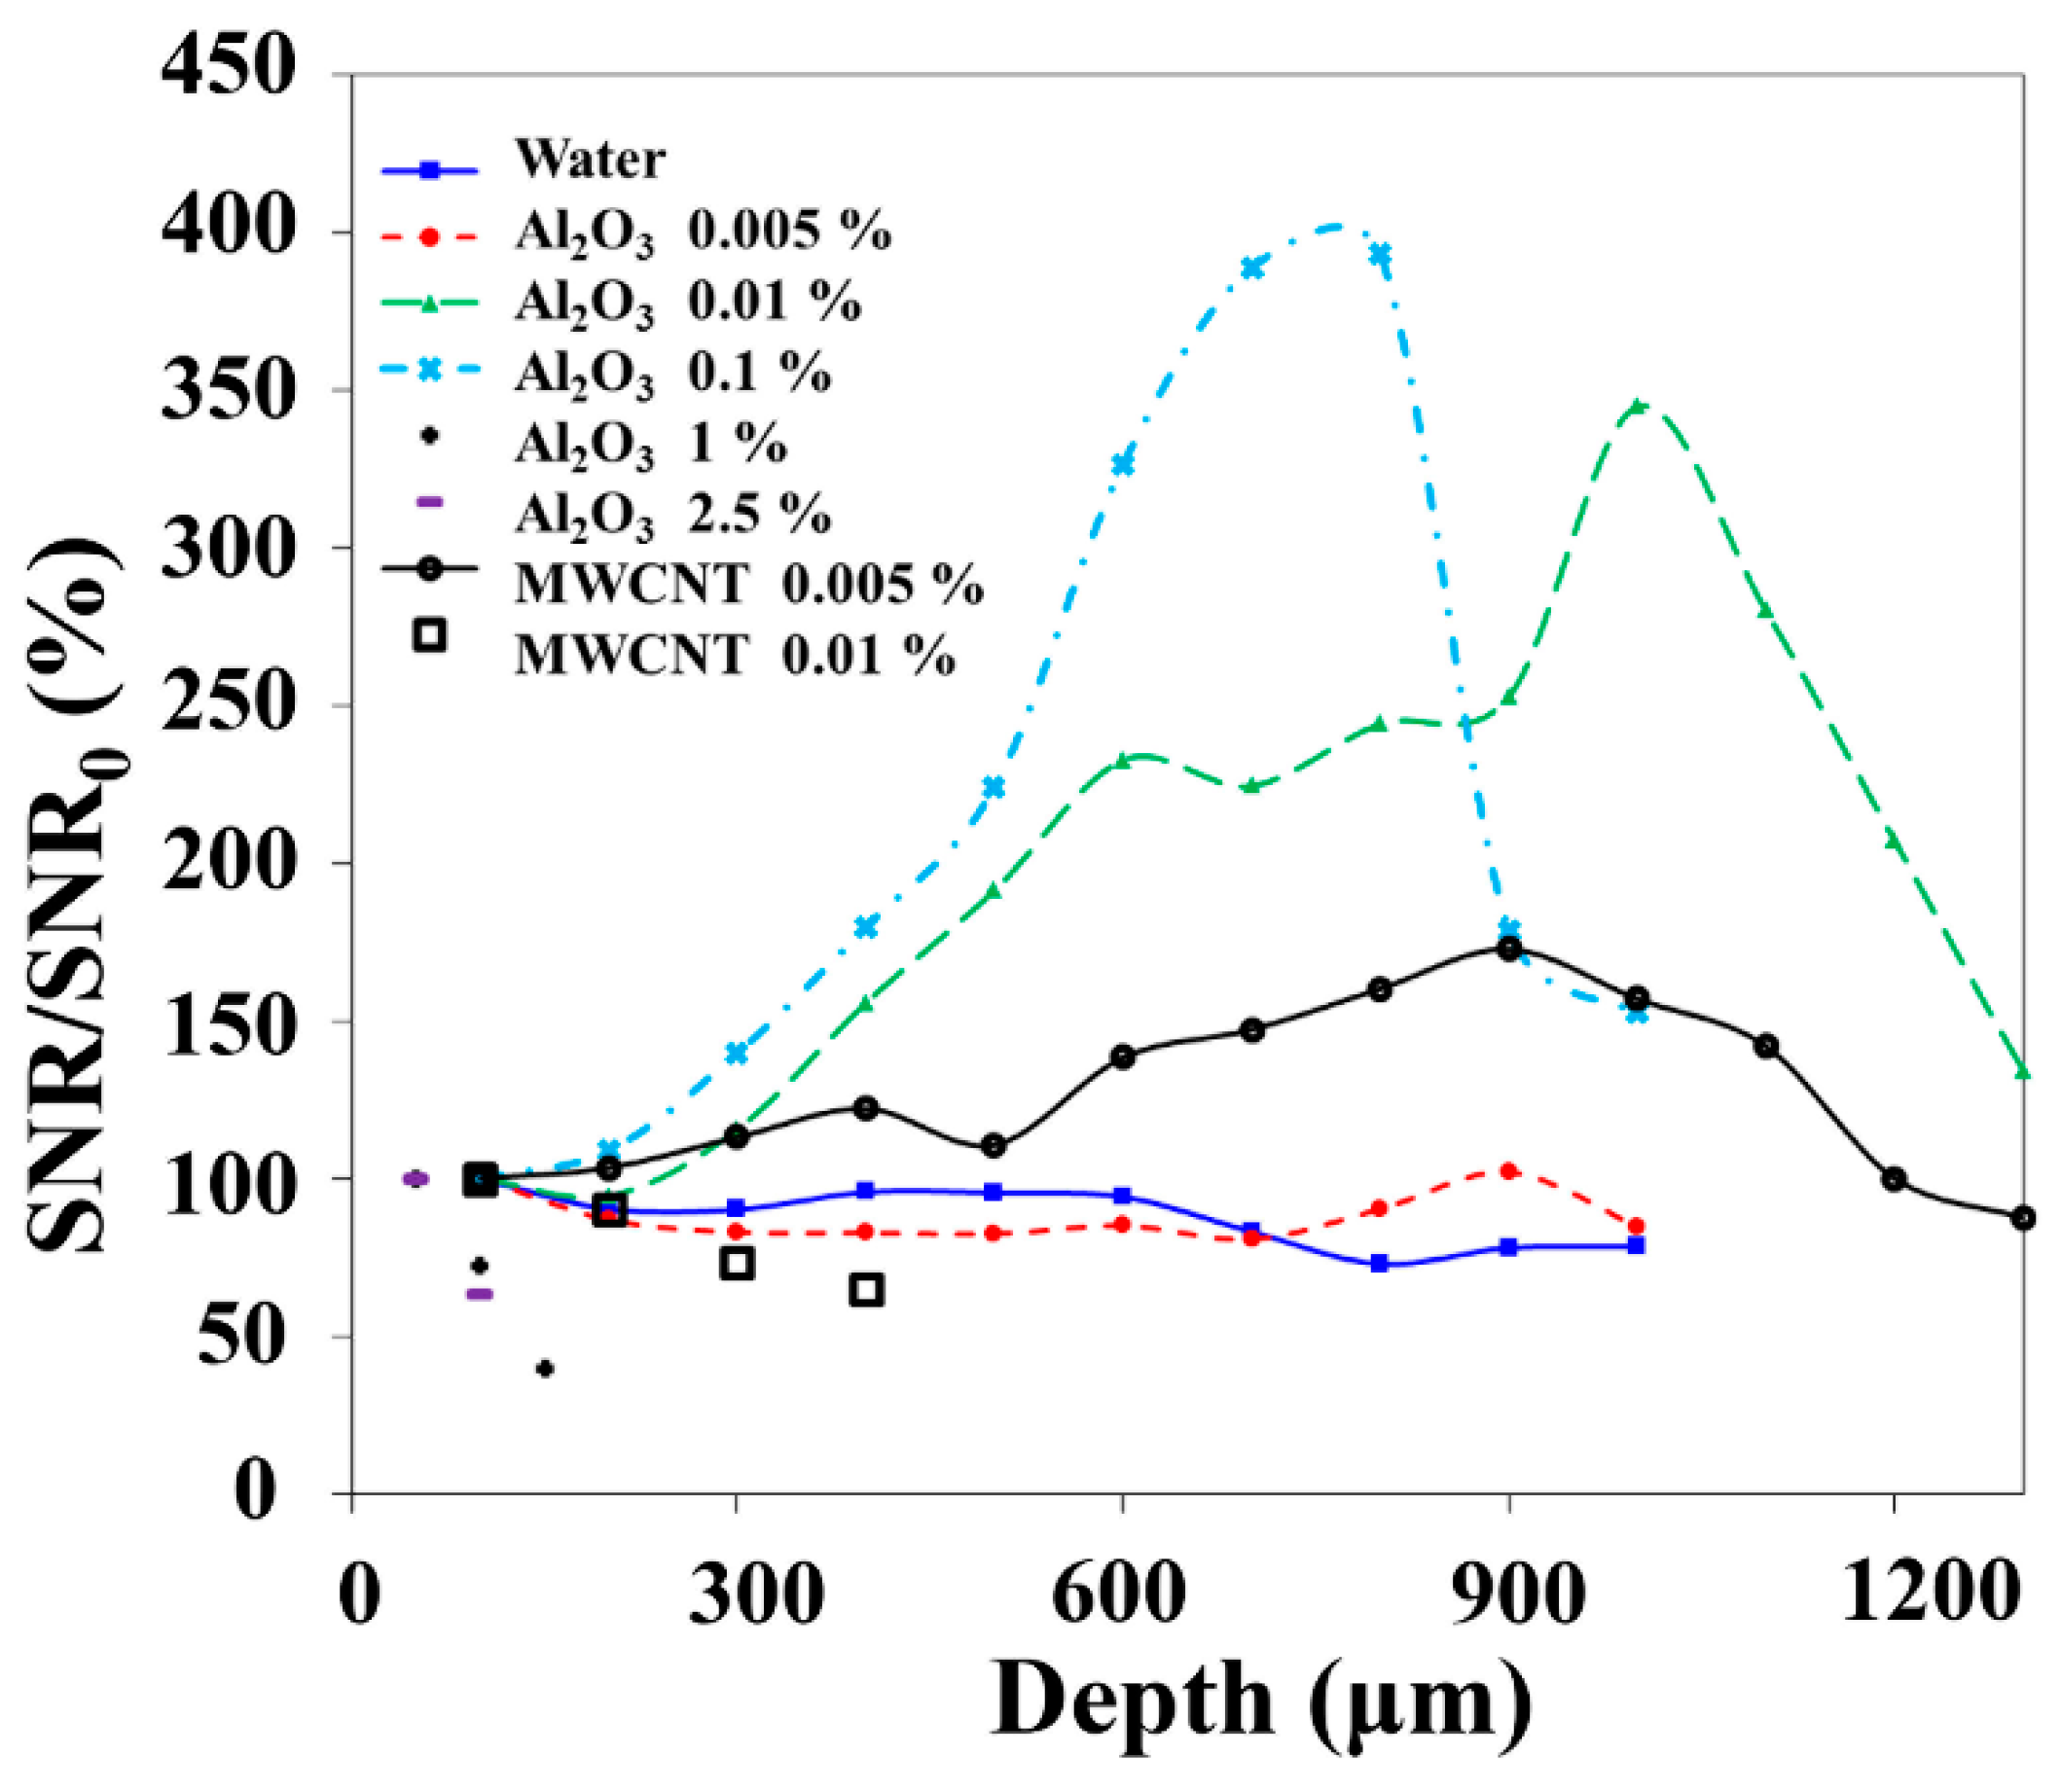
Figure 3 shows the variation of SNR with increasing
z. SNR is normalized with SNR
0, which is the PCE value at the smallest
z for each case represented in
Table 1. The lower and upper limits of the standard uncertainty corresponding to SNR
0 are calculated based on the model developed by Xue, Charonko, and Vlachos [
27]. Compared to water, SNRs of nanofluids near the top surface are higher except for the 2.5% of Al
2O
3 nanofluid. Higher SNR values are caused by the filtering effect of nanofluids as aforementioned.
SNR for water almost remains constant even though the focal depth changes. SNR of the lowest concentration of Al
2O
3 nanofluid has a tendency similar to that of water. SNRs of other nanofluids are significantly changed with the increase of
z. For higher concentrations (1% and 2.5% for Al
2O
3 and 0.01% for MWCNT) SNR gradually decreases even if
z increments slightly. In contrast, for lower concentrations, SNR gradually increases with an initial increase in
z and attains the maximum value at a specific depth. Thereafter, SNR sharply decreases with further increase in
z. The starting depth of the SNR drop is strongly influenced by the concentration and the depth is lower when the nanoparticle concentration is higher. These variations of SNR agree well with the image quality changes as shown in
Figure 2.
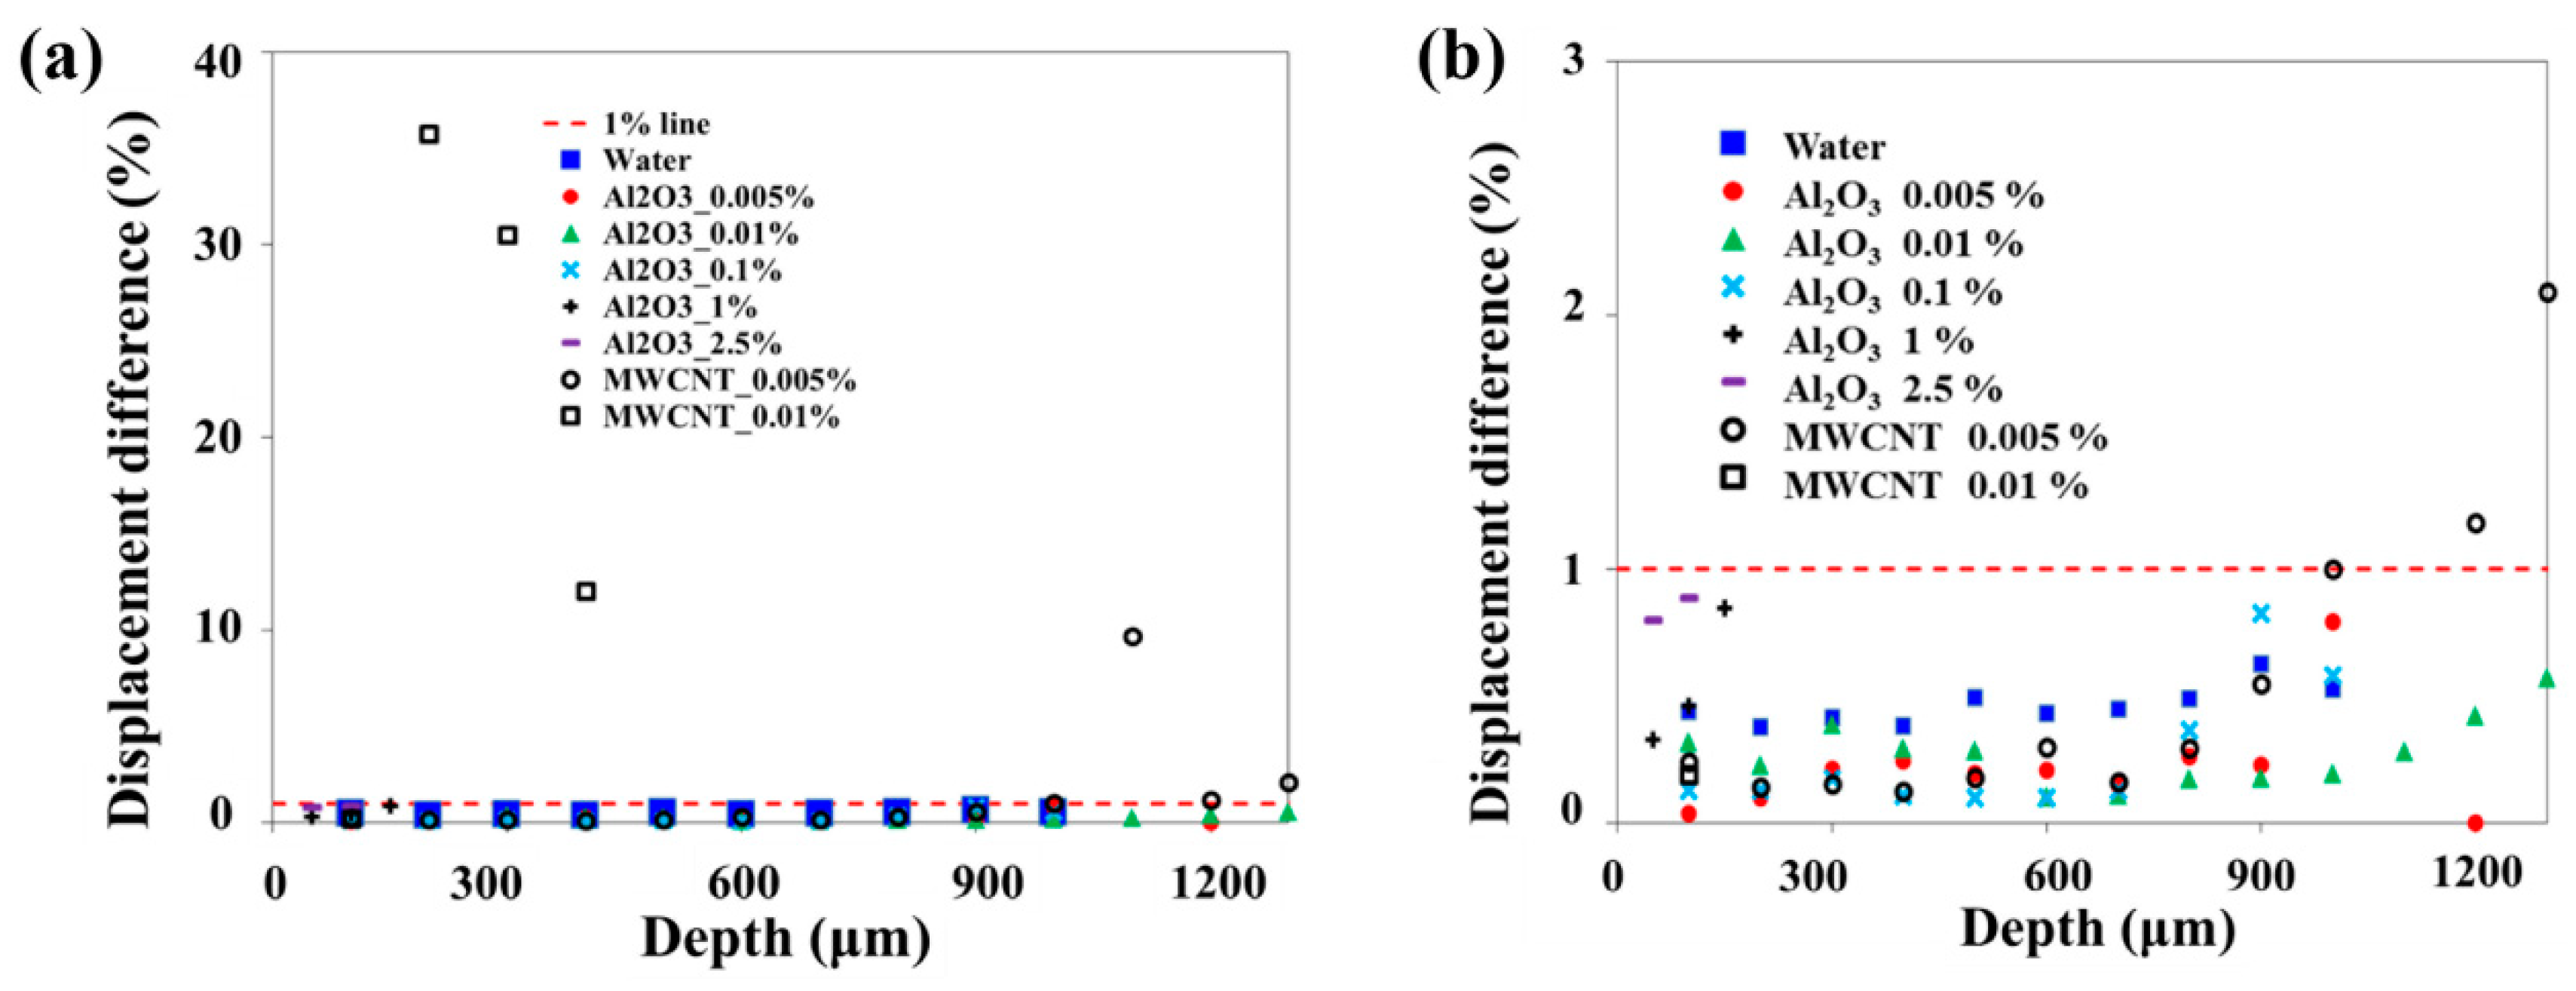
Displacements were calculated using artificial image pairs by employing the same algorithm including image pre-processing, cross-correlation, and vector validation used in practical PIV measurements. The MATLAB based open-source software was utilized in this study for PIV analysis [
28]. The 32 × 32 pixels with a 50% overlap was determined as an interrogation window size. The difference between the calculated displacement and shifted distance is represented in
Figure 4. The red dotted line indicates a 1% difference. The difference for water is slightly increased with increase in the focal depth; however, the largest difference is less than 1%. This lower difference is resulted from the fact that no error factor caused by particle motion such as in-plane and out-of-plane is affected because an artificial image pair from a static image was used in this validation. Except for higher concentration nanofluids, the difference for nanofluids is lower than that for water when the focal plane is near the top surface. This reduction is due to the effect of the SNR increase as shown in
Table 1. The semi-transparent property of nanofluids induces the increase of both correlation SNR and measurement accuracy when
z is small. When
z is greater than 1000 μm, the difference for nanofluids is obviously increased owing to the negative influence of the semi-transparent property.
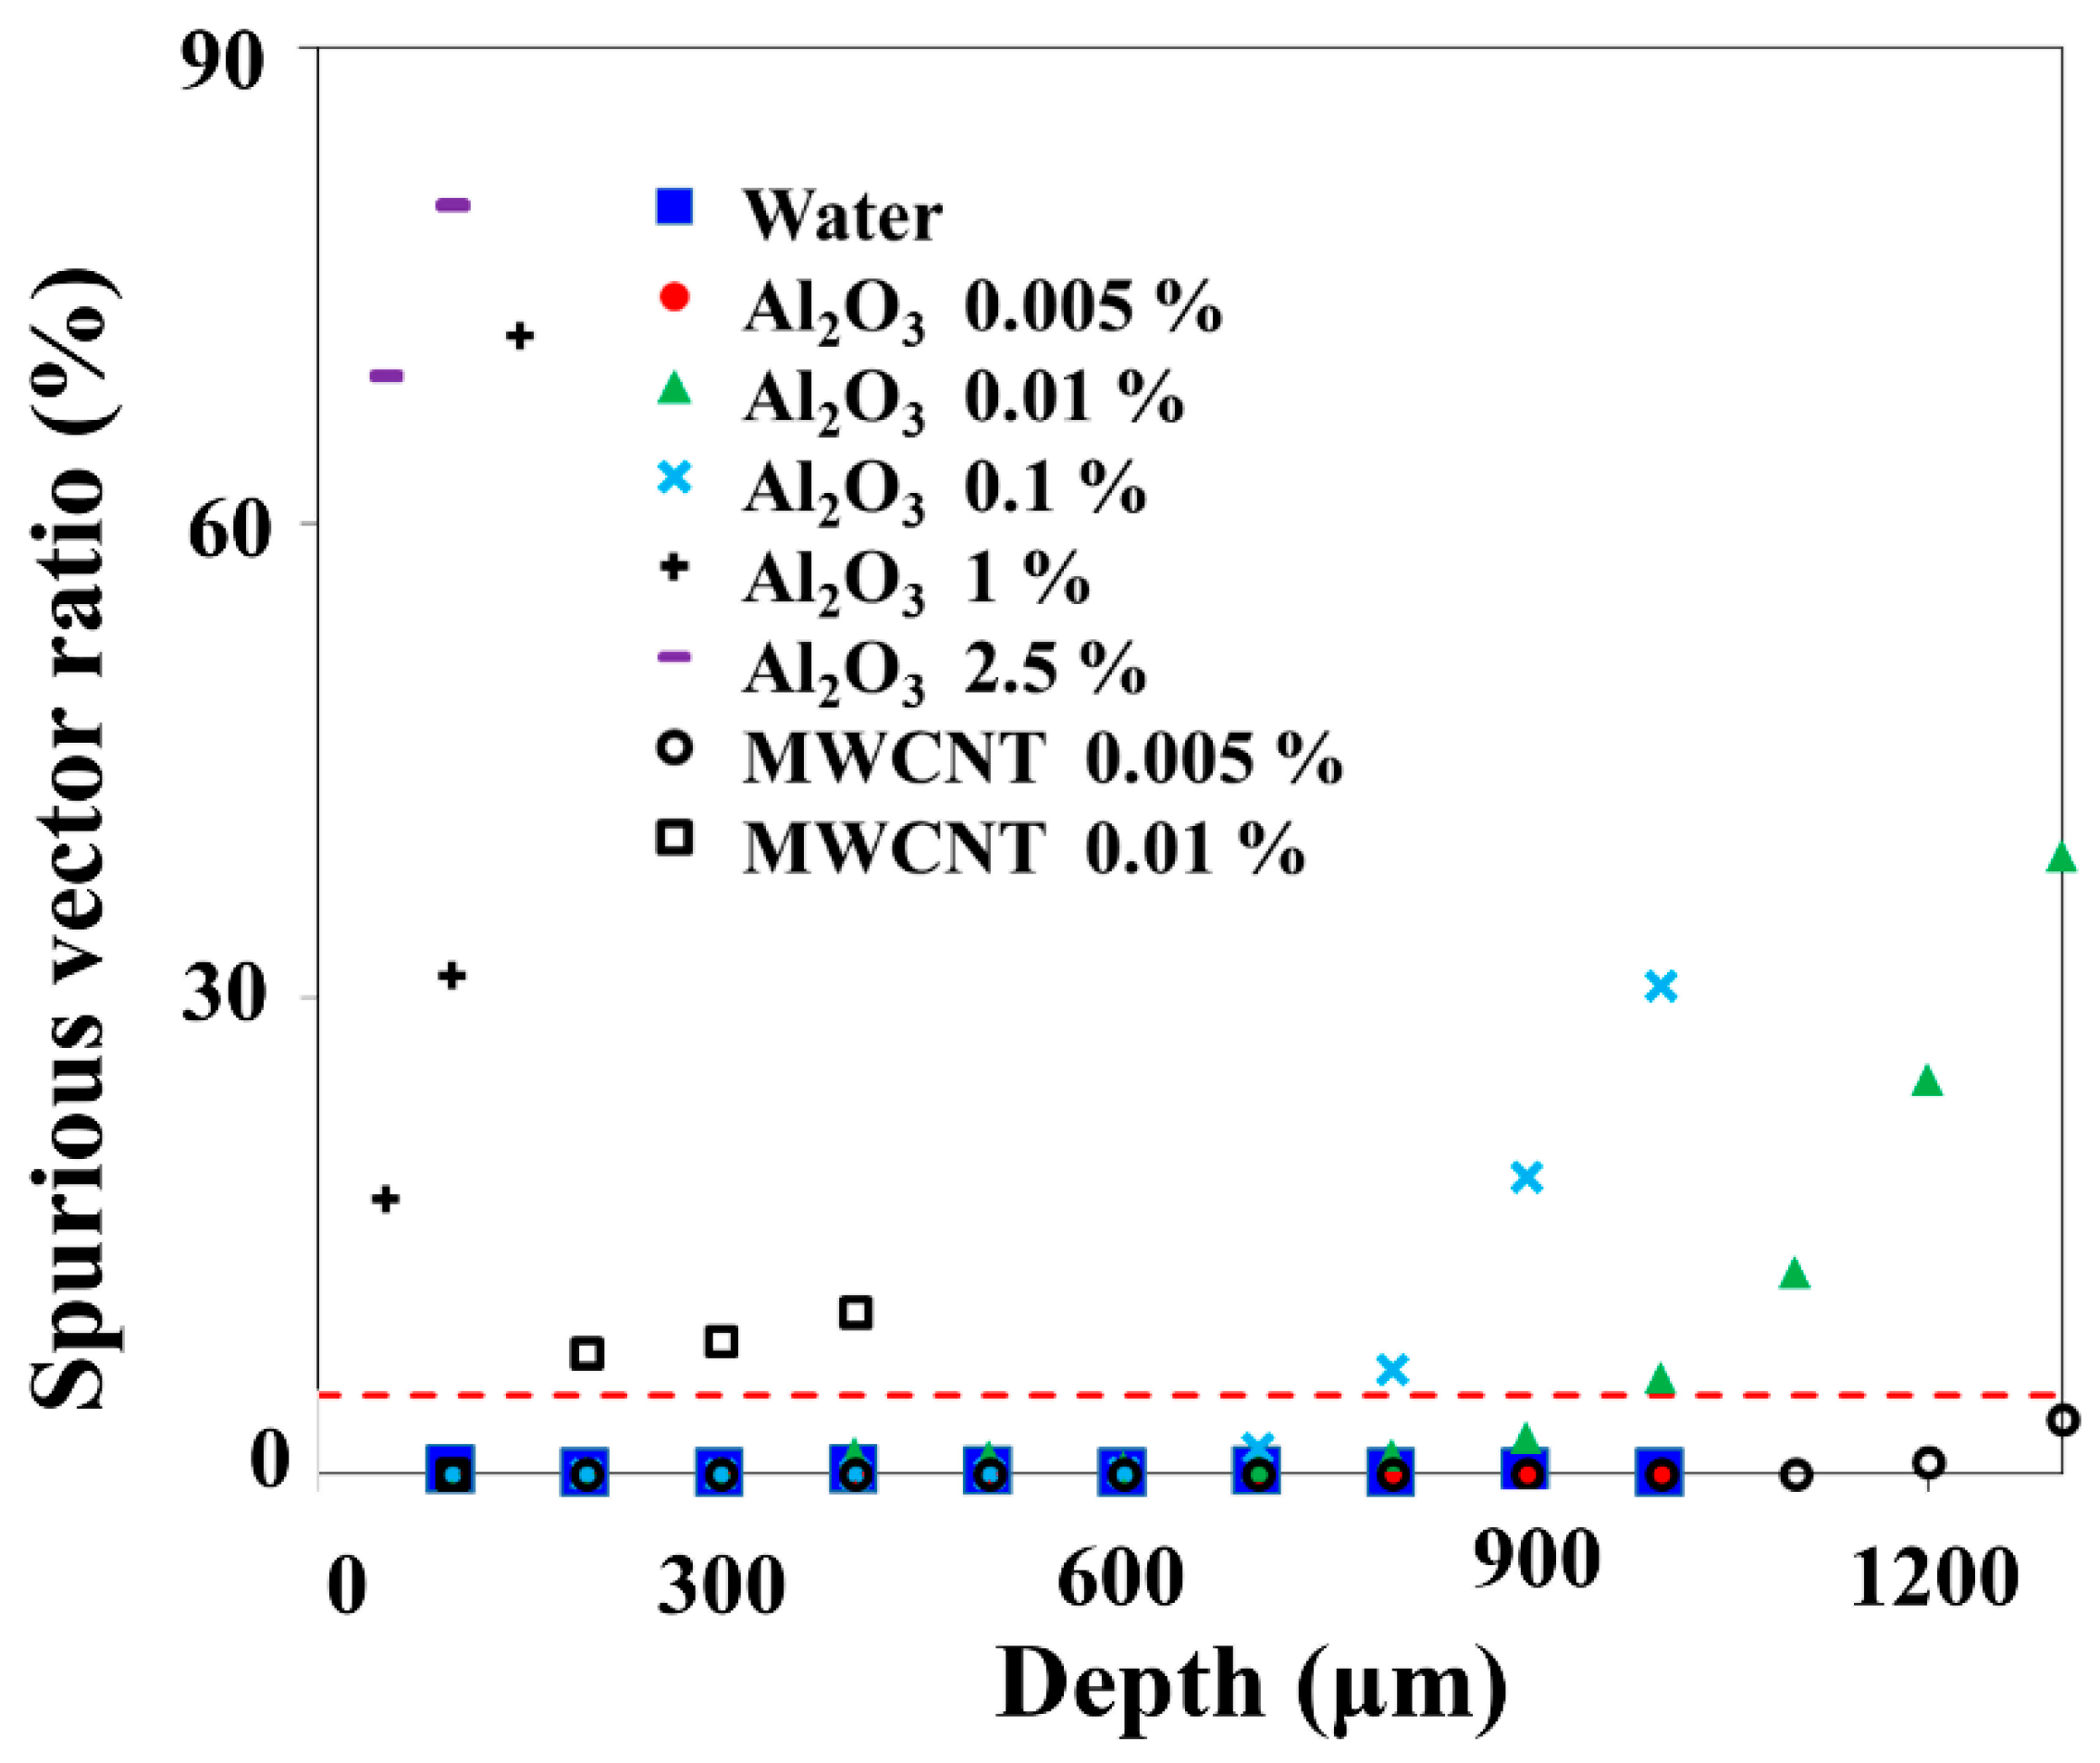
Poor image quality and low correlation SNR lead to wrong displacement findings. In PIV measurements, error vectors are decided and removed in the vector validation process. Spurious vectors were determined by using global and local threshold filters with the same criteria as in practical PIV measurements. The ratio of spurious to total vectors is represented in
Figure 5, and the number of total vectors is 2025. The ratio for water and the lowest concentration of Al
2O
3 is lower than 3% at all the depths. In other cases, the number of spurious vectors increases as the focal plane depth increases. The number rapidly increases from a specific
z where correlation SNR starts to decrease as shown in
Figure 3. This means that the reduction in image quality and correlation SNR strongly affect the number of error vectors although the reduction also influences the accuracy of the calculated displacements as shown in
Figure 4. These results show that velocity fields can be successfully measured up to a
z of 1000 μm when the concentrations of Al
2O
3 and MWCNT nanofluids are lower than 0.01% and 0.005%, respectively. The measurable depth decreases with increase in the concentration and μ-PIV is inapplicable to measure velocity information when the concentrations of Al
2O
3 and MWCNT nanofluids are higher than 1% and 0.01%, respectively.
In addition to the effect on image quality, particle motion including velocity gradient, in-plane, and out-of-plane strongly influences the correlation SNR leading to measurement errors in PIV measurements. Therefore, the effect of particle motion is also investigated. To validate the measurement feasibility by considering the effect of image quality and particle motion together, the velocity fields of Hagen–Poiseuille flow with a well-known velocity profile were measured using μ-PIV. Water, 0.005% and 0.01% Al2O3 nanofluids, and 0.005% MWCNT nanofluid were used for measuring the velocity fields of tube flows.
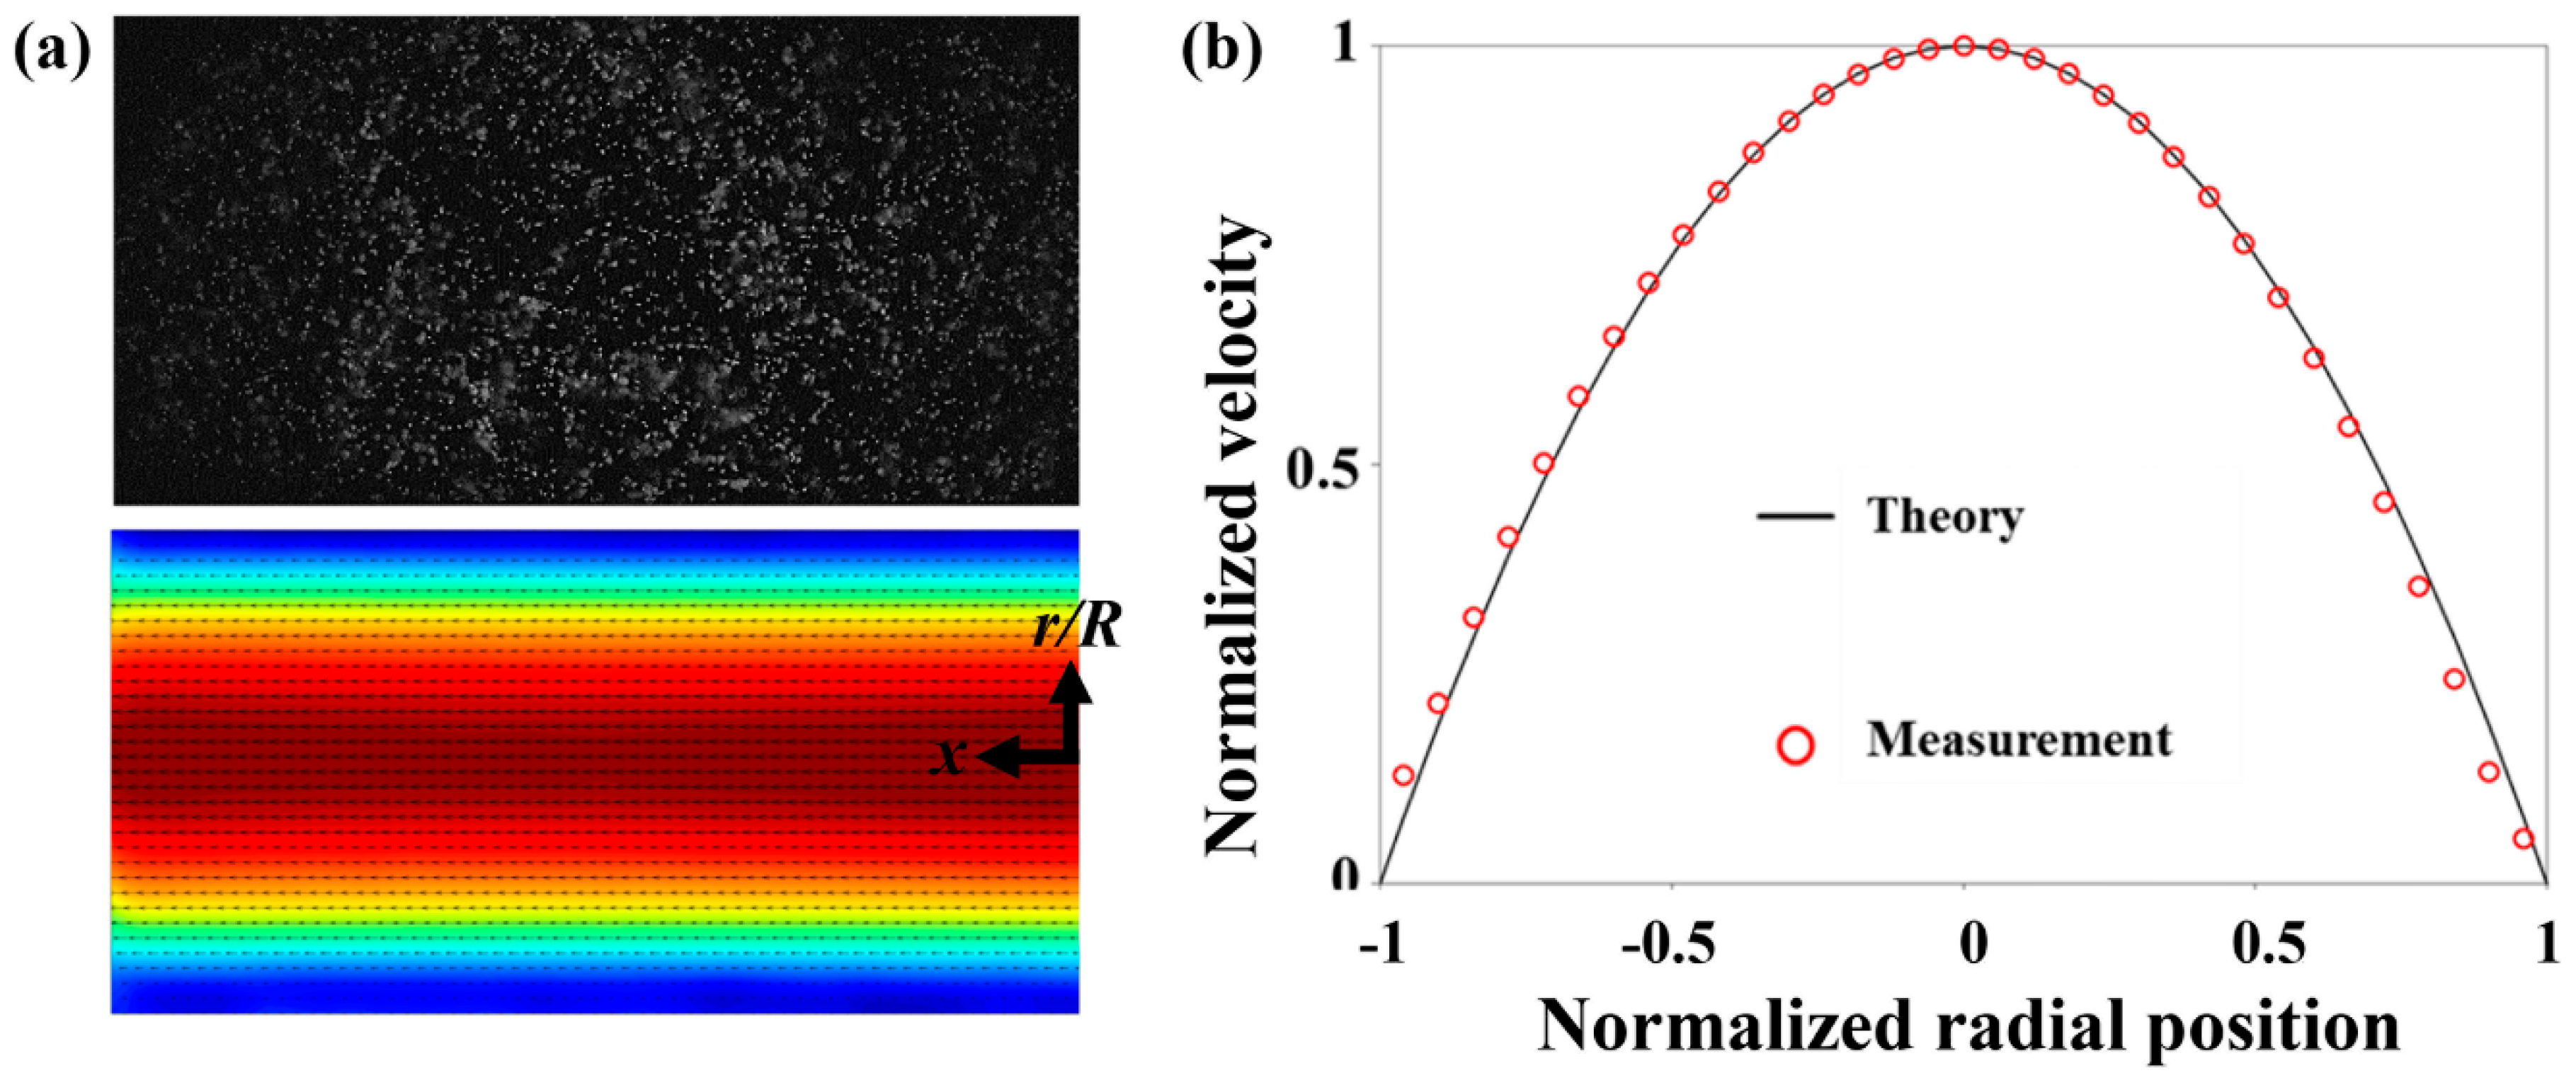
Figure 6a shows the raw image of a 0.005% MWCNT nanofluid flow for Re = 10, ensemble averaged velocity vectors, and velocity magnitude contour. The flow images were captured at the tube center plane and 500 instanton velocities were averaged. Bright particles in the tube flows were clearly observed. The SNR is smaller than that in
Figure 3 owing to the particle motion effect and PCE of 71.11. The corresponding upper and lower limits of the standard uncertainty are 0.494 and 0.051, respectively. The mean velocity forms a typical profile observed in the Hagen–Poiseuille flow, where the velocities are low near the tube wall and maximum at the center. The measured maximum velocity is 41.2 mm/s and the difference with the theoretical value is 2.94%. The velocity is normalized by the maximum velocity and compared to the theoretical profile of the Hagen–Poiseuille flow. The velocity profile matches well with the theoretical one although the difference slightly increases as the wall region is approached.
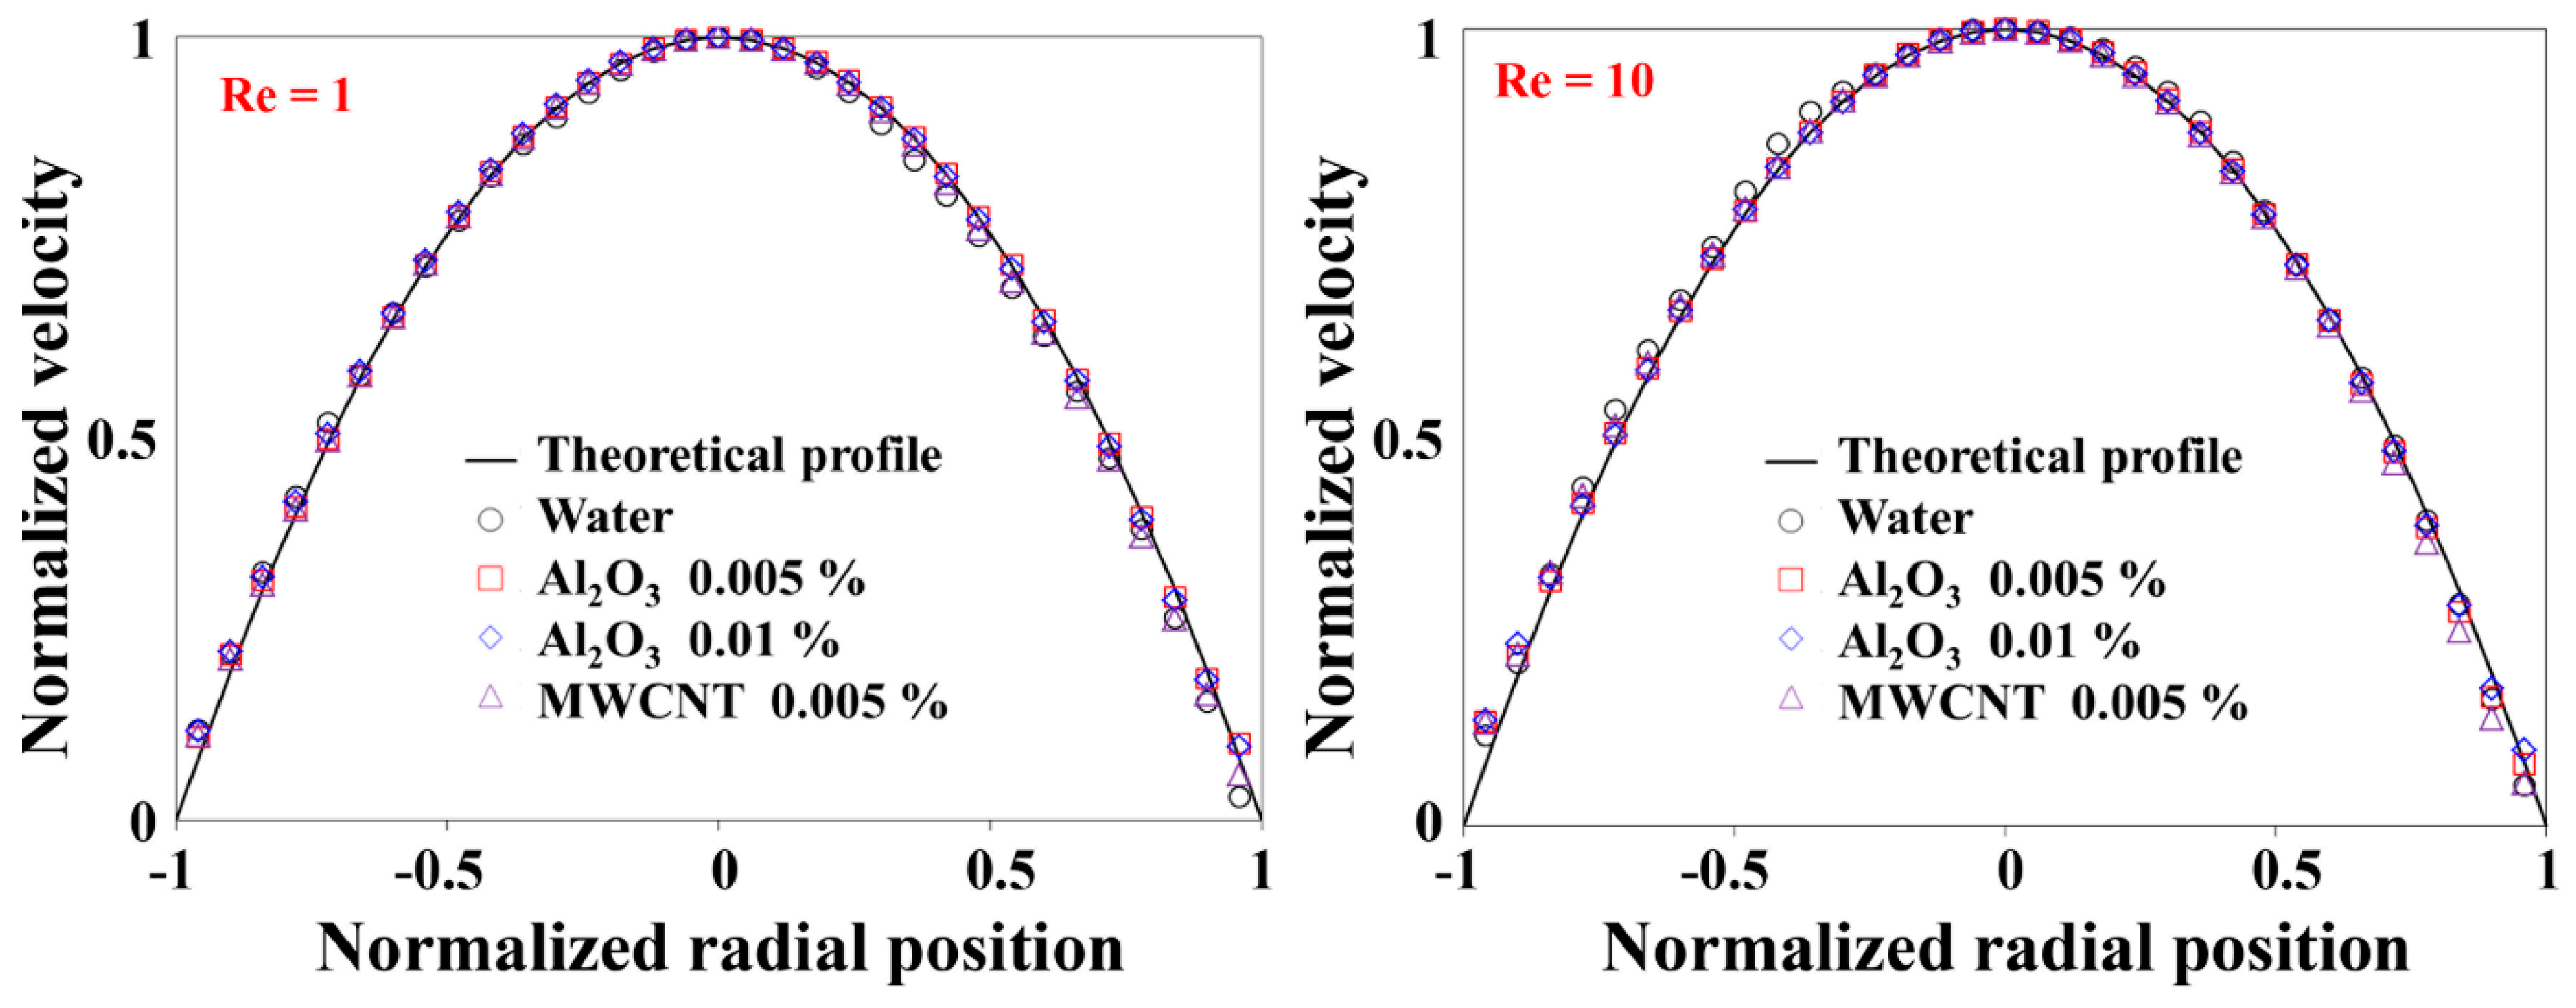
The measured velocity profiles of all the samples are compared in
Figure 7. Each profile is normalized by its maximum velocity. The difference is slightly increased in high Re flows and the highest difference of the maximum velocity is 4.47% in water with the Re of 10. PCE values are 56.58, 116.22, 88.86 for water, and 0.005% and 0.01% of Al
2O
3 nanofluids, respectively. Compared to the SNR of water, the SNRs of nanofluids are better owing to their semi-transparent optical property. SNR improvement in nanofluids leads to good agreement in the velocity profiles as shown in
Figure 7. Good agreement with the theoretical profile is observed throughout in all the cases although small discrepancies exist. The nPIV technique called evanescent wave-based PIV has been used to investigate the fluid motion near the wall region such as the effect of the near-wall force and Brownian diffusion [
29]. Therefore, the combination of both nPIV and μPIV has strong potential to investigate the multi-scale heat transfer phenomena of the nanofluid in the micro-scale channel.


