Figure 1.
Lagoons proposals of tidal range structure (TRS) in the Severn Estuary and Bristol Channel (from Google Map).
Figure 1.
Lagoons proposals of tidal range structure (TRS) in the Severn Estuary and Bristol Channel (from Google Map).
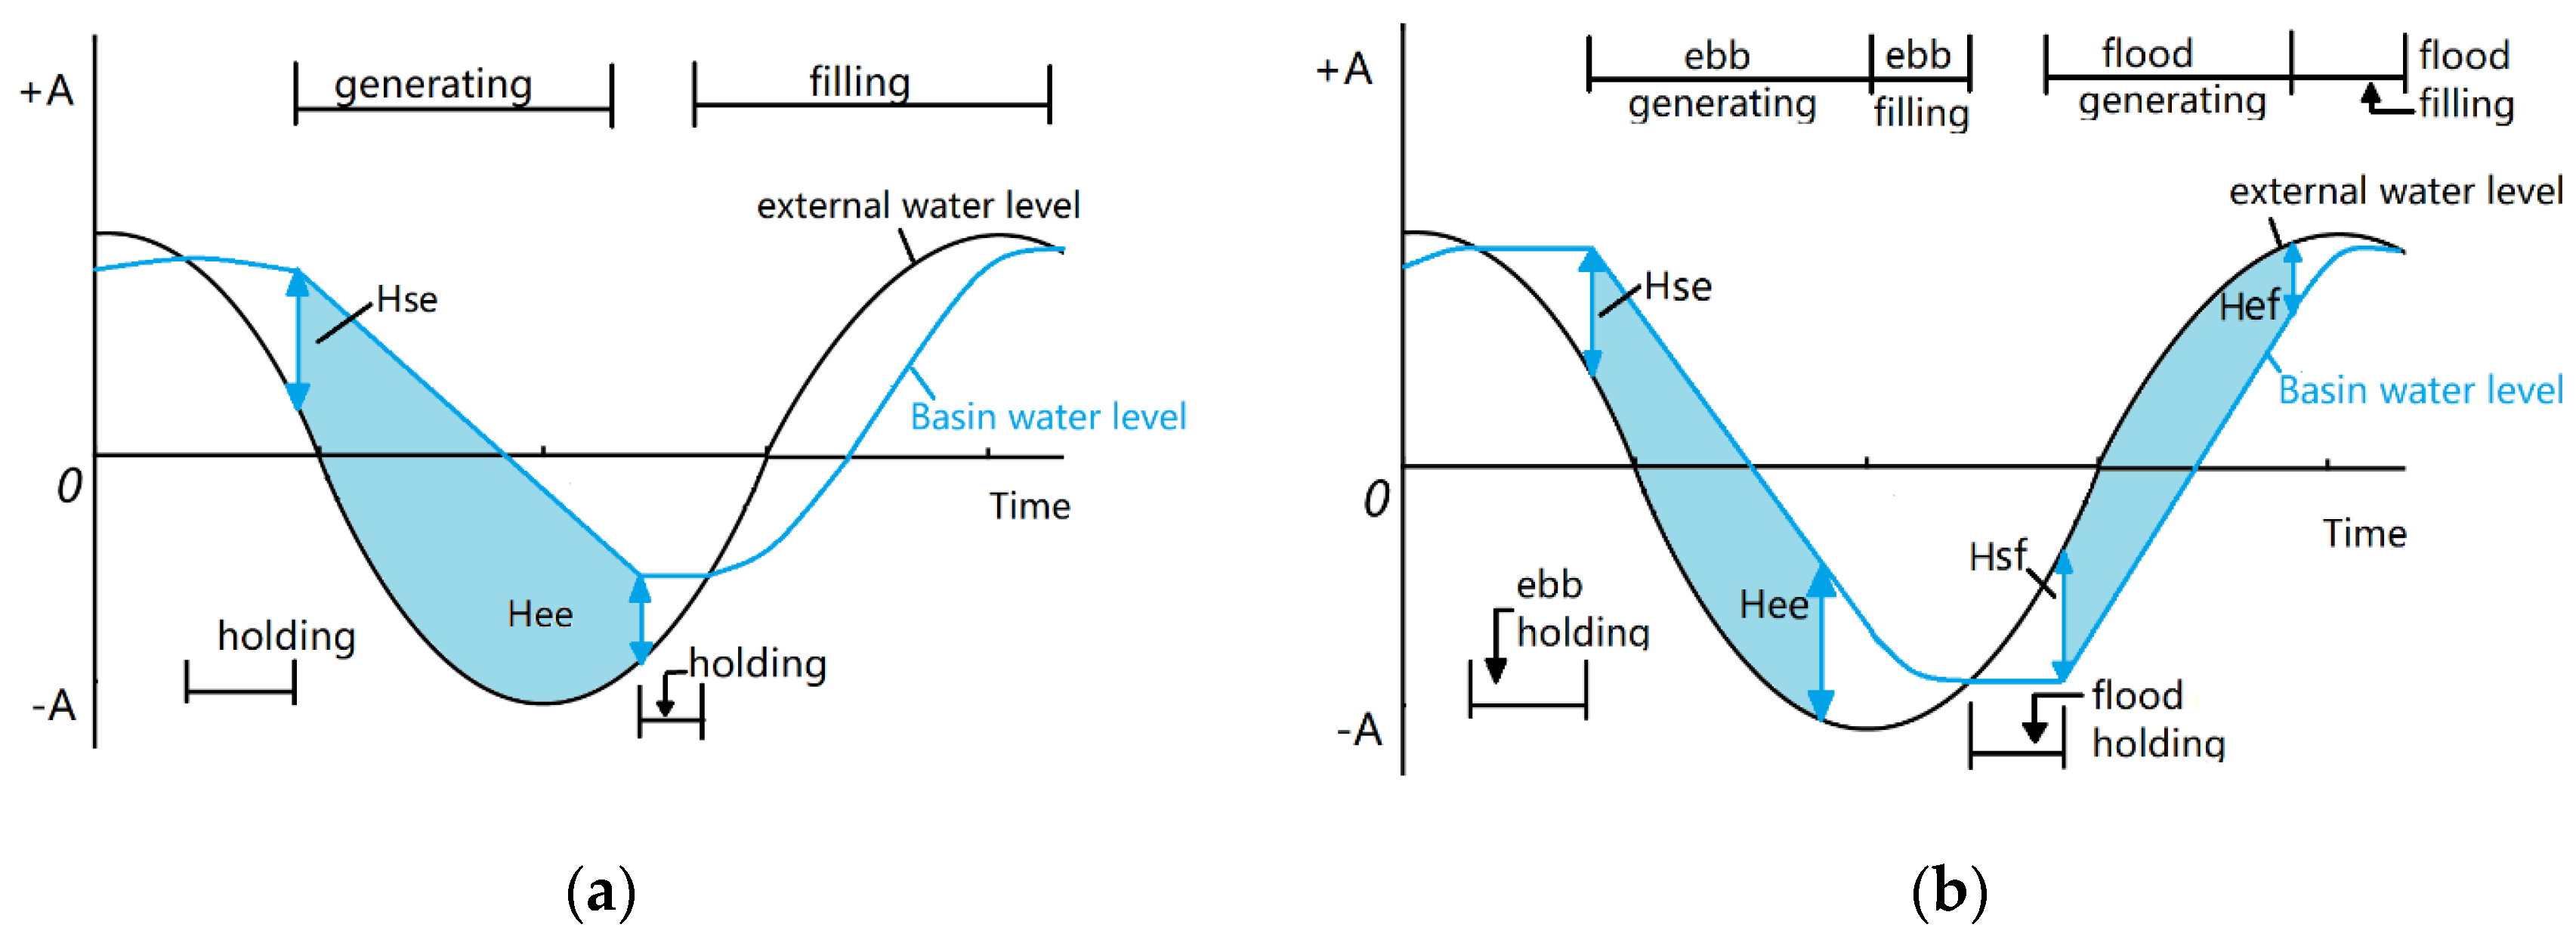
Figure 2.
Schematic representation of the operational schemes: (a) One-way ebb generation; (b) a two-way tidal power plant.
Figure 2.
Schematic representation of the operational schemes: (a) One-way ebb generation; (b) a two-way tidal power plant.
Figure 3.
Schematic representation of the operational mode (including pumping) of: (a) One-way ebb-generation; (b) a two-way tidal power plant.
Figure 3.
Schematic representation of the operational mode (including pumping) of: (a) One-way ebb-generation; (b) a two-way tidal power plant.
Figure 4.
Overview of the project elements [
24].
Figure 4.
Overview of the project elements [
24].
Figure 5.
Wetted area versus water level.
Figure 5.
Wetted area versus water level.
Figure 6.
Energy output: (a) With a constant impounded area; (b) with impounded area varying with water level, in which the Hse/Hee denote the starting/ending generation water elevations.
Figure 6.
Energy output: (a) With a constant impounded area; (b) with impounded area varying with water level, in which the Hse/Hee denote the starting/ending generation water elevations.
Figure 7.
Andritz Hydro three-blade low head bulb turbine unit [
31].
Figure 7.
Andritz Hydro three-blade low head bulb turbine unit [
31].
Figure 8.
Turbine efficiency calculated from
Figure 7.
Figure 8.
Turbine efficiency calculated from
Figure 7.
Figure 9.
3 Schematic illustration of different optimisation methodologies: (a) Full tide optimisation illustrations: every-tide (ET) and every tidal cycle and next (ETN) methods; and (b) half tide optimisation illustrations: every-half (EH) and every half-tidal cycle and next (EHN) methods.
Figure 9.
3 Schematic illustration of different optimisation methodologies: (a) Full tide optimisation illustrations: every-tide (ET) and every tidal cycle and next (ETN) methods; and (b) half tide optimisation illustrations: every-half (EH) and every half-tidal cycle and next (EHN) methods.
Figure 10.
ET model for 10 tides, with the maximum energy point, i.e., most optimised operation, being shown with a red cross.
Figure 10.
ET model for 10 tides, with the maximum energy point, i.e., most optimised operation, being shown with a red cross.
Figure 11.
Operation scheduling of the impoundment, water levels inside the impoundment, and power output comparisons for four neap tides, M_fixed-head, M_ET, M_ETN, M_EH, and M_EHN represent the operation schedule based on fixed head, ET, ETN, EH, and EHN models, respectively, in which 1 to 3 denote sluicing, generating, and holding phase, respectively. Zlw represent the seaside water level. WL_fixed-head, WL_ET, WL_ETN, WL_EH, and WL_EHN represent the basin water level based on fixed head, ET, ETN, EH, and EHN models, respectively. P_fixed-head, P_ET, P_ETN, P_EH, and P_EHN represent the power output based on fixed head, ET, ETN, EH, and EHN models, respectively.
Figure 12.
Swansea Bay Lagoon region and bathymetry as included in the depth integrated velocities and solute transport (DIVAST 2-DU) model.
Figure 12.
Swansea Bay Lagoon region and bathymetry as included in the depth integrated velocities and solute transport (DIVAST 2-DU) model.
Figure 13.
Typical comparison of observed and predicted water levels at L2 (a), L3 (b), and L5 (c).
Figure 13.
Typical comparison of observed and predicted water levels at L2 (a), L3 (b), and L5 (c).
Figure 14.
Typical comparison of observed and predicted current speed at L2 (a), L3 (b), and L5 (c).
Figure 14.
Typical comparison of observed and predicted current speed at L2 (a), L3 (b), and L5 (c).
Figure 15.
Typical comparison of observed and predicted current direction from North at L2 (a), L3 (b), and L5 (c).
Figure 15.
Typical comparison of observed and predicted current direction from North at L2 (a), L3 (b), and L5 (c).
Figure 16.
Water level (a) and current (b) streamlines during the flood generating mode in the 2-D model.
Figure 16.
Water level (a) and current (b) streamlines during the flood generating mode in the 2-D model.
Figure 17.
Water level (a) and current (b) streamlines during the ebb generating mode in the 2-D model.
Figure 17.
Water level (a) and current (b) streamlines during the ebb generating mode in the 2-D model.
Figure 18.
2-D and 0-D model comparisons between: (a) Water level and power output, in which WL_0-D, WL_2-D and Zlw_0-D, Zlw_2-D denote the basin water level and seaside water level in 0-D and 2-D models, respectively. P_0-D and P_2-D denote the power output in 0-D and 2-D models, respectively; (b) water head difference and energy generated, in which DH_0-D, DH_2-D and Energy_0-D, Energy_2-D denote the water head difference and energy generation in 0-D and 2-D models, respectively; and (c) discharge through the sluice gates and turbines, in which QTB_0-D, QTB_2-D and QSL_0-D, QSL_2-D denote the discharge through turbines and sluice gates in 0-D and 2-D, respectively.
Table 1.
Energy generation per cycle for the 0-D model.
Table 1.
Energy generation per cycle for the 0-D model.
| Cycle No | Starting Time (h) | Ending Time (h) | Energy (GWh) | Relative Deviation (%) | Cycle No. | Starting Time (h) | Ending Time (h) | Energy (GWh) | Relative Deviation (%) |
|---|
| 1 | 60.60 | 421.50 | 19.69 | −5.57 | 13 | 4284.40 | 4619.60 | 22.62 | 8.46 |
| 2 | 421.50 | 781.80 | 20.44 | −1.96 | 14 | 4619.60 | 4991.40 | 19.03 | −8.75 |
| 3 | 781.80 | 1130.10 | 21.36 | 2.42 | 15 | 4991.40 | 5341.20 | 22.31 | 6.99 |
| 4 | 1130.10 | 1489.50 | 19.86 | −4.77 | 16 | 5341.20 | 5699.40 | 19.72 | −5.42 |
| 5 | 1489.50 | 1824.90 | 21.81 | 4.60 | 17 | 5699.40 | 6061.40 | 21.43 | 2.76 |
| 6 | 1824.90 | 2197.50 | 19.06 | −8.59 | 18 | 6061.40 | 6445.60 | 21.84 | 4.75 |
| 7 | 2197.50 | 2534.10 | 22.57 | 8.24 | 19 | 6445.60 | 6804.80 | 19.20 | −7.92 |
| 8 | 2534.10 | 2892.90 | 19.15 | −8.14 | 20 | 6804.80 | 7165.80 | 23.58 | 13.09 |
| 9 | 2892.90 | 3241.80 | 23.30 | 11.76 | 21 | 7165.80 | 7512.20 | 18.29 | −12.29 |
| 10 | 3241.80 | 3612.30 | 18.55 | −11.04 | 22 | 7512.20 | 7873.20 | 23.83 | 14.29 |
| 11 | 3612.30 | 3924.60 | 22.17 | 6.32 | 23 | 7873.20 | 8221.20 | 19.26 | −7.63 |
| 12 | 3924.60 | 4284.40 | 17.98 | −13.77 | 24 | 8221.20 | 8568.60 | 23.39 | 12.16 |
Table 2.
Optimisation scenarios for second tidal cycle.
Table 2.
Optimisation scenarios for second tidal cycle.
| Scenario | Energy (GWh) | Change to Fixed-Head Schedule |
|---|
| Fixed-head schedule | 21.3 | - |
| Optimised | ET model | 23.5 | 10.5% |
| ETN model | 23.6 | 10.6% |
| EH model | 23.8 | 11.9% |
| EHN model | 24.0 | 12.5% |
Table 3.
Pumping optimisation scenarios for the second tidal cycle.
Table 3.
Pumping optimisation scenarios for the second tidal cycle.
| Scenario | Energy (GWh) | Change to Fixed-Head Schedule |
|---|
| Fixed-head schedule | 21.3 | - |
| Optimised | ETP model | 26.7 | 25.5% |
| ETNP model | 26.7 | 25.5% |
| EHP model | 27.0 | 26.7% |
| EHNP model | 27.1 | 27.2% |
Table 4.
Analysis of measured and predicted data at L2, L3, and L5.
Table 4.
Analysis of measured and predicted data at L2, L3, and L5.
| No | Location | Latitude | Longitude | Terms | RMSE | R2 |
|---|
| 1 | L2 | 51°31.78′ N | 003°58.96′ W | Water Level (m) | 0.111 | 0.997 |
| Velocity (m/s) | 0.055 | 0.832 |
| 2 | L3 | 51°33.56′ N | 003°56.32′ W | Water Level (m) | 0.136 | 0.997 |
| Velocity (m/s) | 0.031 | 0.774 |
| 3 | L5 | 51°31.82′ N | 003°51.25′ W | Water Level (m) | 0.147 | 0.997 |
| Velocity (m/s) | 0.017 | 0.787 |
Table 5.
Energy generation comparison between 0-D and 2-D models.
Table 5.
Energy generation comparison between 0-D and 2-D models.
| | Averaged Duration of Generating in Every Half Tide of the Typical Cycle (h) | Average Energy Generated in the Typical Cycle (Gwh) |
|---|
| 0-D model | 1.9 | 21.3 |
| 2-D model | 1.9 | 19.7 |
| change | 0% | −7.5% |
Table 6.
Comparison of optimisation scenarios without pumping.
Table 6.
Comparison of optimisation scenarios without pumping.
| Scenario | Energy (GWh) | Change to Fixed-Head Schedule 2-D (%) | Difference between 2-D and 0-D Energy Prediction (%) |
|---|
| 2-D Model | 1 0-D Model |
|---|
| Fixed-head schedule | 19.7 | 21.3 | - | −7.5% |
| Optimised | ET model | 22.7 | 23.5 | 15.6% | −3.2% |
| ETN model | 22.8 | 23.6 | 15.7% | −3.2% |
| EH model | 22.8 | 23.8 | 15.8% | −4.3% |
| EHN model | 22.9 | 24.0 | 16.0% | −4.6% |
Table 7.
Comparison of optimisation scenarios with pumping.
Table 7.
Comparison of optimisation scenarios with pumping.
| Scenario | Energy (GWh) | Change to Fixed-Head Schedule 2-D (%) | Difference between 2-D and 0-D Energy Prediction (%) |
|---|
| 2-D Model | 1 0-D Model |
|---|
| Fixed-head schedule | 19.7 | 21.3 | - | −7.5% |
| Optimised | ETP model | 25.3 | 26.7 | 28.4% | −5.0% |
| ETNP model | 25.4 | 26.7 | 29.0% | −4.8% |
| EHP model | 25.4 | 27.0 | 29.0% | −5.9% |
| EHNP model | 25.5 | 27.1 | 29.6% | −5.8% |


