Article

Localization Approach Based on Ray-Tracing Simulations and Fingerprinting Techniques for Indoor–Outdoor Scenarios

by
Antonio Del Corte-Valiente
*,
José Manuel Gómez-Pulido
,
Oscar Gutiérrez-Blanco
and
José Luis Castillo-Sequera
Department of Computer Engineering, Polytechnic School, University of Alcala, 28871 Alcalá de Henares, Spain
*
Author to whom correspondence should be addressed.
Energies 2019, 12(15), 2943; https://doi.org/10.3390/en12152943
Submission received: 7 July 2019 / Revised: 28 July 2019 / Accepted: 29 July 2019 / Published: 31 July 2019
(This article belongs to the Special Issue Wireless Rechargeable Sensor Networks 2019)

Abstract

:
The increase of the technology related to radio localization and the exponential rise in the data traffic demanded requires a large number of base stations to be installed. This increase in the base stations density also causes a sharp rise in energy consumption of cellular networks. Consequently, energy saving and cost reduction is a significant factor for network operators in the development of future localization networks. In this paper, a localization method based on ray-tracing and fingerprinting techniques is presented. Simulation tools based on high frequencies are used to characterize the channel propagation and to obtain the ray-tracing data. Moreover, the fingerprinting technique requires a costly initial learning phase for cell fingerprint generation (radio-map). To estimate the localization of mobile stations, this paper compares power levels and delay between rays as cost function with different distance metrics. The experimental results show that greater accuracy can be obtained in the location process using the delay between rays as a cost function and the Mahalanobis distance as a metric instead of traditional methods based on power levels and the Euclidean distance. The proposed method appears well suited for localization systems applied to indoor and outdoor scenarios and avoids large and costly measurement campaigns.

Graphical Abstract

1. Introduction

Localization is an important aspect of GPS-alternative positioning systems and has considerable importance in general communications areas [1]. The development of new radio access standards prompted the exploration of new techniques to improve the location accuracy, which is based on the signals available from the wireless devices that comprise these standards [2,3,4,5,6]. In this communication, the problem of the indoor location, which is based on the signals available in the wireless devices that comprise Wi-Fi and Wi-Max networks within the broadband wireless systems, is presented [7,8,9,10]. The location process employs a fingerprinting technique that operates with the relationship between the levels of power and/or relative delays between signals due to the multipath by reflections effect [11]. By comparing other techniques, such as the angle of arrival (AOA) or time of arrival (TOA), which presents several limitations due to multipath effects and non-line of sight (N-LOS), implementation of the fingerprinting technique is relatively easy [12]. In traditional indoor location systems based on Wi-Fi networks, the Euclidean distance between the radio frequency (RF) power levels of the received signals and the RF levels stored in a database (radio-map) is employed as a metric in the location process [13]. Due to an increase in new broadband networks (UWB), for example, Wi-Max, the exploration of new techniques is necessary to improve the location accuracy using alternative detection methods based on the relative delays of available signals in the observing points, which are provided by these emergent technologies [14,15]. In this study, we proposed a novel fingerprinting technique using the relative ray delays due to the ray-tracing effects as fingerprints instead of RSSI. Greater accuracy will be obtained by this technique.
The remainder of this paper is organized as follows: In Section 2, a review of the localization techniques is presented. Section 3 describes the algorithms and techniques that have been developed and introduces the ray-tracing theory. In Section 4, simulated scenarios are introduced, and the corresponding results are presented. Section 5 discusses the challenges and open issues of the localization in real-world situations. Conclusions are presented in Section 6.

2. Review of Techniques for Localization

As our research includes a study of localization algorithms in distributed wireless networks that are applied to hybrid scenarios, describing the techniques that can be employed is important. In this section, we briefly review the state of the techniques that can be applied for localization in hybrid indoor–outdoor environments. The following techniques are described:
  • Time of arrival (ToA)
  • Time difference of arrival (TDoA)
  • Angle of arrival (AoA)
  • Received signal strength (RSS)
  • Hybrid techniques
  • Fingerprinting technique

2.1. Time of Arrival

In the technique of location by time of arrival (ToA), the distance between a mobile and an antenna is directly proportional to the propagation time [16]. To determine the position in 2D, the measurements made with the ToA technique must be made with respect to at least three reference points. By geometric calculations (technique known as lateration), the points of intersection in the ToA circles are obtained, the propagation time in one direction is measured and the distance between the transmitter and the receiving unit is calculated [17].

2.2. Time Difference of Arrival

The idea of the time difference of arrival (TDoA) technique is to determine the relative position of the mobile by examining the time difference in which the different signals reach the receiver instead of obtaining the absolute time of arrival. For each TDoA measurement, the transmitter must resolve a hyperboloid between the two units of measurement [18].

2.3. Angle of Arrival

The angle of arrival (AoA) technique, which is also referred to as the direction of arrival (DoA), uses multi-array antennas to determine the angle of arrival of the incoming signal from the mobile target via spatial diversity of the antennas [19,20].
In the AoA technique, the estimation of the target mobile can be obtained by intersecting pairs of line angles, which are each formed by a circle of radius from the base station to the target mobile [21,22].

2.4. Received Signal. Strength (RSS)

The RSS detection method is based on the loss of power that the signal experiences in the propagation medium as the power of the signal in the free space decays with the square of the distance. This method applies the received signal strength indicator (RSSI) parameter, which collects the power with which the signal from the target mobile to be located arrives at the receiving station [23,24,25]. The distance between the target mobile and the base stations can be calculated using the RSSI value considering the losses in the propagation.
Due to the various shadows and multipath effects in indoor environments, path-loss models are not always available. In addition, the parameters of the model directly depend on the scenario. The accuracy of this technique can be increased using the RSSI measurements in areas around the base stations or multiple measurements from several base stations [26,27].

2.5. Hybrid. Techniques

Implementation of a hybrid system that combines AoA and ToA [28,29], in which ToA forms a circle to which it cuts a straight AoA line, is possible and offers greater accuracy and a shorter response time [30]. Another possible solution is to combine ToA and TDoA. With this system, the deficiencies of the TDoA technique in NLOS environments are improved [31]. AoA and TDoA have also been combined to improve accuracy and limit multipath effects, which enables locating only with two base stations via the intersection of the straight line and the hyperbola of the AoA and TDoA measurements [32,33]. Some techniques combine measures of time and power [34].

2.6. Fingerprinting Techniques

In recent years, location-based services (LBS) have proliferated; however, the main challenge is to determine the locations of mobile terminals within a certain accuracy.
As we have indicated, traditional localization techniques based on radio frequency are subjected to strong fluctuations in a signal due to the NLOS between transmitters-receivers and other causes, such as the multipath effect, which produces variations in the information of the parameter RSSI applied as a pattern in the localization process.
To avoid these signal fluctuations, an increase in the number of access points in the scenario is possible to minimize the cases of NLOS. This idea served as the basis for introducing the fingerprinting technique, which consists of comparing the available power levels in a set of points, as fingerprints, in known positions with those obtained in the target mobiles to be located when they are excited by the same antennas. The final position of the mobile is determined by assigning the coordinates of the fingerprint of the shortest distance in the scenario.
The fingerprinting technique is a deterministic localization method that is divided into two phases:
  • Off-line phase: It constitutes the calibration phase in which a database or radio-map is generated with the power measurements obtained on the mesh fingerprinting when excited by the antennas of the environment.
  • On-line phase: it constitutes the testing phase; a significant number of mobile stations are randomly located within the coverage area of the radio-map to obtain the corresponding power measurements when excited by the same antennas.
The vector with the values of the different RSSI measurements obtained in a certain position of the mesh is referred to as the location of the fingerprinting in this point. The estimation of the location is obtained by an algorithm that computes the distance between a fingerprint and a target. In most cases, the Euclidean distance, although other distance metrics can be employed (refer to Section 3.1), between the RSS values in the target mobiles (on-line phase) and the RSS values of each fingerprint stored in the radio-map (off-line phase) is computed. The coordinates associated with the fingerprint that provides the shortest distance metric are utilized as the final position for the target mobile (Figure 1).
The most common application of this method is the location in indoor environments [35,36,37]. In Ref. [38], the properties of the RSSI signal are analysed. In Ref. [39], a study is presented with the estimation of the expected error using this technique. In Ref. [40], a study of channel modelling is presented. In Ref. [41], an improvement of the algorithm is presented using interpolation with neighbouring fingerprints (K-NN).
For outdoor applications, we identify a classic study in Ref. [42]. Using fingerprinting outside the Wi-Max standard, a localization proposal is presented in Ref. [43]. Conversely, in Ref. [44], the fingerprinting technique is presented as a complement to the external location when the GPS signal is degraded or not available.
One of the largest problems with this technique used for outdoor locations is the large number of fingerprints that is needed in the off-line phase of the algorithm to obtain the required accuracy. In Refs. [45,46], clustering techniques are proposed to minimize this impact. In Ref. [47], hyperbolic techniques are employed to optimize the changes in the environment in the off-line phase.
As one of the main problems is the variability of the radio signal [48], learning techniques are proposed in Ref. [49] to predict the fluctuations in the signal. Similarly, Ref. [50] introduces neural networks that enable modelling of the channel.
Additionally, several studies expand the possibilities of the fingerprinting technique, which is primarily employed with Wi-Fi, to other standards and applications. In Ref. [51], a neural network on UWB is introduced. Other standards include ZIGBEE in Ref. [52] and RFID in Ref. [53]. In Ref. [54], the fingerprinting technique is combined with a Kalman filter to estimate trajectories in indoor environments.

2.7. Summary

This section presents a comparison of several figures of merit, such as, cost, precision, energy efficiency, and complexity, related with the techniques previously presented. As can be seen in Table 1, the fingerprinting algorithm combined with the hybrid detection method (in our study, power level and ray-delay) present the best results.

3. Novel Localization Techniques

In this section, the localization techniques developed in this study are presented. Although these techniques are based on the fingerprinting method, instead of using the RSSI information of the received power detected in each fingerprint, information about the relative delay between two rays due to multipath effects is employed. The final objective is to increase the accuracy of a location in hybrid indoor–outdoor scenarios, where existing localization solutions do not guarantee adequate accuracy or coverage [55,56,57].
First, different distance metrics that are proposed to match the off-line and on-line phases of the fingerprinting technique are introduced. Second, different detection techniques that are used as cost functions are detailed. Last, additional techniques that improve the localization accuracy are presented.

3.1. Distance Metrics

A distance metric is a key component that is utilized by the fingerprinting technique in the localization process [58]. Exploration of different similarity measures is important to determine the best distance metric that minimizes the positioning average error. Four metrics have been implemented to explore improving the location accuracy. The vector of sample F denotes the data from the fingerprints (radio-map), vector of sample T denotes the data from the target mobiles, and N is the number of antennas available in the scenario.
In the Euclidean distance Equation (1), the mobile station will have more confidence in the fingerprint radio map if the distance is smaller. A more moderate approach is obtained with the Manhattan distance Equation (2) using the sum of the absolute differences rather than their squares as the total measure of dissimilarity. In the Bray-Curtis Equation (3) distance, the numerator signifies the difference, and the denominator normalizes the difference. For the Mahalanobis distance Equation (4), the (F-T)’ term denotes the (F-T) transpose vector, and the Cov term denotes the covariance matrix, where the retrieval performance is sensitive to the scenario topology. The idea is to find the coordinates of ( x i , y i ) T that minimize the distance to ( x i , y i ) F :
D E ( F , T ) = i = 1 N ( F i T i ) 2
D M ( F , T ) = i = 1 N | F i T i |
D B C ( F , T ) = i = 1 N | F i T i | F i + T i
D M a h ( F , T ) = ( F T ) C o v ( F ) 1 ( F T )

3.2. Cost Function Based on RSSI

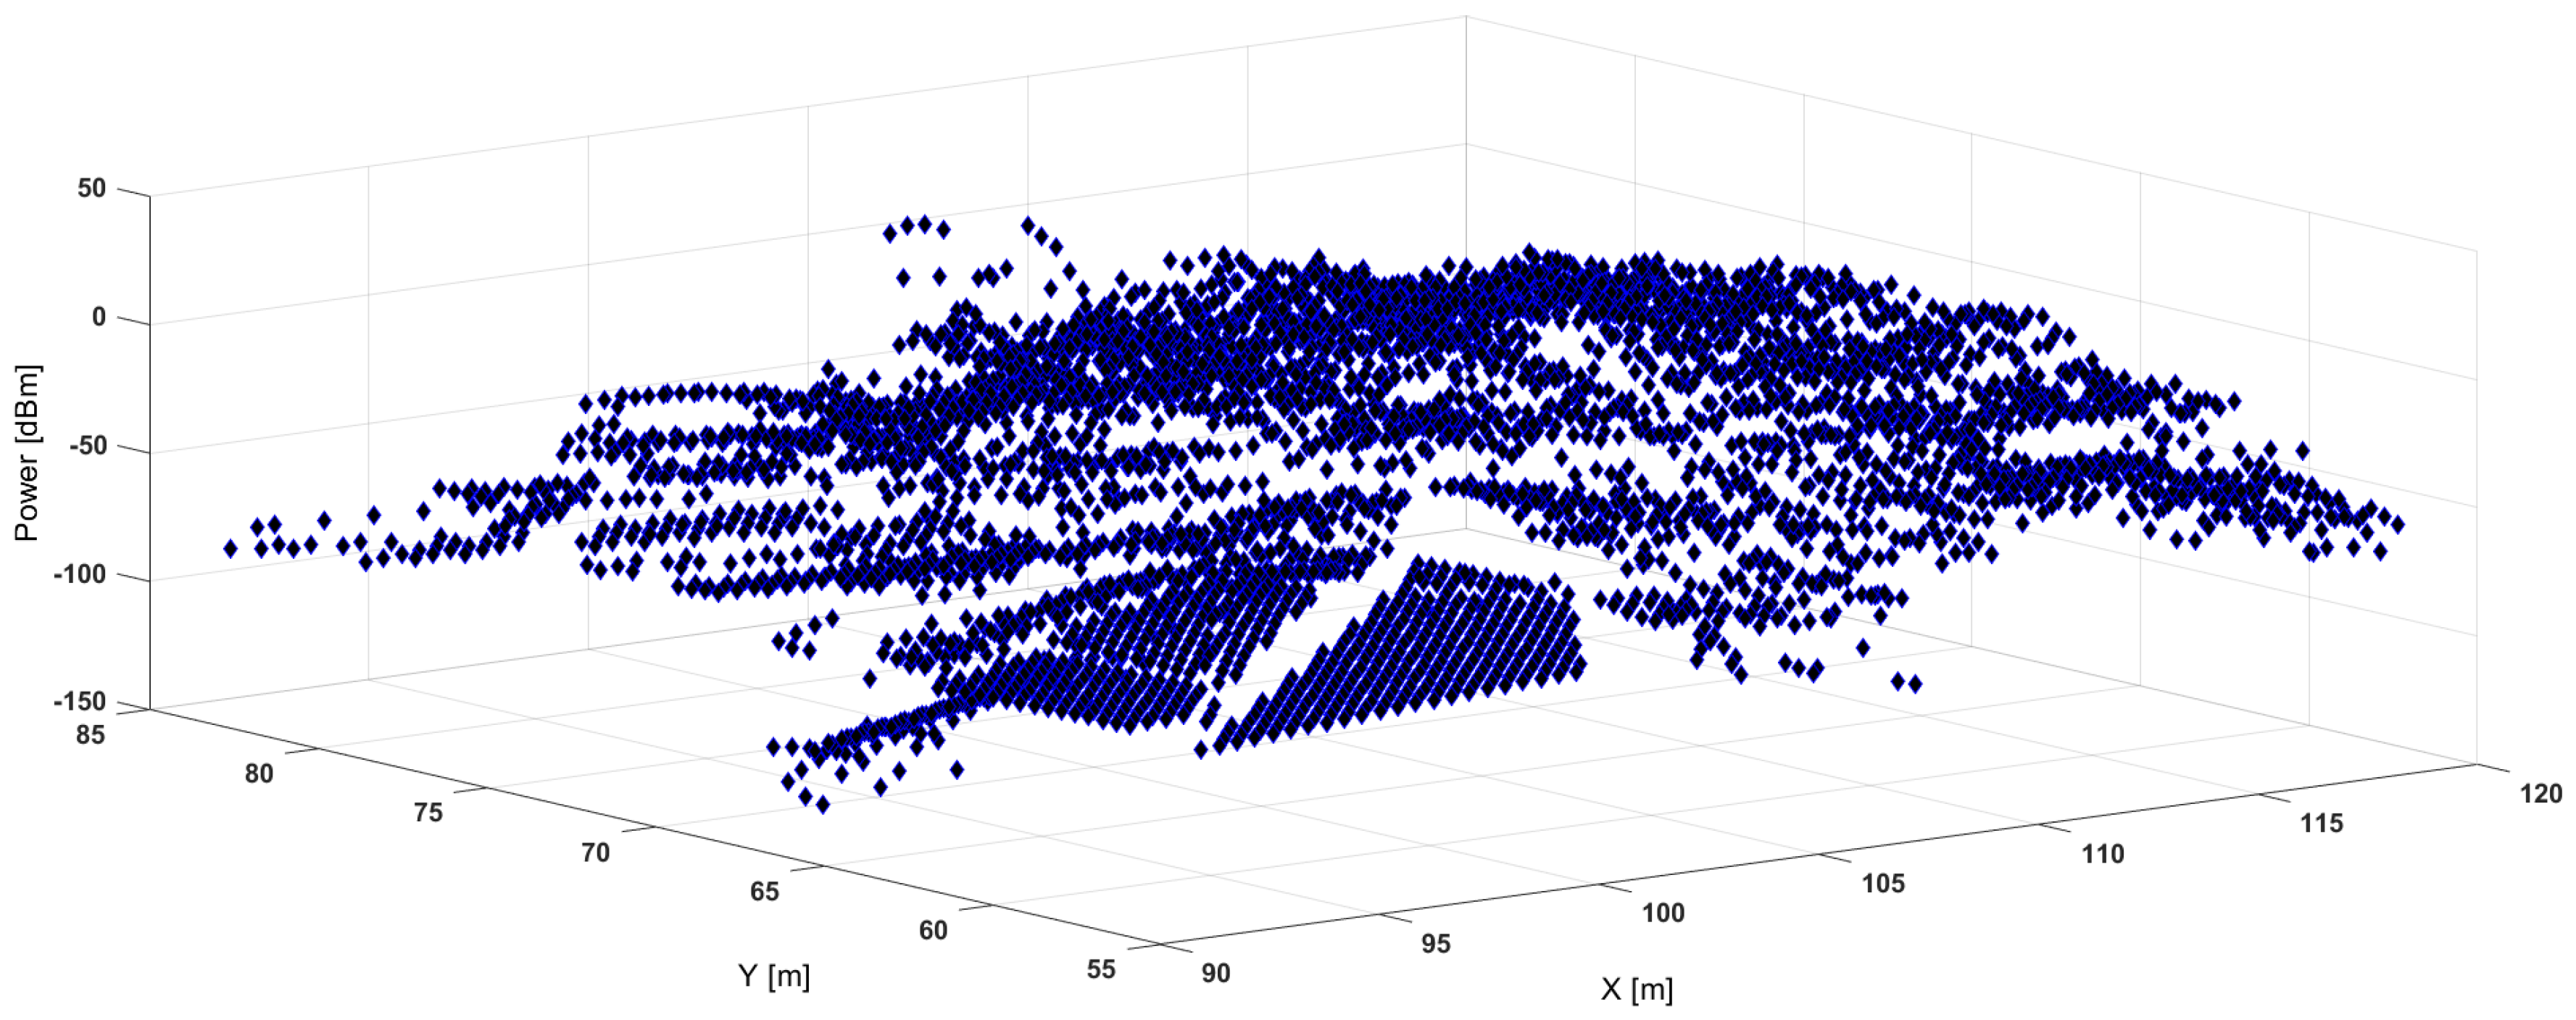
When the detection method employed in the fingerprinting technique is based on power levels, the distribution of RSSI is obtained from each fingerprint and each access point available in the scenario. Figure 2 shows a distribution of the power levels due to all fingerprints in a generic scenario. It shows the power level (in dBm units) in each fingerprint available in the radio-map. The level of power depends on the position of the fingerprint with respect to each AP, and hence, of the scenario. Lower values of power mean that a specific fingerprint is not seen by all APs. Conversely, higher values of power mean that the fingerprint is seen by most APs (an accumulative function is used to add to each fingerprint the values of power received by each AP). The map of power is unique, it is the information that identifies each fingerprint, and is used in the cost function represented by Equation (5).
For example, using the Euclidean Distance as a metric, the cost function measures the distance based on power levels (in dBm units) between each fingerprint ( R S S ( x , y ) F ) and each target mobile ( R S S ( x , y ) T ) and for each antenna (N) available in the scenario Equation (5).
D E ( F i , T i ) = i = 1 N ( ( R S S ( x i , y i ) F R S S ( x i , y i ) T ) 2 )

3.3. Cost Function Based on Relative Ray-Delay

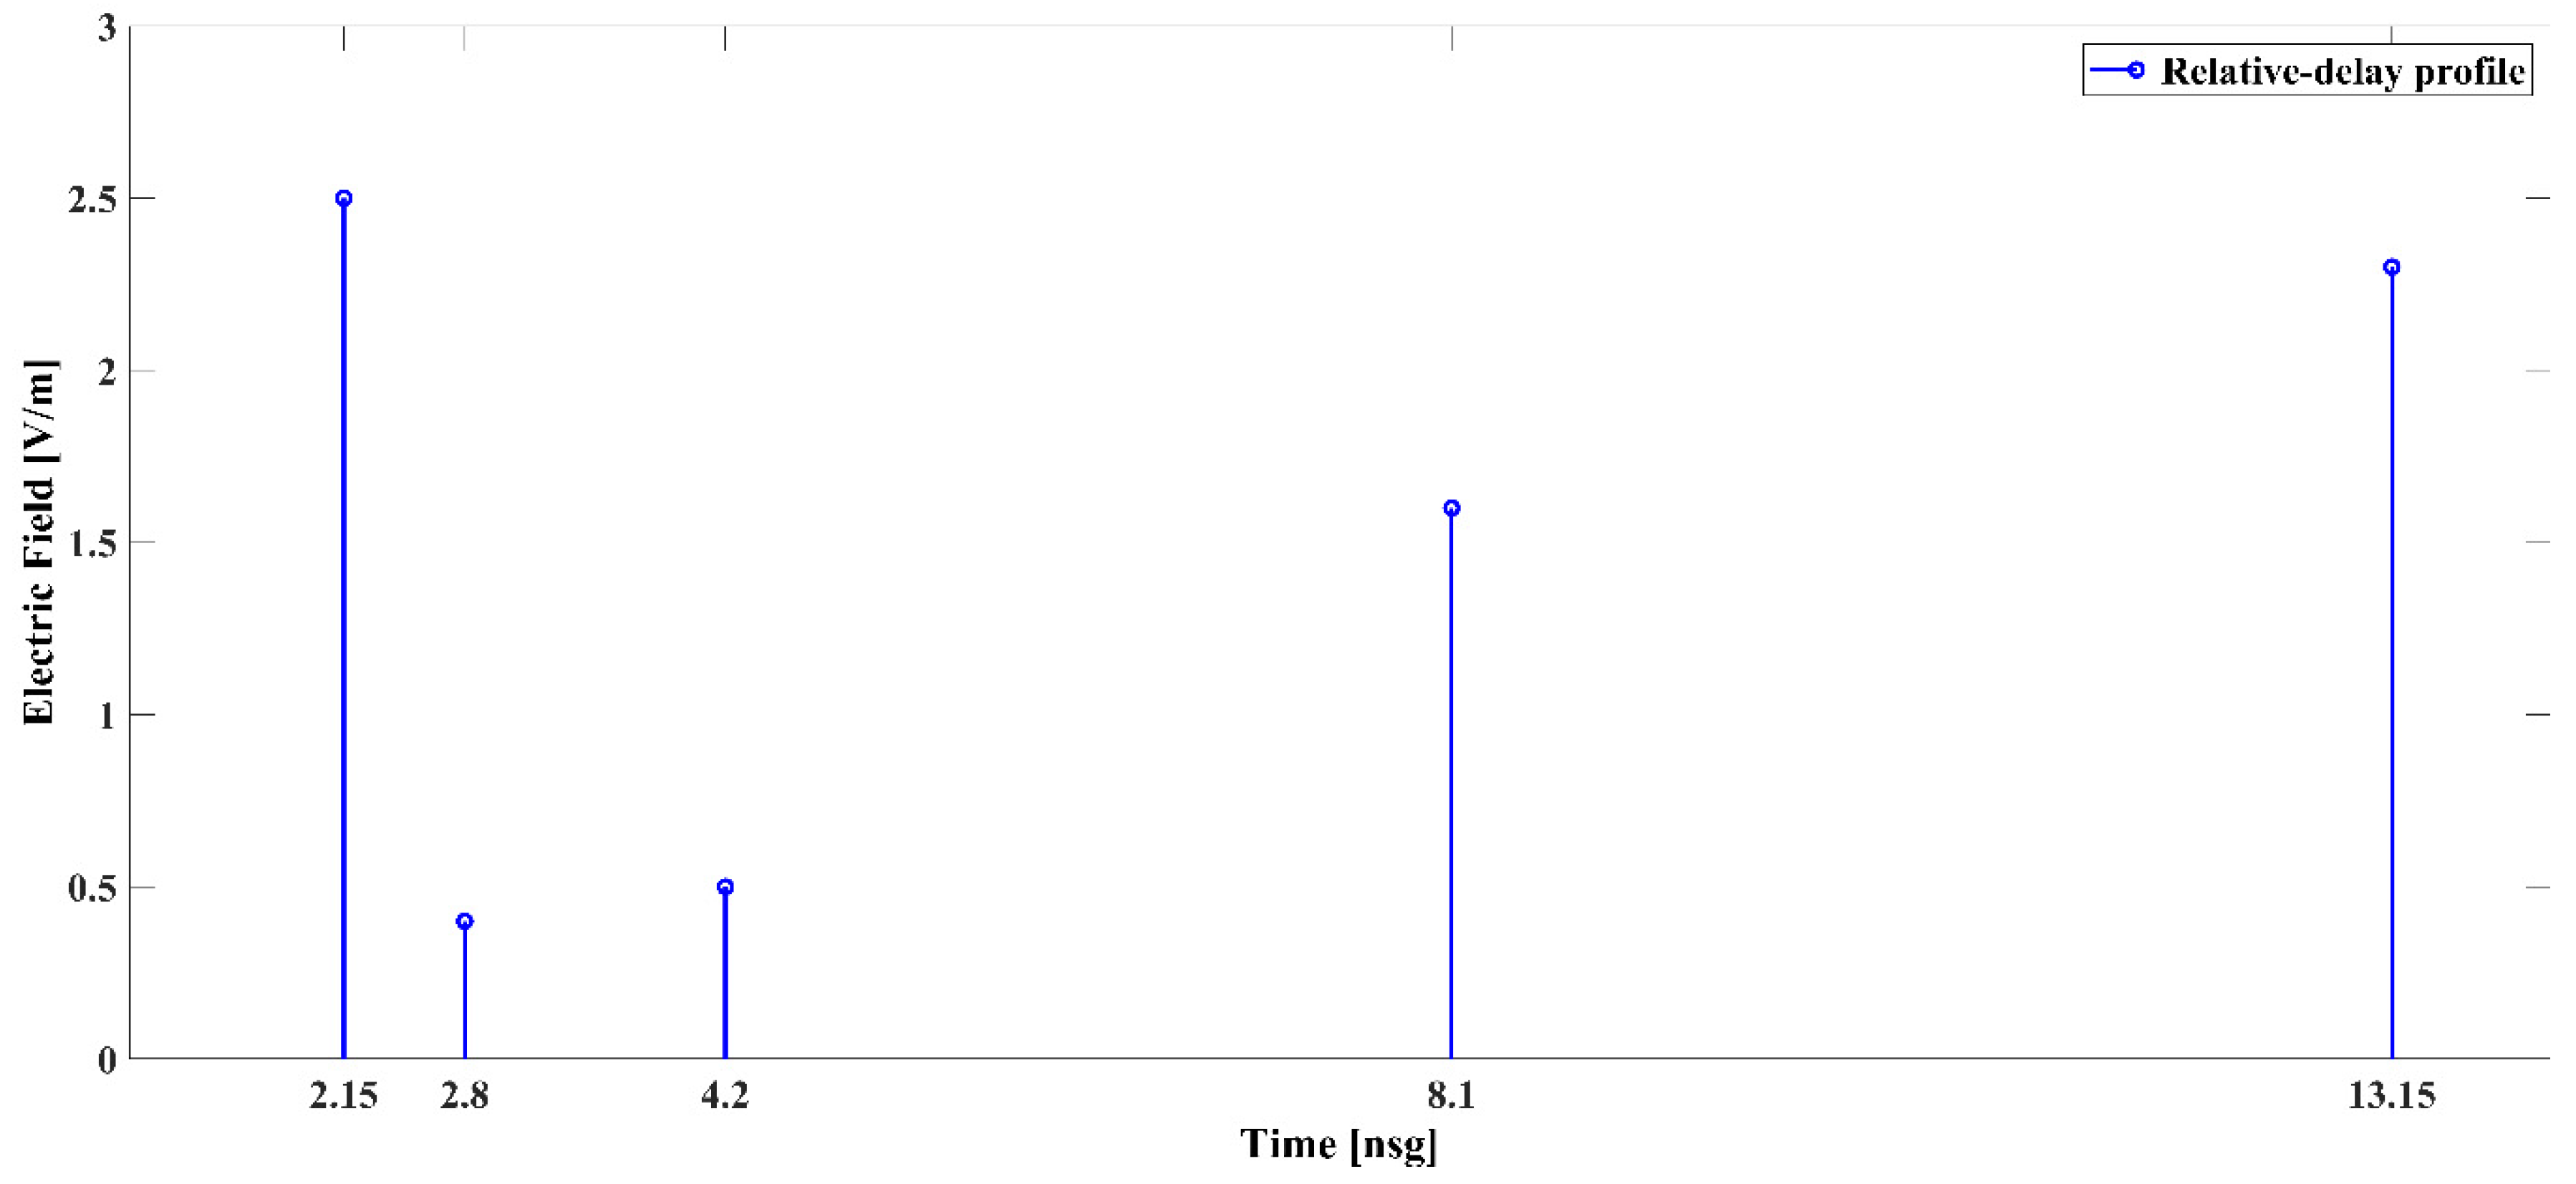
When the detection method used in the fingerprinting technique is based on the relative ray-delay, the Time Delay Ray (TDR) profile is obtained from each fingerprint and each access point available in the scenario. This detection method is based on the information provided by the ray-tracing due to the different effects: direct ray, reflected ray, diffracted ray, and any combination of them. Figure 3 shows an example of a ray-delay profile obtained in one fingerprint of the scenario.
This figure represents the arrival time and the power of each ray due to the different effects. The first ray to arrive is the direct ray between the AP and the receiver, the others, that arrive more delayed, are due to reflections, diffractions, double reflections, etc.; produced by the different obstacles present in the scenario. The TDR is the delay of each ray with respect to the first or the direct ray.
If the Euclidean Distance is used as a metric, the cost function measures the distance based on the ray-tracing profile (in nanoseconds units) between each fingerprint ( T D R ( x , y ) F ) and each target mobile ( T D R ( x , y ) T ), considering E as the number of ray-tracing effects and N as the number of access points (AP) in the scenario Equation (6).
D E ( F i , T i ) = i = 1 N ( j = 1 E ( T D R ( x i , y i ) F T D R ( x i , y i ) T ) 2 )

3.4. Hybrid. Detection

An alternative detection method consists in using both the power levels and the relative delays between two rays in a hybrid manner. The µ parameter was used to consider power levels or ray-delays. By applying this method in the Euclidean distance metric (Equation (8)), if the value of µ = 0.25 is already set (it was set to 0.25 by experimentation), we perform a hybrid detection between power levels and relative ray-delays. In this case, more weight is assigned to detection by ray-delays in fingerprints whose power level is at least four times below the power level of the corresponding mobile with respect to the same access point. Equation (7) can be easily extended to the remaining metrics.
D E ( F i , T i ) = µ · i = 1 N ( ( R S S ( x i , y i ) F R S S ( x i , y i ) T ) 2 ) + ( 1 µ ) · i = 1 N ( j = 1 E ( T D R ( x i , y i ) F T D R ( x i , y i ) T ) 2 )
The localization technique has been implemented by a novel detection algorithm that combines the profile of the relative ray-delay obtained from ray-tracing due to multi-path effects with different distances employed as the metric.
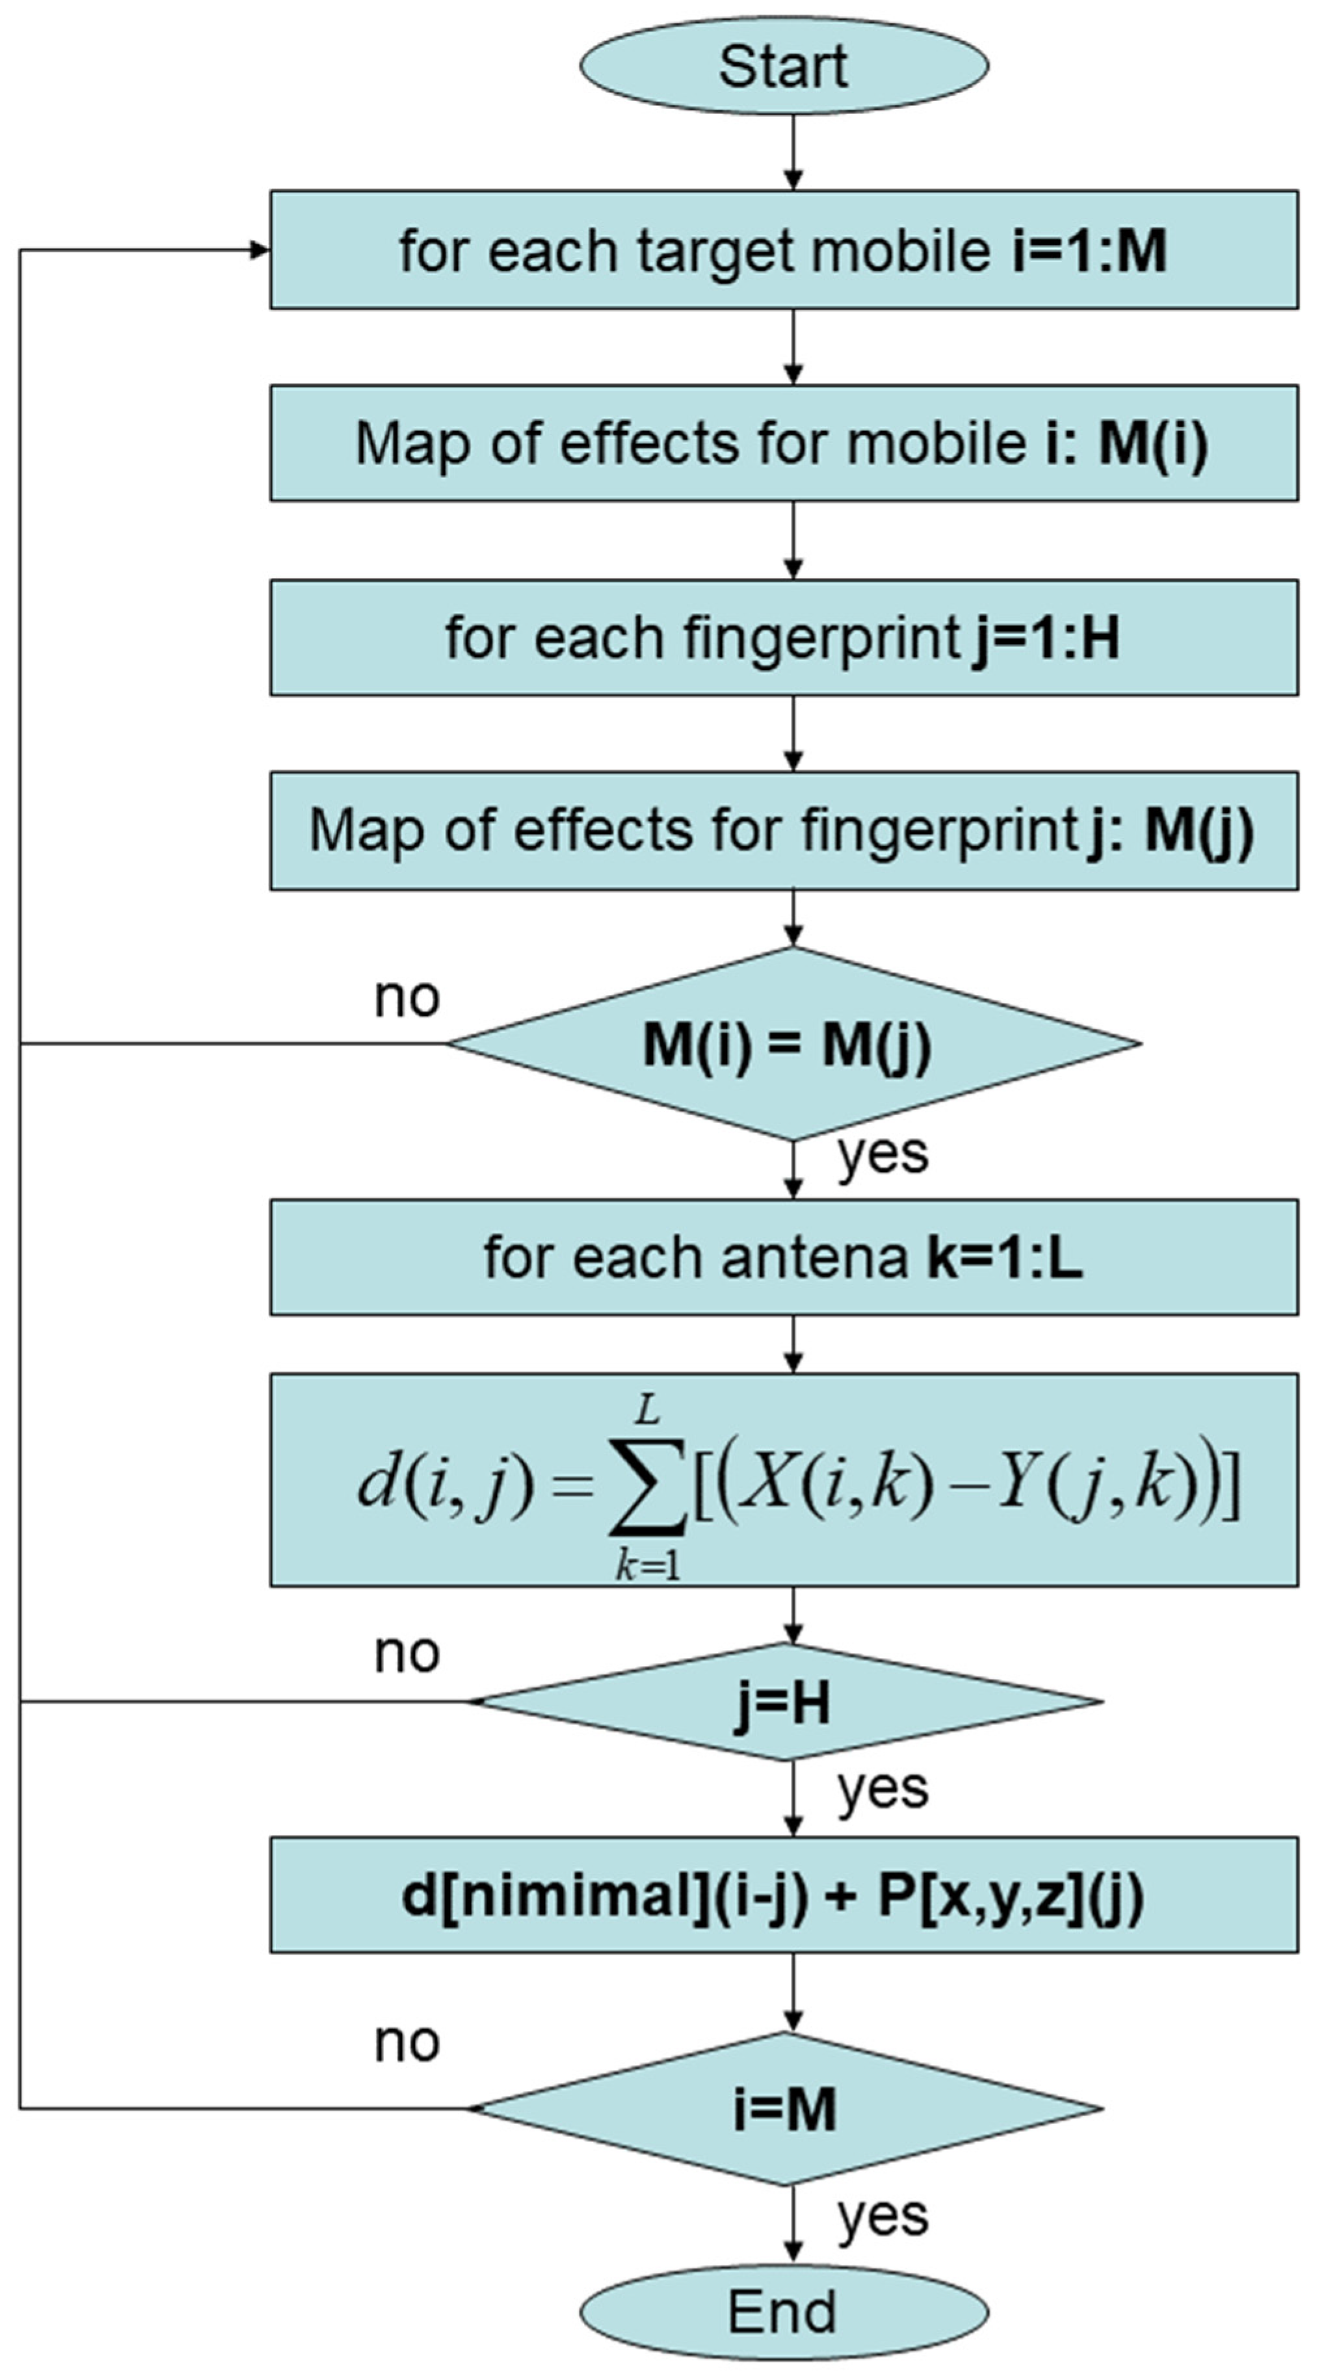
Figure 4 shows the pseudo-code of the algorithm used for hybrid detection. The algorithm first obtains the map of effects for both targets and fingerprints. Due to the multipath effects of the ray-tracing, only fingerprints and targets with the same map of effects (reflections, diffractions, and its combinations) are considered. If the map of effects is different, then the fingerprint is not considered and the next is processed. When a fingerprint and a target have the same map of effects, and for all the antennas used in the simulations, the algorithm computes the vector of metrics from a specific target to each fingerprint. If the algorithm reaches the last fingerprint, then it finds the minimal distance between the target and all the fingerprints and uses the coordinates of that fingerprint as position of the target. Finally, the algorithm repeats the process for the rest of the targets.

3.5. Interpolation

As an interpolation technique, we propose the K-Nearest Neighbours (K-NN) algorithm that considers the nearest k neighbours, instead of a single neighbour by assigning the majority category of the set of K neighbours. The interpolation technique is applied in the on-line phase of the fingerprinting technique by seeking the k-fingerprints that are closest to the target mobile based on the error information obtained when applying the corresponding distance metric.
In addition, a pre-filter removes incoherent values from the radiomap when a specific transmitter is not seen at all (out of range or defective). In these cases, an interpolation with neighbouring values is applied.
Figure 5 shows the concept of interpolation over four random fingerprints, and Equation (8) represents the mathematical concept, where N is the number of fingerprints employed in the interpolation process, and X j is the value of the distance between the mobile to be located and the j-fingerprint. OldPosition refers to the (x, y, x) coordinates of the target before the interpolation, and NewPosition refers to the new target coordinates after the interpolation.
N e w P o s i t i o n   ( x , y , z ) = j = 1 N ( O l d P o s i t i o n   ( x , y , z ) X j ) j = 1 N ( 1 X j )

4. Ray-Tracing Theory

Powerful electromagnetic simulation tools, which are capable of accurately reproducing the values of radioelectric signals that would be obtained in the real case, have been developed. NewFasant [59] is a tool that simulates antennas on board platforms, such as satellites and aircrafts, and radio wave propagation in urban and indoor scenarios [60,61,62]. This software has been developed by the Electromagnetic Computational group of the Alcala University and is based on asymptotic techniques, such as physical optics, combined with the Physical Theory of Diffraction (PO/PTD) and Geometrical Optics (GO) with the Uniform Theory of Diffraction (UTD) [63,64].
The NewFasant programme can be applied to different electromagnetic problems: study of the propagation in outdoor/indoor environments, mobile communications, radar cross-section of complex structures, electromagnetic compatibility, analysis and design of antennas, and radiation patterns of antennas on board complex structures.
Given a source point (transmitter antenna), the ray-tracing technique determines the number of rays that arise to a given observation point. To achieve this goal, possible reflections and diffractions in the environment are considered. In addition, a detailed description of the environment is important for a precise calculation of the rays involved in the propagation model. The geometrical information uses Non-Uniform Rational Bezier Splines (NURBS) surfaces. To obtain the ray-tracing paths between a source and a destination, two steps exists:
  • Obtain all points that define the ray-path (reflection and diffraction points).
  • Discard the rays occluded by any part of the geometry to perform the shadowing test.
Figure 6 shows an example of ray-tracing in a complex scenario. This area is an area of Terminal 4 of the Adolfo-Suarez Barajas Airport in Madrid. A parked airplane is placed beside a finger, an antenna is placed in front of the aircraft, and an observation point is placed in front of the antenna. The NewFasant software computes all rays generated from the antenna to the receiver.
In Figure 6, the antenna is the red dot. The observation point of black colour is the point that can be seen in front of the plane. The colour of the rays depends on the effect: yellow is the double reflection and the other colours correspond to other effects (reflection, reflection-diffraction, etc.).
NewFasant provides associated information about each ray, such as the power level at the observation point (RSS), time of arrival (ToA) and direction of arrival (TDoA). Different ray-tracing effects (direct ray, reflected ray, and diffracted ray) and multiple combinations of them, such as the double reflections effect and reflection-diffraction effect, can be taken into account (Figure 7). With this information provided by NewFasant, the profile of the relative delays between rays (as shown in Figure 3) can be obtained, and the localization cost function can be computed according to expression 7.
The computational cost associated with ray tracing is very high but speeding algorithms, such as Angular Z-buffer [65], can considerably reduce the computational time. This reduction enables the analysis of an excessive number of observation points in complex structures, such as an airport with parked aircrafts in a short period.
Table 2 shows the computational cost obtained for different configurations of the number of antennas and number of reflections.

5. Validations and Results

The aim is to simulate various localization scenarios using the techniques described here, using powerful and precise ray tracing tools. First, we simulate typical indoor scenarios. Second, we conduct outdoor simulations in more complex environments.
The performance of any localization algorithm depends on the quality of the scenario under testing. For this reason, in each scenario, a complex CAD model of plane facets for the geometrical description of the environment was used to study the fast fading caused by multipath propagation and the interference between the different paths. Because the accuracy of the results depends on network geometry [66,67], different granularities (grid size) were used in the simulations. To evaluate the performance of each algorithm in the different tested scenarios, two statistical indicators, which will be applied to make comparisons, have been established. These indicators are the total average error ( A v E r r o r ), as an indicator of first order, and the typical deviation ( T y p D e v ), as a second-order indicator. The results have been analysed in the MATLAB environment.

5.1. Indoor Scenarios

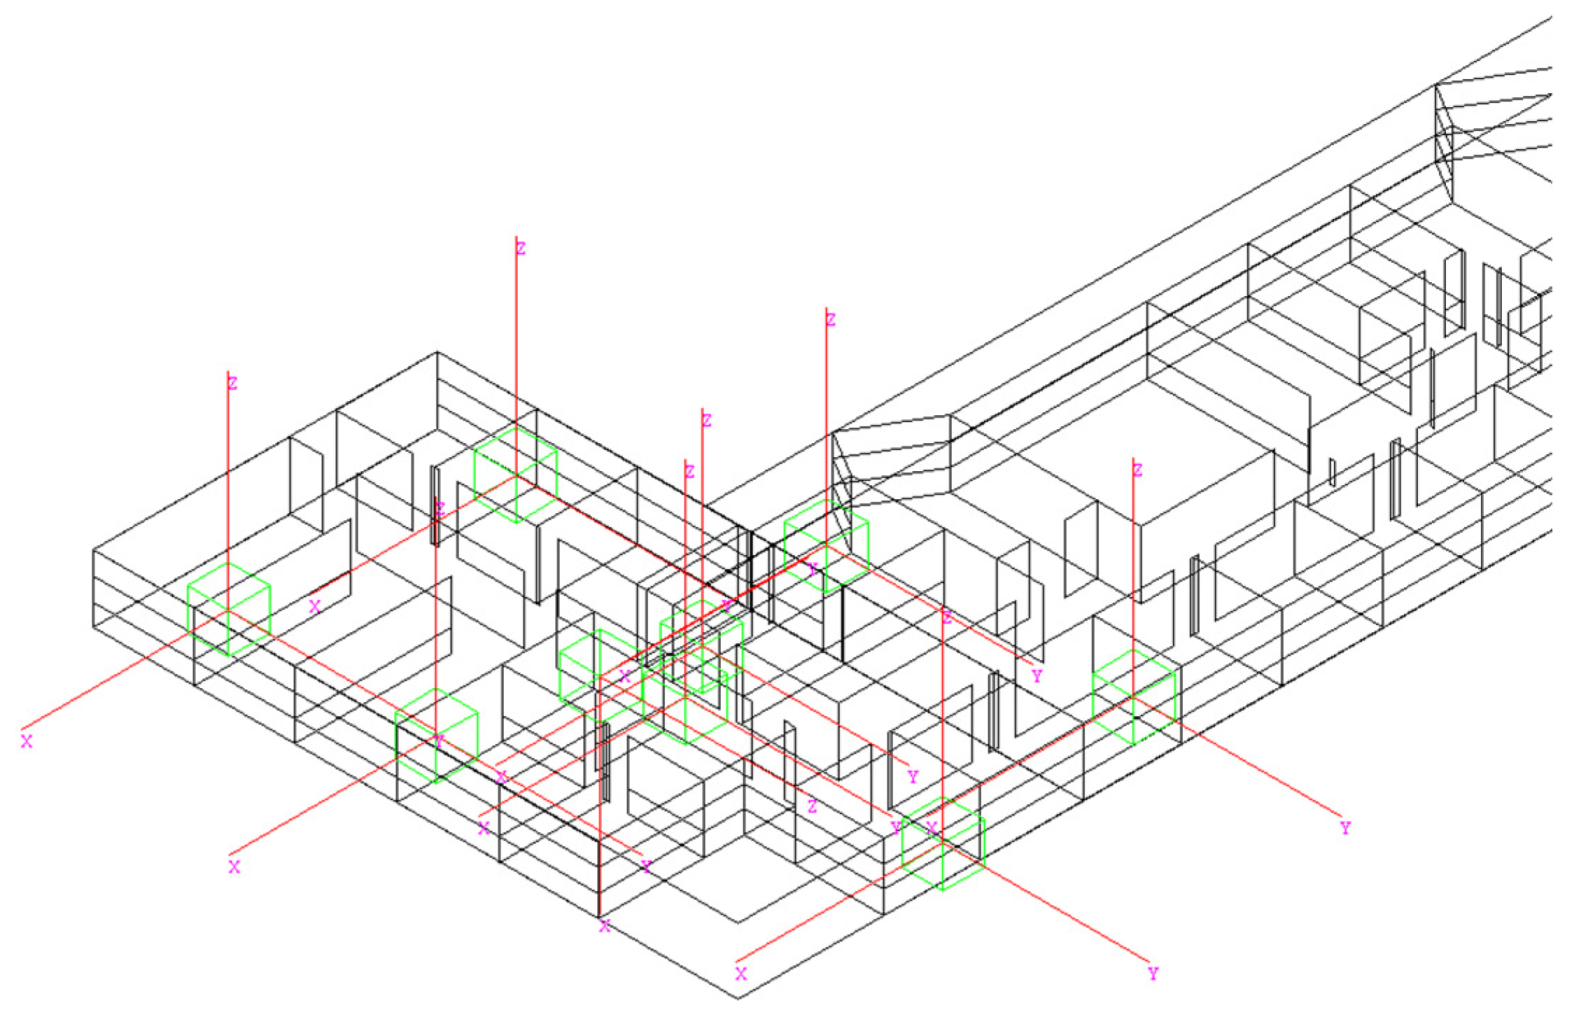
The indoor scenario that is analysed corresponds to a real section of the Polytechnic building in Madrid, Spain (Figure 8).
Four different scenarios were analysed. A total of 99 target mobiles and 9 APs were employed at two different frequencies (2.4 and 5.2 GHz):
  • Grid size of 72 × 72 m with 5184 fingerprints at 2.4 GHz
  • Grid size of 72 × 72 m with 5184 fingerprints at 5.2 GHz
  • Grid size of 36 × 36 m with 1296 fingerprints at 2.4 GHz
  • Grid size of 36 × 36 m with 1296 fingerprints at 5.2 GHz
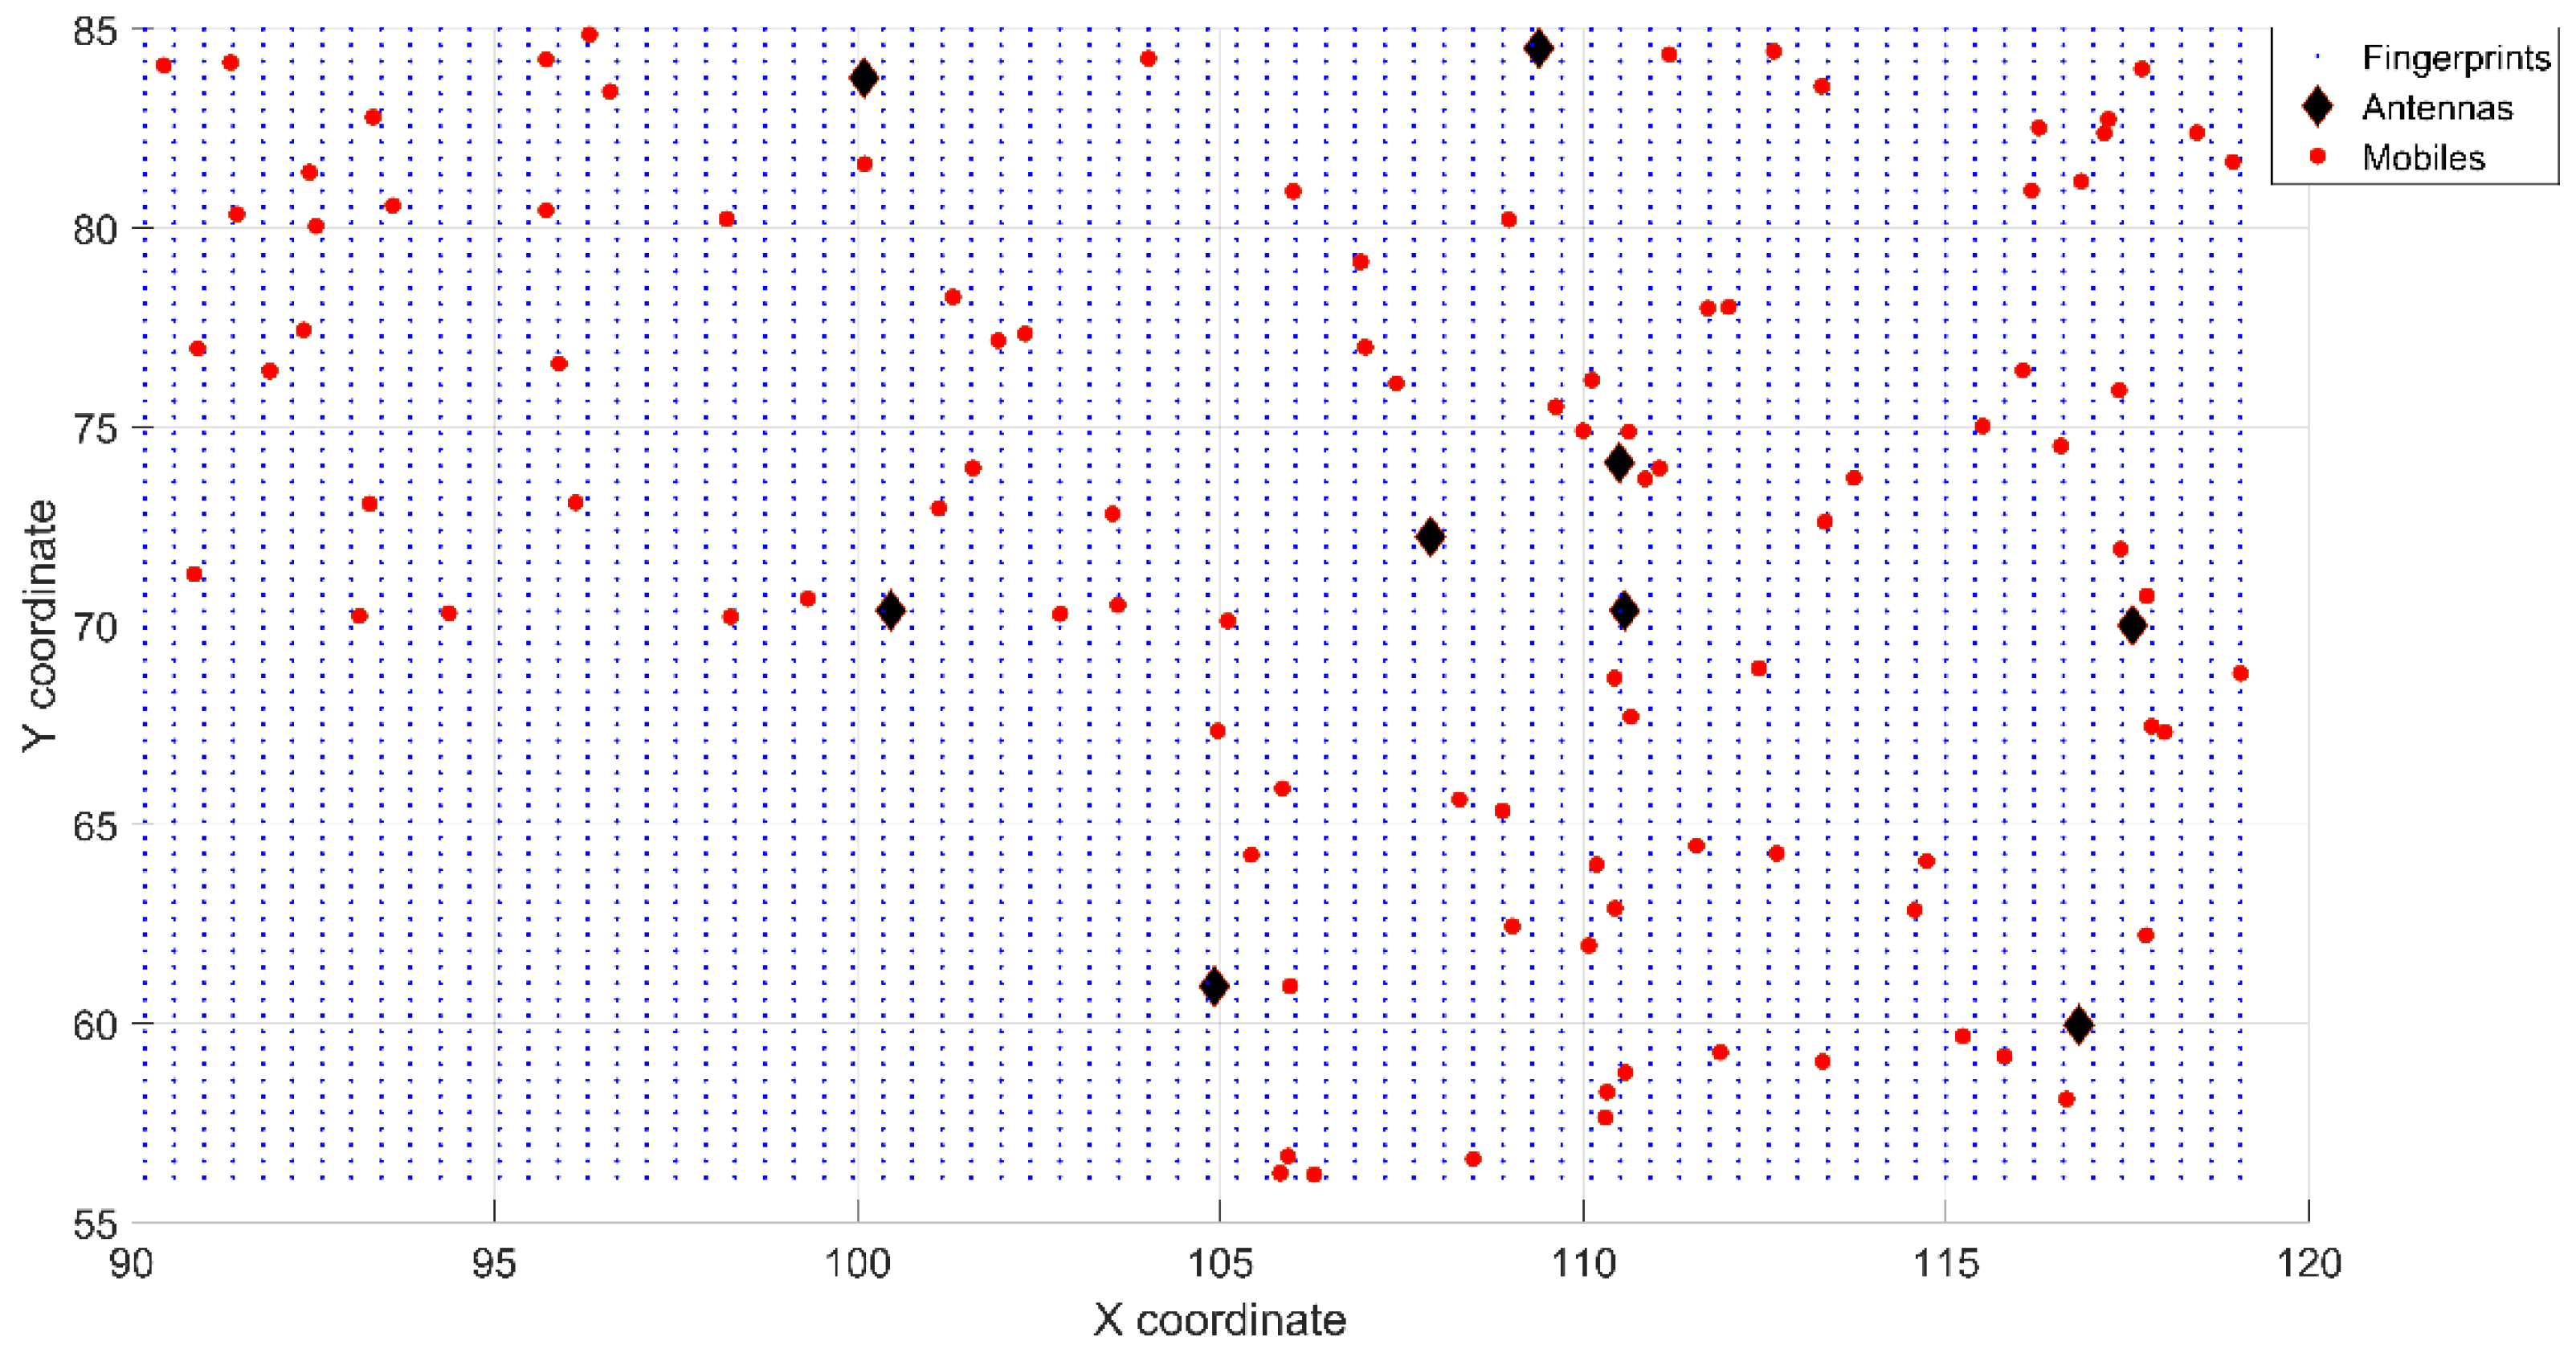
Figure 9 shows a 2D view of the simulation area that corresponds with scenario number 3.
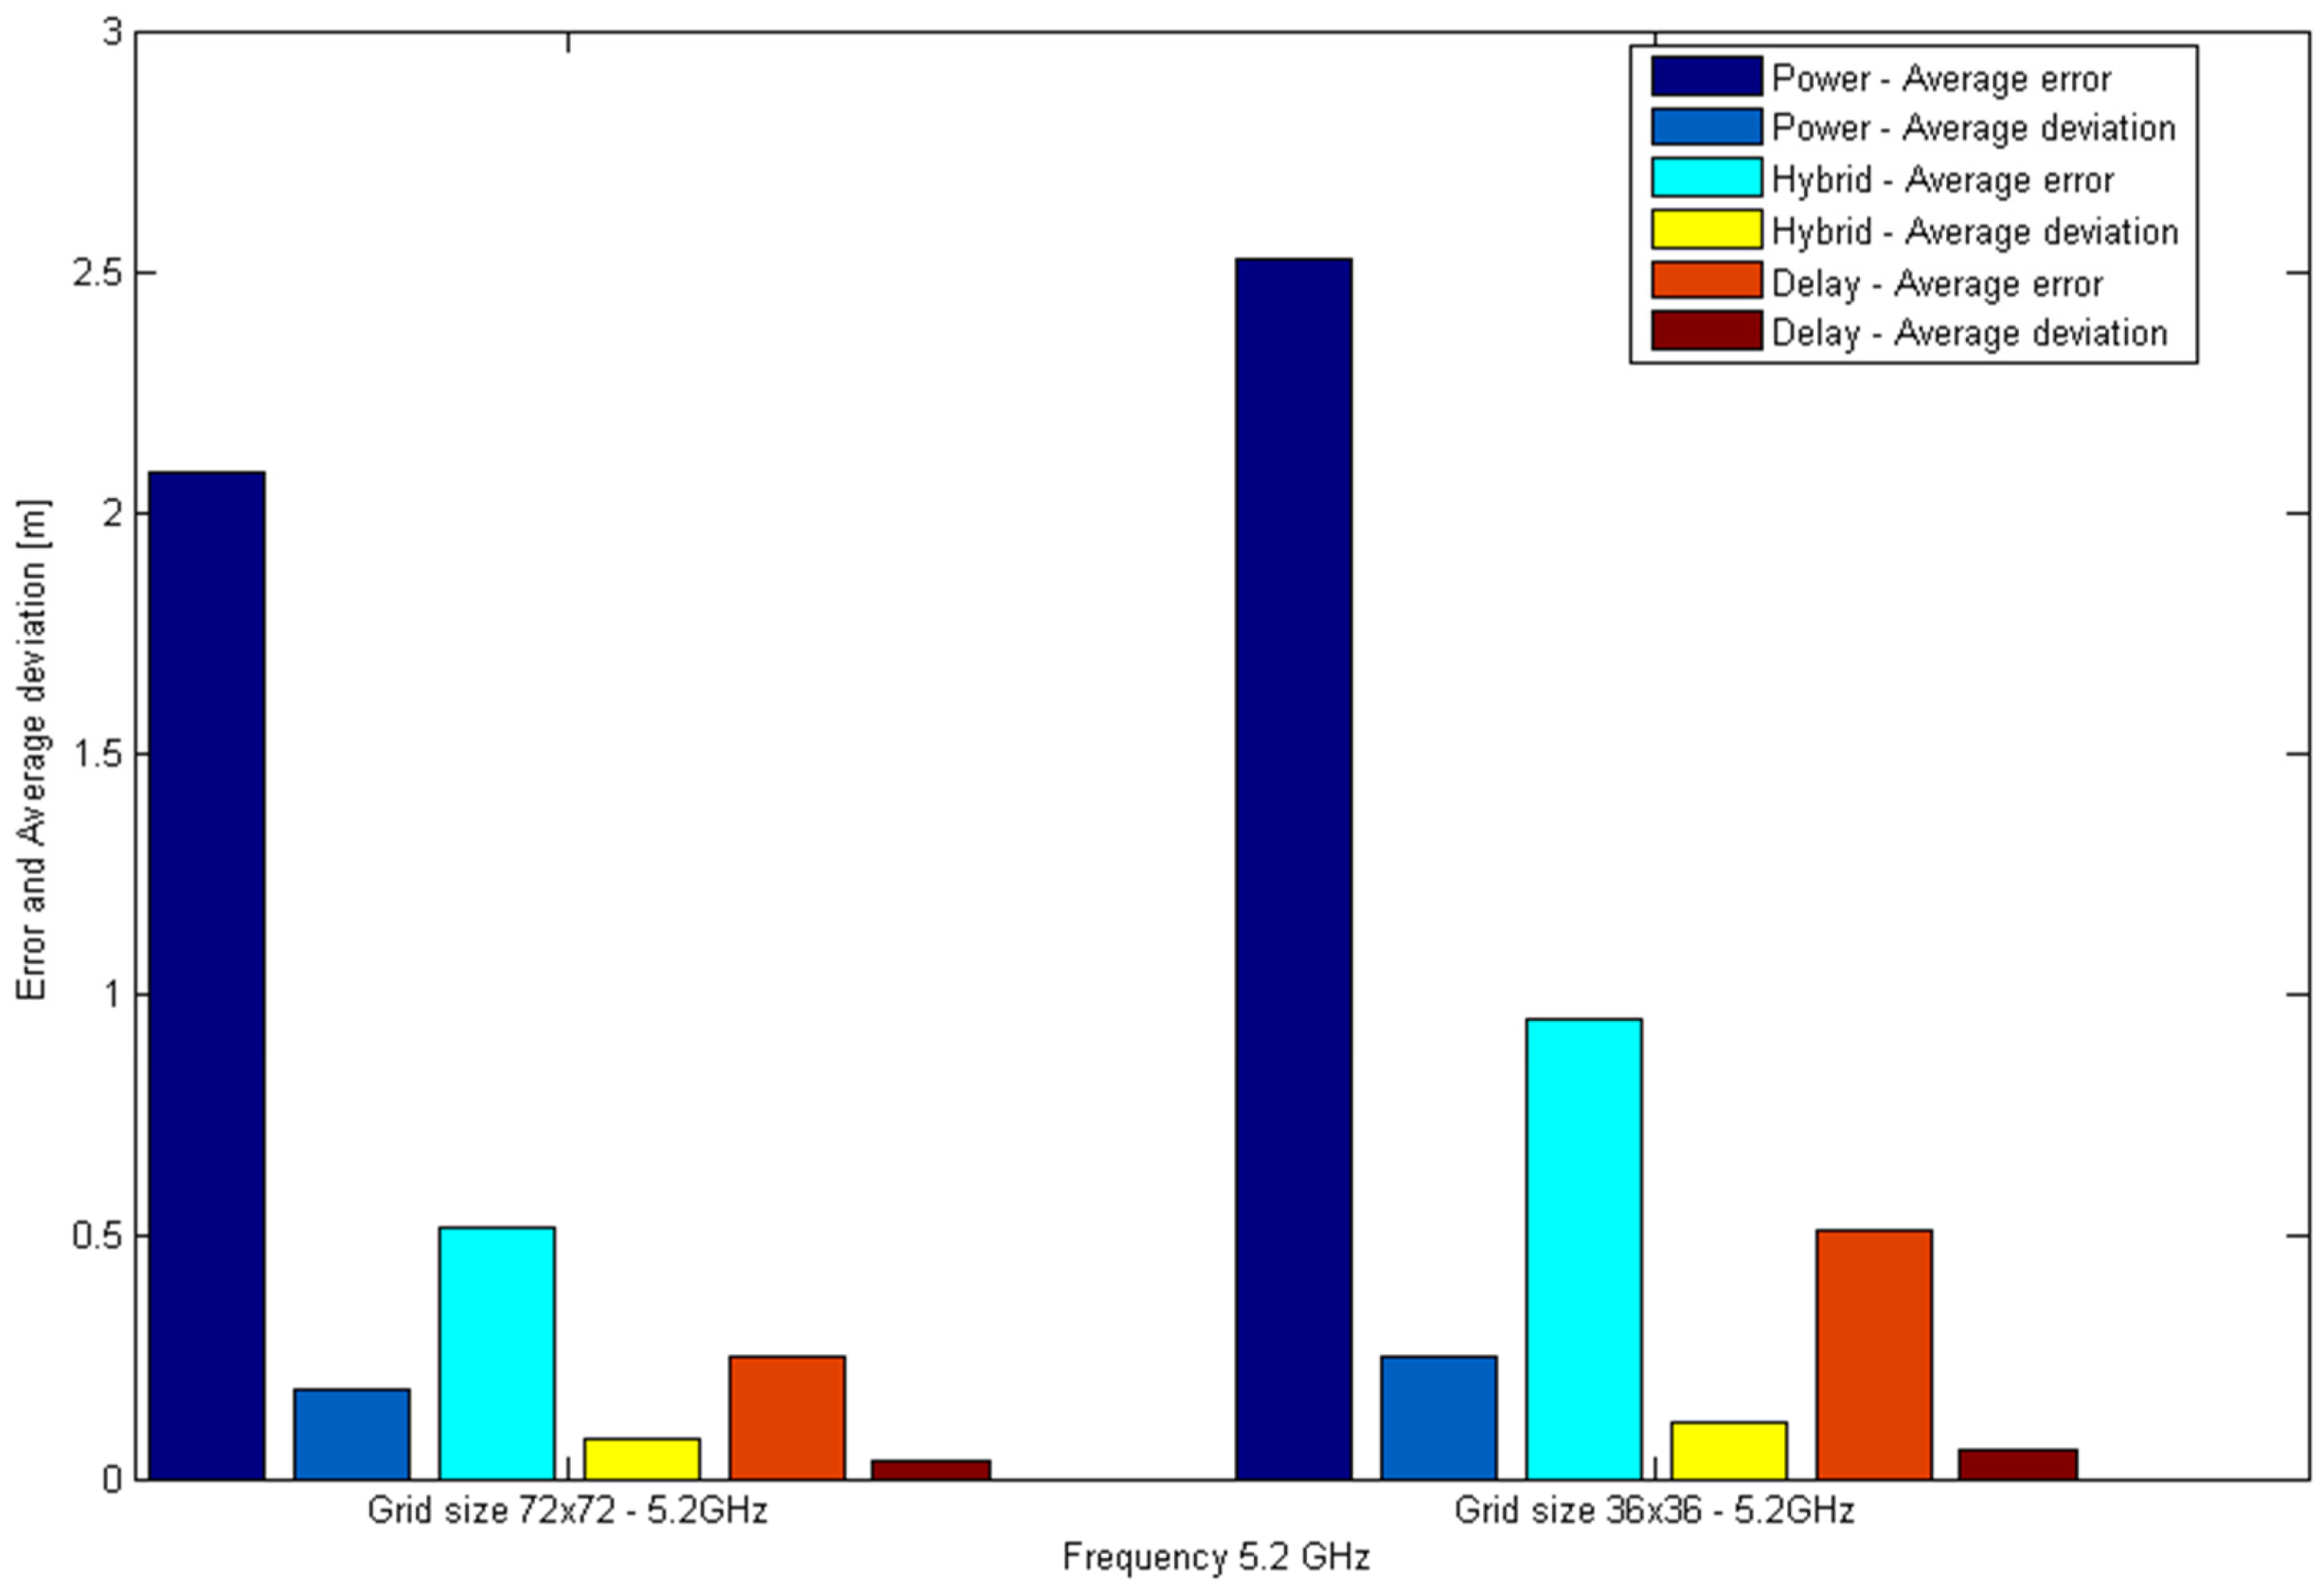
Indoor simulations are focused on the granularity of the scenario and the frequency. The goal is to evaluate the impact of the detection method (power, ray-delays and hybrid) for these variations. The Euclidean distance was employed as a metric. The results are shown in Figure 10 and Figure 11.
From Figure 10, we observe that when the granularity of the fingerprints used in the off-line phase (radio-map) increases, the error committed is reduced. This reduction is independent of the detection method used as a cost function in the localization algorithm, but this reduction of the error is more noticeable when the method used is by ray-delays or hybridization. On the other hand, the reduction obtained by using power levels is not significant.
Figure 11 shows the same conclusions, but in this case, we also observe that the average error increases with the frequency. This is because the frequency is more than double (2.4 GHz versus 5.2 GHz) when comparing the Figure 11 with the Figure 10, or what is the same, the wavelength is less than half (0.057 m versus 0.125 m), what it means that the average error for the same grid resolution is increased (the power average error for a grid size of 36 × 36 m at 2.4 GHz was 1.98, similar to the 2.08 power average error for a grid size of 72 × 72 m at 5.2 GHz). In addition, the loss due to attenuation of the radio signal increases with the square of the power, which implies having a quarter of the power received with respect to the lower frequency band and contributing to the increase of the mentioned average error.
Table 3 shows information about the error and deviation values.
As it can be seen, the detection method based on power levels presents more error in the localization than using hybrid or delay detection methods. The pure delay detection method reaches the best results, because hybrid detection uses power levels information in the cost function.
The impact of frequency is not very relevant. For the same granularity, it has no impact on the delay detection method but improves the accuracy when it increases for power and hybrid methods.
The last two columns reflect the average error rate, which is improved by comparing the hybrid detection versus power detection and detection by ray-delays against power detection.
According to these results, the hybrid detection obtains an improvement in the average error of 71.28% for a mesh of 72 × 72 m at 2.4 GHz, 75% for a mesh of 72 × 72 m at 5.2 GHz, 32.82% for a mesh of 36 × 36 m at 2.4 GHz and 62.69% for a mesh of 36 × 36 m at 5.2 GHz. The detection method by ray-delays obtains an improvement in the average error of 87.17% for a mesh of 72 × 72 m at 2.4 GHz, 87.98% for a mesh of 72 × 72 m at 5.2 GHz, 74.24% for a mesh of 36 × 36 m at 2.4 GHz and 75.48% for a mesh of 36 × 36 m at 5.2 GHz.

5.2. Outdoor Scenarios

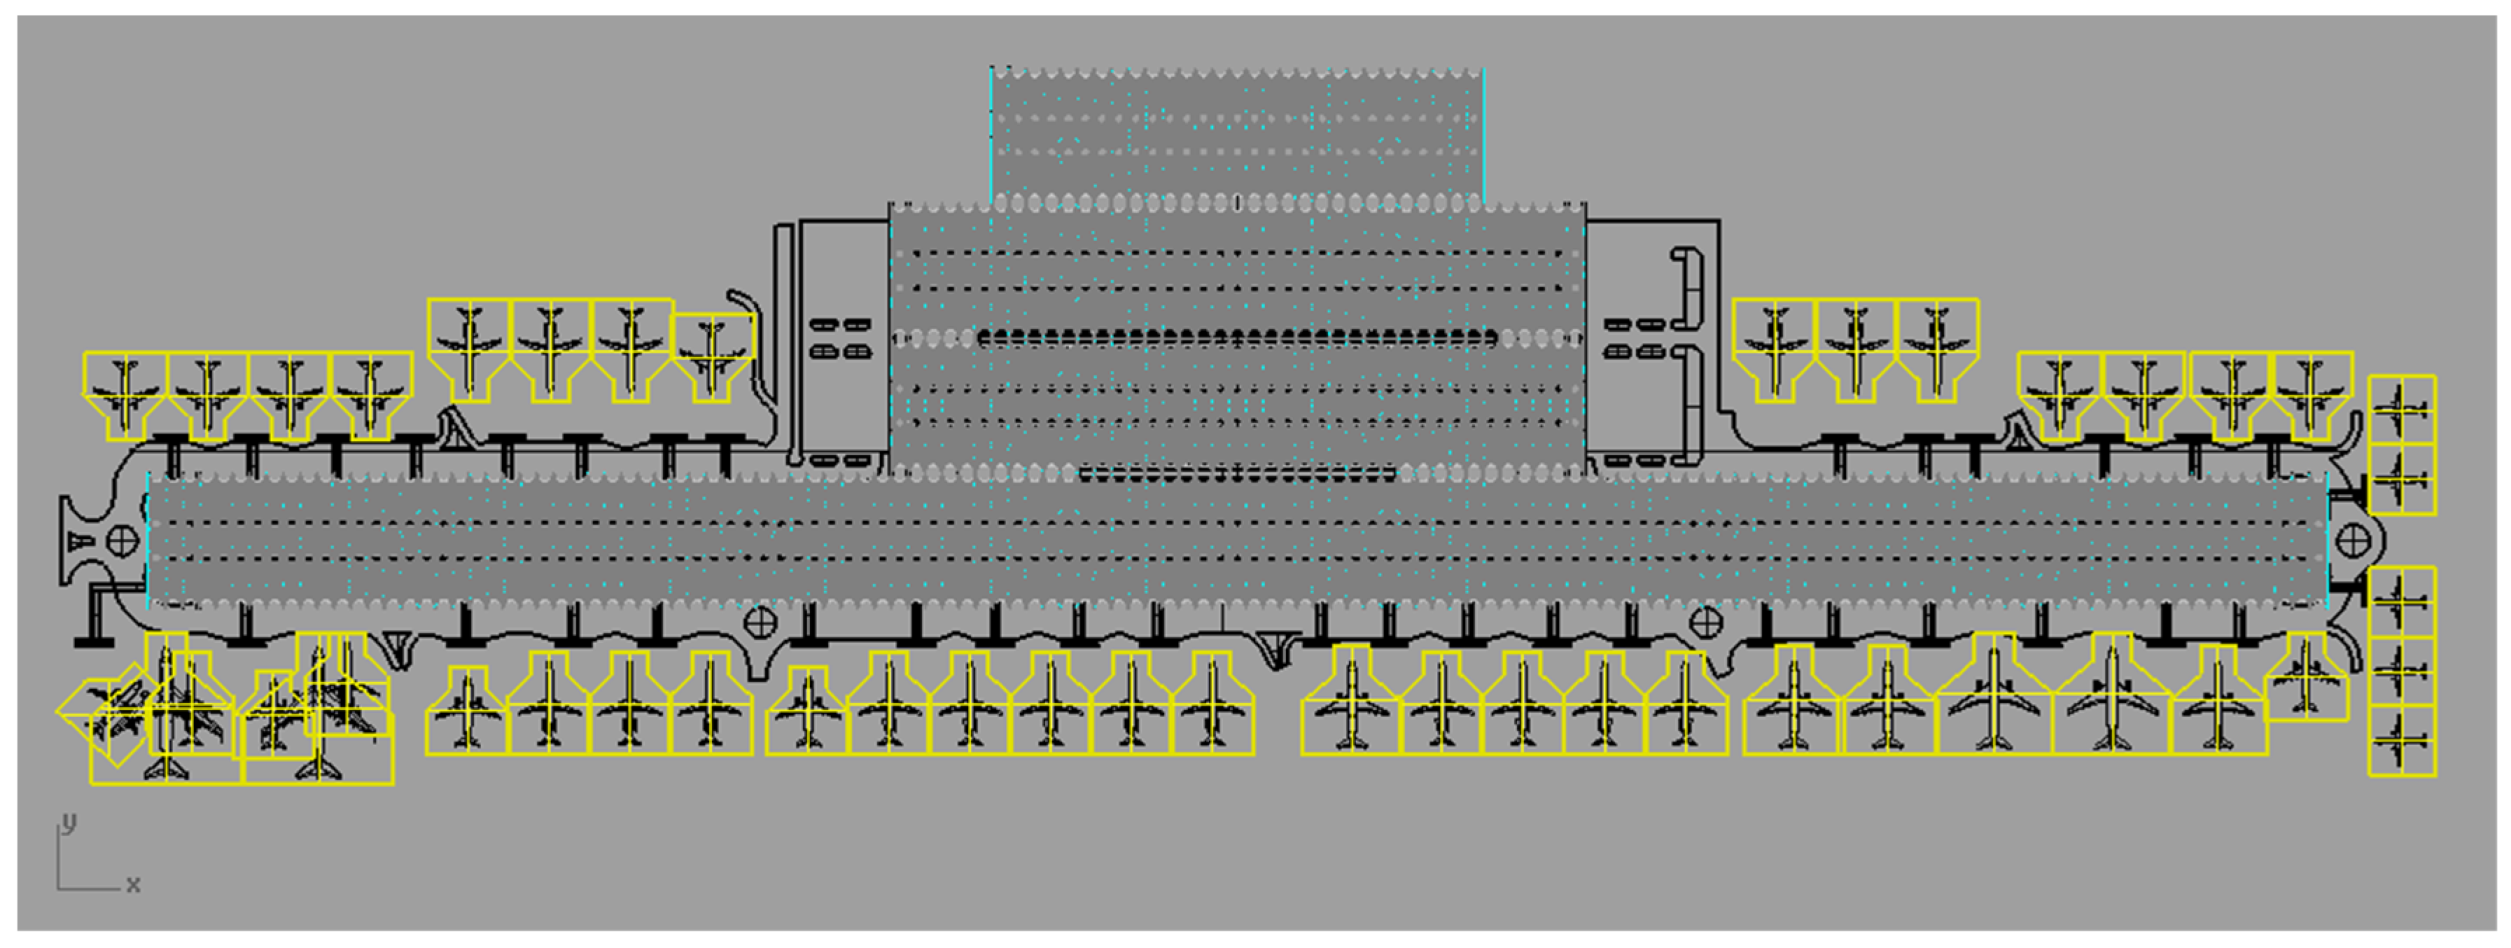
The analysed outdoor geometry corresponds to a real section of parking area at the Adolfo-Suarez Madrid-Barajas International Airport (Figure 12).
As part of the airport infrastructure, we propose enhancing the airport surveillance by providing several wireless access points in each boarding finger, which would be required to obtain the maximum coverage.
Three different scenarios were analysed. In all cases, to estimate the accuracy of the algorithm, 100 target mobiles were randomly located:
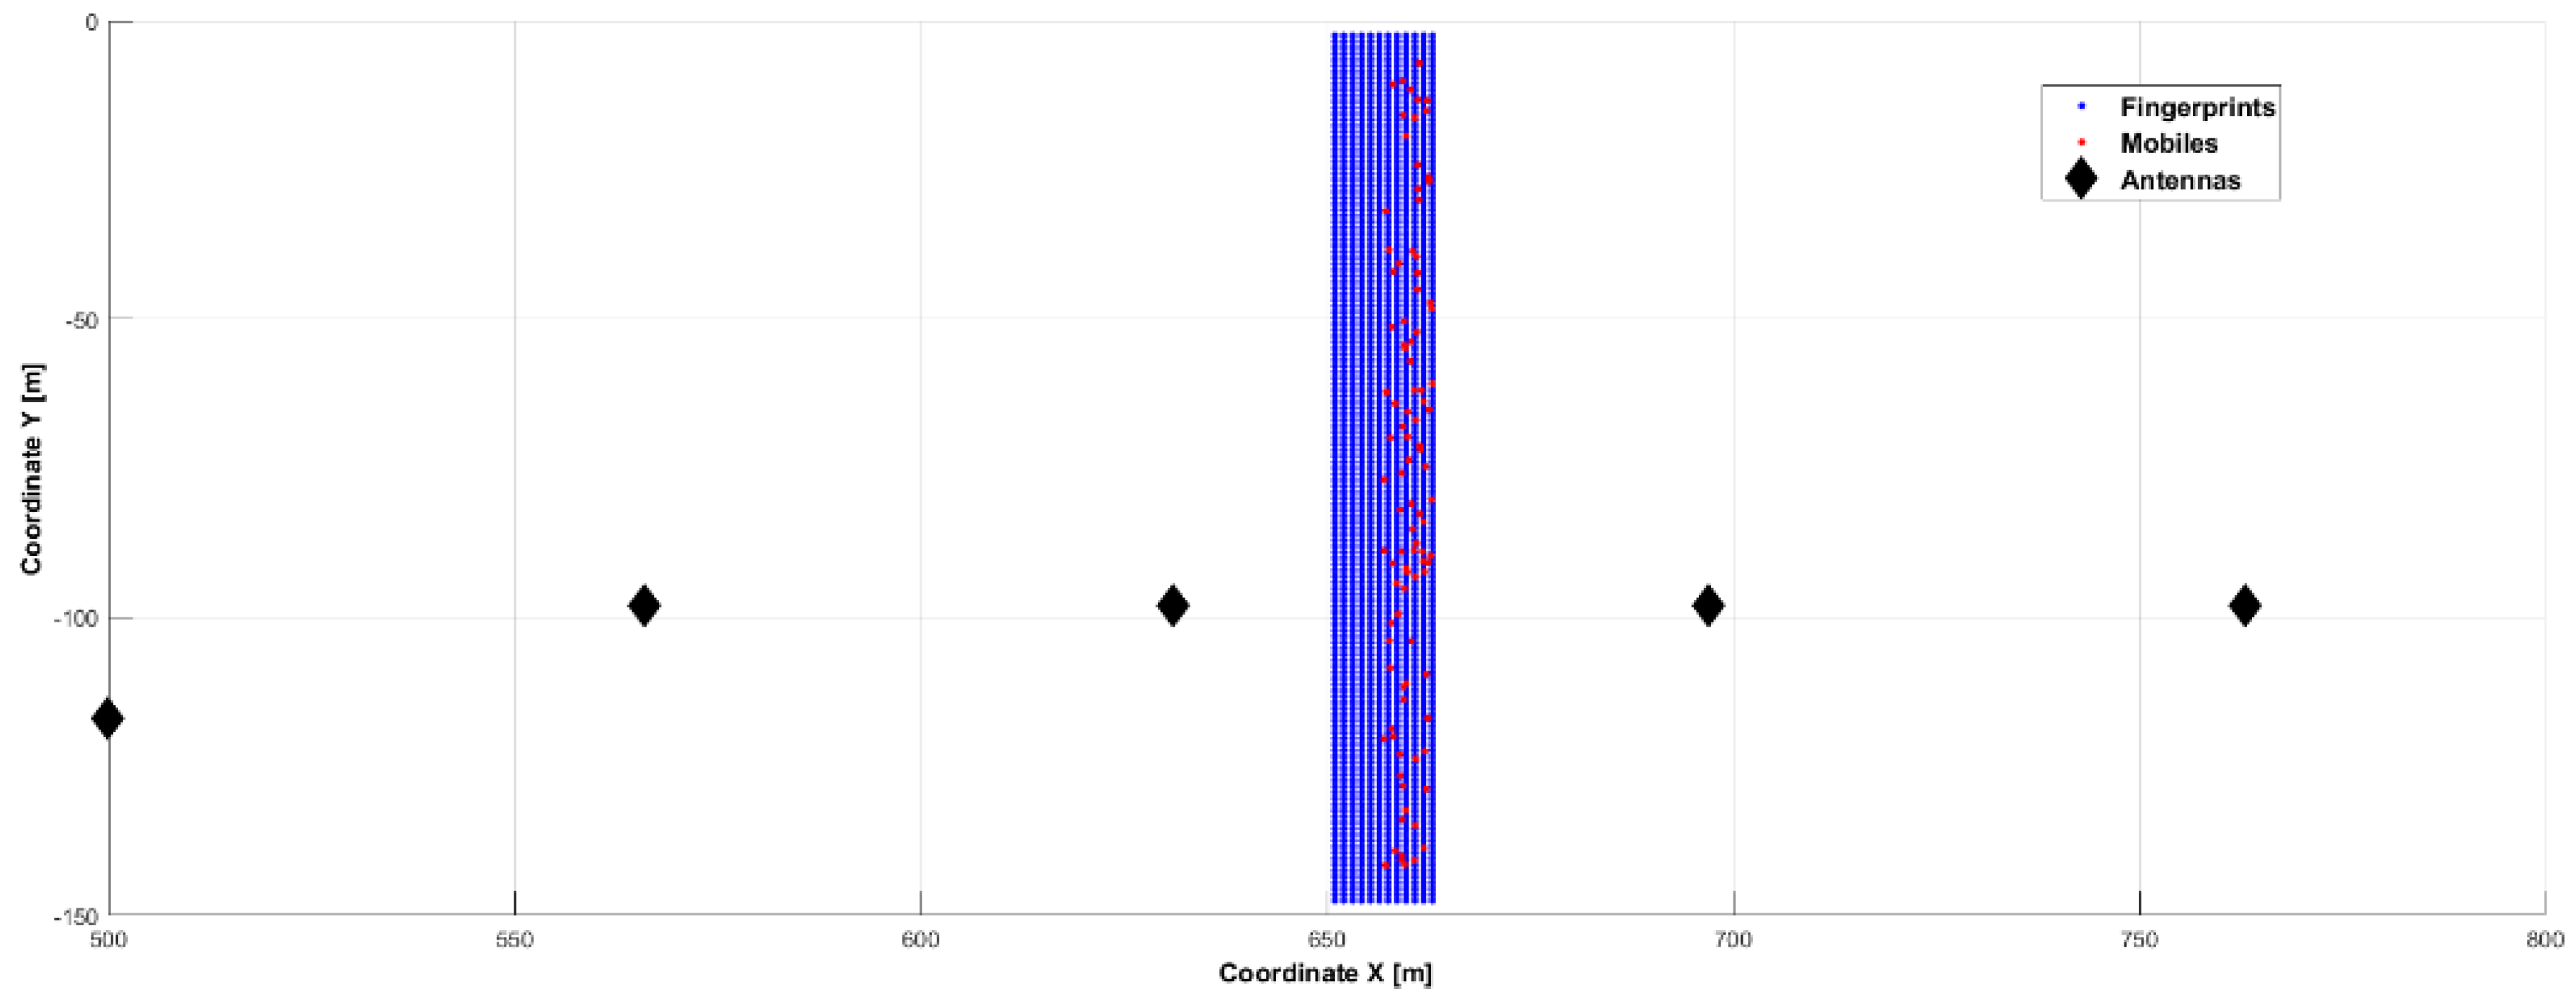
• Case 1: Grid size of 12 × 145 m
In the first scenario, the simulation area was 12 × 145 m for a grid resolution (distance between fingerprints) of 1 m. In this area, 1740 fingerprints and 5 APs at 2.4 GHz were employed (Figure 13).
• Case 2: Grid size of 80 × 80 m
In our second scenario, the simulation area was 80 × 80 m for a grid resolution (distance between fingerprints) of 1 m. In this area, 6400 fingerprints and 5 APs at 2.4 GHz were utilized (Figure 14).
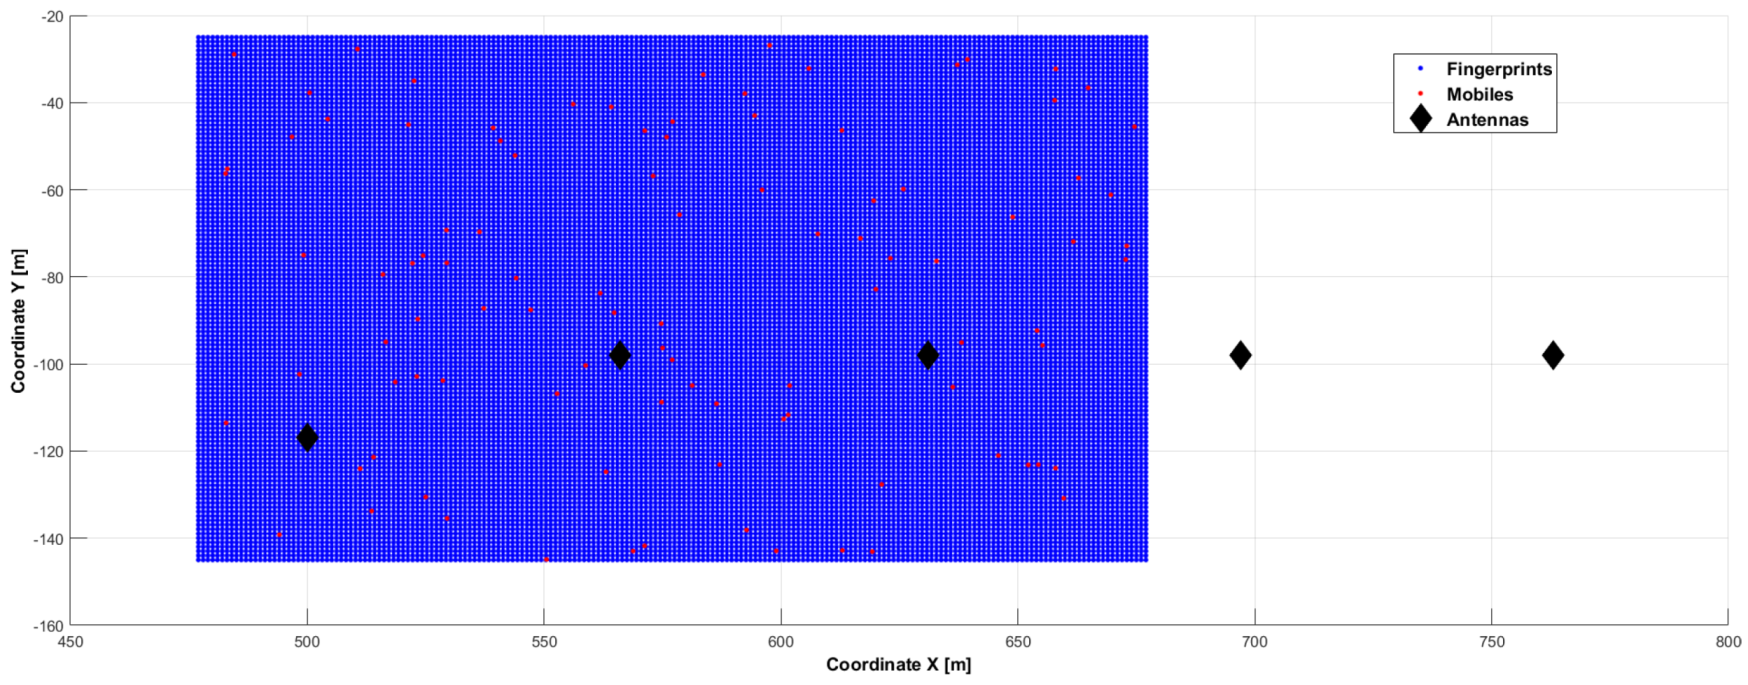
• Case 3: Grid size of 200 × 120 m
In this final scenario, the simulation area was 200 × 120 me for a grid resolution (distance between fingerprints) of 1 m. In this area, 24,000 fingerprints and 5 APs at 2.4 GHz were employed (Figure 15).
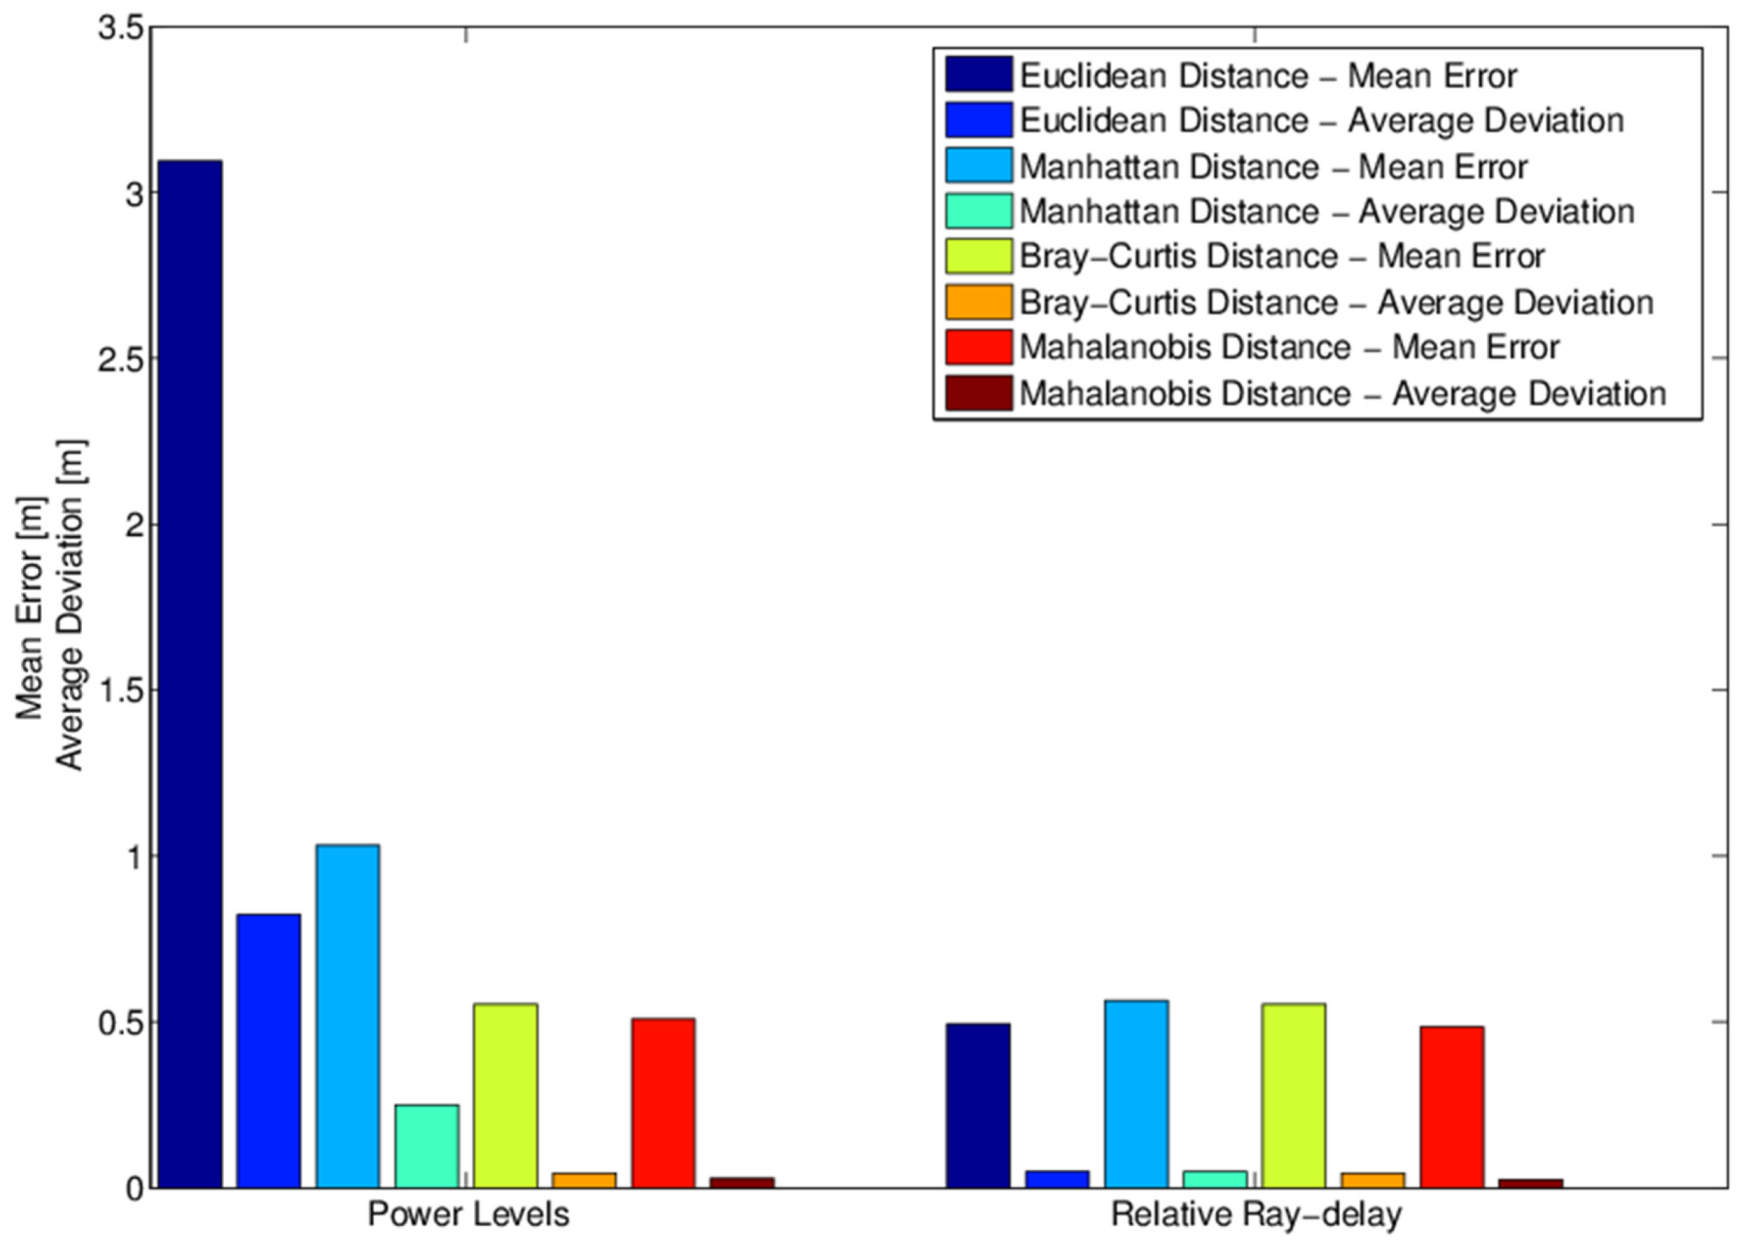
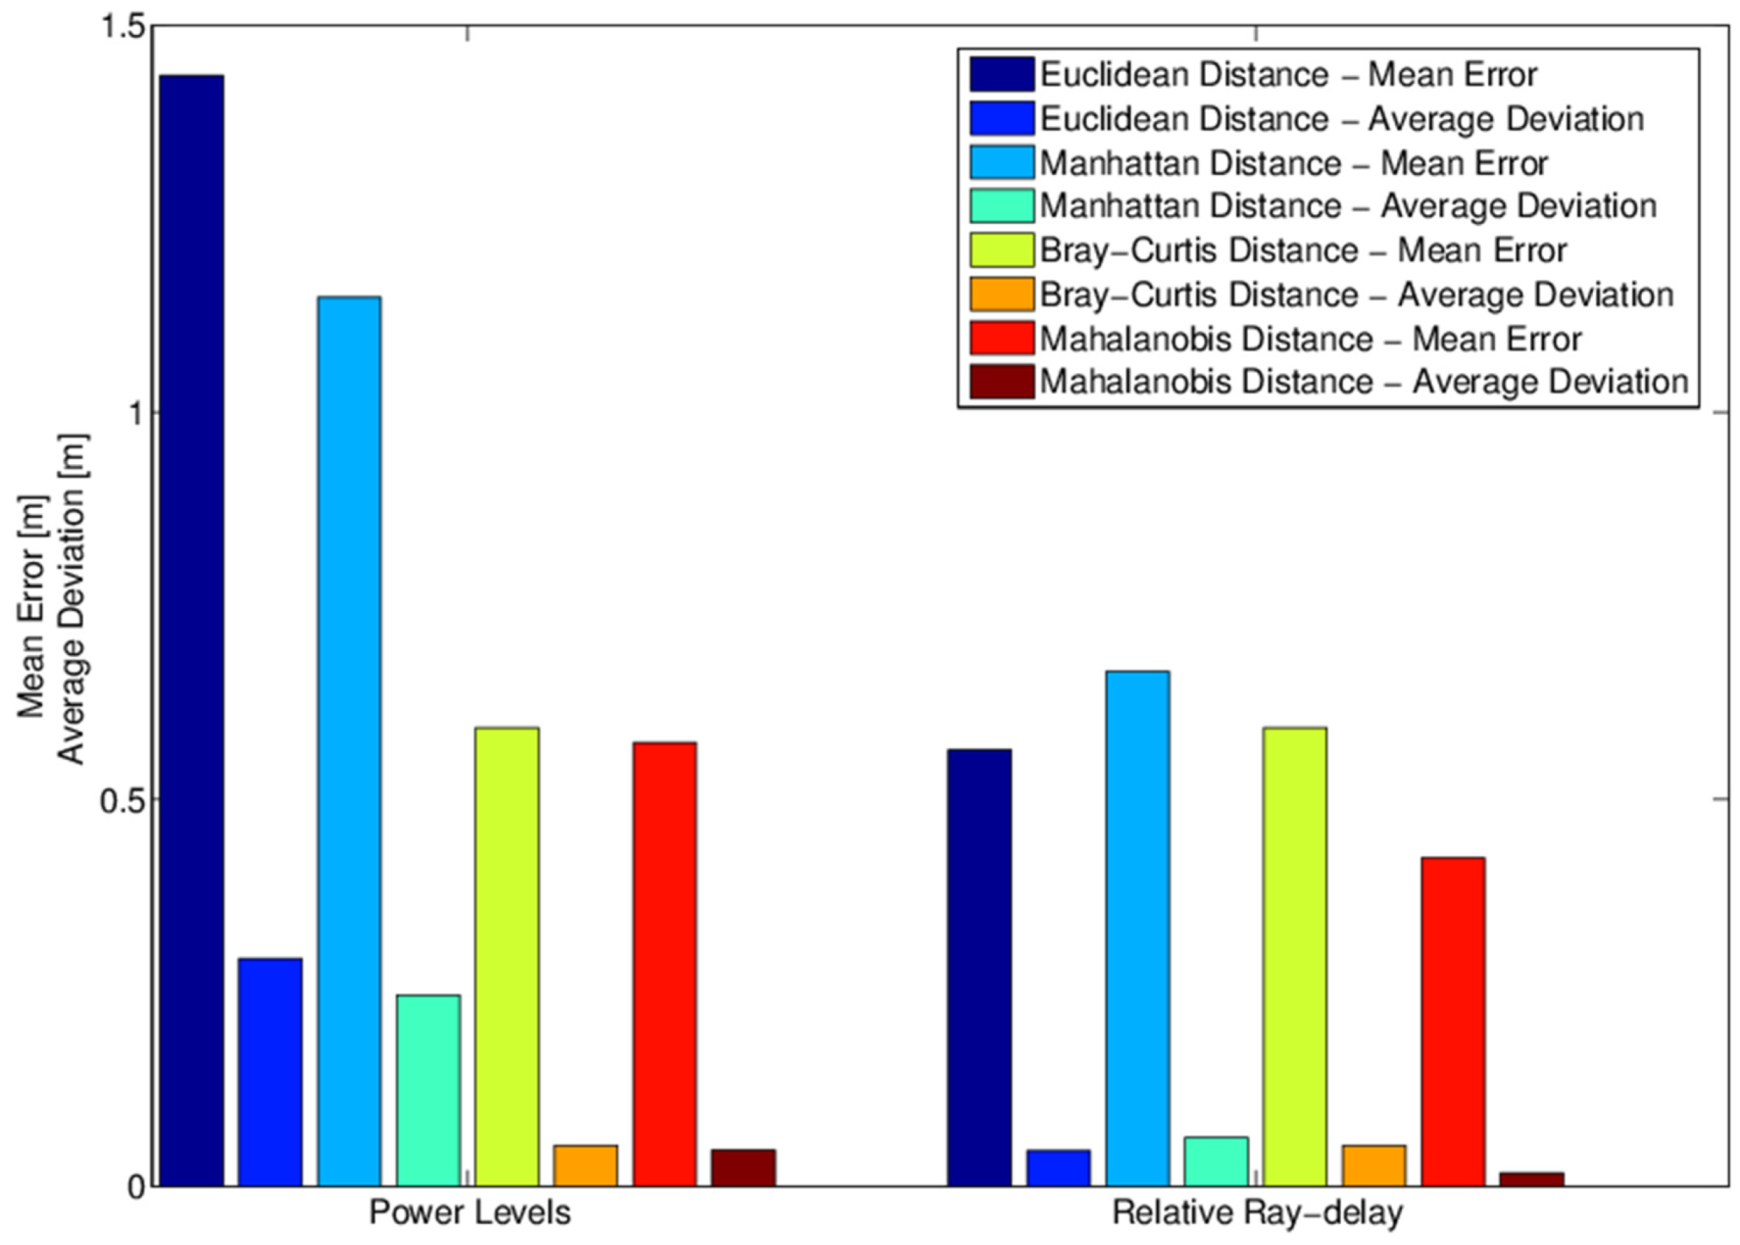
The results obtained from the outdoor simulations scenarios that were previously described are shown. In this case, four distance metrics (Euclidean, Manhattan, Bray-Curtis and Mahalanobis) and two fingerprinting detection methods (power levels and relative ray-delay between rays) were compared. Figure 16, Figure 17 and Figure 18 show the simulation results for all cases.
From Figure 16, we observe that if the relative delay between rays is used as a detection method, the average error decreases when comparing with the power level detection method. Moreover, if Mahalanobis distance is selected as a metric, we obtain the best results in terms of localization error reduction. Figure 17 shows similar conclusions, but in this case, the average error decreases as the granularity of the radio map increases. From Figure 18, we can obtain similar conclusions. Table 4 shows detailed information about the mean error values obtained in the simulations.
In Table 4, we can analyse the numeric values of mean error obtained after simulating each scenario. According to Figure 16, Figure 17 and Figure 18, the first two columns correspond with the first scenario (grid size of 12 × 145 m), the next two columns with the second scenario (80 × 80 m), and the last two columns correspond with the third scenario (200 × 120 m). In each scenario, we represent the mean error obtained using two different detection methods in the cost function of the localization algorithm, power and ray-delays. We observe how the relative delay between rays used as a detection method provides lower mean error than using power levels.
As we confirmed for indoor scenarios, from outdoor scenarios we observe that the relative ray-delay detection method also provides the best localization results for all analysed cases, while the size of the grid is not decisive. Mahalanobis distance metric improves the accuracy, compared with Euclidean, Manhattan or Bray-Curtis, because the relations between all samples used in the scenario are represented in its covariance matrix.
It can also be observed that the location errors obtained in the two scenarios, indoor and outdoor, are similar. In both cases there are multiple obstacles, so much information is obtained about ray-tracing and therefore the TDR factor in each fingerprint is distinctive for each of them.

6. Discussion, Assumptions and Further Work

Using a ray-tracing dataset, the main multipath effects are a result of the built environment and other static objects, all of which are captured in the modelling. The dynamic effects from mobile scatterers can be addressed by identifying these components via identifying the Doppler shift and eliminating them when comparing against the ray-tracing data. This issue will be the subject of further research in this project.
A description of the impact of electromagnetic noise on our simulations at the results level is not available. In an airport, for instance, many users who operate phones, other purposes of WIFIs, and other uncontrolled signals share the same spectrum (such as Bluetooth). To expect our system to have excellent performance even in these contexts, a more detailed noised scenario will be modelled in future research.
Reflective objects (aircrafts) and a more complex environment were considered in the analysis. However, a more detailed environment, which refers to the density of the multipath, will be further implemented to obtain more multipath components with increased path delay.
The scheme is not dependent on the delay values but a relationship between delay and other parameters, such as the BS location at which these parameters are recorded and the frequency, were analysed. Thus, the purpose of training (radio map) is to establish a relationship among the supporting vectors.
Referring to mobile scatterers in the environment, the sensitivity of the approach with mobile scatterers is not currently known and requires further study; thus, this issue would be the subject of future research. Possibilities exist to mitigate the effects of mobile scatterers by identifying these components via identifying the Doppler shift and eliminating when comparing against the ray-tracing data. An analogy exists with radar processing in removing clutter in this case. Thus, further processing using similar techniques to remove multipath components as a result of moving scatterers will be the subject of further research. In our study, ultra-wide band (UWB) systems that can resolve individual multipath effects are assumed.
In the same manner, a similar assumption for AOA estimation with multi-antenna systems was supplied. Massive MIMO systems have a large number of APs that are assumed to be capable of super-resolution AOA estimation. Both these assumptions are related to current and emerging 5G technologies and will be a part of further studies.
Time delay estimators, including bandwidth and SNR, will be required. Super-res algorithms can be used to achieve timing resolutions below the reciprocal of the bandwidth.
The method of localization proposed in this study is being evaluated against traditional techniques (TOA and TDOA) with the same framework and data. Thus, any limitation in the accuracy of the ray-tracing impacts are relatively similar since they employ the same test data in terms of the time delay measurements. Note that only the first arriving paths are applied in the methodology.
Not modelling the error due to bandwidth limitations may be the correct approach, which enables us to isolate the errors due to the estimators and directly compare their performance. Including additional errors due to the assumed bandwidth limitation may mask the difference in performance or make the results bandwidth-specific.
In a second phase, we intend to make simulations with random mobile objects. In any case, small objects and people will present reflections of very low power, so we expect that main reflections will be due to large static objects.
Finally, because validation was only done on a simulation approach, no experiments have been performed. Real experiments will be obtained through a pre-processing step supported by DSPs (Digital Signal Processor) to model the channel through an IFFT (Inverse Fast Fourier Transform) to obtain the impulse response and the multipath effects from the power spectrum [68], and a post-processing phase where to implement our algorithms after collecting data from real APs nodes. In order to obtain the relative delays with enough resolution in the time domain, these APs must be Ultra-Wide Band (UWB) devices because of their great bandwidth [69,70].

7. Conclusions

In this study, alternative detection methods that can be employed in the fingerprinting technique for a mobile location have been presented. These methods facilitate the analysis and design of indoor/outdoor location services. Using the NewFasant simulation tool, we obtain indoor/outdoor coverage by a complete 3D model combined with powerful ray-tracing techniques. This approach is very useful for avoiding complex and expensive measure campaigns and performing the off-line phase of the fingerprinting technique in a quick and accurate manner.
The location algorithm computes the Euclidean distance and other proposed metrics between the power levels and ray-delay samples available in unknown positions of a mobile and each fingerprint stored in the database. This study applies the multipath effects due to ray-tracing as a competitive advantage. Thus, a comparative study has been conducted between three detection methods that utilize different information as a cost function: power levels, relative ray delays and a hybrid method.
All algorithms were validated in indoor and outdoor scenarios using different granularities (grid size) and frequencies.
As a result of this study, we can conclude that the relative ray-delay detection technique, which presents better results in the indoor/outdoor location process than the power detection technique, is extensively applied in traditional Wi-Fi systems (based on the 802.11 standard). When information about certain fingerprints introduces ambiguities or errors in the localization using the powers levels, the hybrid detection method appears to be a suitable alternative. Due to the different effects caused by the ray-tracing, the proposed method uses the information about the relative ray-delay of the signals available in the fingerprints.
With respect to the metric, we conclude that conventional distance metrics, such as Euclidean or Manhattan, may not obtain the best location accuracy. The Mahalanobis distance metric improves the location accuracy when the geometry has irregularities that can been modelled among measures by the covariance matrix.
We can affirm that frequency does not have a significant impact on the accuracy of the results and that the grid size improves the results. Thus, the off-line phase of the fingerprinting technique can be carefully calibrated to obtain an optimized radio-map.

Author Contributions

A.D.C.-V. obtained the training data from the simulation tool and used MATLAB for the final implementation and validation. J.M.G.-P. was involved in the conceptualization and the methodology of the experiments. O.G.-B. have contributed to the electromagnetic theory and supervision of the simulations. J.L.C.-S. has contributed to the formal analysis and the bibliography references. All authors were involved in preparing the manuscript.

Funding

This research received no external funding.

Conflicts of Interest

The authors declare no conflict of interest.

References

  1. Aernouts, M.; Berkvens, R.; Van Vlaenderen, K.; Weyn, M. Sigfox and LoRaWAN datasets for fingerprint localization in large urban and rural areas. Data 2018, 3, 13. [Google Scholar] [CrossRef]
  2. Guo, X.; Li, L.; Xu, F.; Ansari, N. Expectation maximization indoor localization utilizing supporting set for internet of things. IEEE Internet Things J. 2019, 6, 2573–2582. [Google Scholar] [CrossRef]
  3. Ciftler, B.; Kadri, A.; Guevenc, I. IoT localization for bistatic passive UHF RFID systems with 3-D radiation pattern. IEEE Internet Things J. 2017, 4, 905–916. [Google Scholar] [CrossRef]
  4. Ko, H.; Ko, I.; Lee, D. Multi-criteria matrix localization and integration for personalized collaborative filtering in IoT environments. Multimed. Tools Appl. 2018, 77, 4697–4730. [Google Scholar] [CrossRef]
  5. Hu, E.; Deng, Z.; Hu, M.; Yin, L.; Liu, W. Cooperative indoor positioning with factor graph based on FIM for wireless sensor network. Future Gener. Comput. Syst. 2018, 89, 126–136. [Google Scholar] [CrossRef]
  6. Kumar, S.; Chaurasiya, V. A multisensor data fusion strategy for path selection in internet-of-things oriented wireless sensor network (WSN). Concurr. Comput. Pract. Exp. 2018, 30, e4477. [Google Scholar] [CrossRef]
  7. Shit, R.C.; Sharma, S.; Puthal, D.; Zomaya, A.Y. Location of things (LoT): A review and taxonomy of sensors localization in IoT infrastructure. IEEE Commun. Surv. Tutor. 2018, 20, 2028–2061. [Google Scholar] [CrossRef]
  8. Sotenga, P.Z.; Djouani, K.; Kurien, A.M.; Mwila, M.M. Indoor localization of wireless sensor nodes towards internet of things. Procedia Comput. Sci. 2017, 109, 92–99. [Google Scholar] [CrossRef]
  9. Wang, J.; Bolic, M. Indoor localization using augmented ultra-high-frequency radio frequency identification system for Internet of Things. Int. J. Distrib. Sens. Netw. 2017, 13, 1550147717739814. [Google Scholar] [CrossRef]
  10. Pedro, F.; Villa, K.; Elena, S. Wireless positioning in IoT: A look at current and future trends. Sensor 2018, 18, 2470. [Google Scholar]
  11. Molina, B.; Olivares, E.; Palau, C.E.; Esteve, M. A multimodal fingerprint-based indoor positioning system for airports. IEEE Access 2018, 6, 10092–10106. [Google Scholar] [CrossRef]
  12. Chen, L.; Thombre, S.; Järvinen, K.; Lohan, E.S.; Alén-Savikko, A.; Leppäkoski, H.; Bhuiyan, M.Z.; Bu-Pasha, S.; Ferrara, G.N.; Honkala, S.; et al. Robustness, security and privacy in location-based services for future IoT: A survey. IEEE Access 2017, 5, 8956–8977. [Google Scholar] [CrossRef]
  13. Sadowski, S.; Spachos, P. RSSI-based indoor localization with the internet of things. IEEE Access 2018, 6, 30149–30161. [Google Scholar] [CrossRef]
  14. Peng, L.; Dhaini, A.; Ho, P. Toward integrated cloud-fog networks for efficient IoT provisioning: Key challenges and solutions. Future Gener. Comput. Syst. 2018, 88, 606–613. [Google Scholar] [CrossRef]
  15. Saurabh, K.; Mukesh, A. Even localization in the internet of things environment. In Proceedings of the 7th International Conference on Advances in Computing and Communications, Cochin, India, 22–24 August 2017. [Google Scholar]
  16. Park, C.; Chang, J. Robust TOA source localization algorithm using prior location. IET 2019, 13, 384–391. [Google Scholar]
  17. Chen, H.; Ansari, N. Improved robust TOA-based localization via NLOS balancing parameter estimation. IEEE Trans. Veh. Technol. 2019, 68, 6177–6181. [Google Scholar] [CrossRef]
  18. Bellili, F.; Ben, A.; Affes, S.; Ghrayeb, A. Maximum likelihood joint angle and delay estimation from multipath and multicarrier transmissions with application to indoor localization over IEEE 802.11ac radio. IEEE Trans. Mob. Comput. 2019, 18, 1116–1132. [Google Scholar] [CrossRef]
  19. Alebrahim, M.; Zarka, N.; Orabi, M.; Dlaikan, S. GSM Navigation Techniques. 2015. Available online: https://www.researchgate.net/publication/288180429_GSM_Navigation_Techniques (accessed on 30 July 2019).
  20. Zhang, Y.; Zhang, L.; Han, J.; Ban, Z.; Yang, Y. An indoor gas leakage source localization algorithm using distributed maximum likelihood estimation in sensor networks. J. Ambient Intell. Humaniz. Comput. 2017, 10, 1703–1712. [Google Scholar]
  21. Sahlli, E.; Ismail, M.; Nordin, R.; Abdulah, N. Beamforming techniques for massive MIMO systems in 5G: Overview, classification, and trends for future research. Front. Inf. Technol. Electron. Eng. 2017, 18, 753–772. [Google Scholar]
  22. Gong, W.; Liu, J. RoArray: Towards more robust indoor localization using sparse recovery with commodity WIFI. IEEE Trans. Mob. Comput. 2018, 18, 1380–1392. [Google Scholar] [CrossRef]
  23. Gomez, J.; Cejudo, S.; Gonzalez, I.; Catedra, F. Application of high frequencies techniques for location systems. In Proceedings of the International Symposium on Electromagnetic Theory, Ottawa, ON, Canada, 26–28 July 2007. [Google Scholar]
  24. Huang, Y.; Hsu, Y. Indoor localization with adaptive channel model estimation in WiFi networks. In Proceedings of the International Conference on Mobile and Wireless Technology, Hong Kong, China, 25–27 June 2019. [Google Scholar]
  25. Krishnamurthy, P. WiFi Location Fingerprinting. In Advanced Location-Based Technologies and Services; Karimi, H.A., Ed.; CRC Press, University of Pittsburgh: Pittsburgh, PA, USA, 2017. [Google Scholar]
  26. Oguejiofor, O. Outdoor localization system using RSSI measurement of wireless sensor network. Int. J. Innov. Technol. Explor. Eng. 2013, 2, 1–6. [Google Scholar]
  27. Huang, H.; Lin, B.; Feng, L.; Lv, H. Hybrid indoor localization scheme with image sensor-based visible light positioning and pedestrian dead reckoning. Appl. Opt. 2019, 58, 3214. [Google Scholar] [CrossRef] [PubMed]
  28. Zhao, Y.; Zhou, H.; Li, M.; Kong, R. Implementation of indoor positioning system based on location fingerprinting in wireless networks. In Proceedings of the 4th International Conference on Wireless Communications, Networking and Mobile Computing, Dalian, China, 12–14 October 2008. [Google Scholar]
  29. Kaemarungsi, K.; Krishnamurthy, P. Properties of indoor received signal strength for wlan location fingerprinting. In Proceedings of the First Annual International Conference on Mobile and Ubiquitous Systems: Networking and Services (MOBIQUITOUS 2004), Boston, MA, USA, 26 August 2004. [Google Scholar]
  30. Lemelson, H.; Kjaergaard, M.; Hansen, R.; King, T. Error estimation for indoor 802.11 location fingerprinting. In Proceedings of the International Symposium on Location- and Context-Awareness, Tokyo, Japan, 7–8 May 2009. [Google Scholar]
  31. Martín, H.; Tarrío, P.; Bernardos, A.M.; Casar, J.R. Experimental Evaluation of Channel Modelling and Fingerprinting Localization Techniques for Sensor Networks. In Advances in Soft Computing, Proceedings of the International Symposium on Distributed Computing and Artificial Intelligence, 22–24 October 2009; Corchado, J.M., Rodríguez, S., Llinas, J., Molina, J.M., Eds.; Springer: Berlin/Heidelberg, Germany, 2009. [Google Scholar]
  32. Zhao, Y.; Zhou, H.; Li, M. A novel overlap area matching algorithm based on location fingerprinting in wireless networks. In Proceedings of the 5th International Conference on Wireless Communications, Networking and Mobile Computing, Beijing, China, 24–26 September 2009. [Google Scholar]
  33. Sertthin, C.; Fujii, T.; Ohtsuki, T.; Nakagawa, M. Multi-band received signal strength fingerprinting based indoor location system. IEICE Trans. Commun. 2010, 93, 1993–2003. [Google Scholar] [CrossRef]
  34. Arya, A.; Godlewski, P.; Melle, P. Performance analysis of outdoor localization systems based on RSS fingerprinting. In Proceedings of the 6th International Symposium on Wireless Communication Systems, Tuscany, Italy, 7–10 September 2009. [Google Scholar]
  35. Kaemarungsi, K. Efficient design of indoor positioning systems based on location fingerprinting. In Proceedings of the International Conference on Wireless Networks, Communications and Mobile Computing, Maui, HI, USA, 13–16 June 2005. [Google Scholar]
  36. Kaemarungsi, K.; Krishnamurthy, P. Modeling of indoor positioning systems based on location fingerprinting. In Proceedings of the IEEE INFOCOM 2004, Hong Kong, China, 7–11 March 2004. [Google Scholar]
  37. Wu, Y.; Chen, P.; Gu, F.; Zheng, X.; Shang, J. HTrack: An efficient heading-aided map matching for indoor localization and tracking. IEEE Sens. J. 2019, 19, 3100–3110. [Google Scholar] [CrossRef]
  38. Stella, M.; Russo, M.; Begusic, D. Location determination in indoor environment based on RSS fingerprinting and artificial neural network. In Proceedings of the 9th International Conference on Telecommunications, Zagreb, Croatia, 13–15 June 2007. [Google Scholar]
  39. Farivar, R.; Wiczer, D.; Gutierrez, A.; Campbell, R. A statistical study on the impact of wireless signals’ behavior on location estimation accuracy in 802.11 fingerprinting systems. In Proceedings of the IEEE International Symposium on Parallel & Distributed Processing, Rome, Italy, 23–29 May2009. [Google Scholar]
  40. Hamza, L.; Nerguizian, C. Neural network and fingerprinting-based localization in dynamic channels. In Proceedings of the 6th IEEE International Symposium on Intelligent Signal Processing, Budapest, Hungary, 26–28 August 2009. [Google Scholar]
  41. Lemelson, H.; Kopf, S.; King, T.; Effelsberg, W. Improvements for 802.11-based location fingerprinting systems. In Proceedings of the 33rd Annual IEEE International Computer Software and Applications Conference, Seattle, WA, USA, 20–24 July 2009. [Google Scholar]
  42. Cherntanomwong, P.; Takada, J.; Tsuji, H.; Gray, D. New radio source localization using array antennas based on fingerprinting techniques in outdoor environment. In Proceedings of the Asia-Pacific Microwave Conference, Bangkok, Thailand, 11–14 December 2007. [Google Scholar]
  43. Bshara, M.; Orguner, U.; Gustafsson, F.; Van Biesen, L. Fingerprinting localization in wireless networks based on received-signal-strength measurements: A case study on WIMAX networks. IEEE Trans. Veh. Technol. 2010, 59, 283–294. [Google Scholar] [CrossRef]
  44. Bisio, I.; Lavagetto, F.; Marchese, M.; Sciarrone, A. GPS/HPS and Wi-Fi fingerprint-based location recognition for check-in applications over smartphones in cloud-based LBSs. IEEE Trans. Multimed. 2013, 15, 858–869. [Google Scholar] [CrossRef]
  45. Azin, A.; Godlewski, P.; Melle, P. A hierarchical clustering technique for radio map compression in location fingerprinting systems. In Proceedings of the IEEE 71st Vehicular Technology Conference, Taipei, Taiwan, 16–19 May 2010. [Google Scholar]
  46. Suroso, D.; Cherntanomwong, P.; Sooraksa, P.; Takada, J. Location fingerprint technique using fuzzy C-Means clustering algorithm for indoor localization. In Proceedings of the IEEE Region 10 Annual International Conference, Bali, Indonesia, 21–24 November 2011. [Google Scholar]
  47. Kjaergaard, M.; Munk, C. Hyperbolic location fingerprinting: A calibration-free solution for handling differences in signal strength. In Proceedings of the 6th Annual IEEE International Conference on Pervasive Computing and Communications, Hong Kong, China, 17–21 March 2008. [Google Scholar]
  48. Bolliger, P.; Partridge, K.; Chu, M.; Langheinrich, M. Improving location fingerprinting through motion detection and asynchronous interval labeling. In Proceedings of the International Symposium on Location and Context-Awareness, Tokyo, Japan, 7–8 May 2009. [Google Scholar]
  49. Pirzad, N.; Yunus, M.; Subhan, F.; Abro, A.; Hassan, M. Location fingerprinting technique for WLAN device-free indoor localization system. Wirel. Pers. Commun. 2017, 95, 445–455. [Google Scholar] [CrossRef]
  50. Soro, B.; Lee, C. A wavelet scattering feature extraction approach for deep neural network based indoor fingerprinting localization. Sensors 2019, 19, 1790. [Google Scholar] [CrossRef]
  51. Steiner, C.; Wittneben, A. Low complexity location fingerprinting with generalized UWB energy detection receivers. IEEE Trans. Signal. Process. 2010, 58, 1756–1767. [Google Scholar] [CrossRef]
  52. Kimoto, R.; Yamamoto, T.; Ishida, S.; Tagashira, S.; Fukuda, A. Evaluation of multi ZigLoc: Indoor ZigBee localization system using inter-channel characteristics. In Proceedings of the 11th International Conference on Mobile Computing and Ubiquitous Network, Auckland, New Zealand, 5–8 October 2018. [Google Scholar]
  53. Wu, J.; Zhu, M.; Xiao, B.; Qiu, Y. The improved fingerprint-based indoor localization with RFID/PDR/MM technologies. In Proceedings of the IEEE 24th International Conference on Parallel and Distributed Systems (ICPADS), Singapore, 11–13 December 2018. [Google Scholar]
  54. Li, Y.; Gao, Z.; He, Z.; Zhuang, Y.; Radi, A.; Chen, R.; El-Sheimy, N. Wireless fingerprinting uncertainty prediction based on machine learning. Sensors 2019, 19, 324. [Google Scholar] [CrossRef]
  55. Zheng, H.; Gao, M.; Chen, Z.; Liu, X.; Feng, X. An adaptive sampling scheme via approximate volume sampling for fingerprint-based indoor localization. IEEE Internet Things J. 2019, 6, 2338–2353. [Google Scholar] [CrossRef]
  56. Fang, S.; Lin, T. A dynamic system approach for radio location fingerprinting in wireless local area networks. IEEE Trans. Commun. 2010, 58, 1020–1025. [Google Scholar] [CrossRef]
  57. Nicholaus, M.; Minga, D. A comparison review of indoor positioning techniques. IJC 2016, 21, 42–49. [Google Scholar]
  58. Aksu, H.; Aksoy, D.; Korpeoglu, I. A study of localization metrics: Evaluation of position errors in wireless sensor networks. Comput. Netw. 2011, 55, 3562–3577. [Google Scholar] [CrossRef]
  59. Gonzalez, I.; Lozano, L.; Cejudo, S.; Saez de Adana, F.; Catedra, F. New version of FASANT code. In Proceedings of the IEEE Antennas and Propagation Society International Symposium, San Diego, CA, USA, 5–11 July 2008. [Google Scholar]
  60. Navarro, A.; Guevara, D.; Cardona, N.; López, J. Measurement-based ray-tracing models calibration in urban environments. In Proceedings of the 2012 IEEE International Symposium on Antennas and Propagation, Chicago, IL, USA, 8–14 July 2012. [Google Scholar]
  61. Evangelo, M.; Andrew, N.; Geoffrey, S. Ray-tracing urban macrocell propagation statistics and comparison with WINNER II/+ measurements and models. In Proceedings of the Loughborough Antennas & Propagation Conference (LAPC), Loughborough, UK, 12–13 November 2012. [Google Scholar]
  62. Junpe, M.; Tetsur, I.; Koshir, K. Ray-tracing system for predicting propagation characteristics on world wide web. In Proceedings of the 3rd European Conference on Antennas and Propagation (EuCAP 2009), Berlin, Germany, 23–27 March 2009. [Google Scholar]
  63. Sáez de Adana, F.; Gutierrez, O.; Gonzalez, I.; Lozano, L.; Felipe Cátedra, M. Practical Applications of Asymptotic Techniques in Electromagnetics; Artech House Electromagnetics Series; Artech House: Boston, MA, USA, 2011. [Google Scholar]
  64. Catedra, M.; Perez-Arriaga, J. Cell Planning for Wireless Communications; Artech House Publishers: Norwood, OH, USA, 1999. [Google Scholar]
  65. Lozano, L.; Algar, M.; García, E.; González, I.; Catedra, F. Efficient combination of acceleration techniques applied to high frequency methods for solving radiation and scattering problems. Comput. Phys. Commun. 2017, 221, 28–41. [Google Scholar] [CrossRef]
  66. Chen, Y.; Francisco, J.; Trappe, W.; Martin, R. A practical approach to landmark deployment for indoor localization. In Proceedings of the 3rd Annual IEEE Communications Society on Sensor and Ad Hoc Communications and Networks, Reston, VA, USA, 28 September 2006. [Google Scholar]
  67. Perez-Ramirez, J.; Borah, D.; Voelz, D. Optimal 3-D Landmark Placement for Vehicle Localization Using Heterogeneous Sensors. IEEE Trans. Veh. Technol. 2013, 62, 2987–2999. [Google Scholar] [CrossRef]
  68. Kent, H.; Michael, T. Comparison of predicted and measured multipath impulse responses. IEEE Trans. Aerosp. Electron. Syst. 2011, 3, 1696–1709. [Google Scholar]
  69. Giuseppe, C.; Mai, T.; Luca, N.; Maria-Gabriella, B. Performance comparison of WiFi and UWB fingerprinting indoor positioning systems. Technologies 2018, 6, 14. [Google Scholar]
  70. Sinan, G.; Zhi, T.; Georgios, G.; Hisashi, K.; Andreas, M.; Zafer, S. Localization via ultrawideband radios. IEEE Signal Process. Mag. 2005, 22, 70–84. [Google Scholar]
Figure 1. Fingerprinting technique: (Left) off-line phase; (Right) on-line phase.
Energies 12 02943 g001
Figure 2. Distribution of power levels in the radio map. It represents the visibility of each fingerprint with respect to each AP available in the scenario, and it is the information used in the cost function based on RSSI.
Energies 12 02943 g002
Figure 3. Relative delays and levels between rays due to ray-tracing effects.
Energies 12 02943 g003
Figure 4. Pseudo-code of the localization algorithm.
Energies 12 02943 g004
Figure 5. Interpolation technique implemented with four fingerprints.
Energies 12 02943 g005
Figure 6. Ray-tracing scenario at the airport.
Energies 12 02943 g006
Figure 7. Different rays and effects computed by NewFasant software.
Energies 12 02943 g007
Figure 8. Indoor scenario: A representative section of the University Polytechnic of Madrid (Spain).
Energies 12 02943 g008
Figure 9. 2D view of the University Polytechnic of Madrid simulation area: A section of 36 × 36 m containing 1296 fingerprints, 99 mobiles to locate and 9 APs.
Energies 12 02943 g009
Figure 10. Detection methods comparison: Power, delay and hybrid detection at a frequency of 2.4 GHz.
Energies 12 02943 g010
Figure 11. Detection methods comparison: Power, delay and hybrid detection at a frequency of 5.2 GHz.
Energies 12 02943 g011
Figure 12. Outdoor scenario: Terminal 4 at Adolfo-Suarez Madrid-Barajas International Airport.
Energies 12 02943 g012
Figure 13. 2D view of Terminal 4 at Adolfo-Suarez Madrid-Barajas International Airport simulation area: A section of 12 × 145 m containing 1740 fingerprints, 99 mobiles to locate and 5 APs.
Energies 12 02943 g013
Figure 14. 2D view of Terminal 4 at Adolfo-Suarez Madrid-Barajas International Airport simulation area: A section of 80 × 80 m containing 6400 fingerprints, 99 mobiles to locate and 5 APs.
Energies 12 02943 g014
Figure 15. 2D view of Terminal 4 at Adolfo-Suarez Madrid-Barajas International Airport simulation area: A section of 200 × 120 m containing 24,000 fingerprints, 99 mobiles to locate and 5 APs.
Energies 12 02943 g015
Figure 16. Case 1 results: Localization error when comparing power vs. delay detection methods with four distance metrics in a section of 12 × 145 m.
Energies 12 02943 g016
Figure 17. Case 2 results: Localization error when comparing power vs. delay detection methods with four distance metrics in a section of 80 × 80 m.
Energies 12 02943 g017
Figure 18. Case 3 results: Localization error when comparing power vs. delay detection methods with four distance metrics in a section of 200 × 120 m.
Energies 12 02943 g018
Table 1. Summary of localization techniques.
AlgorithmCostPrecisionEfficiencyComplexityHardware
ToAhighmediumlowlargelarge
TDoAlowhighhighlargemedium
AoAhighlowmediumlargelarge
RSSlowmediummediumlowsmall
Hybridlowhighhighlowsmall
Fingerprintingmediumhighhighlowsmall
Table 2. NewFasant computational cost.
ConfigurationX PointsY PointsTotal PointsComputational Cost (Hours)
5 antennas 2 reflections14012016,80070
5 antennas 3 reflections121451740104
10 antennas 2 reflections10050500055
Table 3. Indoor simulations results: Localization error when comparing the detection methods.
PowerHybridDelayHybrid vs. PowerDelay vs. Power
Grid size Frequency A v E r r o r   T y p D e v A v E r r o r   ( % )
72 × 72
2.4 GHz
1.9554
0.1871
0.5621 0.08210.2504 0.036671.2887.17
72 × 72
5.2 GHz
2.0844
0.1843
0.5207 0.08410.2504 0.03667587.98
36 × 36
2.4 GHz
1.9801
0.2029
1.1337 0.16100.5155 0.057232.8274.24
36 × 36
5.2 GHz
2.5275
0.2548
0.9497 0.11420.5155 0.057262.6975.48
Table 4. Outdoor simulations results: Localization error when comparing power vs delay detection methods and distance metrics in each scenario.
Distance MetricGrid Size
12 × 145 (m)80 × 80 (m)200 × 120 (m)
Detection Method
PowerRaysPowerRaysPowerRays
Mean Error (m)
Euclidean3.100.491.430.562.020.52
Manhattan1.030.561.140.661.440.56
Bray-Curtis0.550.550.590.590.560.56
Mahalanobis0.500.480.570.420.800.49