Article

Detection of the Flow State for a Centrifugal Pump Based on Vibration

1
Key Laboratory of Fluid and Power Machinery, Ministry of Education, Xihua University, Chengdu 610039, China
2
Department of Energy and Power Engineering, Tsinghua University, Beijing 100084, China
3
National Research Center of Pumps, Jiangsu University, Zhenjiang 212013, China
*
Authors to whom correspondence should be addressed.
Energies 2019, 12(16), 3066; https://doi.org/10.3390/en12163066
Submission received: 6 July 2019 / Revised: 30 July 2019 / Accepted: 7 August 2019 / Published: 9 August 2019

Abstract

:
A combined numerical and experimental method study was performed to detect the inner flow state for a type of centrifugal pump. It was found that the inlet attack angles of blades in an impeller have a great influence on the flow instabilities in a centrifugal pump. The mechanism of the rotating stall in the impeller channel was explained. Meanwhile, flow state identification with vibration (FSIV) was proposed to detect the flow instabilities in a centrifugal pump. The relationship between the external vibration and the inner flow state has been established by FSIV. The characteristics and mechanism of the vibration produced by the flow instabilities in a centrifugal pump were investigated. It was found that the hump, the rotating stall, the backflow, the occurrence of unstable flow, and the cavitation in the centrifugal pump can be effectively detected by applying the vibration signals, which helps to obtain safe and steady operating conditions for the system.

Graphical Abstract

1. Introduction

Centrifugal pumps are widely used in various fields, playing a significant role in industrial plants. Due to the rise of safety concerns, however, the vibration caused by the pump has been largely investigated over the past decades. In the references, the research on the vibration produced by centrifugal pumps has focused mainly on the inner flow [1,2,3], the hydraulic excitation force [4,5], the rotation of the rotor [6], the impacts of the tongue [7], the cavitation [8], the bearing fault, and other troubles of the system [9]. It is well known that even under the noncavitation condition, flow instabilities exist in the centrifugal pump when the flow rate changes. Especially, the inner flow instabilities intensify while the pumps operate under these conditions, which deviate a lot from the designed flow rate. Complicated flow instabilities can be easy to discover through visualization experiments and numerical simulations under part load conditions in pumps, which include the rotating stall, the backflow, and the viscous wake [10,11]. The unsteady flow in the pump not only results in the unsteady dynamic characteristics, which include the pressure pulsations and the hydraulic excitation force [12], but also causes the vibration of the structures and the noise [13]. It is presented that the rotating stall in the pump turbines can be detected by the nonintrusive method in Botero’s research [14]. Fluctuations at the blade passing frequency and its harmonicas are the result of hydraulic disturbances, which follow the trailing edge of the rotating blades, and are caused by the fluid-dynamic interaction of the blades with the pump volute as well. They are considered important sources for vibration and hydraulic noise [7,15,16]. Meanwhile, the vibration can also originate in the rotor–stator interaction in centrifugal pumps, which has the specific characteristics that can be apparently observed in the frequency domain [17,18,19]. The vibration signals can be enhanced when the frequency of the vibration induced by unsteady flow is close to the frequency of the harmonics produced by the external excitation [20].
According to the references above, the previous research has mainly emphasized fault diagnosis in centrifugal pumps based on the vibration, and the flow instabilities are investigated by the numerical calculations and visualization experiments. However, few reports have been presented for the detection of various types of flow instabilities in centrifugal pumps by the application of vibration.
Therefore, in this current research, flow state identification with vibration (FSIV) is proposed to detect a variety types of the flow instabilities in a centrifugal pump. This is a nonintrusive method without affecting the internal flow field in the pump, which is one of the advantages for its application.
The relationship between the external vibration and the inner flow state has been established by FSIV. The characteristics and mechanism of the vibration produced by the flow instabilities in a centrifugal pump are investigated. This study provides references for the safe and steady operation of this type of pump.

2. Numerical Method and Experimental Equipment

2.1. Numerical Simulation

The centrifugal pump studied in the present research was a single stage pump which consisted of a single suction and a shrouded impeller. The main parameters of the centrifugal pump are shown in Table 1.
The entire flow passages, which include the chambers and wear ring, were modeled to guarantee the simulation results truthfully revealed the actual flow in the pump. Part of the three-dimensional model and the mesh of the computational domain are depicted in Figure 1 and Figure 2, respectively. The local grid refinement was improved in the regions close to the wall. The grid independence verification is shown in Table 2. While the accuracy and efficiency of the calculation were taken into account, mesh 3 was chosen as the final computational mesh to conduct the simulation. The boundary conditions of the calculation were set as the mass flow rate at the pump outlet and the total pressure at the pump inlet. The total pressure at the pump inlet was given as the pressure measured at pump inlet, and the mass flow rate at outlet was set as the experimentally tested flow rate to ensure the experimental and numerical investigations were under the same condition. Meanwhile, the reference pressure was selected as 0 Pa. The temperature of the water was set as 25 centigrade.
In the present research, the standard k ε model was selected as the turbulence model to calculate the simulation. The advantages of this turbulence model are that it is concise, reliable, easy to build, has excellent performance, and is widely applicable.
In the standard k ε model, the turbulence viscosity coefficient μ t is expressed as follows [21].
μ t = ρ C μ k 2 ε
where C μ is the empirical coefficient; k and ε represent the turbulent kinetic energy and the rate of turbulent dissipation, respectively. k and ε are defined as the following expression:
k = u i u i ¯ 2
ε = μ ρ u i x j u i x j ¯ .
The governing equation of the turbulent kinetic energy k is defined in Equation (4).
ρ k t + ρ u j k x j = τ i j u i x j ρ ε + x j ( ( μ + μ t σ k ) k x j ) .
The constraint equation of the turbulent dissipation rate ε is expressed in Equation (5).
ρ ε t + ρ u j ε x j = C ε 1 ε k τ i j u i x j C ε 2 ρ ε 2 k + x j ( ( μ + μ t σ ε ) ε x j ) .
The values of the constant coefficients are as follows: C ε 1 = 1.44 , C ε 2 = 1.92 , C μ = 0.09 , σ k = 1.0 , σ ε = 1.3 .
The cavitation model chosen for this calculation was proposed by Zwart et al. [22], which is given as the following equations. An equation to illustrate the vapor volume fraction of the cavitation process is demonstrated in Equation (6). The source terms m ˙ + and m ˙ represent the evaporation and condensation, respectively.
( ρ v α v ) t + ( ρ v u v u j ) x j = ( Γ v ρ v α v / ρ ) i + m ˙ + + m ˙ .
The source terms in Equation (6) for the conservation equation of vapor volume fraction are expressed as
m ˙ + = C e 3 α nuc ρ v R B ( 1 α v ) 2 3 | p v p | ρ l ,   p p v
m ˙ = C c 3 α v ρ v R B 2 3 | p v p | ρ l ,   p > p v
where the C e and C c represent the empirical constants of the evaporation and condensation, respectively. R B is the radius of vapor bubble, α nuc is the volume fraction of noncondensable gas, and p v is the saturation pressure of the water at the local temperature.
More details about the geometry parameters and the numerical method of the pump are given in previous research [23,24]. The flow in the centrifugal pump is predicted by the numerical simulation with the commercial ANSYS-CFX 14.5 code.

2.2. Experimental Equipment

In Figure 3, a closed hydraulic test rig was designed and built up. Four piezoelectric accelerometers were installed in different positions in the test rig to collect the vibration signals induced by the flow instabilities in the pump at different flow rates. The vibration signals in X, Y, and Z direction were measured by accelerometer 1, 2, and 3, respectively. At the same time, the vibration on the base was tested by accelerometer 4. The type of the piezoelectric accelerometers was MA352A60, which has a wide testing range (5 Hz to 70 kHz). In the current experiment, the sampling frequency of the vibration signals was set as 20,000 Hz. The stereogram of the test rig and the installing positions of the apparatuses are depicted in Figure 4.

3. Results and Discussions

3.1. Experimental Results

The performance curves of the centrifugal pump are shown in Figure 5. A reasonable consistency between the numerical results and the experimental results could be found, with the flow rate increasing from 0 to 1.5 Qd. The relative error between the numerical and experimental results was within 5% in a wide flow range. Especially, a good agreement between the calculation and measurement of the pump performance was found at part load conditions. Therefore, the results of the simulation can be verified by the experiment.
The relationships between the root mean square (RMS) of the vibration tested at different locations in the system, the head of the pump, and the variation of the flow rate were established, depicted in Figure 6. The vibration was measured at four different points, shown in Figure 4. The vibration intensity of each measuring point showed almost the same trend as the flow rate changes. It was illustrated that the RMS value of the vibration signals at all the testing points retained a relatively small fluctuation when the flow rate increased from 0 to around 1.15 Qd (58 m3/h). All the vibration signals began to increase significantly while the flow rate exceeded about 1.22 Qd (62 m3/h), which indicates the occurrence of cavitation. The intensity of vibration measured at all the testing points dramatically intensified with the further increase of Q, because of the development of cavitation in the centrifugal pump. This occurrence and development of cavitation will be confirmed by the following power spectral density (PSD) analysis and the numerical simulation. It is obvious that the cavitation in the pump has a great influence on the intensification of the vibration.
The vibration signals measured at all the testing points achieved the local maximum value when the flow rate was 0.6 Qd (30 m3/h), depicted in Figure 6. This flow rate condition can be regarded as the transition point where the flow in the pump transitions from relatively steady flow to severely unsteady flow with the reduction of the flow rate. Actually, combined with the numerical results, it is considered that the backflow generates while the flow rate is lower than that of this condition.
It can be noticed that the RMS value of vibration tested at point 1 was always larger than that at the other three measuring points at a certain flow rate. Meanwhile, the amplitude of the vibration signals at testing point 4 were greater than those at measuring point 2 and point 3 for a wide range of flow rates (approximate from 0.5Qd to 1.5 Qd), and the vibration measured at point 3 showed the weakest intensity among the four measured points. A possible explanation for this phenomenon is that the measuring point 1 was located near the inlet of pump volute, which was the position closest to the rotating impeller among these testing points, which was strongly affected by the rotor induced vibration. Point 4 was located on the platform of the system. Hence, this point was not only affected by the rotor–stator interaction and the flow instabilities in the pump, but also impacted by the vibration associated with the rotating shaft and the structure of the system. At the same time, the vibration induced by the rotors would be attenuated in the transmission process. Therefore, the vibration at point 4 showed a relatively strong intensity.
Accelerometer 2 was located on the volute wall in the impeller radial direction, which was greatly affected by the interaction between the unsteady flow, its centrifugal force, and the internal wall surface of the volute, causing a relative intensification of the vibration under part load conditions. It was noted that the intensity of vibration measured at point 2 increased and almost reached the local maximum value at approximately 0.277 Qd (14 m3/h), which was the hump point, shown in Figure 6. It was indicated that the vibration signals measured at this point can be applied to detect the hump for the centrifugal pump. Meanwhile, owing to the fact that the flow rate was lower than that of the condition which corresponded to the hump point, regarded as the rotating stalling conditions [25], the conditions of rotating stall could be detected by vibration. Measuring point 3 was located on the volute wall, which was considerably thick, close to the tongue, and far away from the flowing fluid and the rotors. Therefore, the intensity of vibration was the weakest among these testing points.
In order to make a comprehensive analysis of the vibration signals mentioned above, the power spectral density (PSD) of the testing vibration was investigated. The relationships between the PSD of vibration obtained from the four different testing points and the flow rates of the centrifugal pump were established, shown in Figure 7, Figure 8, Figure 9 and Figure 10.
Apparent interference signals distributed from 0 to 400 Hz can be found, except for measuring point 4, illustrated in Figure 7a, Figure 8a, Figure 9a and Figure 10a. It is regarded that the spectrum component on the frequency range was induced by the interaction between static volute tongue and rotating impeller blades. Testing point 4 was located on the platform far away from the volute and impeller, so the vibration signals associated with the shaft frequency (f0) were not obvious.
Actually, a similar variation trend distributed at the blade passing frequency could be found between the PSD of vibration measured at testing point 1 and the PSD of pressure pulsations and acoustic signals tested at the pump inlet with the changes of flow rate. Meanwhile, obvious shaft frequency harmonic characteristics of the PSD of vibration tested at point 1 could be obtained at 2f0, 3f0, 4f0, and 5f0 with the whole increase range of flow rate, illustrated in Figure 7a. Due to the locations of testing point 2 and point 3, these results were excessively affected by the interaction between the tongue and blades, the vibration signals distributed at the shaft frequency, and its multiplications, which fluctuated obviously with the flow rate increases from around 0 to 0.6 Qd (0 to 30 m3/h), shown in Figure 8a. Indeed, the unsteady flow occurred when the flow rate dropped to 0.6 Qd, which was certified by the numerical simulation in the current study, depicted in Figure 12. Meanwhile, the RMS of the vibration reached the local maximum when the flow rate was 0.6 Qd, illustrated in Figure 6. Therefore, the shaft frequency and its multiplications of the PSD of vibration measured at point 1 can reveal the occurrence and intensification of flow instabilities under the part load conditions.
At the same time, apparent broadband pulsations of the vibration measured at all the testing points could be found from 6 kHz to 10 kHz when the flow rate increased to around 1.22 Qd (62 m3/h), shown in Figure 7b, Figure 8b, Figure 9b and Figure 10b. According to the authors’ previous research in reference [8], the vibrating broadband signals distributed in the range of 6 kHz to 10 kHz in this experimental system were caused by the occurrence, and development, of cavitation. Meanwhile, based on the analysis of the vibration in Figure 6, it is clear that the RMS of the vibration rose dramatically when the flow rate increased to 62 m3/h, since the incipience of cavitation in the pump. Actually, the fact that cavitation occurred when the flow rate increased to 1.22 Qd (62 m3/h) in the centrifugal pump is demonstrated by the numerical simulation in the present investigation, illustrated in Figure 13. The broadband frequency distributed between 6 kHz and 10 kHz can be considered as the symbolic frequency induced by cavitation in the centrifugal pump.
Therefore, the vibration signals can be applied to detect the flow instabilities, which includes the hump, rotating stall, backflow, and cavitation in centrifugal pumps, helping to obtain safe and steady operating conditions of the system.

3.2. Numerical Results

In this paper, only the steady calculation was conducted to predict the flow state at various flow rates. The flow instabilities in the pump intensified in general while the centrifugal pump operated under the off-design conditions. In order to investigate the internal flow characteristics, the absolute velocity distributions of water in axial plane b under different flow rates are shown in Figure 12. The position of axial plane b is illustrated in Figure 11.
It is clear that the inner flow uniformity, instead of obvious flow instabilities, can be found when the flow rates increase from 0.8 Qd to 1.0 Qd, depicted in Figure 12b,c. The water velocity distribution in the impeller is still relatively uniform and symmetric when the flow rate is 1.2 Qd, illustrated in Figure 12d. The local water velocity at the corner of the volute outlet increases dramatically, however, due to the great changes in the direction of flow velocity, which can lead to the increase of the local hydraulic loss. Meanwhile, the cavitation bubbles are observed at the pressure side of two blades’ leading edges, depicted in Figure 13. The bubbles are illustrated by the isosurfaces for a 1% vapor volume fraction. The proof of the occurrence of cavitation discussed in the previous section is now observed from the numerical simulation results, which strongly demonstrates the accuracy between the experimental research and numerical calculation, again.
Apparent low velocity regions near the blades’ suction side (which include blade 1, blade 5, and blade 6) in these channels, which are close to the volute tongue, can be found in Figure 12a when the flow rate decreases to 0.6 Qd. This phenomenon epitomizes the occurrence of flow instabilities, which is verified by the experimental vibration in the previous discussion and in the research as well.
With the further decrease of flow rate, obvious backflow in the region mentioned above can be observed when the flow rate is 0.4 Qd, depicted in Figure 14b. The backflow, with a relative low velocity, flows back to the upstream along the blade suction side, which results in part flow passages being obstructed, causing the main flow movement to the downstream along the pressure side of the blades. In this condition, the vortex with a relative low rotational speed and an opposite rotating direction to the impeller can be found in impeller channel A and close to the pressure side of the blade 6, shown in Figure 14b. High-speed flow is generated in the narrow gaps between the volute tongue and rotating blades, intensifying the flow instabilities in the region.
With the further decrease of flow rate, the backflows in the impeller channels A, E, and F become increasingly severe, and consequently these regions with backflows expand greatly as the flow rate decreases to 0.2Qd, depicted in Figure 14a. Obvious rotating stall can be found in the backflow’s downstream local region, which is near the outlet of channel F, whose rotating direction is opposite to that of the impeller. It is considered that the mechanism of the rotating stall in the channel F includes the following explanation. In the first place, the mainstream is severely blocked from flowing into the impeller channel due to the backflow generated in the upstream region of the flow passage. In the second place, owing to the viscosity of the fluid, the fluid in the “dead water zone”, which means the fluid in these zones with relative low moving velocity, is affected by the high speed water flow in the volute, resulting in the occurrence of the rotating stall, whose rotating direction is opposite to that of the impeller.
An interesting phenomenon that can be found is that there are two apparent reflux regions in the impeller passage A, illustrated in Figure 14a. One of the backflow regions generates in the suction side of the center of blade 1, which obstructs part of the flow passage. Another one occurs in the region between the center and the downstream of channel A, causing extremely complicated turbulence in the region. Due to the influence of mainstream and the restriction of the pump’s extreme part load, the fluid in the volute flows back into the impeller passages. Under this operating condition, the flows in the impeller channels B, C, and D, which are far away from the tongue, are more uniform than those in the channels close to the tongue. The complicated backflows and the rotating stalls existing in these channels A, E, and F are affected by the mainstream, which would flow to the volute and downstream by taking the process of the blades rotating far away from the tongue into account. It would lead to pump inlet and outlet pressure fluctuations. At the same time, the decrease of the pump flow rate can also cause the backflow in the region near the pump outlet, which can further affect the pressure pulsations at the pump outlet.
Therefore, it is clear that the internal flow instabilities in the centrifugal pump intensify with the increase of the deviation from the rated flow rate. Specifically, the flow instabilities become extremely complicated under the part load conditions.
Different intensifications of turbulence can be found in the pump while it operates under various flow rates. The distributions of the turbulent kinetic energy in axial plane b are shown in Figure 15. It is clear that the distribution of the turbulent kinetic energy is relatively uniform and symmetric when the flow rate increases from 0.8 Qd to 1.2 Qd, which illustrates that the intensity of turbulence is weak. The turbulence intensity in the local region near the pump outlet is relatively strong with Q increases to 1.2 Qd. The water velocity drops gradually with the decrease of Q, causing the gradual increase of the turbulence intensity. When the flow rate is 0.8 Qd, a relatively strong turbulent region is produced near the narrow gap between the volute tongue and the blades as shown in Figure 15b. The region of the turbulence expands, and the intensity of the turbulence intensifies, with the further drops of the flow rate.
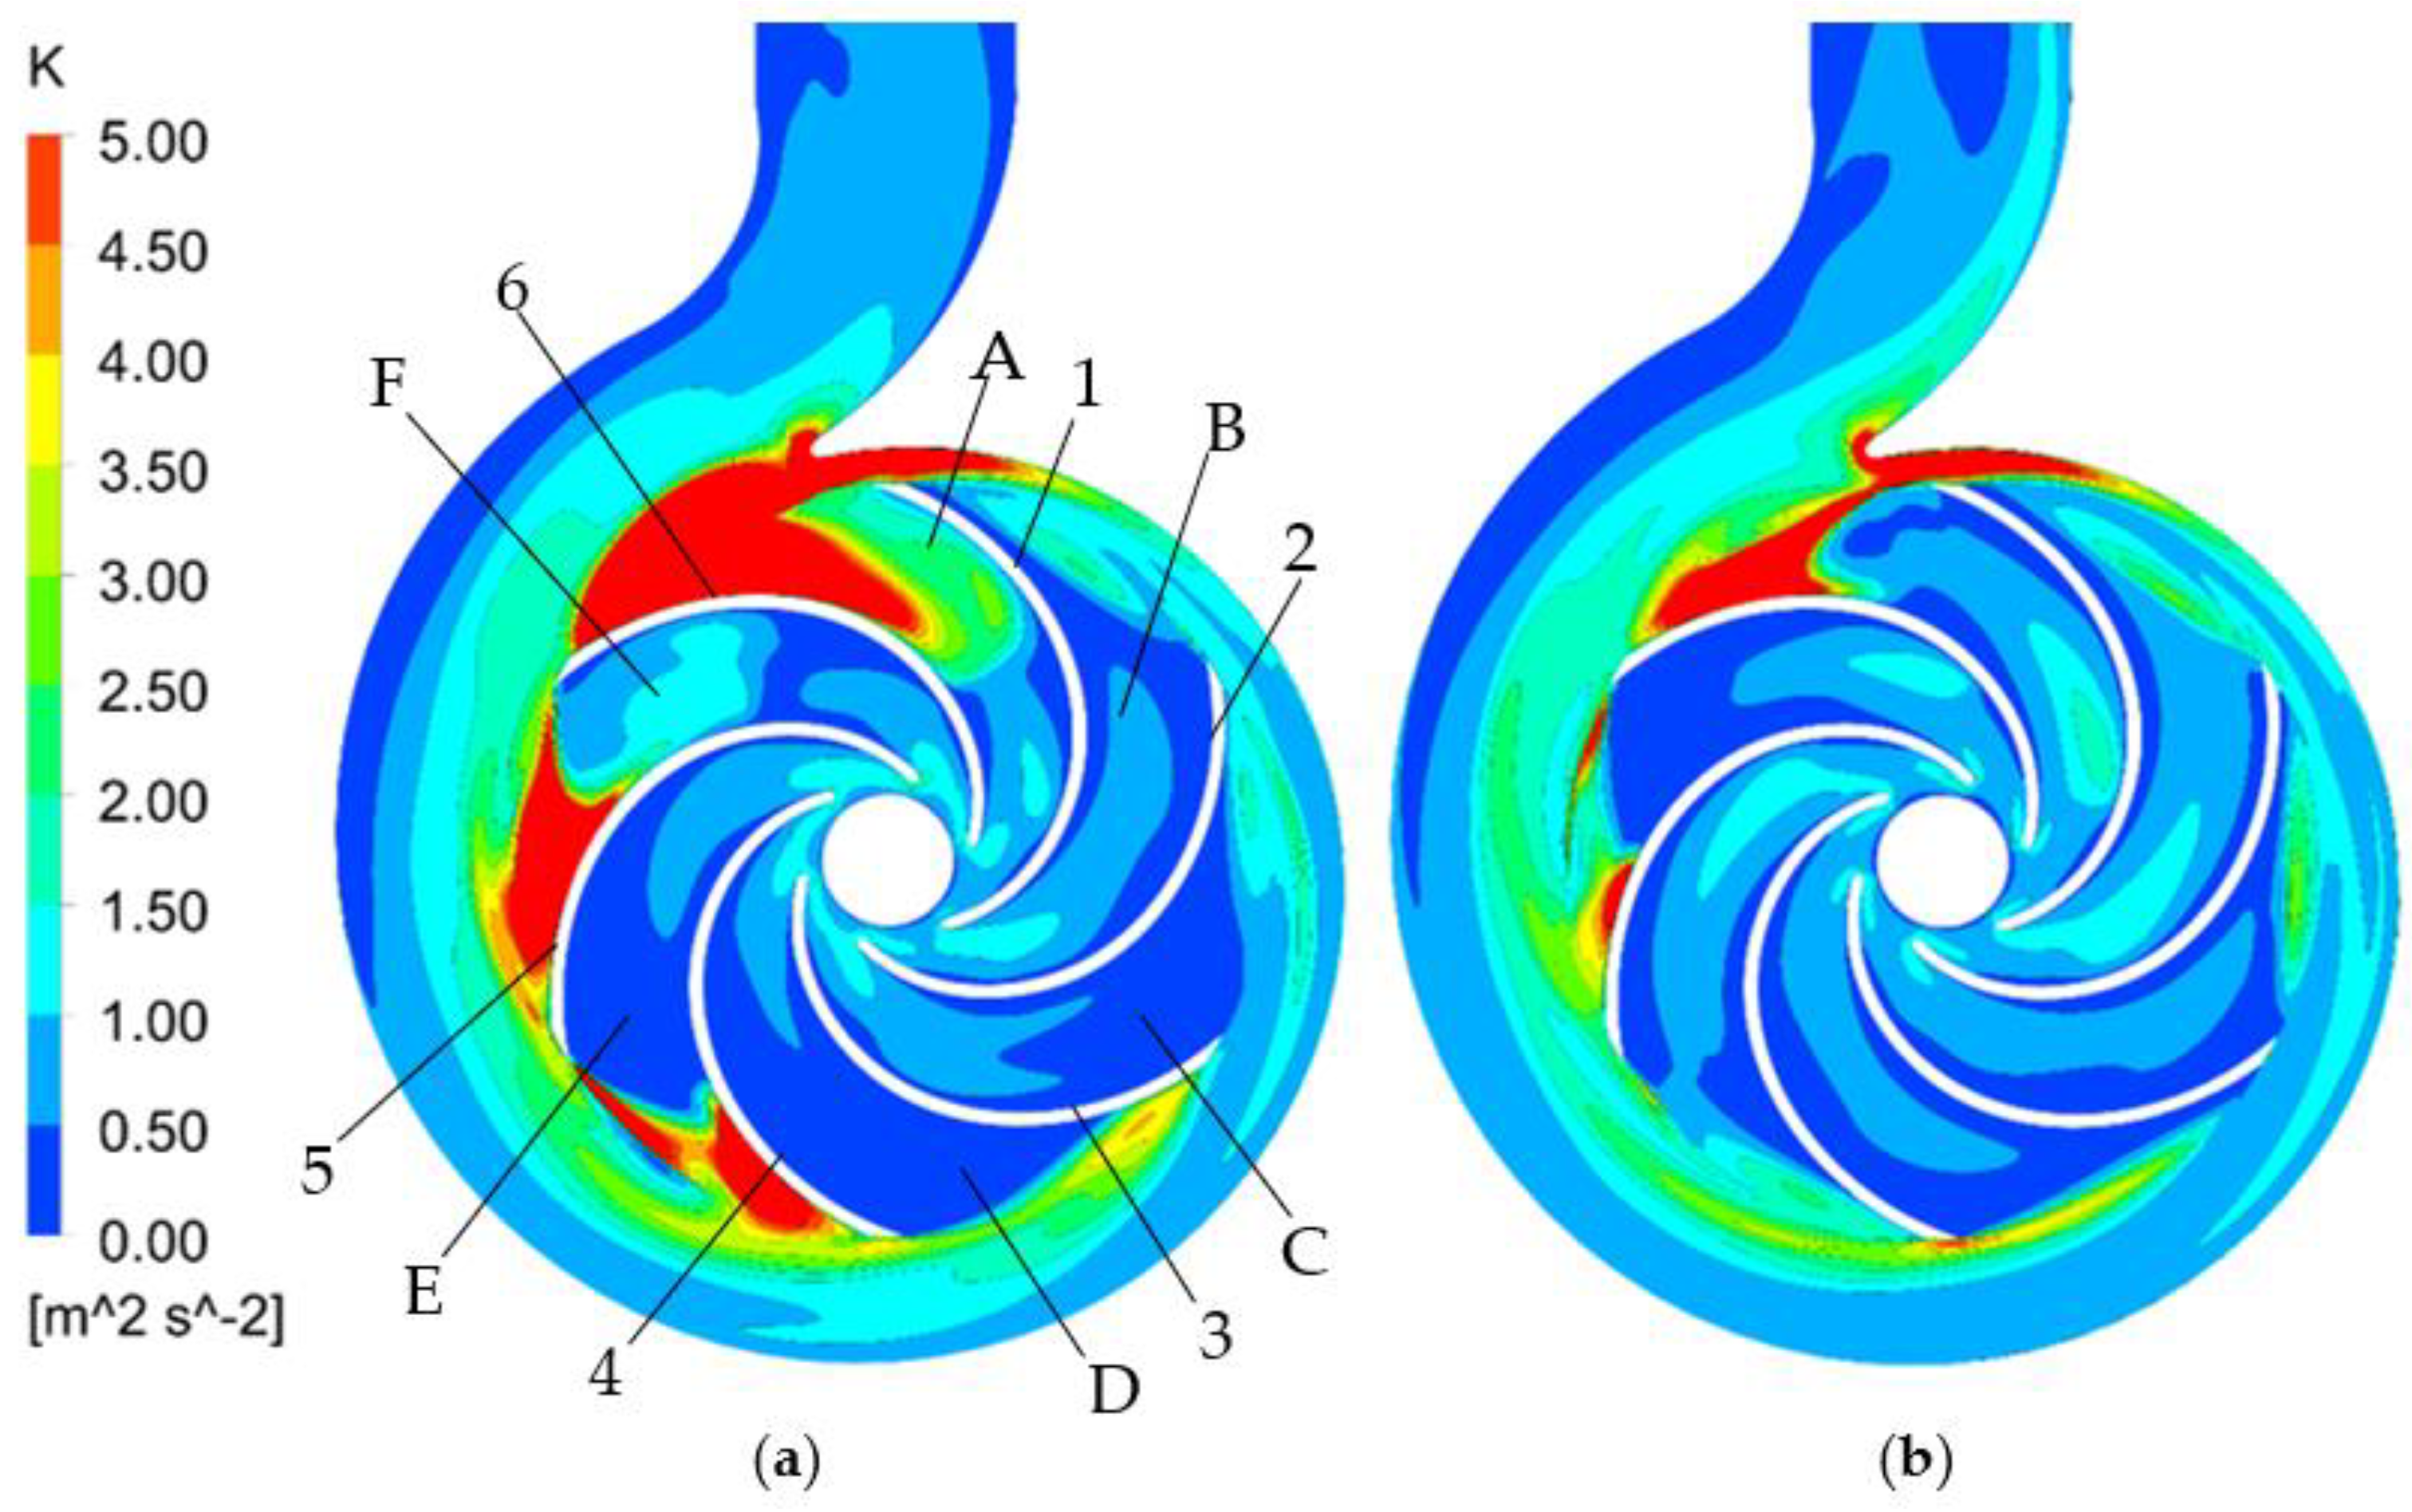
Under the extremely part load conditions, the distributions of the turbulent kinetic energy enhance in these regions where the backflows and rotating stalls occur, shown in Figure 16. It is significant to note that a strong distribution of the turbulent kinetic energy in both of the pressure side and the suction side of each blade leading edge can be found as Q drops to 0.4 Qd, depicted in Figure 16b. Meanwhile the distributions of the local strong turbulent kinetic energy diffuse downstream along the both sides of the blades with the further decrease of Q. According to the velocity triangles, the main explanation for the phenomenon is that at extreme part load conditions, the absolute flow angle of the fluid at the leading edge of blade decreases obviously, resulting in the increasing of attack angle of the mainstream. The increase of the mainstream attack angle makes the flow direction of the fluid shift to the upstream side of the adjacent blades, which leads to the intensification of the impact to the blade leading edge and the aggravation of turbulence intensity in these regions. Furthermore, the distribution of the turbulent kinetic energy of the downstream flow is also affected by the change of flow direction, causing the increase of local energy loss and the decrease of pump efficiency. Therefore, it is obvious that the attack angle of the blades’ leading edge in an impeller has a great influence on the flow instabilities of a centrifugal pump, even if it is under noncavitation conditions. It was proposed that a closely corresponding relationship between the attack angles of the blades’ leading edges and the flow separation could be established in Pan’s research [25]. It was considered that the flow separation near the suction side of the blade could not be eliminated in a timely and effective manner if the positive attack angle of the blades’ leading edge is too large, giving rise to the reduction of pump performance and the pressure pulsations at pump inlet and outlet. However, it was presented that the relatively positive large attack angle of blade leading edges is beneficial to the performance of the centrifugal pump under the over load conditions.

4. Conclusions

Numerical and experimental methods are combined to detect the internal flow state for a centrifugal pump. It was found that the inlet attack angles of blades in an impeller have a great influence on the flow instabilities in a centrifugal pump, even if it is under noncavitation conditions. The mechanism of the rotating stall in the impeller channel was explained. Meanwhile, flow state identification with vibration (FSIV) was proposed to detect the flow instabilities in a centrifugal pump. The relationship between the external vibration and the inner flow state has been established by FSIV. The characteristics and mechanism of the vibration produced by the flow instabilities in a centrifugal pump were investigated. It was found that the hump, the rotating stall, the backflow, the occurrence of unstable flow, and the cavitation in the centrifugal pump can be effectively detected by applying the vibration signals, which helps to obtain safe and steady operating conditions for the system. This is a nonintrusive method without affecting the internal flow field in the pump, which is another advantage for its application.
The visualization experiment and the vibration measurement should be combined to investigate the various types of flow instabilities in pumps for the future research.

Author Contributions

J.L. wrote the paper; J.L. and B.H. conducted the experiments; J.L., Y.Z., and H.H. carried out the numerical simulations; J.L. and B.Z. analyzed the results; X.L. and S.Y. commented on the paper.

Acknowledgments

The authors express their heart felt appreciation to Shouqi Yuan at Jiangsu University for his significant support during Jiaxing Lu’s Ph.D. study. This research was funded by the National Key Research and Development Program “Research and Application Demonstration of Complementary Combined Power Generation Technology between Distributed Photovoltaic and Cascade Small Hydropower” (Grant No. 2018YFB0905200 ), by the Natural Science Foundation of China (Grant No. 51679122, Grant No. 51736008, Grant No.51609107), by the Open Research Subject of Key Laboratory (Fluid Machinery and Engineering Research Base) of Sichuan Province (Grant No. szjj2019-026), by the Project of the Education Department of Sichuan Province (Grant No. 13ZA0027), and by Natural Science Foundation of Jiangsu Province (Grant No. BK20160539).

Conflicts of Interest

The authors declare no conflict of interest.

Nomenclature

Latin Symbols
A,B,C,D,E,FImpeller channels-
bThe location of axial plane-
fdBlade passing frequencyHz
f0Shaft frequencyHz
gAcceleration of gravitym/s2
HHeadm
HdRated head of the pumpm
nRotational speedrpm
nsSpecific speed at the rated flow rate3.65nQ0.5/H0.75
QFlow ratem3/s
QdRated flow ratem3/s
ZBlade number-
Abbreviations
FSIVFlow state identification with vibration
PSDPower spectral density
RMSRoot mean square

References

  1. Lucius, A.; Brenner, G. Unsteady CFD simulations of a pump in part load conditions using scale-adaptive simulation. Int. J. Heat Fluid Flow 2010, 31, 1113–1118. [Google Scholar] [CrossRef]
  2. Morros, C.S.; Fernández Oro, J.M.; Argüelles Díaz, K.M. Numerical modelling and flow analysis of a centrifugal pump running as a turbine: Unsteady flow structures and its effects on the global performance. Int. J. Numer. Methods Fluids 2011, 65, 542–562. [Google Scholar] [CrossRef]
  3. Westra, R.W.; Broersma, L.; Van Andel, K. PIV measurements and CFD computations of secondary flow in a centrifugal pump impeller. J. Fluids Eng. 2010, 132, 061104. [Google Scholar] [CrossRef]
  4. Jiang, A.H.; Zhang, Y.; Jing, S.Y. Research on fluid exciting forces on centrifugal pump. Part I: Force on volute. J. Vib. Shock 2012, 31, 60–66. [Google Scholar]
  5. Jiang, A.H.; Zhou, P.; Zhang, Y.; Hua, H. Research on base vibration of centrifugal pump by phase space reconstruction. Trans. Chin. Soc. Agric. Eng. 2014, 30, 56–62. [Google Scholar]
  6. Magalhães, R.S.; Fontes, C.H.O.; Almeida, L.A.L.; Embiruçu, M.; Santos, J.M.C. A model for three-dimensional simulation of acoustic emissions from rotating machine vibration. J. Acoust. Soc. Am. 2010, 127, 3569–3576. [Google Scholar] [CrossRef] [PubMed]
  7. GonzÃĄlez, J.Ã.Š.; Parrondo, J.; Santolaria, C.; Blanco, E. Steady and unsteady radial forces for a centrifugal pump with impeller to tongue gap variation. J. Fluids Eng. 2006, 128, 454–462. [Google Scholar] [CrossRef]
  8. Lu, J.X.; Yuan, S.Q.; Parameswaran, S.; Yuan, J.P.; Ren, X.D.; Si, Q.R. Investigation on the vibration and flow instabilities induced by cavitation in a centrifugal pump. Adv. Mech. Eng. 2017, 9. [Google Scholar] [CrossRef]
  9. Ni, Y.Y.; Yuan, S.Q.; Yuan, J.P. Detection of cavitation in centrifugal pump by vibration methods. Chin. J. Mech. Eng. 2008, 21, 43–49. [Google Scholar] [CrossRef]
  10. Yuan, J.P. Inner Flow PIV Measurement and Its Unsteady Turbulent Flow Numerical Simulation for a Centrifugal Pump with Multi-Programs. Ph.D. Thesis, Jiangsu University, Zhenjiang, China, 2008. [Google Scholar]
  11. Shibata, A.; Hiramatsu, H.; Komaki, S.; Miyagawa, K.; Maeda, M.; Kamei, S. Study of flow instability in off design operation of a multistage centrifugal pump. J. Mech. Sci. Technol. 2016, 30, 493–498. [Google Scholar] [CrossRef]
  12. Li, X.J.; Gao, P.L.; Zhu, Z.C.; Li, Y. Effect of the blade loading distribution on hydrodynamic performance of a centrifugal pump with cylindrical blades. J. Mech. Sci. Technol. 2018, 32, 1–10. [Google Scholar] [CrossRef]
  13. Gao, M.; Dong, P.X.; Lei, S.H.; Turan, A. Computational study of the noise radiation in a centrifugal pump when flow rate changes. Energies 2017, 10, 221. [Google Scholar] [CrossRef]
  14. Botero, F.; Hasmatuchi, V.; Roth, S.; Farhat, M. Non-intrusive detection of rotating stall in pump-turbines. Mech. Syst. Signal. Process. 2014, 48, 162–173. [Google Scholar] [CrossRef]
  15. Chu, S.; Dong, R.; Katz, J. Relationship between unsteady flow, pressure fluctuations, and noise in a centrifugal pump—Part A: Use of PDV data to compute the pressure field. J. Fluids Eng. 1995, 117, 24–29. [Google Scholar] [CrossRef]
  16. Katz, J. Relationship between unsteady flow, pressure fluctuations, and noise in a centrifugal pump—Part B: Effects of blade-tongue interactions. J. Fluids Eng. 1995, 117, 30–35. [Google Scholar]
  17. Rodriguez, C.G.; Egusquiza, E.; Santos, I.F. Frequencies in the vibration induced by the rotor stator interaction in a centrifugal pump turbine. J. Fluids Eng. 2007, 129, 1428–1435. [Google Scholar] [CrossRef]
  18. Fisher, R.K.; Seidel, U.; Grosse, G. A case study in resonant hydroelastic vibration: The causes of runner cracks and the solutions implemented for the Xiaolangdi hydroelectric project. In Proceedings of the 21 IAHR Symposium on Hydraulic Machinery and Systems (IAHR 2002), Lausanne, Switzerland, 9–12 September 2002. [Google Scholar]
  19. Mateos, J.B. Contribution to Rotor-Stator Interaction in Pump Turbine Prototypes. Ph.D. Thesis, Technical University of Catalonia (UPC), Barcelona, Spain, 2005. [Google Scholar]
  20. Purohit, A.; Darpe, A.K.; Singh, S.P. Experimental investigations on flow induced vibration of an externally excited flexible plate. J. Sound Vib. 2016, 371, 237–251. [Google Scholar] [CrossRef]
  21. Launder, B.E.; Spalding, D.B. The numerical computation of turbulent flows. Comp. Methods Appl. Mech. Eng. 1974, 3, 269–289. [Google Scholar] [CrossRef]
  22. Zwart, P.J.; Gerber, A.G.; Belamri, T. A two-phase flow model for predicting cavitation dynamics. In Proceedings of the Fifth International Conference on Multiphase Flow, Yokohama, Japan, 30 May–4 June 2004; p. 152. [Google Scholar]
  23. Lu, J.X; Yuan, S.Q.; Luo, Y.; Yuan, J.P.; Zhou, B.L.; Sun, H. Numerical and experimental investigation on the development of cavitation in a centrifugal pump. Proc. Inst. Mech. Eng. Part E 2016, 230, 171–182. [Google Scholar] [CrossRef]
  24. Lu, J.X; Yuan, S.Q.; Parameswaran, S.; Yuan, J.P.; Ren, X.D.; Zhou, B.L. The characteristics investigation under the unsteady cavitation condition in a centrifugal pump. J. Mech. Sci. Technol. 2017, 31, 1213–1222. [Google Scholar] [CrossRef]
  25. Pan, Z.Y.; Yuan, S.Q. Fundamentals of Cavitation in Pumps; Jiangsu University Press: Zhenjiang, China, 2013. [Google Scholar]
Figure 1. 3D model of the flow passages.
Energies 12 03066 g001
Figure 2. Mesh of the computational domain.
Energies 12 03066 g002
Figure 3. Schematic of the experimental test rig. (1, 3, 13) Ball valve; (2) vacuum pump; (4) pressure tank; (5, 10) butterfly valve; (6) gate valve; (7) turbine flowmeter; (8) pressure transmitter; (9) test pump; (11) electromotor; (12) buffer tank.
Energies 12 03066 g003
Figure 4. Experimental set up with instrumentations.
Energies 12 03066 g004
Figure 5. Performance curves of the centrifugal pump.
Energies 12 03066 g005
Figure 6. Root mean square (RMS) of vibration with different flow rates.
Energies 12 03066 g006
Figure 7. Power spectral density (PSD) of the vibration measured by accelerometer 1 under different flow rates. (a) 0–400 Hz, (b) 1–10 kHz.
Energies 12 03066 g007
Figure 8. PSD of the vibration measured by accelerometer 2 under different flow rates. (a) 0–400 Hz, (b) 1–10 kHz.
Energies 12 03066 g008aEnergies 12 03066 g008b
Figure 9. PSD of the vibration measured by accelerometer 3 under different flow rates. (a) 0–400 Hz, (b) 1–10 kHz.
Energies 12 03066 g009
Figure 10. PSD of the vibration measured by accelerometer 4 under different flow rates. (a) 0–400 Hz, (b) 1–10 kHz.
Energies 12 03066 g010
Figure 11. The position of the axial plane b.
Energies 12 03066 g011
Figure 12. Water velocity distribution in axial plane b at different flow rates. (a) 0.6 Qd, (b) 0.8 Qd, (c) 1.0 Qd, (d) 1.2 Qd.
Energies 12 03066 g012
Figure 13. The distributions of cavitation bubbles at 1.22 Qd.
Energies 12 03066 g013
Figure 14. Water velocity distribution in axial plane b at extreme part load conditions. (a) 0.2 Qd, (b) 0.4 Qd.
Energies 12 03066 g014
Figure 15. Turbulent kinetic energy distribution in axial plane b under different flow rates. (a) 0.6 Qd, (b) 0.8 Qd, (c) 1.0 Qd, (d) 1.2 Qd.
Energies 12 03066 g015aEnergies 12 03066 g015b
Figure 16. Turbulent kinetic energy distribution in axial plane b under part load conditions. (a) 0.2Qd, (b) 0.4 Qd.
Energies 12 03066 g016
Table 1. Primary parameters of the centrifugal pump.
ParametersValueUnit
Blade passing frequency fd291Hz
Shaft frequency f048.5Hz
Rated head Hd20.2m
Rated rotating speed n2910rpm
Specific speed at the rated flow rate ns132.2-
Rated flow rate Qd50.6m3/h
Blade number Z6-
Table 2. The grid independence analyzation.
MeshMesh 1Mesh 2Mesh 3Mesh 4
Number of the grid cells1,364,0842,097,5502,518,4952,903,461
Head (m)20.6620.6920.7020.71

