1. Introduction
HVDC allows efficient transportation of large amounts of electric power over long distances. It is one of the enabling technologies in adapting the electric power system in the transition to a sustainable energy system, e.g., as part of a large-scale introduction of renewable energy sources. More and more HVDC systems take the form of mixed overhead line/cable systems, mainly due to environmental reasons. HVDC cable systems connected to HVDC overhead lines are subject to fast front overvoltages emanating from lightning strikes to the line [
1,
2]. Two causes of lightning overvoltages have to be considered: backflashovers across the line insulators that may occur when lightning strikes a shield wire, and shielding failures occurring when lightning bypasses the shield wire and terminates directly onto the pole conductor.
Representative fast front overvoltage levels for HVDC cable systems connected to overhead lines are usually established without considering the statistical characteristics of the overvoltages. This may lead to overly conservative dimensioning of the cable insulation. To determine representative fast front overvoltage levels for the cable system, a statistical method was developed focusing on type test requirements for ±320 kV DC cable systems [
3]. The aim of the method was to minimize the number of simulations needed in order to determine overvoltage levels in the cables related to the acceptable mean time between failure (MTBF) for the cable system. The method is based on the statistical concept for overvoltage protection of substations described in references [
4,
5,
6]. For substations, the steepness of the impinging overvoltage wave is of primary interest, considering the protective distances of surge arresters. For cable systems, on the other hand, the overvoltage magnitude is the main concern. Thus, the focus of the statistical method for cables is on the magnitude of overvoltage waves impinging on the cable at the line/cable transition station.
The original method [
3] focuses on backflashovers and accounts for the statistical distribution of lightning current magnitudes as well as the attenuation of the overvoltage wave due to corona discharges on the line, since this effect dominates for system voltages up to about ±320 kV. To make the method suitable for higher system voltages as well, this article introduces an improved statistical method which also accounts for surge attenuation by resistive effects, the influence of soil ionization, and statistical treatment of overvoltages due to shielding failures. To illustrate the improved method, it is applied to a case study for a ±525 kV DC line.
2. Improved Statistical Method
The procedure for the improved statistical method is divided into three steps:
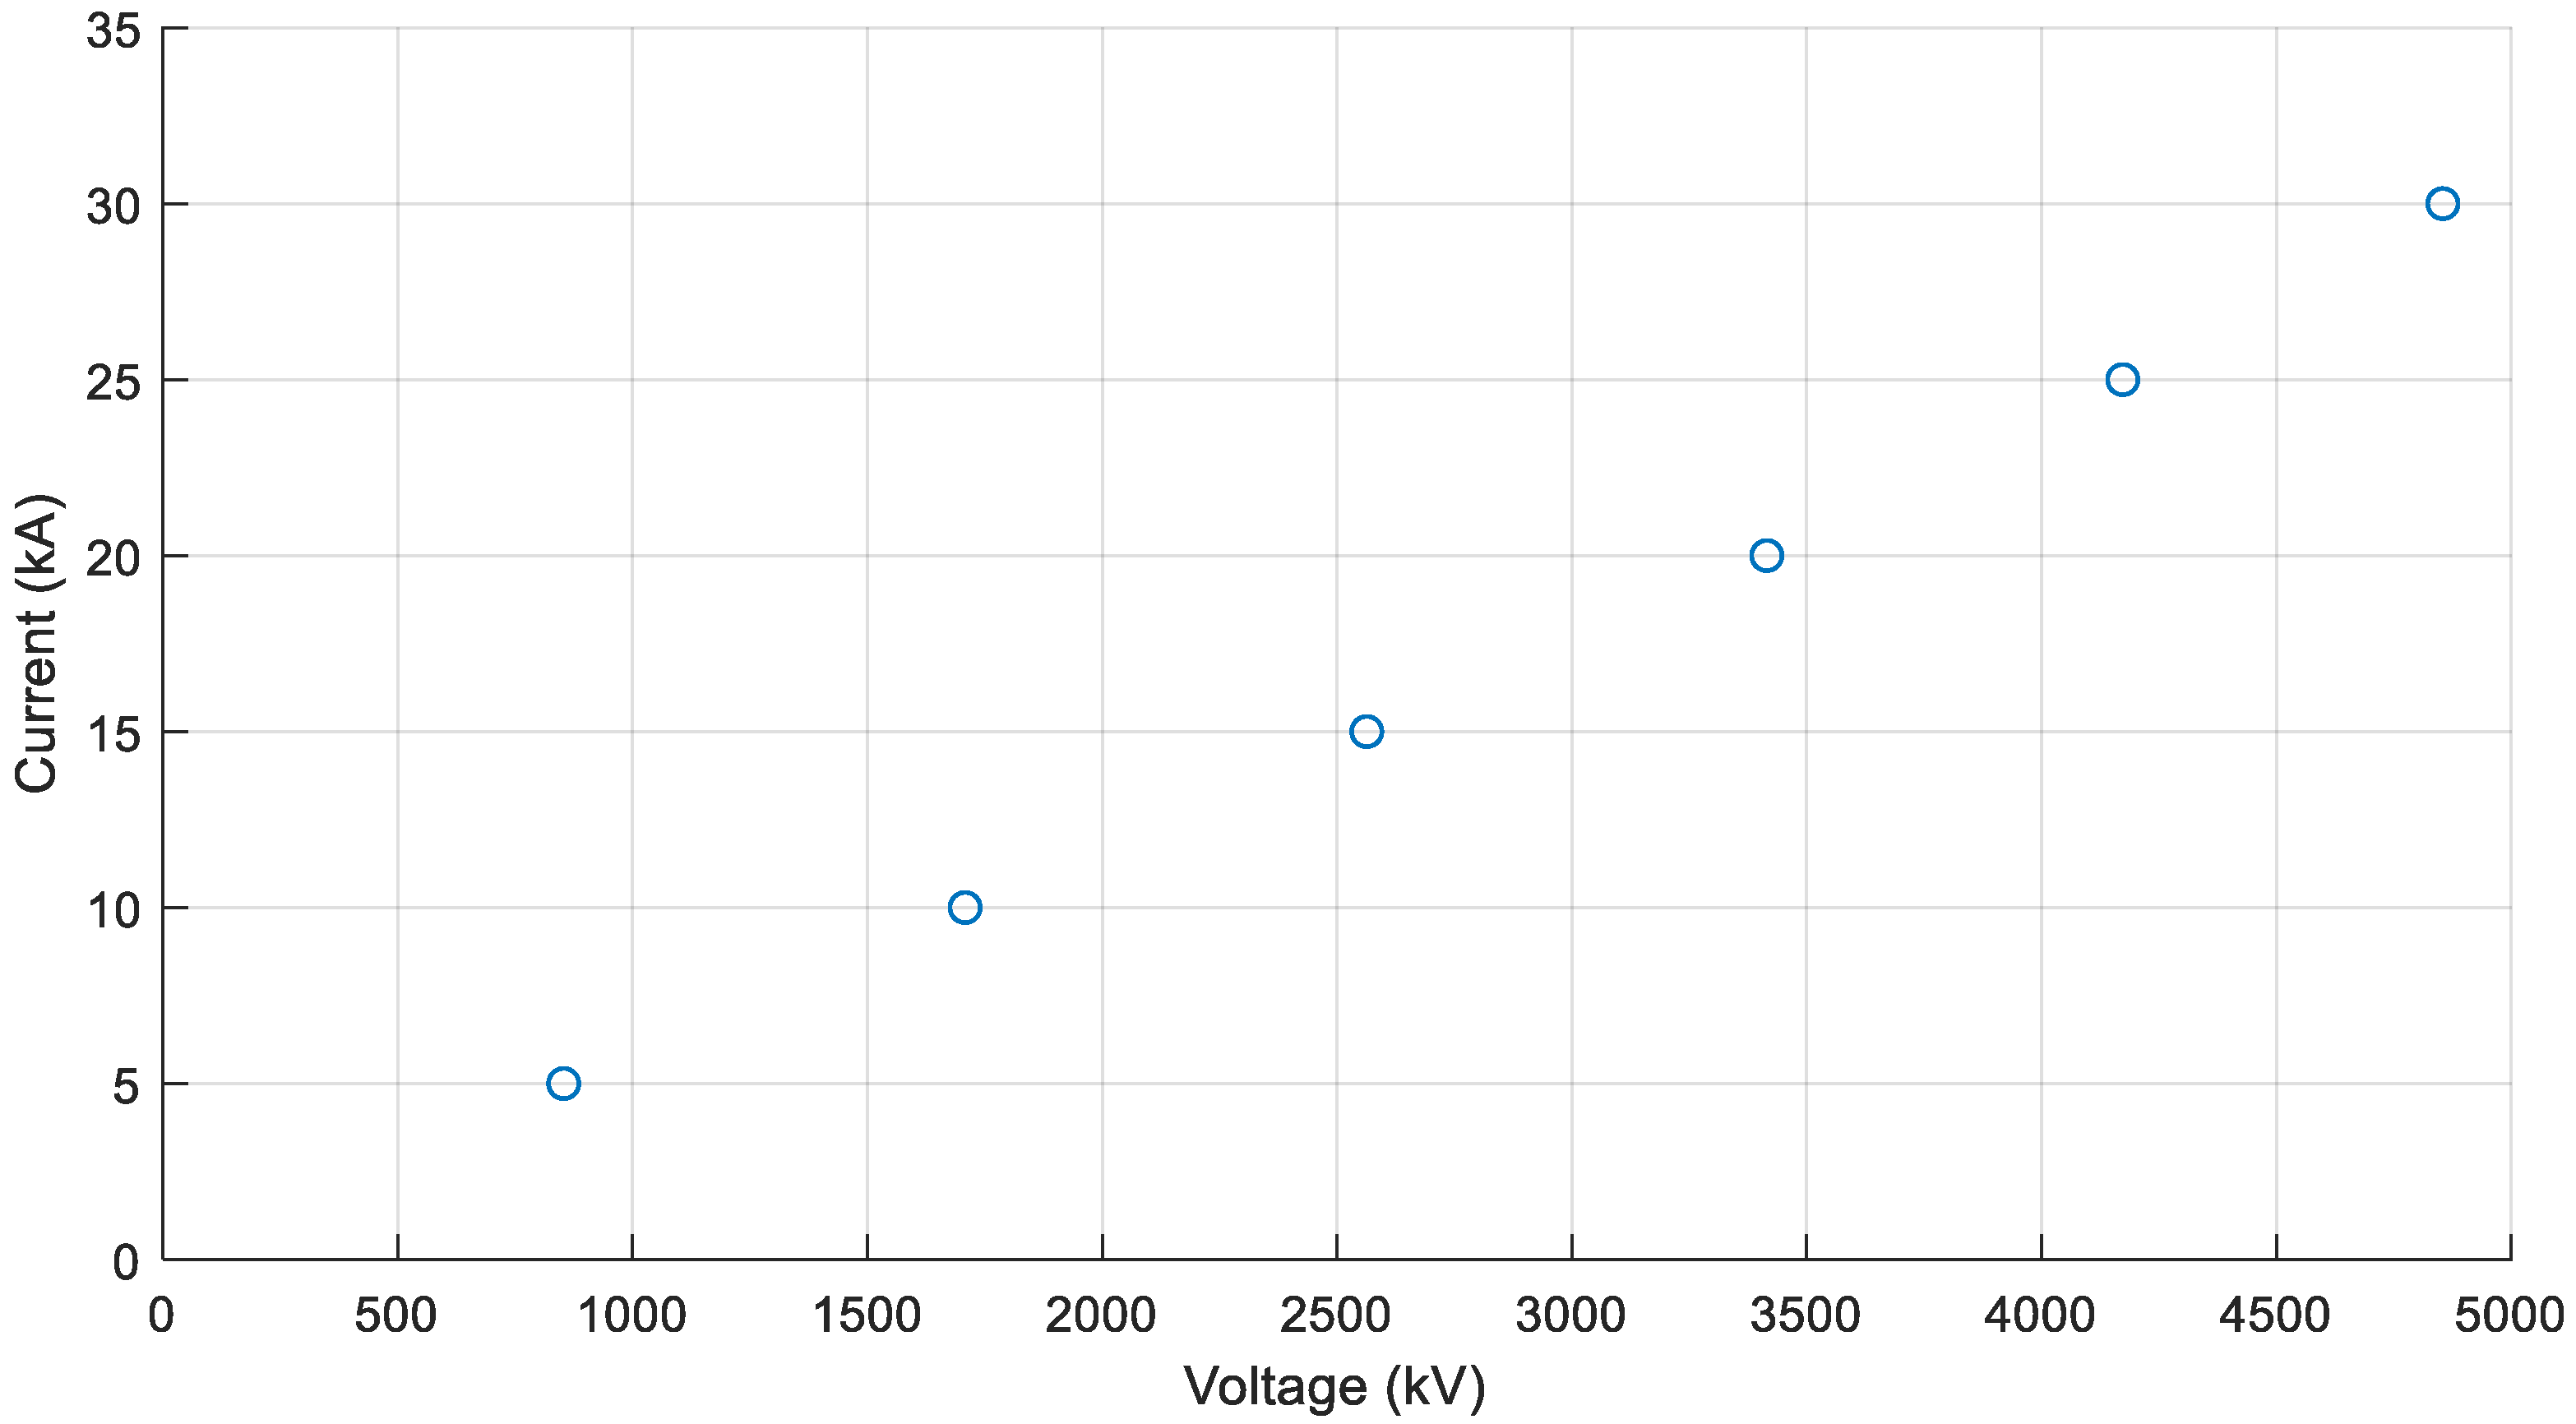
Step 1: Characterization of the line. The overhead line is characterized by its response to lightning strikes terminating at a shield wire or a pole conductor. At this stage, the cable is not considered. The response of the overhead line is determined through transient simulations and expressed as:
the relationship between lightning current and surge voltage magnitude at the striking point,
the shape of the overvoltage wave tail, and
the attenuation of the overvoltage magnitude due to voltage drops in shield wires, conductors and tower grounds, primarily caused by resistive effects.
The simulations are performed without directly considering the effect of corona attenuation in order to minimize the complexity of the simulation model. Corona attenuation is instead considered in the statistical procedure described below.
Step 2: Statistical procedure. Corona discharges reduce the front steepness and, hence, the magnitude of the overvoltage wave as it travels down the line, as described in references [
4,
5,
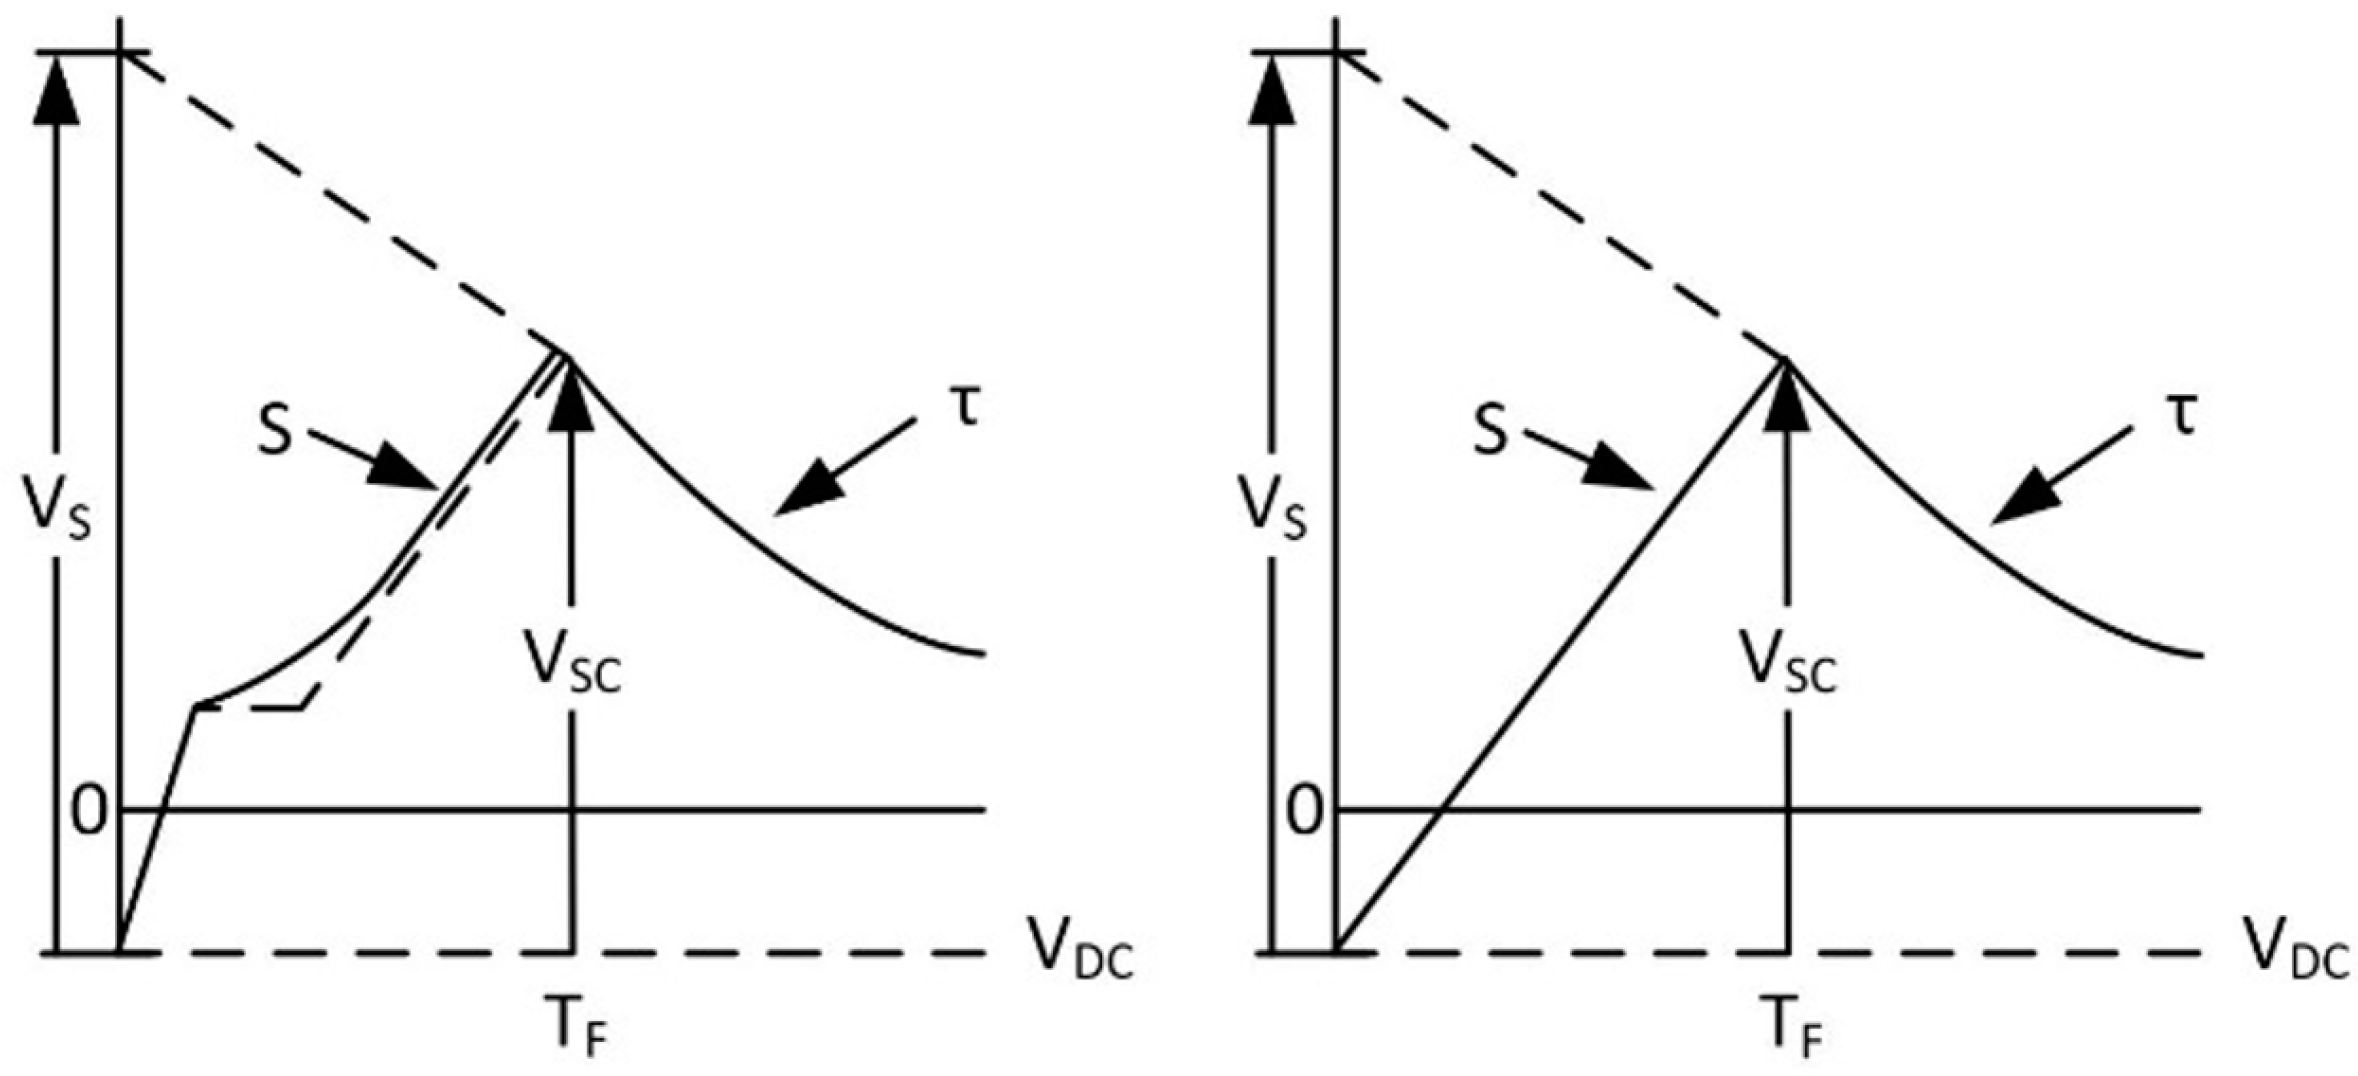
6]. The effect of corona attenuation can be considered in a simplified way by assuming that the overvoltage wave, after traveling some distance from the striking point, can be approximated by an impinging surge superimposed on the DC operating voltage of opposite polarity. The surge is characterized by a linearly rising front with the steepness
S, a corresponding front time
Tf, and an exponentially decaying tail with a time constant
τ determined in Step 1, see
Figure 1.
By assuming that the voltage surge magnitude at the striking point is
Vs, the surge magnitude
Vsc at a distance
d from the striking point can be calculated using the following expressions [
5]:
where
Kc is the corona damping coefficient (1700 km∙kV/µs for triple conductor bundles [
4,
5,
6]).
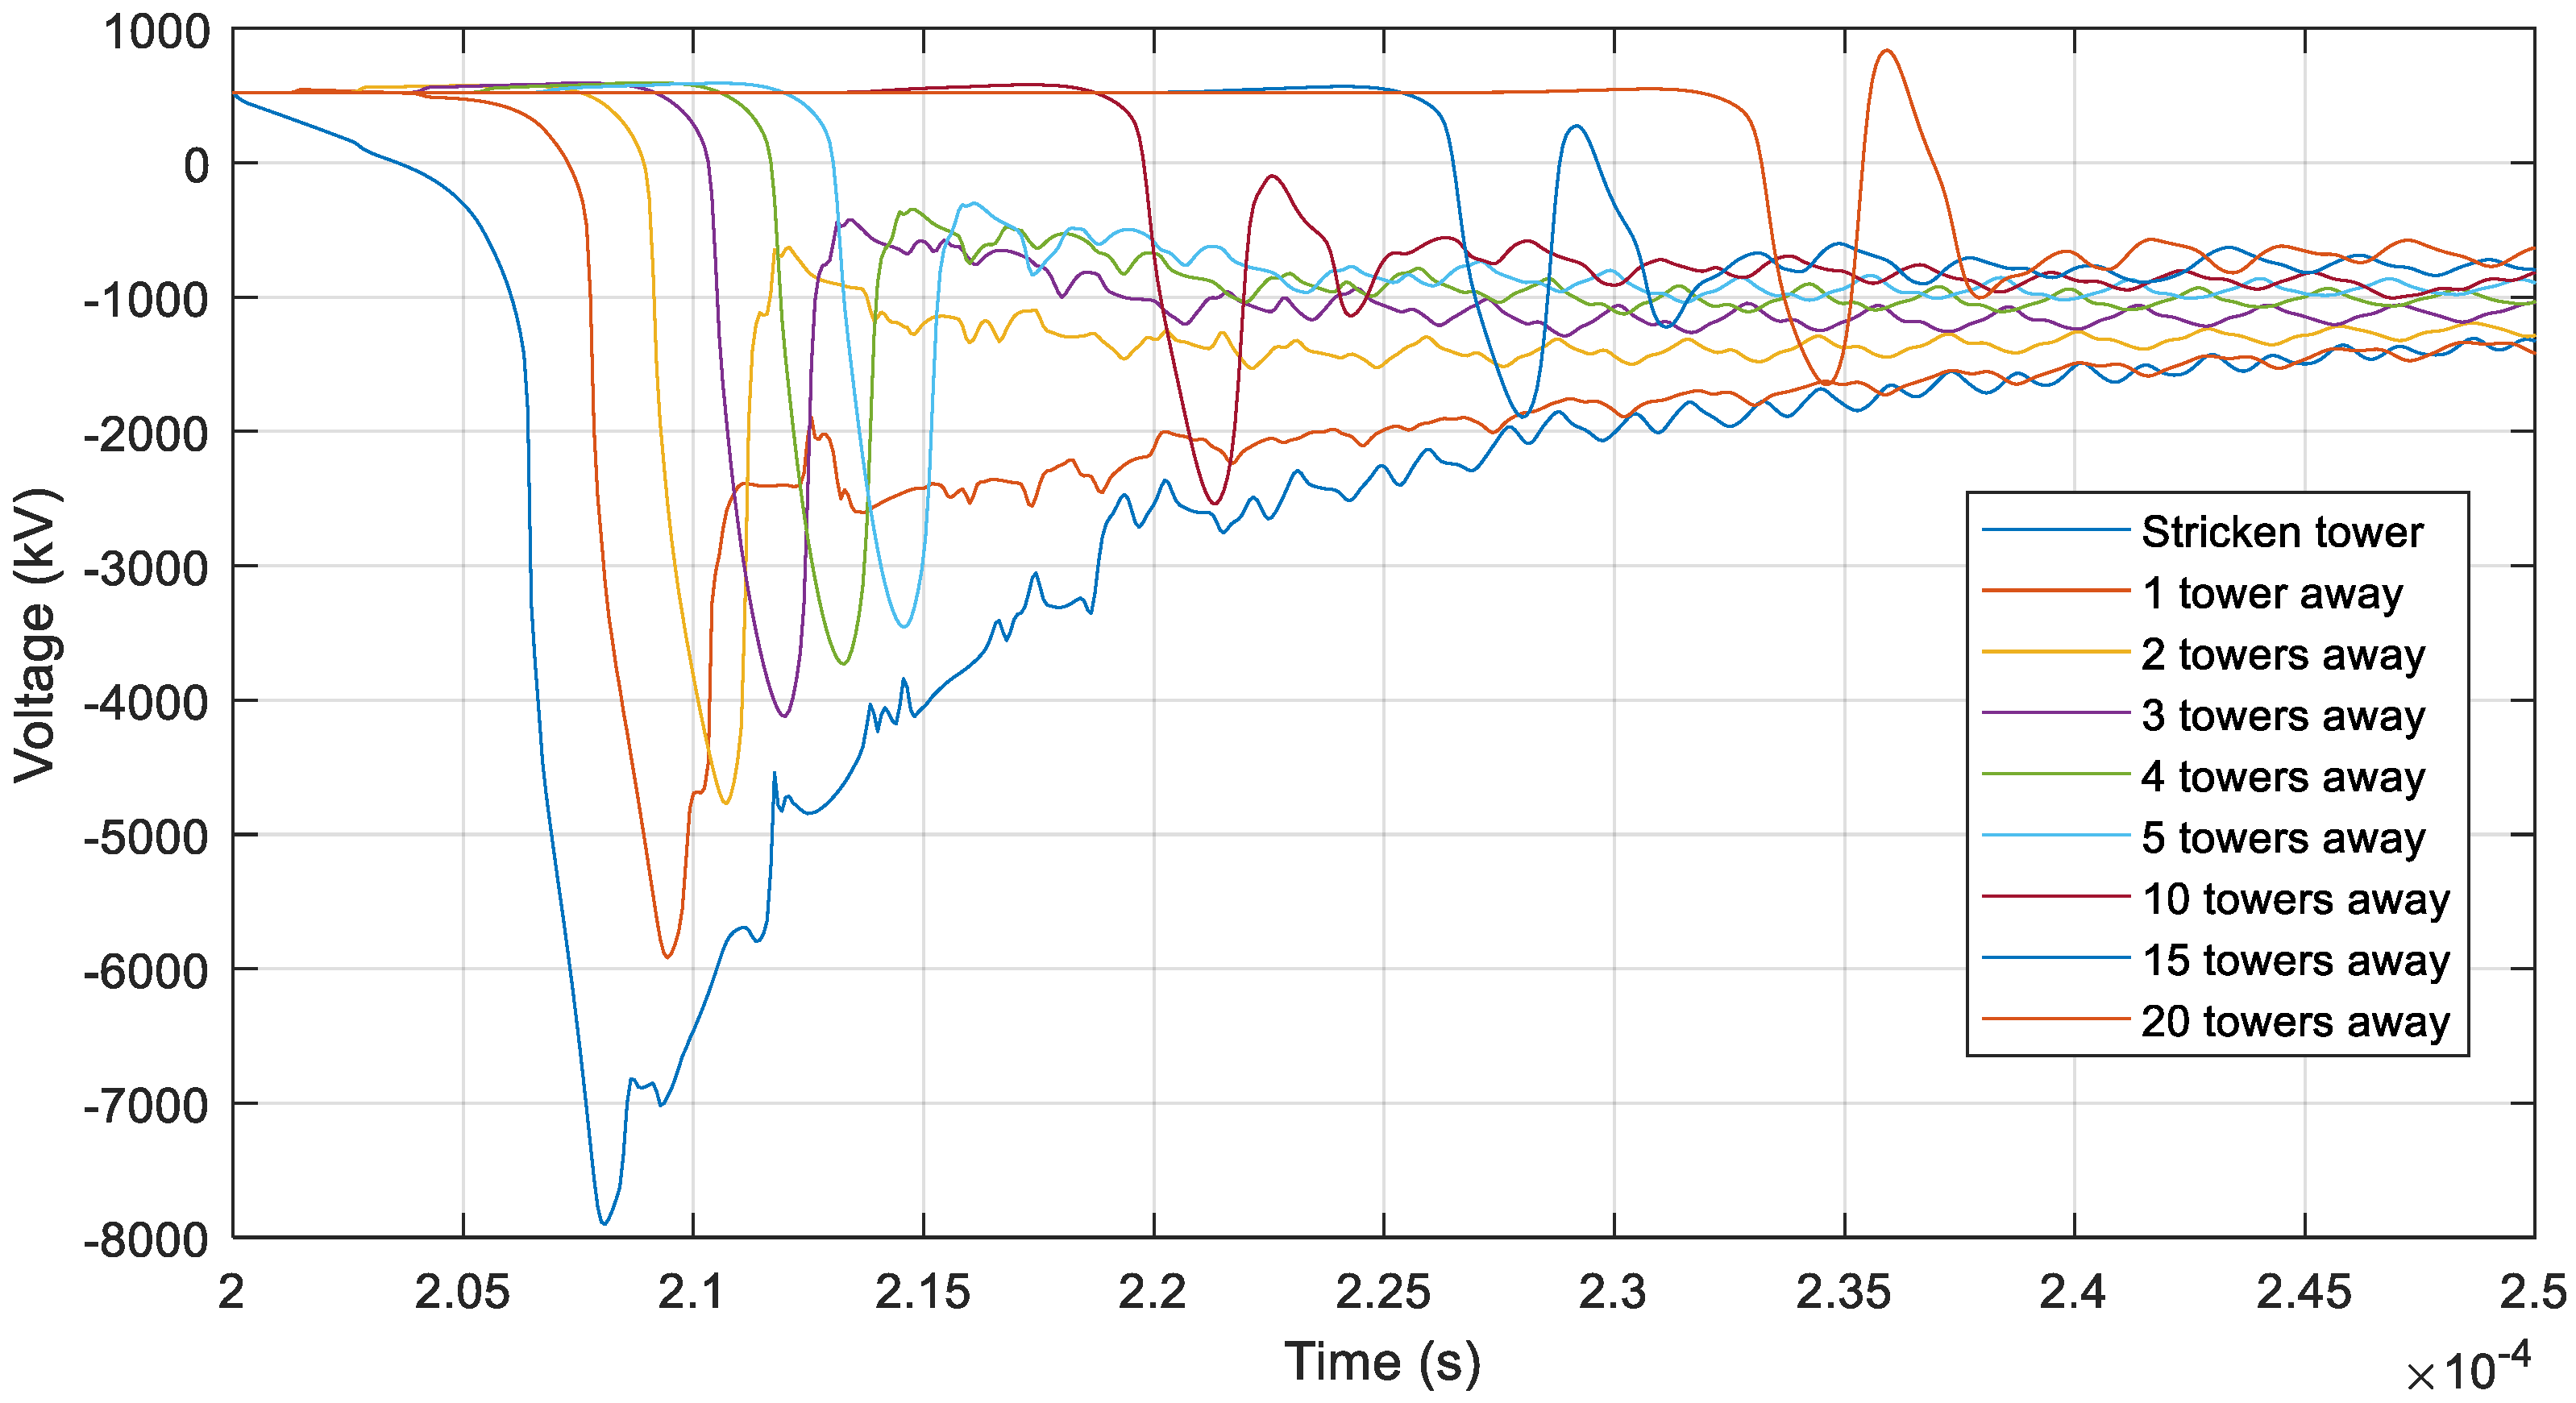
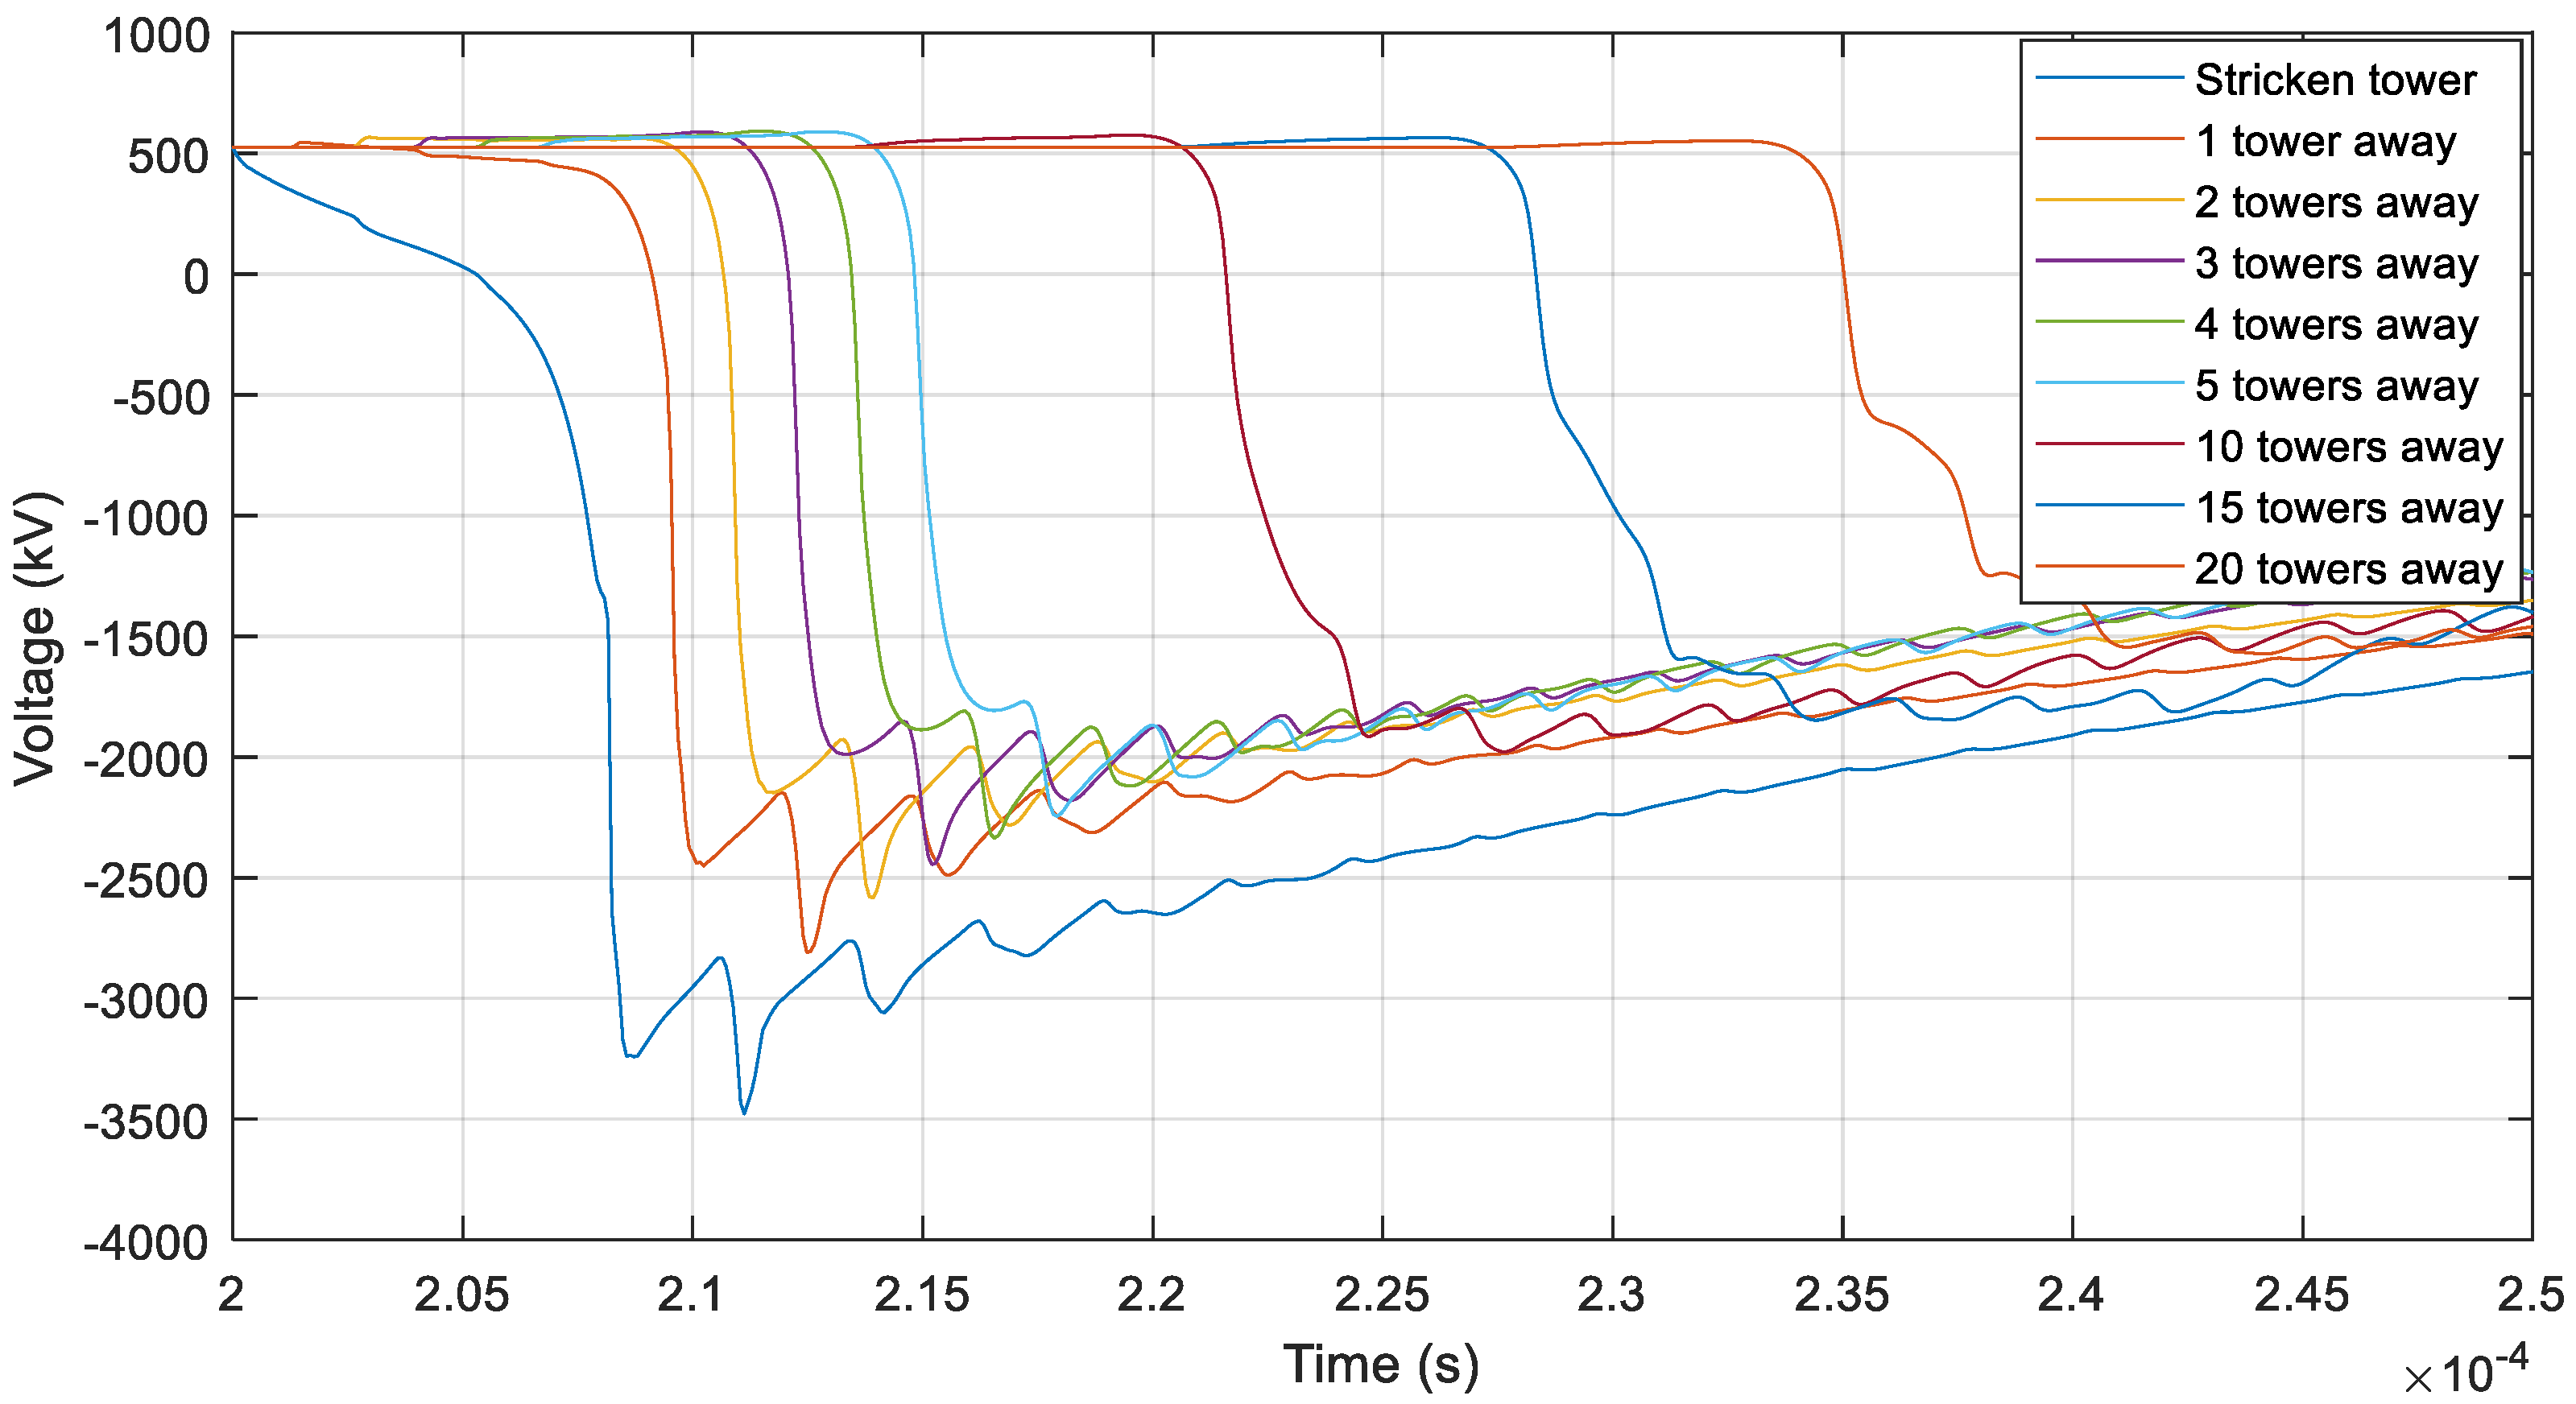
When combining the corona attenuation with the attenuating effect of resistive voltage drops as the overvoltage wave travels down the line, the magnitude
Vscr at a distance
d is given by:
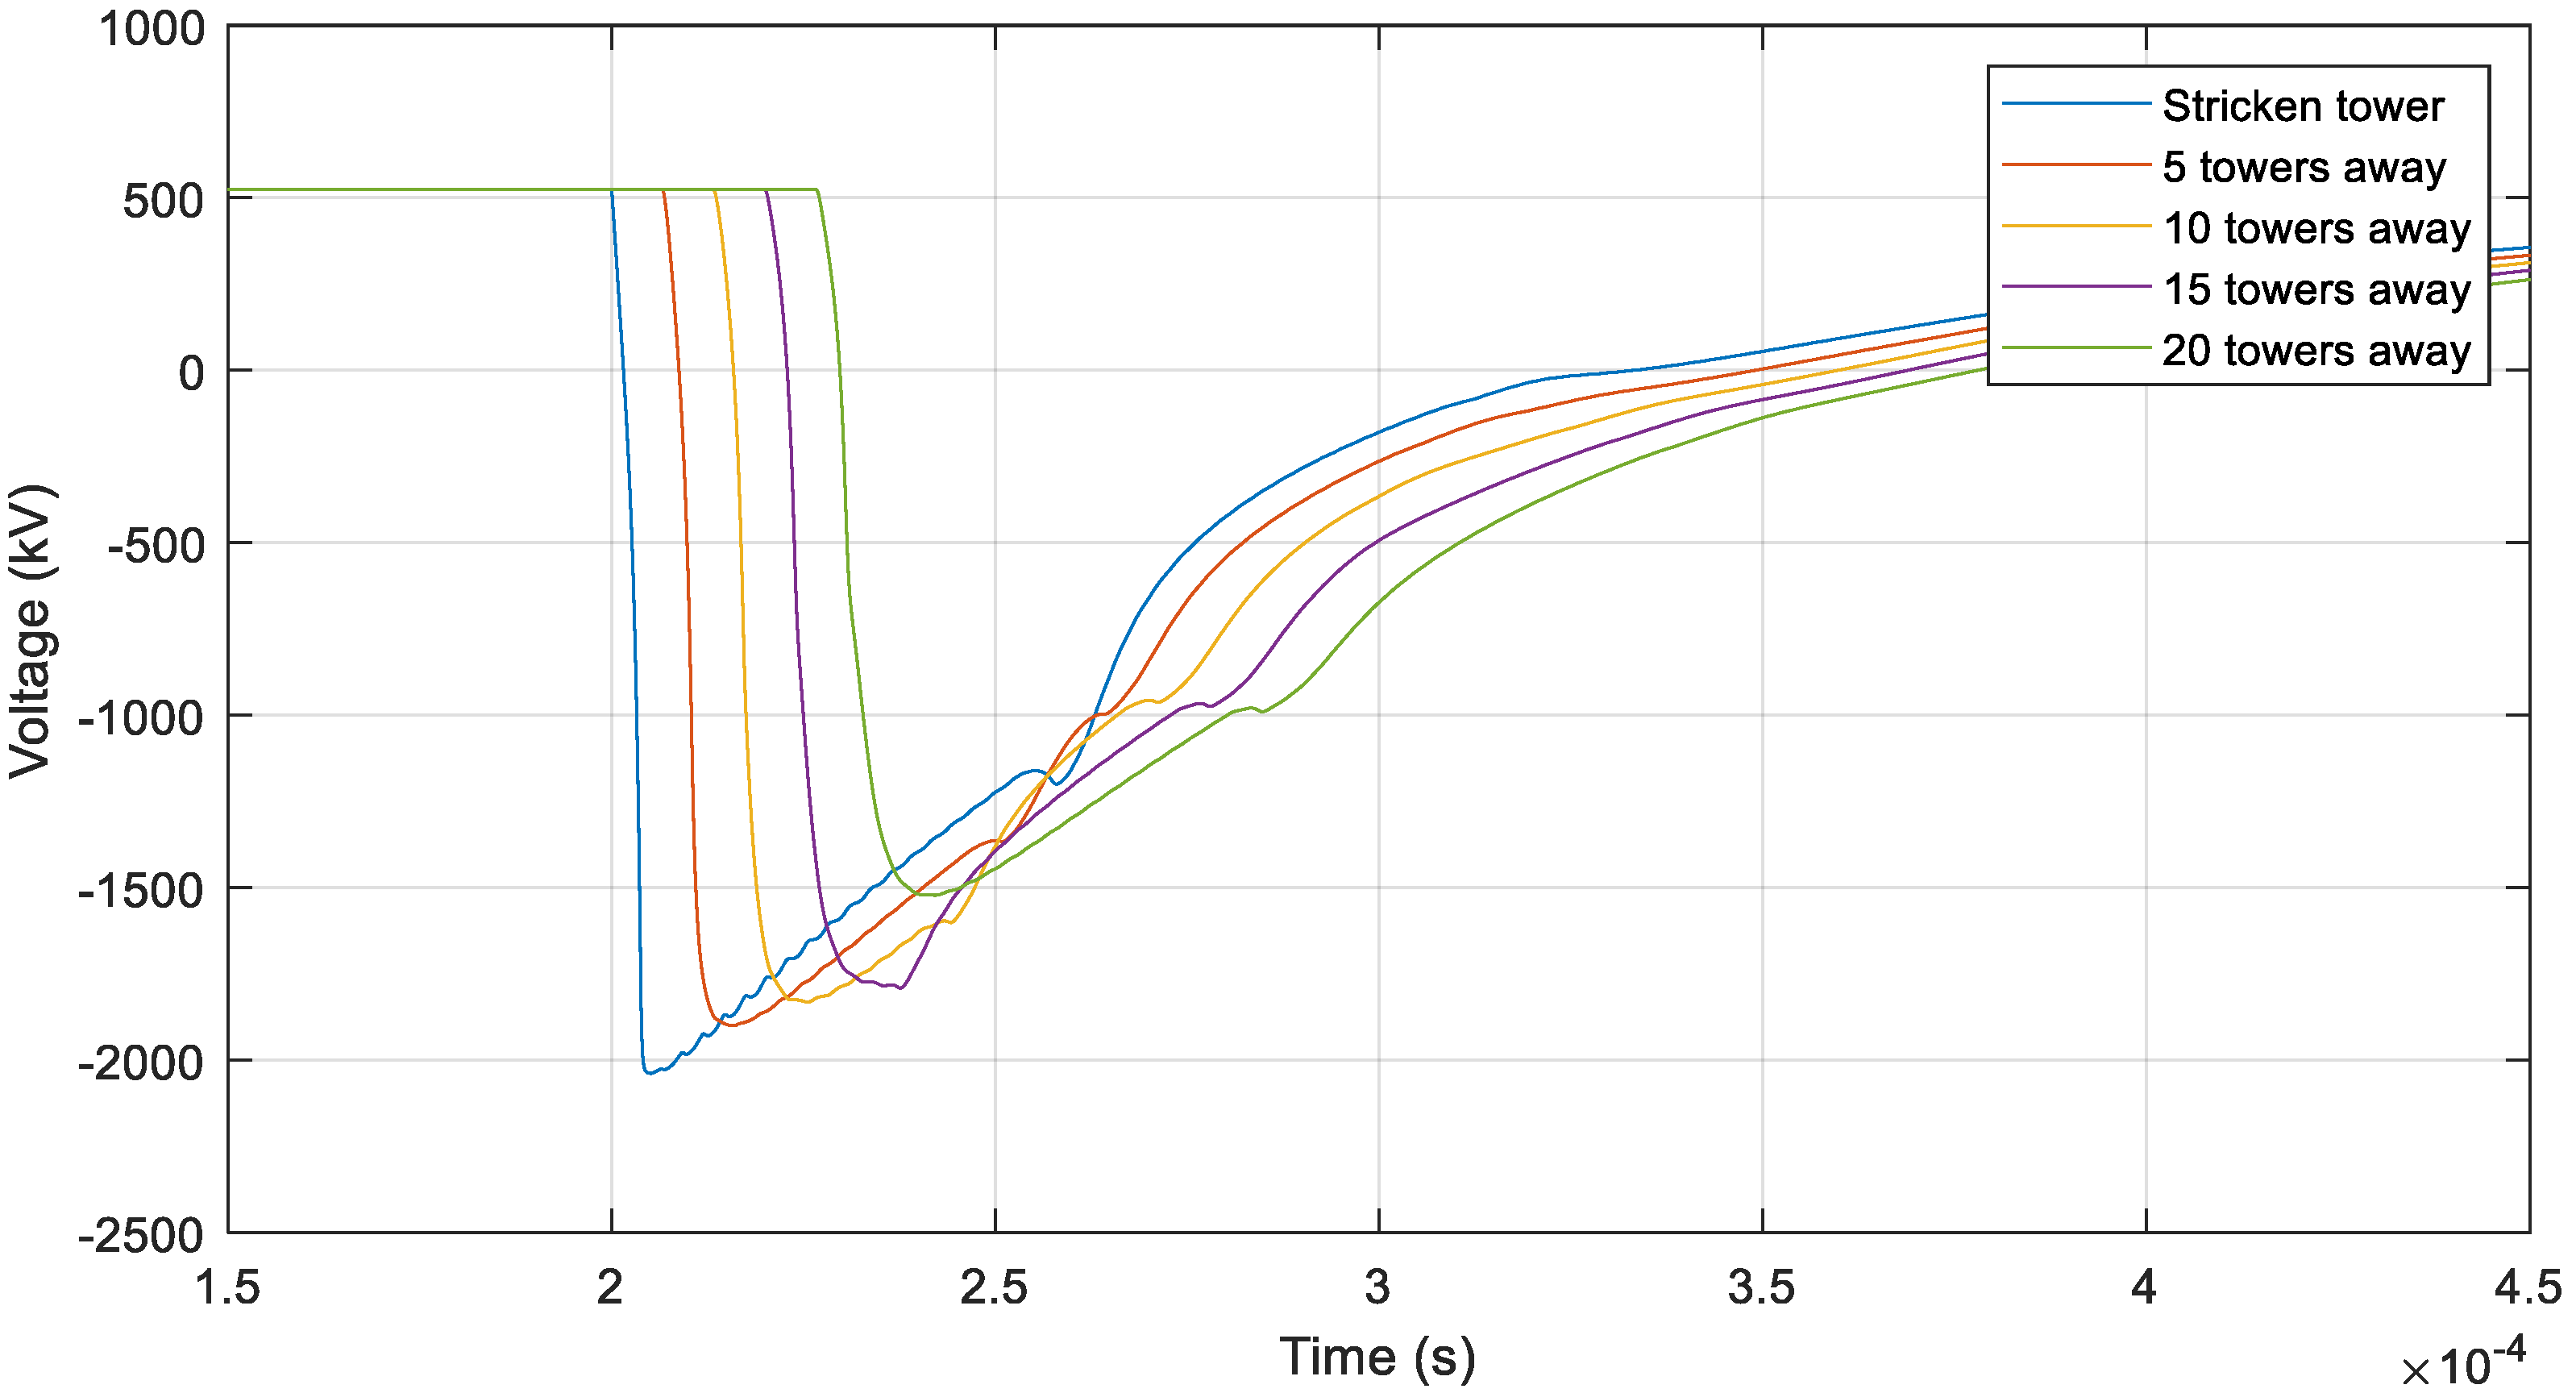
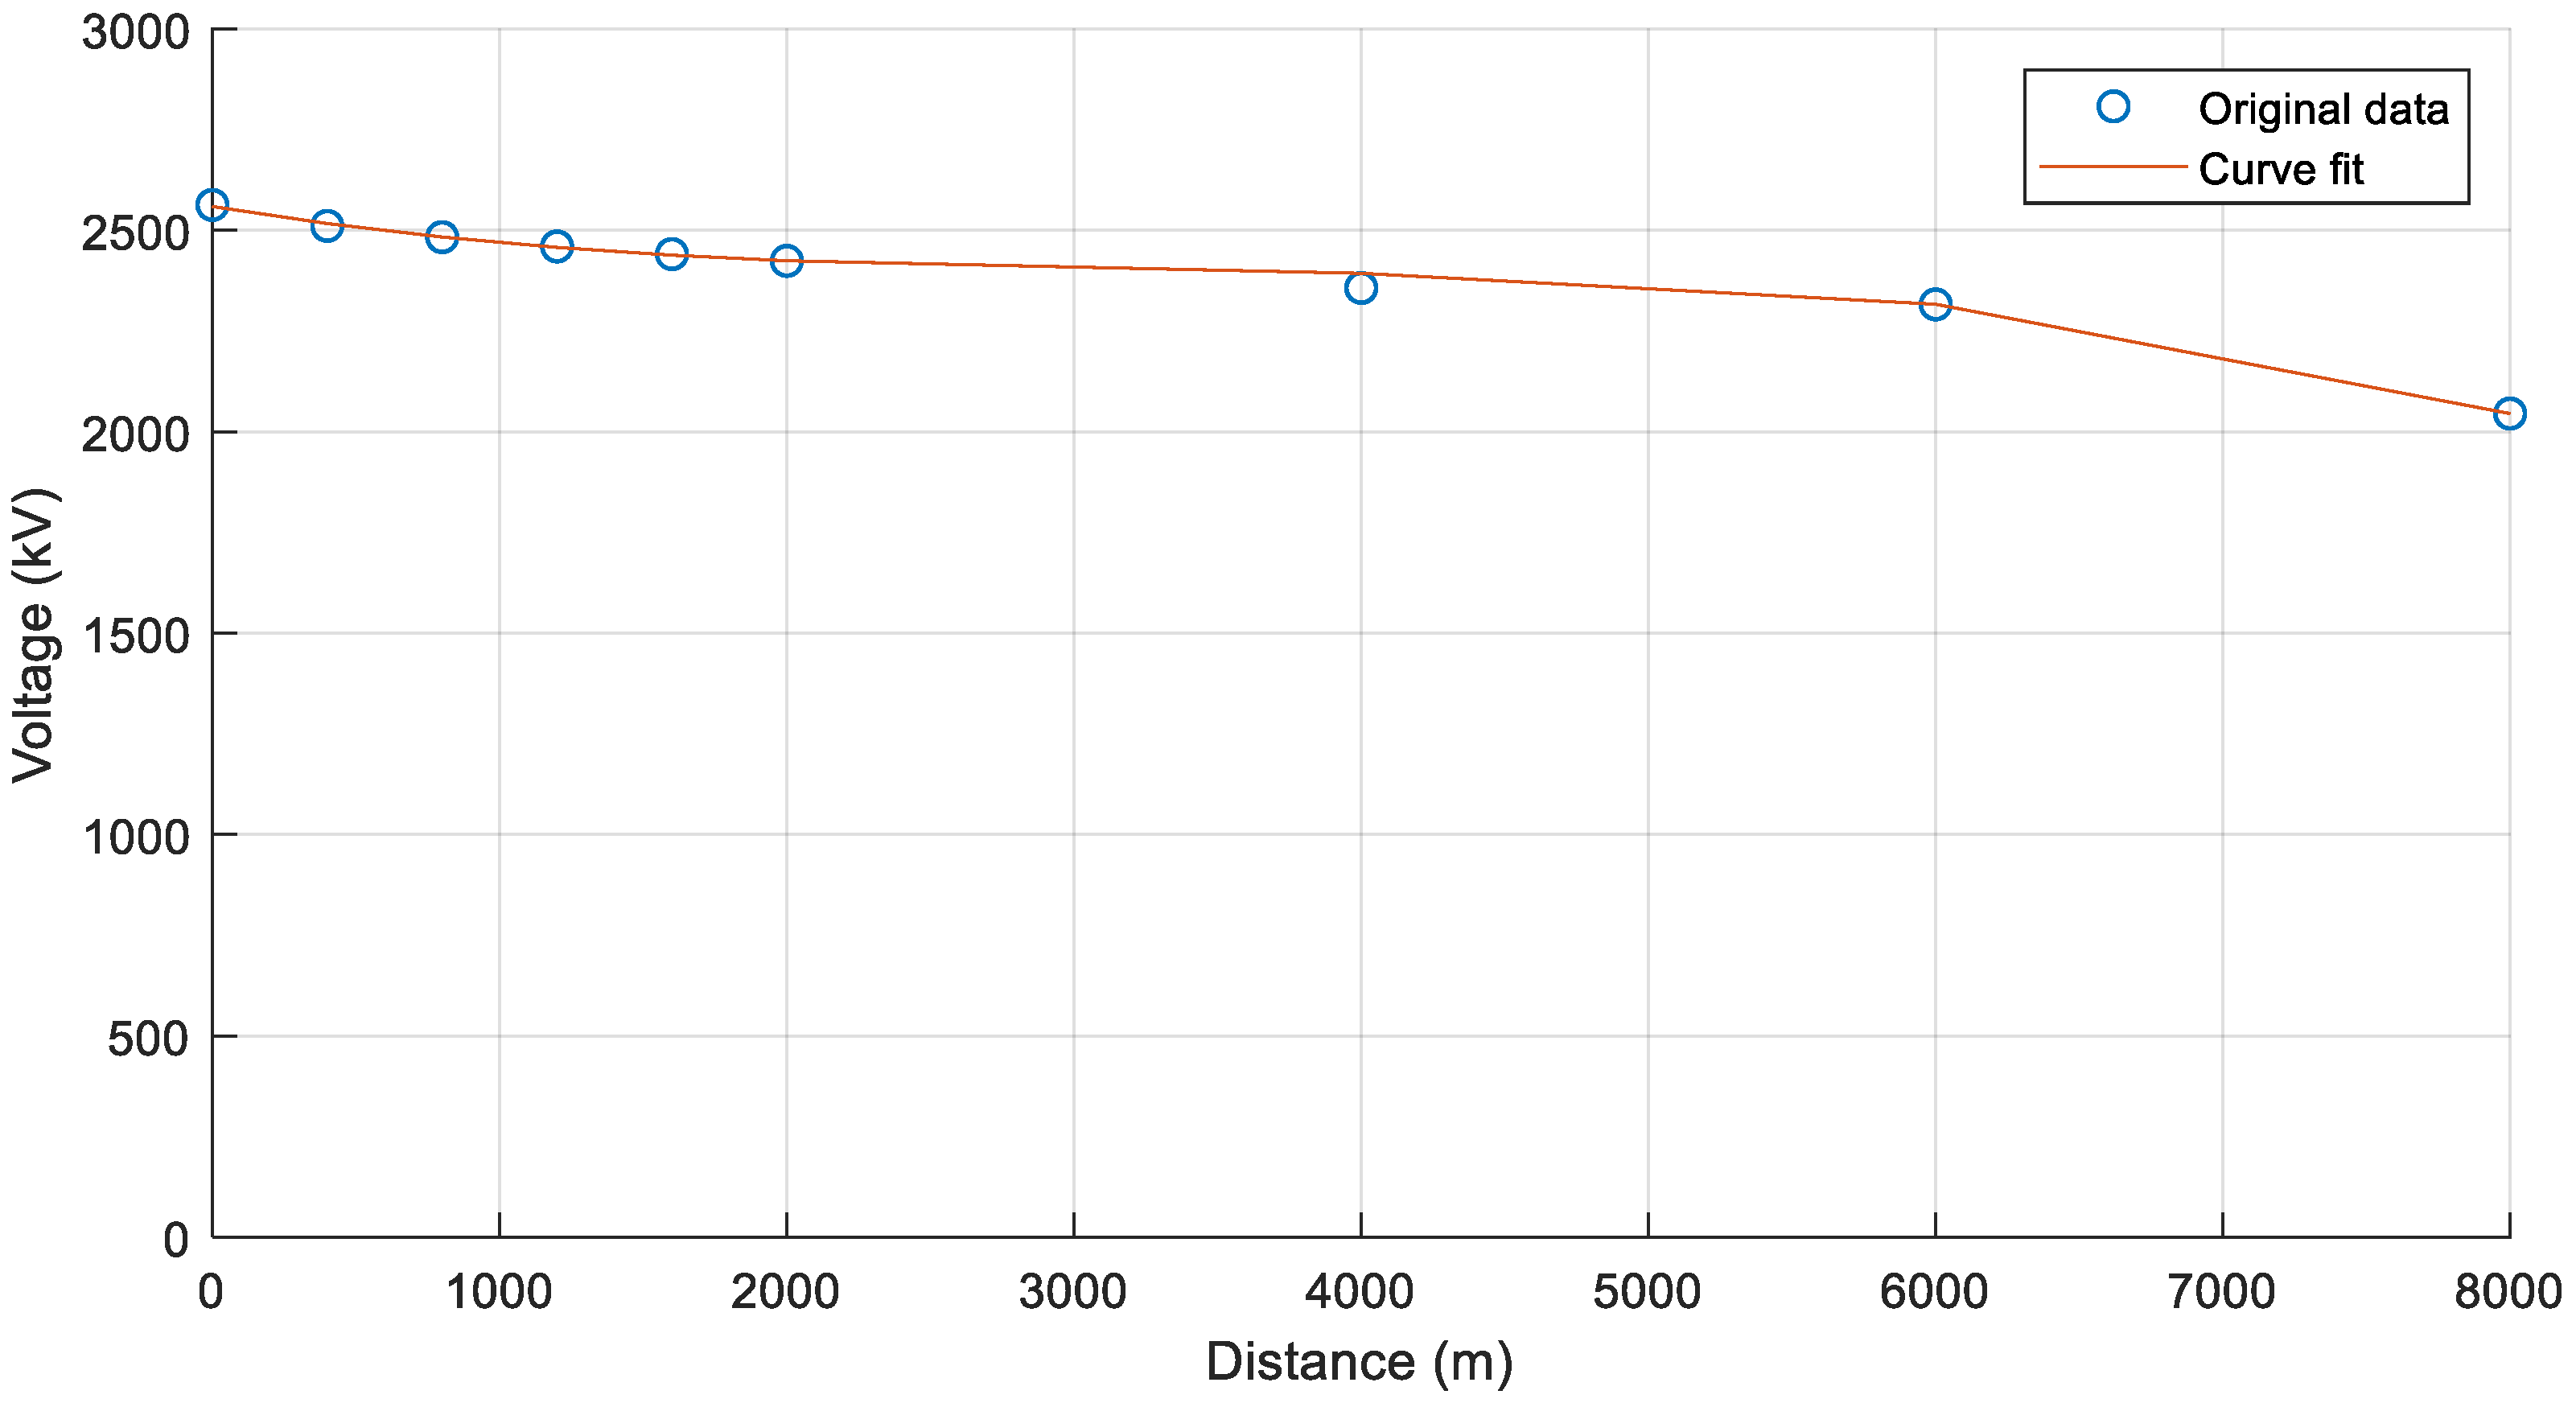
where the function
r(
d) is determined from the transient simulations by studying the overvoltage levels at various tower positions.
The expression for Vscr makes it possible to determine the overvoltage magnitude Vs that is required at the striking point to obtain a certain Vscr value at a certain point on the line. Furthermore, the relation between lightning current and surge voltage magnitudes at the striking point can be used to determine the required lightning current level and the associated probability of exceedance.
The procedure is simplified by assuming that all lightning strikes to a line terminate at a tower position. Hence, the expression for Vscr and the relationship between the lightning current and surge voltage magnitude can be used to determine the lightning current magnitude required at each tower position in order to obtain a certain Vscr value at the transition station.
In order to calculate the accumulated risk of exceeding a certain
Vscr, it is required to consider lightning strikes at any tower along the line that produce the same
Vscr at the transition station. In this way, a corresponding set of lightning current magnitudes is obtained for a given
Vscr. Considering the statistical distribution of lightning current magnitudes [
7], the associated probabilities can be accumulated in order to obtain the total risk of exceeding
Vscr.
Further, by accounting for the annual number of lightning strikes to shield wires or pole conductors, the established set of lightning currents can be associated with a statistical return period, expressed as a mean time between surges (MTBS). Thus, by iterating the Vscr level until the MTBS equals the acceptable MTBF of the cable system, a resulting set of lightning currents is obtained which can be used to calculate representative lightning overvoltage levels in the cable system.
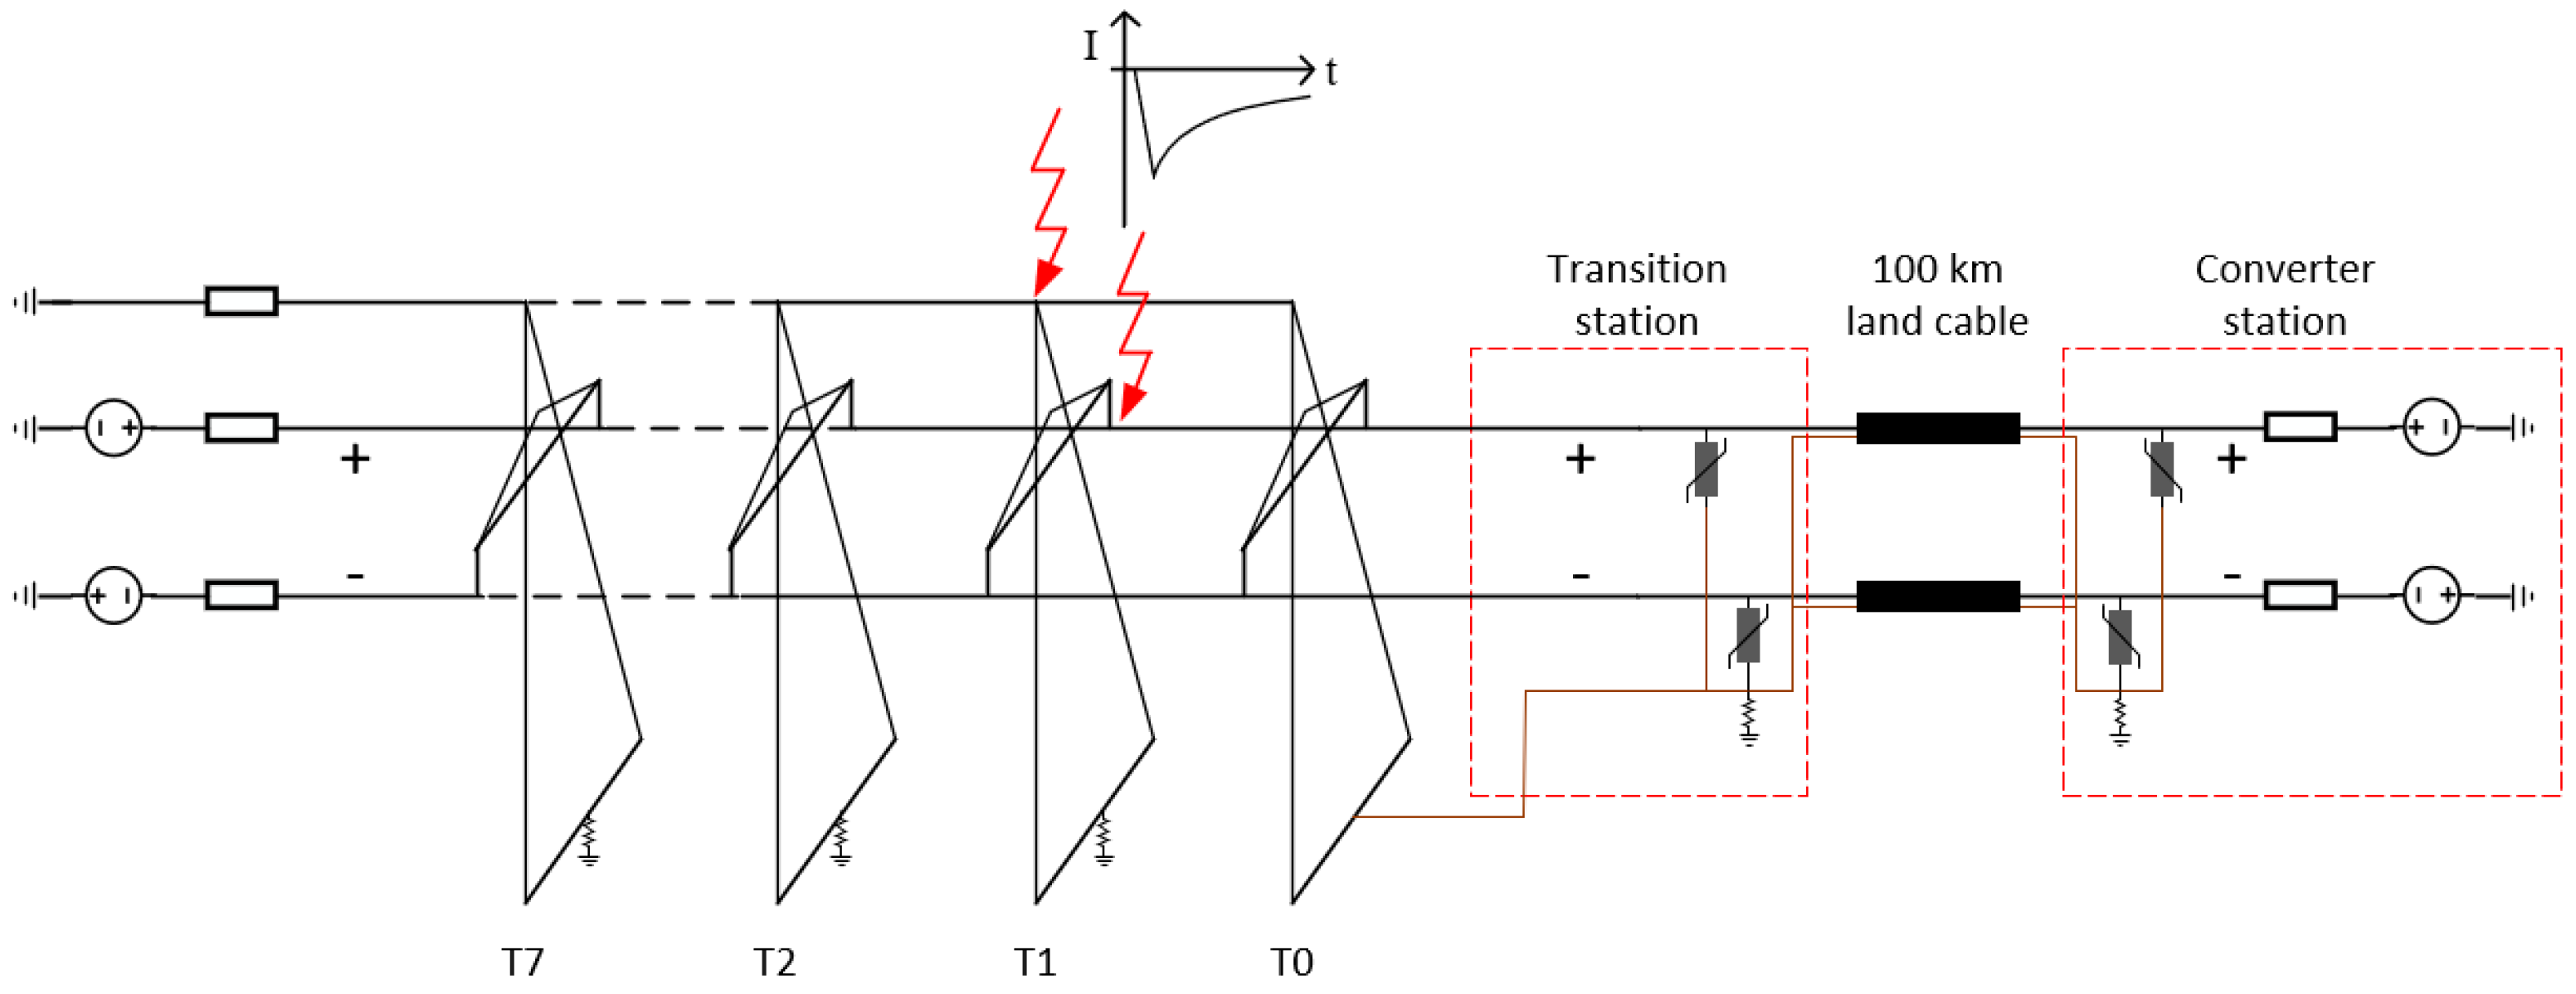
Step 3: Determination of representative lightning overvoltage levels in the cable system. Each lightning current in the set will produce the same Vscr at the transition station when injected at the respective tower. However, to minimize the effect of not considering corona attenuation in the simulation model, the lightning current is preferably injected at the first tower outside the transition station when calculating overvoltages in the cable system.
The improved statistical method described above may be applied to backflashovers as well as shielding failures. Special considerations for the two different applications are discussed below.
2.1. Backflashovers
Backflashovers on overhead lines are treated in detail in reference [
8], therefore, only the special considerations regarding DC lines are discussed here.
When lightning strikes a shield wire on a DC line, the towers take on a negative or positive transient voltage depending on the polarity of the lightning flash. This may lead to high overvoltages across the line insulators, primarily at the stricken tower and especially across insulators for the pole conductor of opposite polarity. The risk of backflashover depends primarily on the ground flash density, the lightning stroke current magnitude, and the grounding resistance of the towers.
For backflashovers, the annual number of lightning strikes to a 100 km line may be estimated using the expression below [
8]:
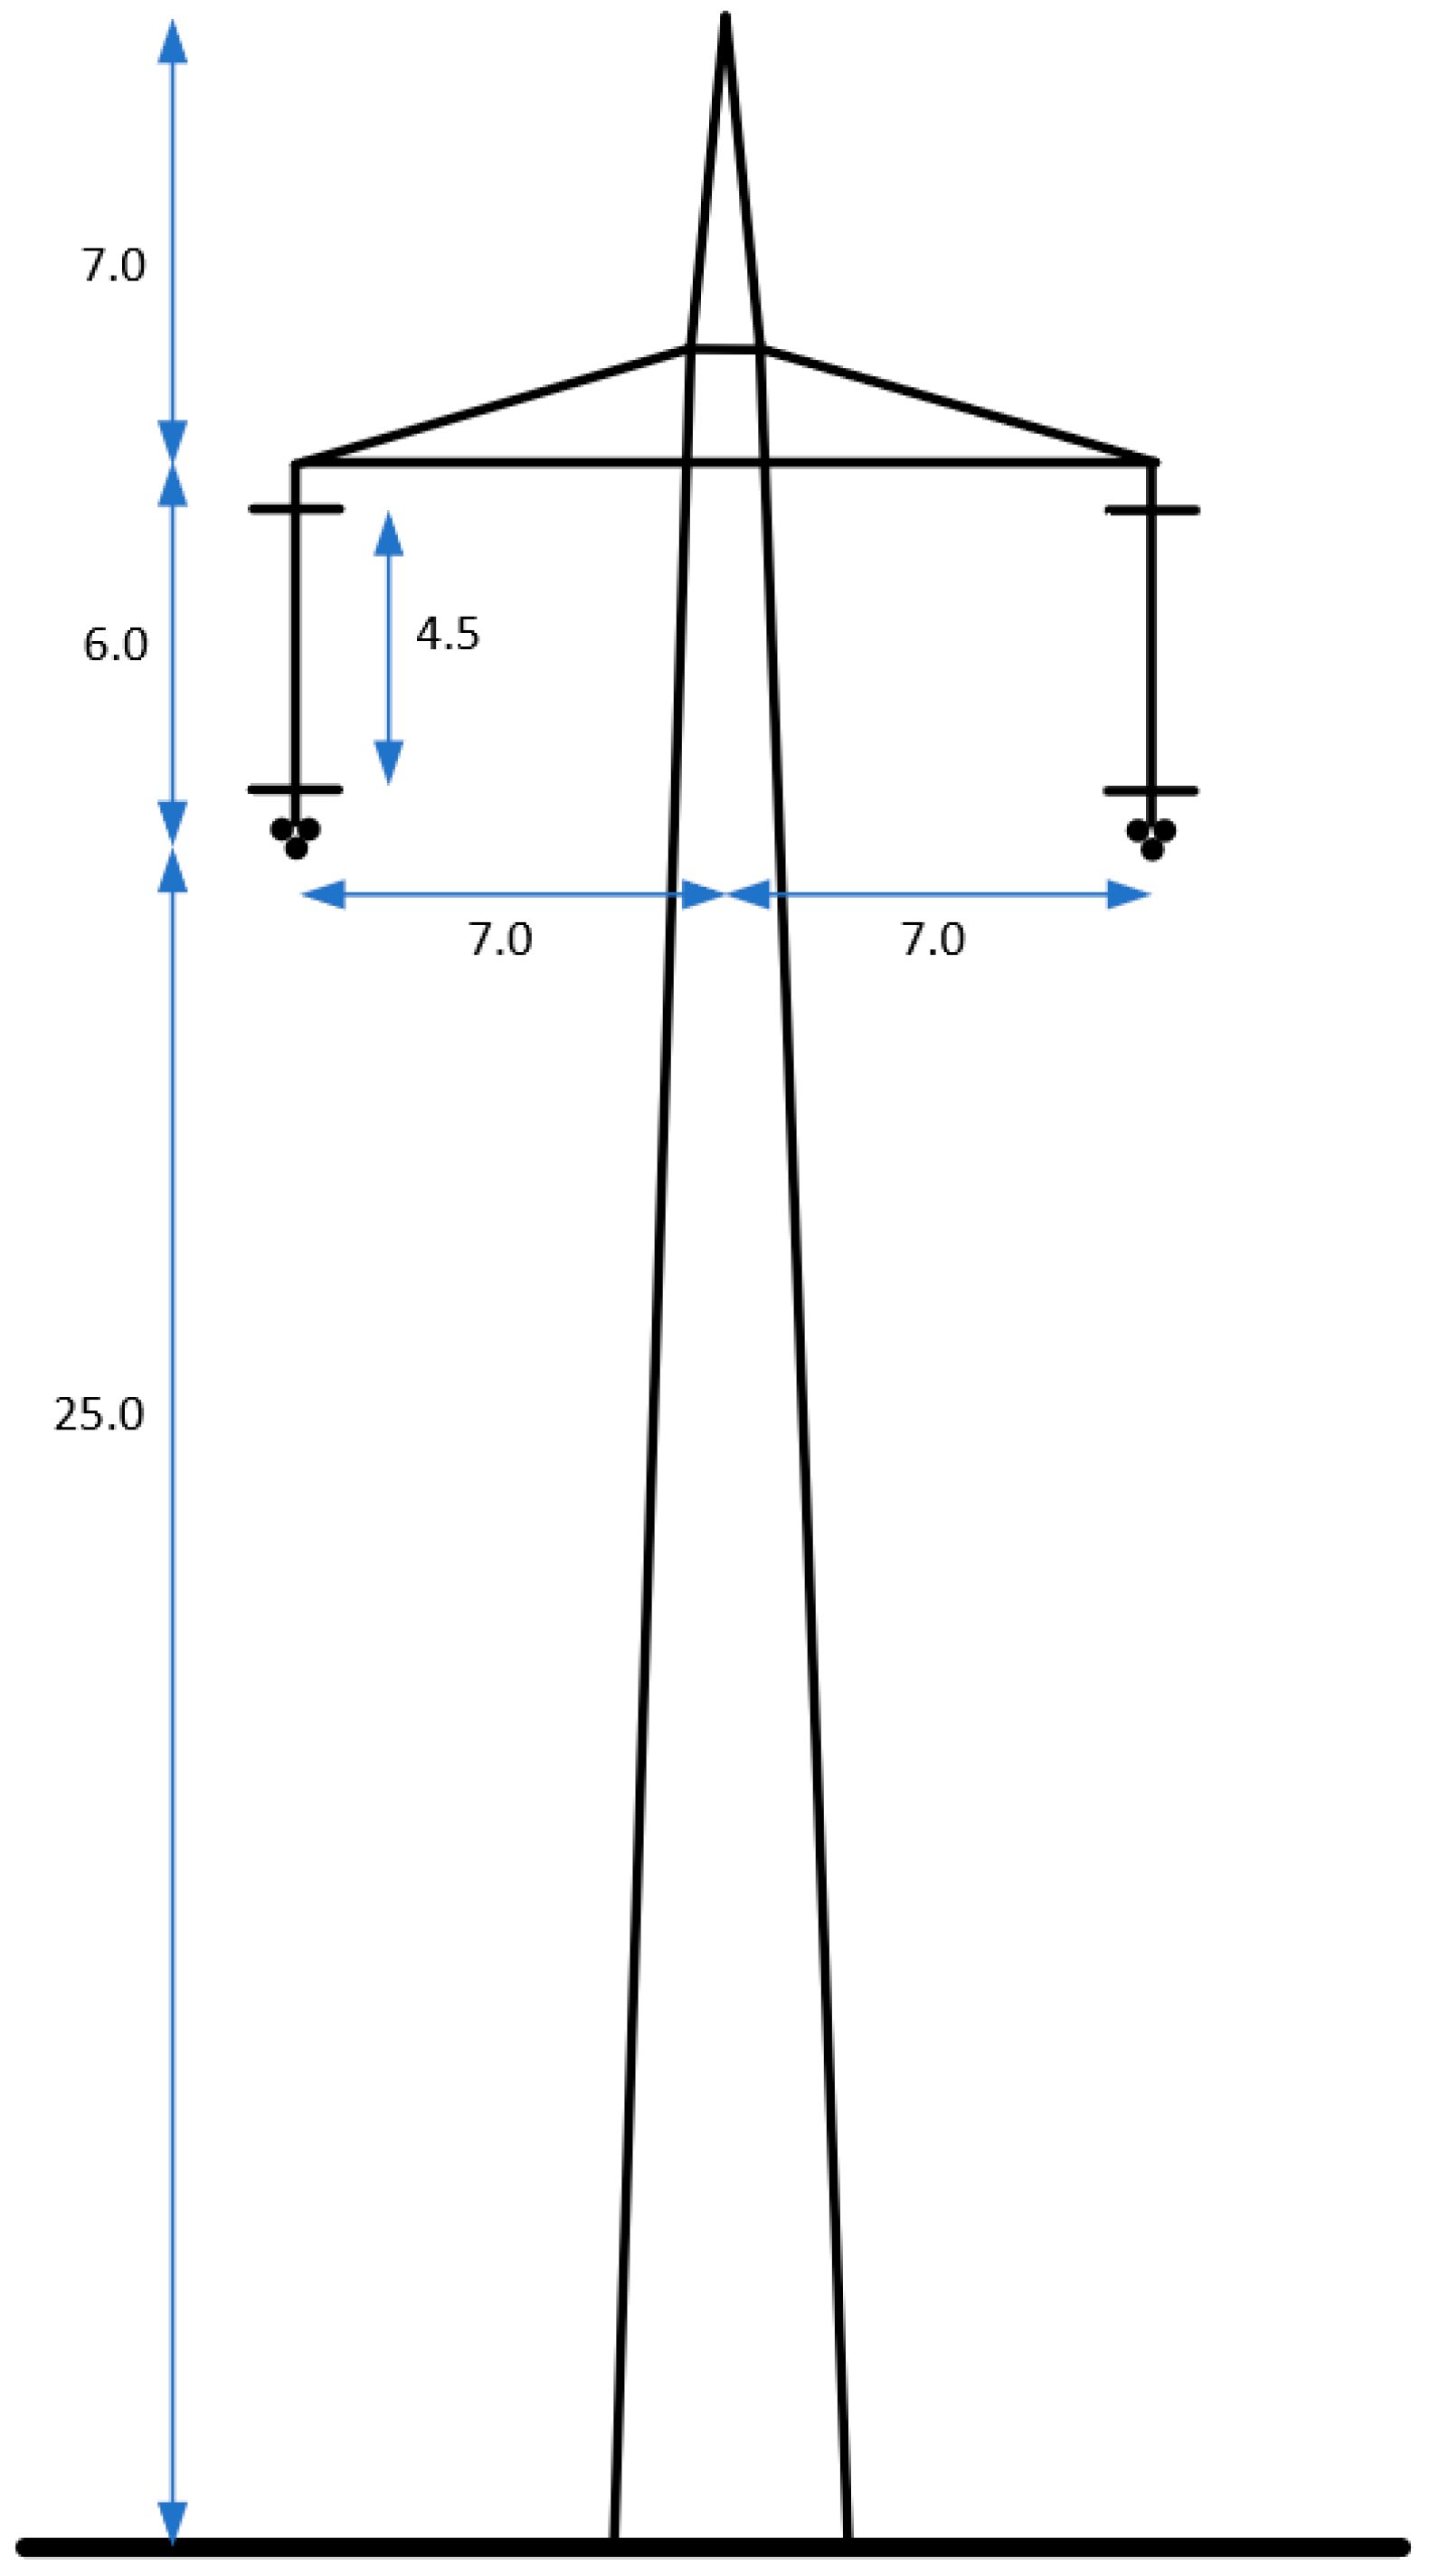
where
Ng (flashes/km
2/year) is the ground flash density,
H (in meters) is the tower height and
Sg (in meters) is the separation distance of the shield wires (
Sg = 0 for a single shield wire).
2.2. Shielding Failures
Lightning strikes may bypass the shield wire and terminate directly onto the pole conductor, referred to as a shielding failure. The shielding properties of the line are analyzed by considering the presence and position of the shield wires with respect to the pole conductors. The important parameters are the critical current and the maximum penetration current: the critical current is the maximum lightning current that can be injected into the pole conductors without flashover of the line insulation, and the maximum penetrating current is the maximum current that can possibly terminate on the pole conductors. If the maximum penetrating current exceeds the critical current, then flashover of the line insulation can occur, thereby limiting the magnitude of the incoming surge to the cable system.
The critical current depends on the lightning overvoltage withstand strength of the line insulators and the surge impedance of the pole conductor. Near the transition station, the critical current is also affected by the presence of the cable system, which is characterized by its low surge impedance. Tower grounding has no effect on the critical current, since it is assumed that no flashover occurs.
The maximum penetrating current, on the other hand, depends on the lightning attachment properties of the shield wire(s) and pole conductors. Recent findings indicate that not only the positions of shield wires and pole conductors, but also the instantaneous value and the polarity of the operating voltage are important to the shielding properties [
9,
10].
In the present study, the lightning attachment properties are evaluated by means of the leader progression model (LPM) [
9] as implemented in reference [
11] and reference [
12]. The simplified approach [
12], originally developed for AC lines, is applied to the DC line in the present study by setting the instantaneous voltage of the pole conductors to be equal to the positive or negative DC operating voltage (±525 kV).
5. Discussion
5.1. Backflashovers
The statistical calculation for backflashovers, without considering soil ionization, shows that overvoltages in the cable system, having an MTBS of 300 years, should be calculated for a current magnitude of 182 kA injected to the first tower outside the transition station. It can be noted that, although the current level depends on the ground flash density, grounding conditions and overhead line design chosen for the case study, the value is within the range of currents commonly used in deterministic studies, i.e., 150–250 kA.
As shown in
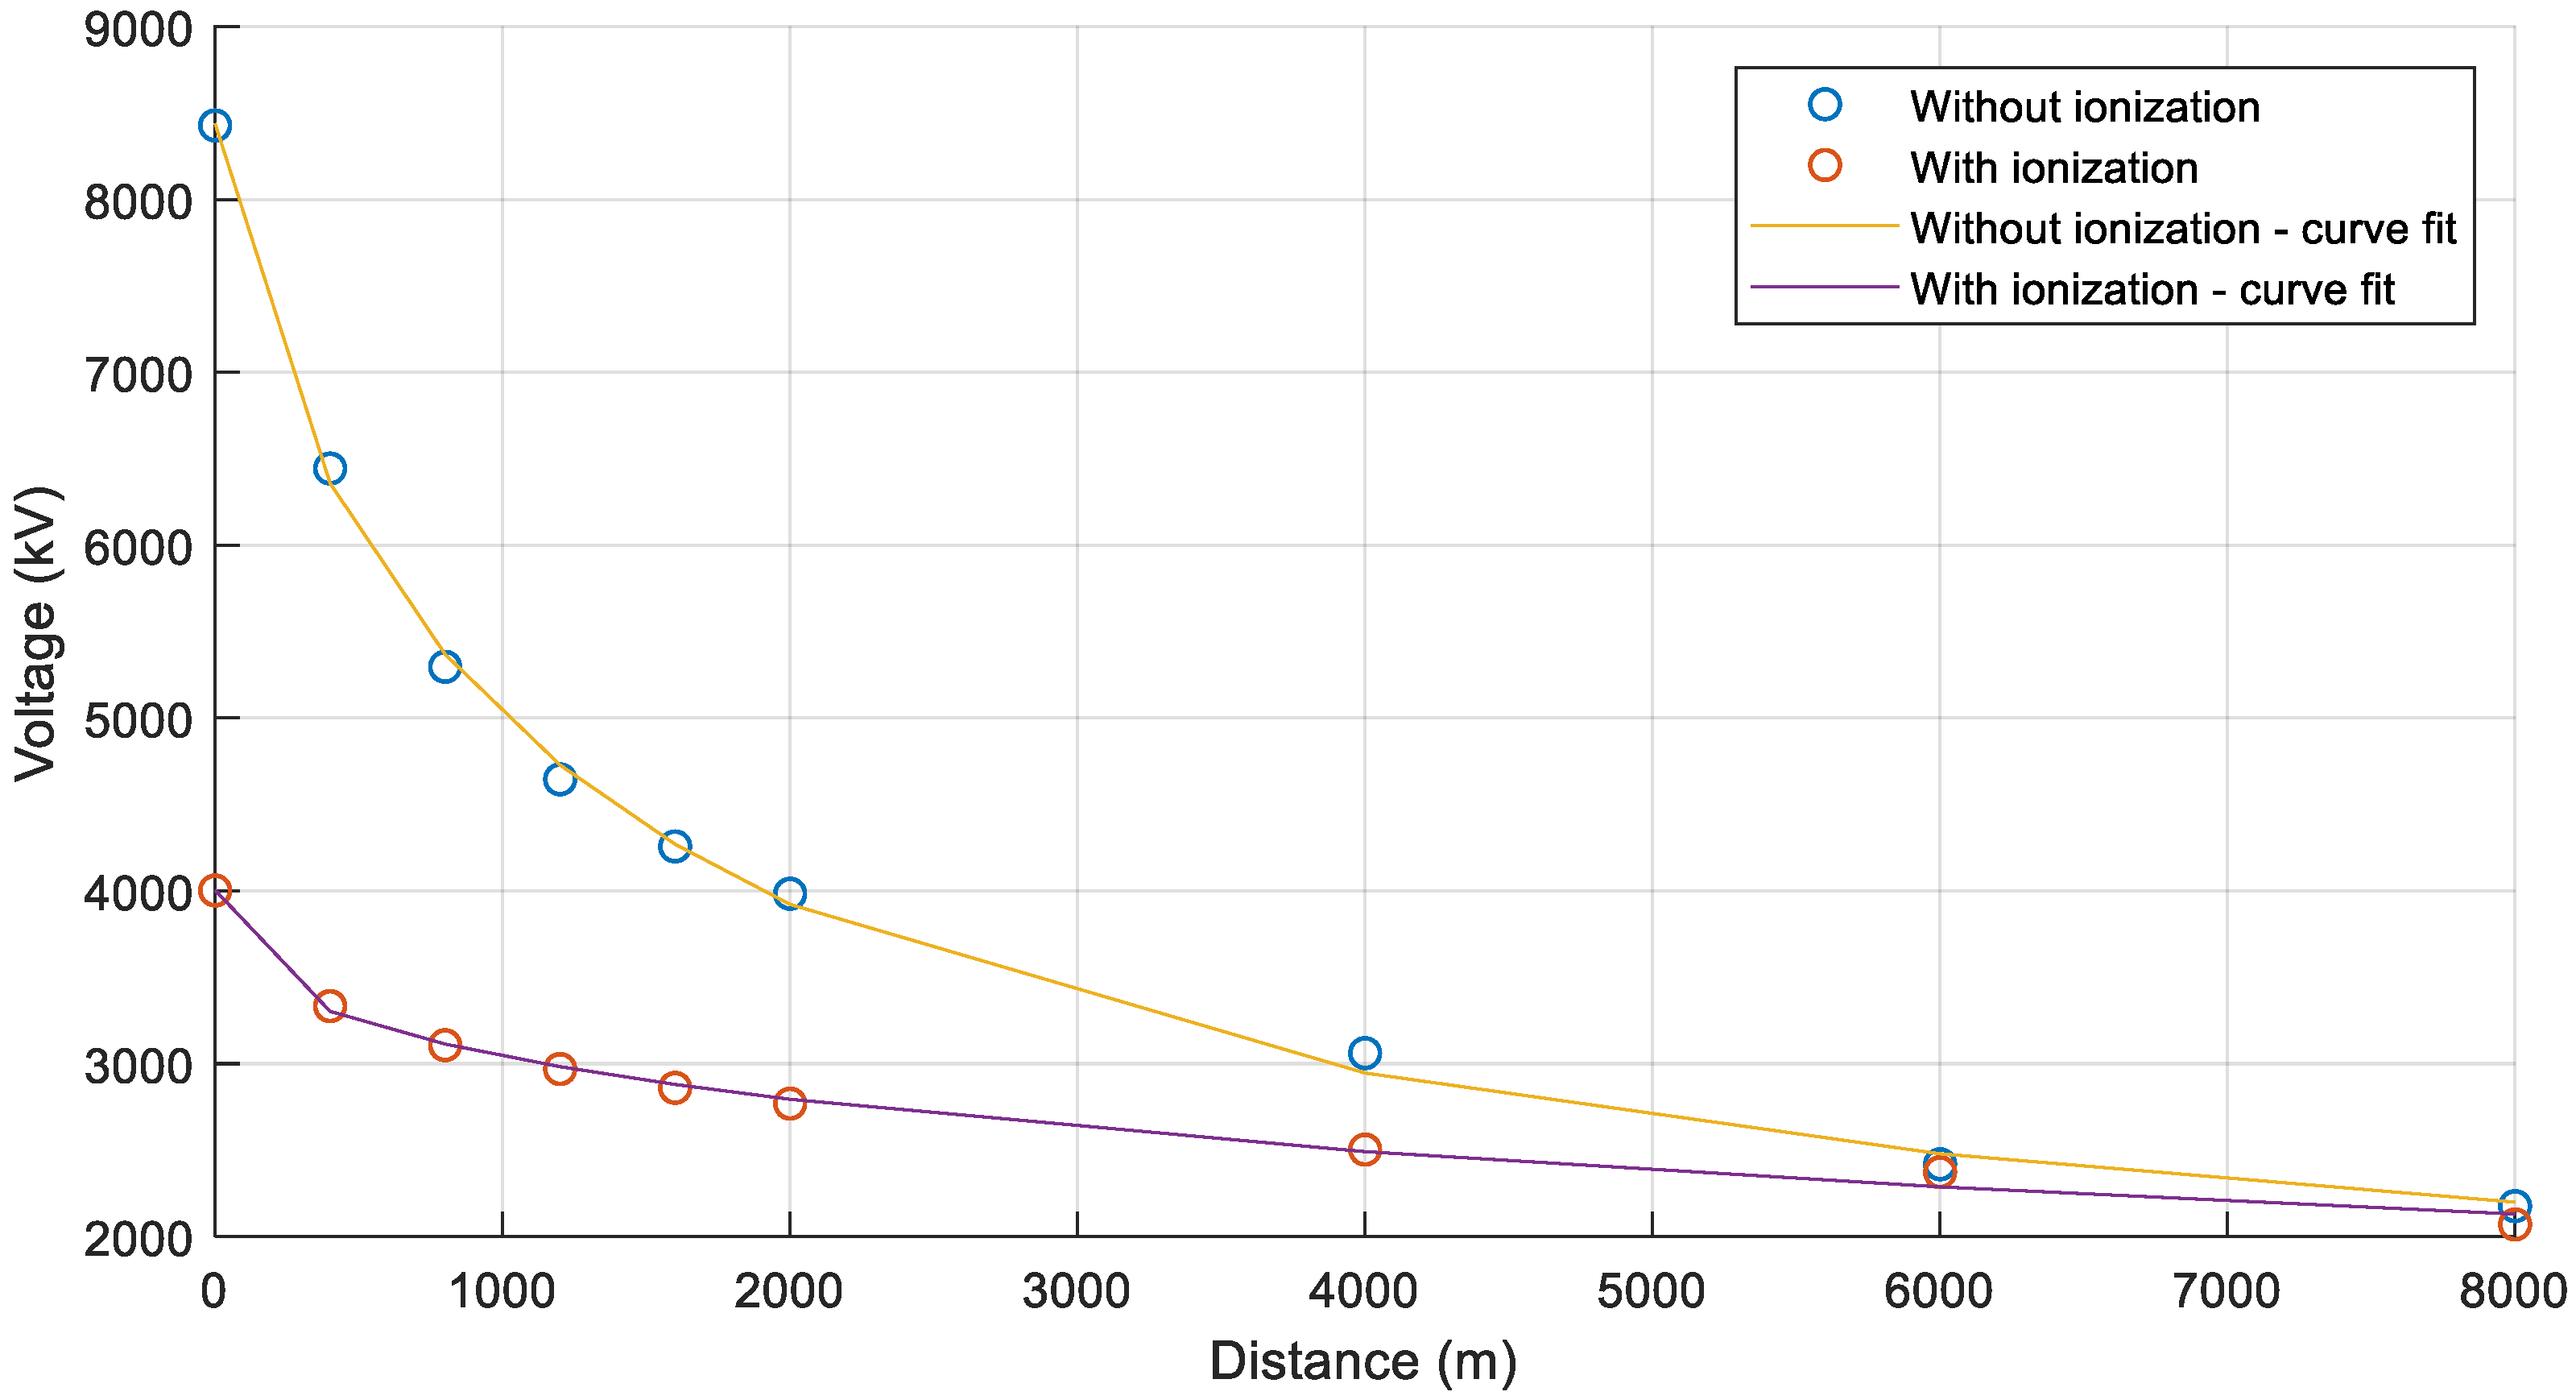
Table 5, consideration of soil ionization results in an increased MTBS (from 300 to about 760 years) for the same overvoltage stress as without ionization. Thus, simulations without considering soil ionization will give conservative results in terms of MTBS.
Furthermore, the introduction of the resistive attenuation factor impacts the results in a significant way. Calculations have shown that by neglecting the resistive attenuation, the corresponding current to be injected into the first tower outside the transition station increases from 182 to 210 kA for the same MTBS. Thus, the calculated overvoltage levels in the cable system will be conservative if the resistive attenuation factor is not considered.
It is important to verify that the current used for the cable overvoltage calculations will cause a backflashover on the line. If the calculation results show that the current level for tower no. 1 is not high enough to cause backflashover when injected at the first tower outside the transition station, it indicates that the selected MTBS is exceeded, i.e., above 300 years in the present case. In such a case, to facilitate a comparison with overvoltages caused by shielding failures, it is suggested to repeat the calculations using a higher MTBS, until the current level for tower no. 1 is high enough to cause backflashover.
For the present case study,
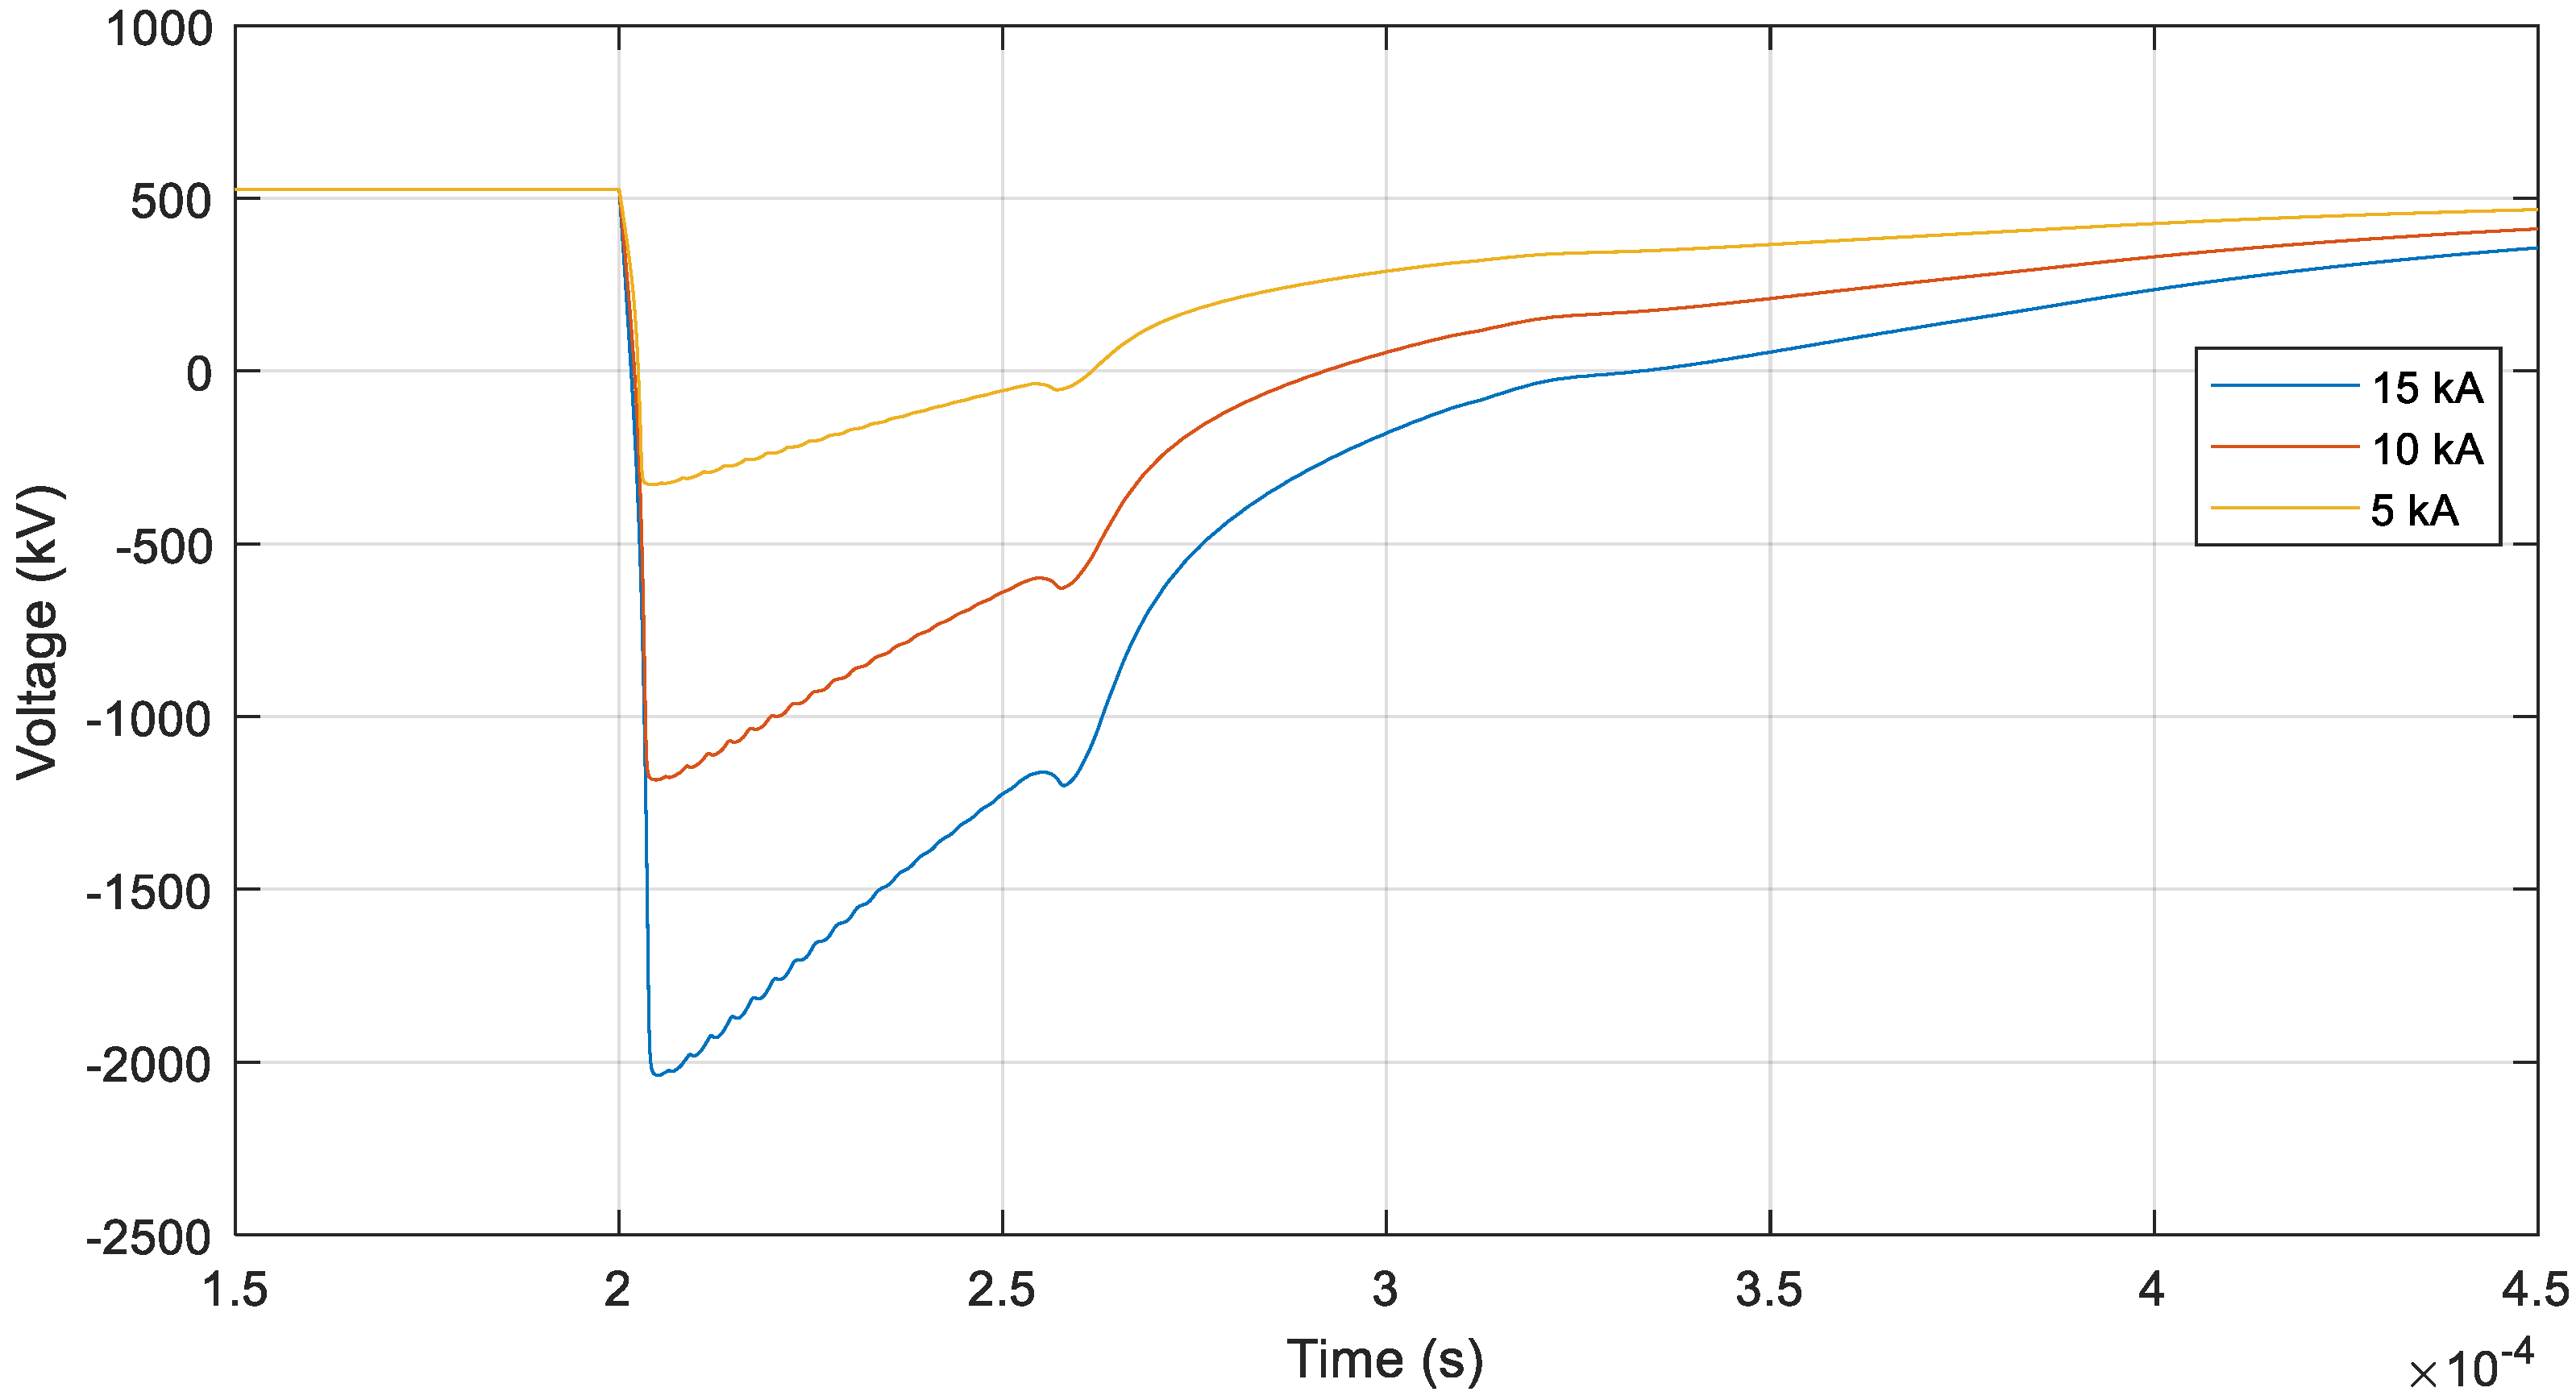
Figure 14 shows that 182 kA is a sufficiently large current to cause backflashover on the line. Furthermore, the results show that the maximum negative and positive overvoltage levels are −631 kV at the transition station and +692 kV at the remote end. However, it should be noted that the latter value will be affected by the response of the converter control system. No such response is being considered for this case study, while different actions by the control system are possible in practice.
5.2. Shielding Failures
The statistical calculation for shielding failures shows that overvoltages in the cable system, having the same MTBS as for backflashovers, i.e., 300 years in the present case, should be calculated for a current magnitude of 19 kA injected to the positive pole conductor at the first tower outside the transition station. Note that any changes in MTBS for backflashovers, as discussed in the previous section, must be reflected in the shielding failure calculations in order to achieve statistically comparable results.
Only towers for which the required lightning current is below the maximum penetrating current, i.e., 25 kA, should be included in the accumulated risk, in this case all towers up to no. 17. This is because shielding failures occurring beyond tower no. 17 will produce lower overvoltages at the transition station due to the combination of wave attenuation and the 25 kA current limitation.
It is important to verify that the current used for the cable overvoltage calculations will not cause flashover on the line, i.e., exceed the critical current, since this may limit the overvoltages in the cable system as discussed in
Section 2.2. If the calculation results show that the current level is high enough to cause flashover, it is suggested to carry out calculations also for a current level just below the critical value. The highest overvoltages obtained from the two studies are then used for comparison with the results of the backflashover calculations.
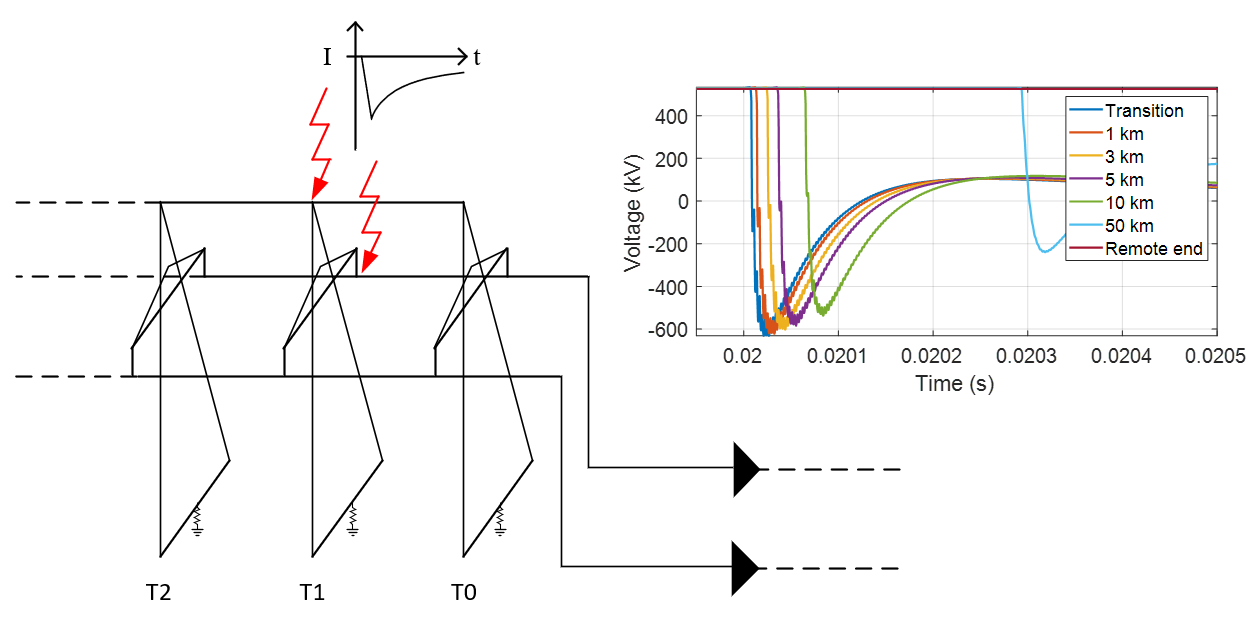
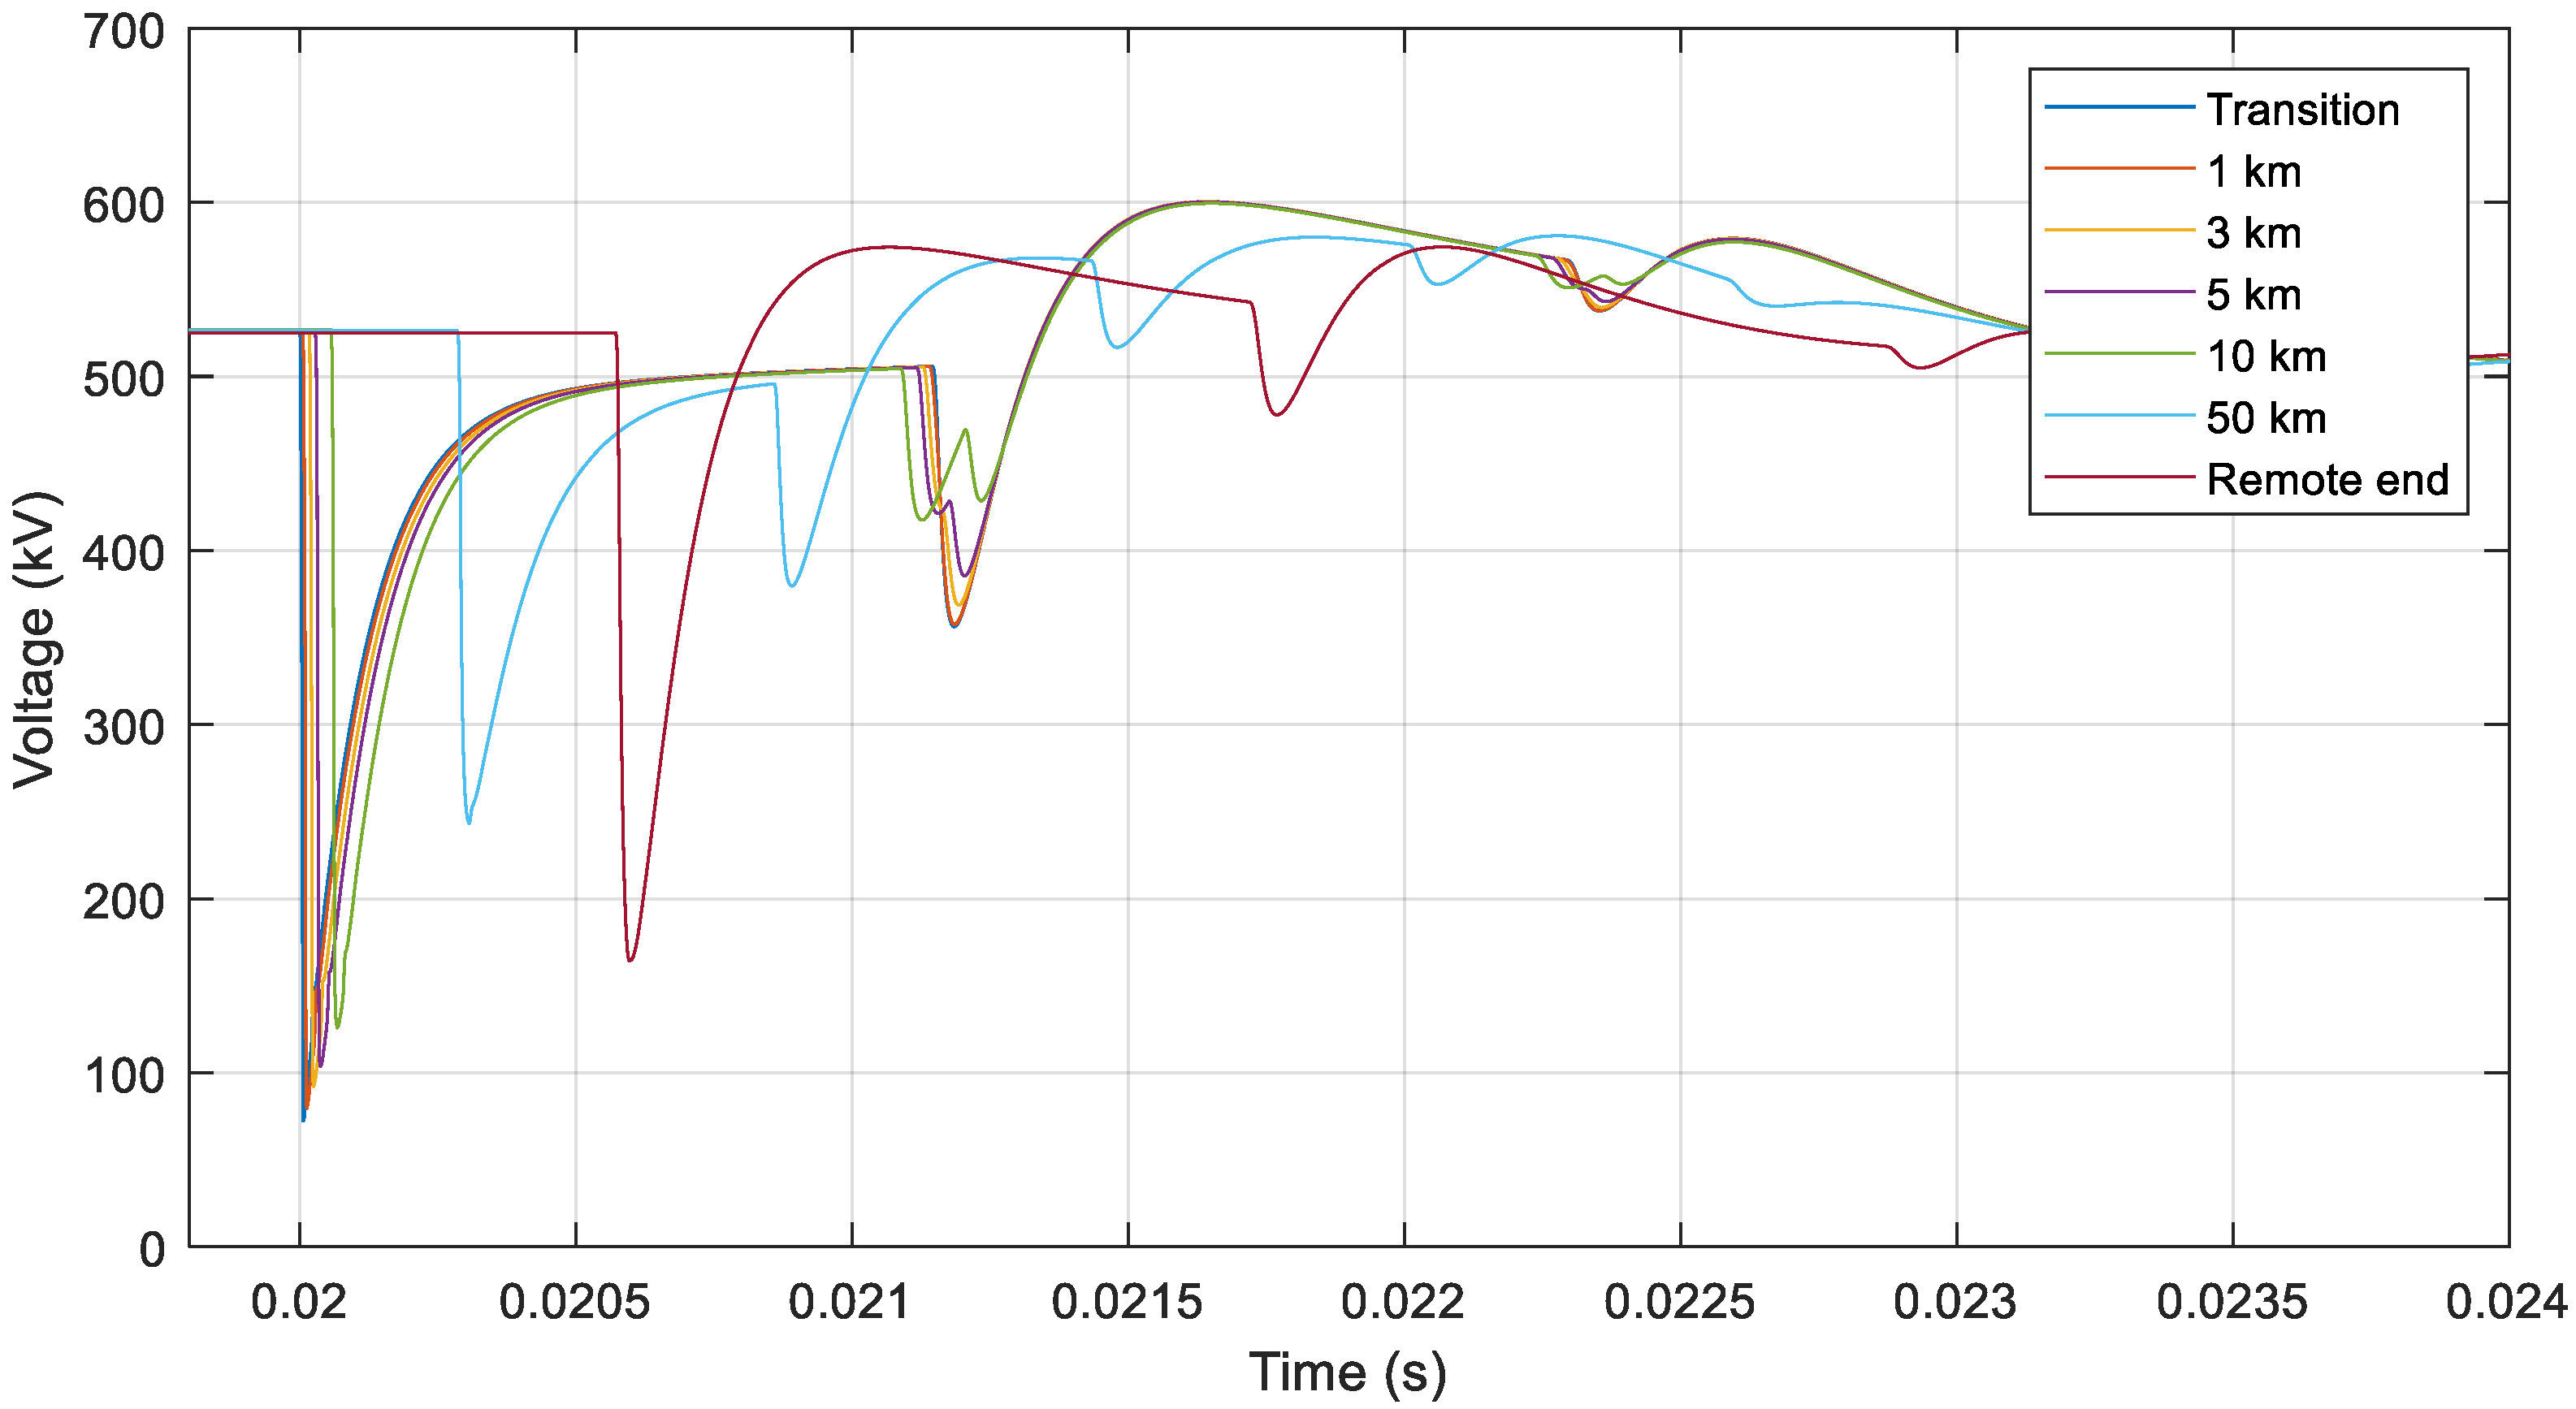
For the present case study,
Figure 15 shows that 19 kA is a sufficiently low current level not to cause flashover on the line. Furthermore, the results show that the maximum overvoltage level is +600 kV at the transition station.
5.3. Statistical Comparison
By introducing a similar statistical method for shielding failures as for backflashovers, it is possible to evaluate and compare the two phenomena with regard to the risk of insulation failure. The case study results show that overvoltages due to backflashovers for an MTBS of 300 years are higher than overvoltages due to shielding failures for the same MTBS. Furthermore, in the backflashover case, the cable is subject to a change of polarity. Hence, in this case, the representative overvoltage levels should be based on the backflashover results, as these are more severe for the cable insulation.
5.4. Comparison with Recommended Lightning Impulse Test Levels
Currently, CIGRE recommendations exist for testing HVDC cable systems only up to 500 kV [
15]. The calculated lightning overvoltages as presented in this paper are in the range of 1.2–1.3 pu, which is comparatively lower than the test levels presented in reference [
15]. However, it should be noted that the calculated values depend on project specific conditions such as lightning and grounding conditions or the length of the cable system. Nevertheless, the results of the case study indicate that the use of a statistical method may result in lower representative overvoltage levels compared to deterministic calculations.
6. Conclusions
Representative fast front overvoltage levels for HVDC cable systems connected to overhead lines are usually established without considering the statistical characteristics of overvoltages impinging on the cables from lightning strikes to the line. As discussed in reference [
3], the statistical characteristics depend on parameters that are specific to each project, such as ground flash density, grounding conditions, and the design of the overhead line.
The original statistical method described in reference [
3] focused on lightning overvoltages in ±320 kV DC cable systems. At this voltage level, lightning overvoltages on the line are often caused by backflashovers due to the comparatively low flashover voltage of the insulators. Furthermore, the attenuation of the overvoltage waves is dominated by corona discharges due to the comparatively small dimensions of the conductor bundles.
The improved statistical method overcomes the limitations of the original method by introducing overvoltage wave attenuation due to resistive effects, and by evaluating shielding failures in a similar way as backflashovers in order to facilitate a statistical comparison of the overvoltage levels. The improvements make the statistical method applicable for DC voltage levels above ±320 kV as well, as illustrated by the case study.

 ,
, 


