1. Introduction
Because of the development of solar energy technology, there has been an increase in solar power system installation in urban areas. Consistently lower solar panel prices have made it possible to install solar energy systems in complex areas. Many solar power systems are installed not only on roofs but also on the ground and building façades. Mapping of the accurate spatial distribution of solar energy potential and analysis of shadowing should be considered to achieve maximized efficiency. However, as solar power generation increases, there are factors to consider besides simply increasing efficiency. The difference pattern of solar power supply and power demand requires additional energy or energy storage. The most representative case is ‘duck curve’, which shows net demand, the difference between the electric load and the supply of solar power, in California [
1]. It represents the steep ramping needs of energy demand in the evening, as solar power increases. As this sudden ramping causes difficulties in providing a stable energy supply, it is necessary to find methods to stabilize it. One of the methods to alleviate this volatility is to change the orientation of the solar panel.
Power systems have traditionally consisted of a macrogrid at the national level, but in recent years, many small microgrid forms have been studied. Microgrid, which is an independent and distributed group of power systems, has many potential advantages such as low transmission losses, low grid congestion, utilization of local renewable resources, etc. [
2]. The word microgrid has various synonyms, such as minigrid, depending on capacity or characteristics; however, it is used to refer to all terms that match the definition in the preceding sentence in this study. The detailed renewable energy potential of the site and its variability should be analyzed to construct the microgrid. At microgrid level, the main factors for solar energy are shading, shadowing, and other system variables rather than solar irradiance of the region. Analysis of the spatial distribution and temporal variance of the potential should be conducted to maintain the stability of the grid.
The university campus is one of the most suitable sites for running such an independent microgrid. In general, although each university has a different area and number of buildings, it has many regular energy users and various facilities in the university. The electricity consumption of the university is in the range of a few to hundreds GWh/year, but varies widely depending on the university. Therefore, universities around the world already started to construct a microgrid in universities such as Wesleyan University in Connecticut and the University of California at San Diego (UCSD) [
3]. In addition, there are over 45 global activities for sustainable campus and green university [
4]. Korea is also making efforts to construct microgrids to various regions, including universities based on the Renewable Energy 2030 plan by the Ministry of Commerce, Industry and Energy (MOTIE). According to the Korean Association for Green Campus Initiative (KAGCI), electricity usage of university and college in Korea was approximately 4000 GWh/year in 2018.
Many previous studies have analyzed the optimal orientations in various regions [
5,
6,
7,
8,
9,
10,
11]. They focused on calculating methods [
5,
6,
7], the spatial distribution of optimal orientation [
8,
9], seasonal optimal tilt [
5,
10], and special application such as panels on large ship [
11], however, they estimate optimal orientation based on the total value of power generation. The optimal orientation considering the temporal volatility should be studied to maintain the stability of the grid. If the change in orientation of the solar panel reduces volatility with a loss of little power, it can be an optimal choice considering the high price of batteries. In this respect, it is necessary to calculate the optimal orientation considering the generation pattern and energy demand according to various time distributions. There are still many areas using fixed solar panels because of cost and maintenance, and the volatility optimization can help stabilization of these solar power systems.
There is considerable previous literature regarding estimating solar potential in urban areas such as a university. Some studies have focused on building roofs [
12,
13,
14,
15,
16,
17,
18,
19]. These mainly studied the extraction of high potential roofs of buildings considering roof orientation and shadowing. Some have focused on the detection of building roofs [
12,
13,
14,
15] and various scales of this method were applied from specific detailed building roofs [
12,
16] to the national scale [
17]. This method is appropriate for urban areas with low buildings. Other studies have focused on both building roofs and façades using simple box-shaped buildings [
20,
21,
22]. They calculated solar potential in each plane of the building containing a vertical plane. These methodologies are appropriate to highly urbanized areas and simple box data are easy to acquire and use; however, in most cases, these data contain only buildings without other objects. Other studies have focused on all the objects in an area using detailed surface models such as Light Detection And Ranging (LiDAR) data [
23,
24,
25,
26,
27,
28], UAV-derived data [
29] and designed three dimensional (3D) models [
30,
31,
32]. These detailed models contain all objects containing trees, but usually, have complex shapes and are difficult to analyze. Using these data enables accurate calculation of potential distribution in urban areas, but they require many resources to create.
Estimating the solar potential of specific urban areas or optimal solar direction for high potential has been done. However, as the solar power supply ratio increases, new perspectives are required to address future temporal volatility. Therefore, the objectives of this study are the estimation of photovoltaic potential and analysis of optimal orientation considering temporal volatility to increase the stability of the grid. A new tool and methodology have been proposed to achieve these objectives.
2. Methodology
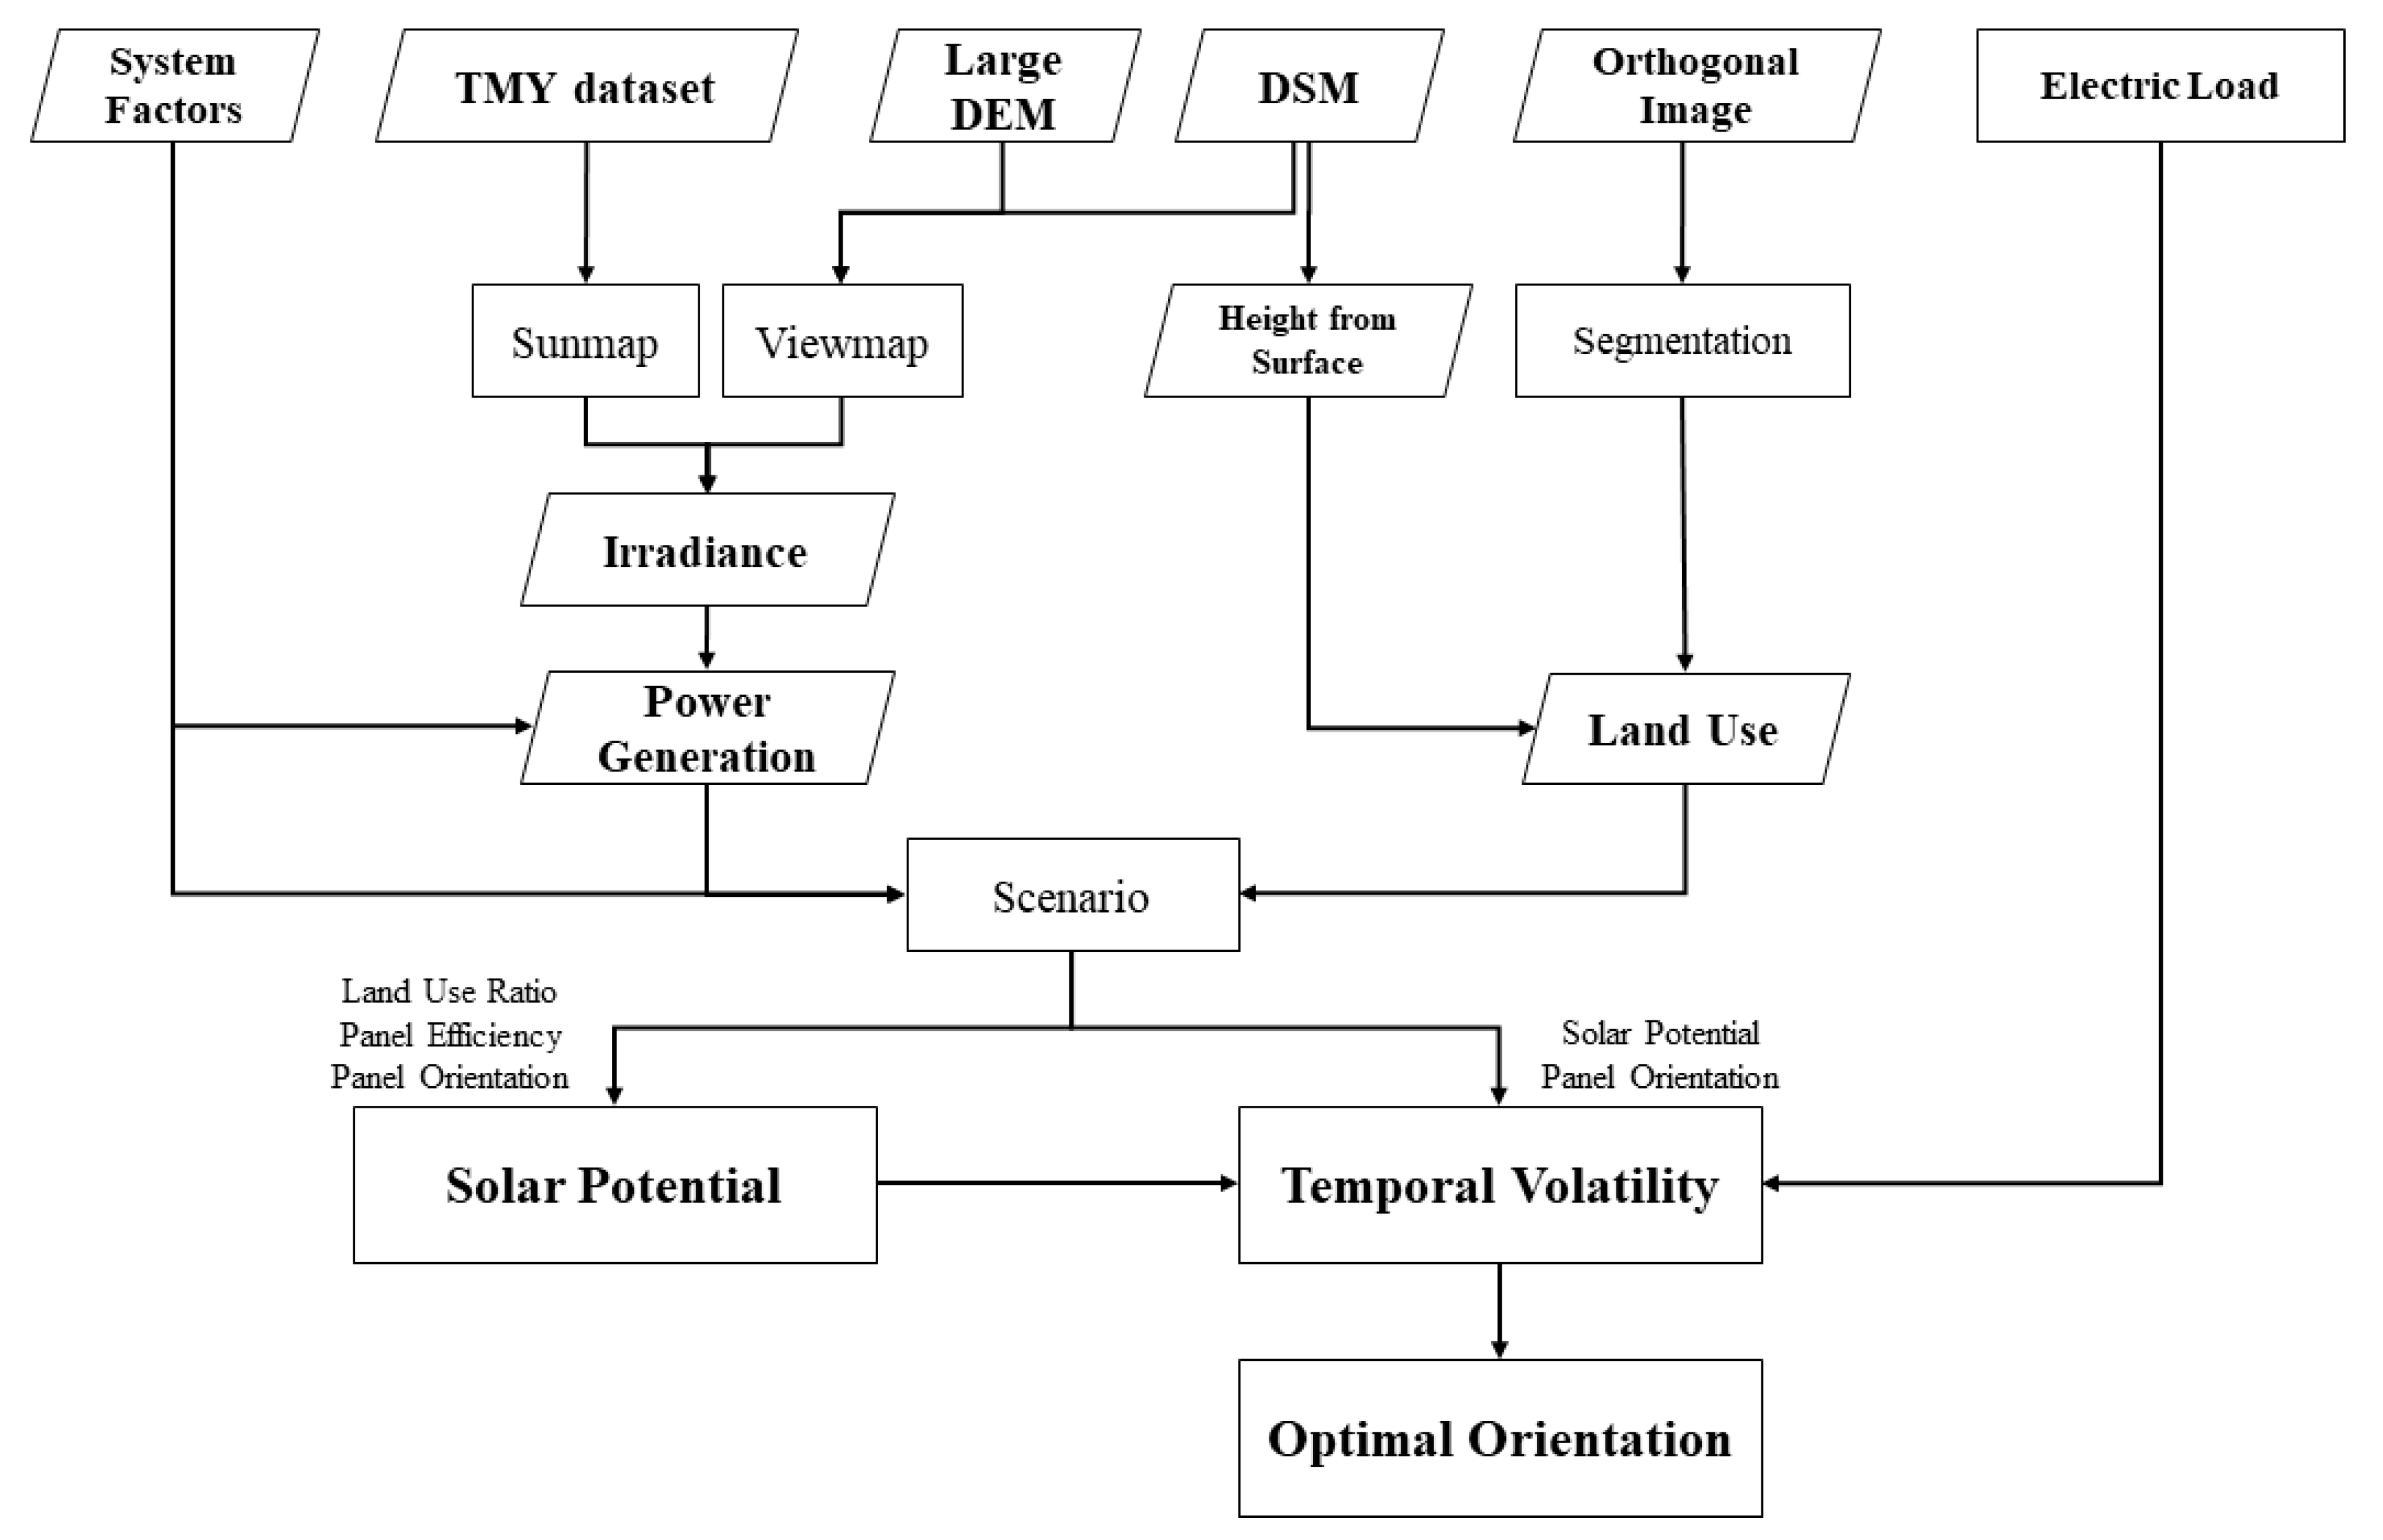
A developed tool termed “SNU Solar” is designed to calculate solar potential in an urban area with system factors and be highly compatible with geographic information system (GIS) analysis. Potential is estimated based on photovoltaic energy with scenarios constructed by variables and different urban plans. Analysis of temporal volatility is conducted with demand and supply pattern of solar power. Optimal orientation is estimated based on the results of solar potential and temporal volatility.
Figure 1 shows a flowchart of the overall process.
2.1. Study Area
The study area is the Gwanak campus of Seoul National University in Seoul, Korea. It has an area of approximately 4 million m2 and over 300,000 students, faculty, and staff. Over 200 buildings are constructed in the area. It consumes more than 190 GWh of electricity, which is 5% of all consumption in Korean universities, and was ranked number one in power use as a single facility in 2016. As there are several mountains around the area, the campus is sloped overall and shows mountainous characteristics.
Dataset
A typical meteorological year (TMY) dataset was used to consider the long-term climate of the study area. It is comprised of hourly data of 1 year from data measured over a 10-year timeframe. Each hourly data during a month is extracted from one of the measured data in a specific year. The TMY dataset in Korea was created by the Korea Institute of Energy Research (KIER). It uses measured data from 1991 to 2010 and contains information such as global horizontal irradiance (GHI), direct normal irradiance (DNI), and dry temperature. The TMY dataset of Seoul in which the average expanded uncertainty is 3% for GHI and 18% for DNI is used in this study.
Various GIS datasets are needed for spatial analysis.
Figure 2 shows the GIS datasets used as input data. High-resolution orthogonal images and digital surface models (DSMs) are generated by an UAV. Images from the UAV are acquired from the three 2017 flight plans. The spatial resolution of an orthogonal image is approximately 6 cm and that of a DSM is approximately 1 m. Not only are high-resolution DSMs used, but low-resolution DSMs as well. The Advanced Spaceborne Thermal Emission and Reflection Radiometer Global Digital Elevation Model (ASTER GDEM), which has a spatial resolution of approximately 30 m, is used to consider mountains near the study area. Some data such as height from surfaces and land use classification are generated from other input datasets.
2.2. Calculation Tool
2.2.1. Summary of the Developed Tool
A new calculation tool termed “SNU Solar” for the Seoul National University Solar Potential Mapping Tool is developed and used. This tool can calculate irradiance and electricity generation considering local weather data, spatial properties, and system parameters. It can process high-resolution UAV-derived maps like the latest literature and is designed for temporal analysis according to system variables. It also can be used for visualization of irradiance distribution and 3D analysis with façade potential. All the code is written in a MATLAB environment and it is developed as a tool with graphical user interface (GUI). Inputs are categorized into irradiance, DSM, and system factors. Various factors such as calculation interval and diffuse irradiance model can be selected or entered. Detailed postprocessing analysis in this study was completed through programming rather than a GUI tool.
2.2.2. Calculation Algorithm of the Developed Tool
An hourly irradiance dataset and high-resolution DSMs are used to calculate irradiance at each location. The hourly irradiance dataset is processed to SUNMAP, which contains information of irradiance in each sky sector. The sky sector is defined by an equal-area-equal-angle sky division grid [
33]. Diffuse irradiance of the all-sky sector in each time-step is calculated using the Perez model [
34] as shown in
Figure 3b. SUNMAP is expressed through a sky division grid where the center part is zenith angle 0° and the edge is zenith angle 90°.
Figure 3c shows the generated SUNMAP of the study area.
The shadow effect is calculated using a VIEWMAP-based calculation with pyramid dataset, which can calculate faster than previous algorithms [
33]. VIEWMAP contains information on the shadowed sky division by nearby objects as shown in
Figure 3d,e. The shadowed sky sector is calculated using a DSM or digital elevation model (DEM). A different VIEWMAP at each location and an equal SUNMAP are generated and used to calculate irradiance. Shadowed sectors can be excluded by simple multiplication of SUNMAP and VIEWMAP. Two VIEWMAPs, a nearby VIEWMAP and far VIEWMAP are calculated and used. The former is generated by a high-resolution DSM and the latter is generated by a low-resolution DEM. The nearby VIEWMAP is assumed to affect diffuse irradiance shadowing, which has been used in many previous studies such as the Sky View Factor (SVF) [
35] and ArcGIS Solar Analyst [
36].
The potential of a building façade is calculated in the same manner. The difference is that the method for façade has a fixed tilt angle of 90° and its azimuth angle should be normal to the building façade. Vertical planes are extracted by calculating the DSM slope and setting a threshold. The calculation points are extracted at one meter intervals in all areas where the slope rapidly increases. The orientation of the building can be calculated from the aspect of the DSM. To remove the shadow of the staircase adjacent to the façade, which is caused by the limitation of the raster format, the adjacent eight data points are removed in each calculation.
2.2.3. Electricity Generation Calculation of the Developed Tool
To estimate solar potential, irradiance, and electricity generation were calculated in order. Electricity generation is calculated based on the PVWatts module [
37], which is used in the System Advisor Model (SAM). SAM was developed by National Renewable Energy Laboratory (NREL), and its accuracy is technically proven [
38]. This model, which does not have many variables, is selected because this study focused on potential over the study area without selecting a specific solar panel model or inverters. System capacity is calculated with area, panel efficiency, ground cover ratio (GCR), and land use ratio as follows
where
is the area,
is the panel efficiency,
is the GCR, and
is the land use ratio. Land use ratio is the ratio of the total area to the actual solar system installation area. It is not a factor for solar power systems, but it is important for estimating solar potential. Electricity generation is calculated with system capacity, irradiance, inverter efficiency, DC–AC ratio, panel temperature, temperature coefficient, and other losses as follows
where
is the irradiance,
is the inverter efficiency,
is the DC to AC ratio,
is the panel temperature,
is the temperature coefficient, and
is the other losses.
Default SAM values are used for some factors. The inverter efficiency, DC to AC ratio, and temperature coefficient is set to 96 %, 1.1, and −0.5 %/°C, respectively. The area is calculated by GIS datasets. GCR is calculated from the solar panel tilt angle. The separation distance is calculated to be no shadow at the winter solstice. GCR is the ratio of panel length and separation distance as follows
where
is the tilt angle and
is the latitude. Panel temperature is assumed to be the same as the dry bulb temperature and is calculated according to each hour. Temperature are considered in the SUNMAP calculation to perform the hourly calculation. Other losses are assigned as the mean value of the actual installed system. Panel efficiency and land use ratio are set as variables and different values are used for each scenario. Capacity factor, which is the ratio of the actual output and maximum possible output, and supply ratio, which is the ratio of the estimated electricity generation and actual energy use, are also calculated.
2.3. Scenario
As some variables cannot be set as specific constants, analyzing some possibilities through scenarios can yield practical results. Zandler et al. [
39] constructed a scenario in terms of economy and demand and Good et al. [
40] constructed a scenario through a land use ratio of buildings. In this study, a detailed scenario is constructed through land use, which is categorized through a remote-sensing technique and GIS analysis, and system-related variables. These scenarios represent the potential differences between different investments and technologies. The results for each scenario are compared to the actual electricity consumption. In addition, hourly energy production by scenario is analyzed in the discussion.
2.3.1. Land Use Classification
Five land use classes, i.e. building, grass, sand, asphalt, and tree, were selected. The classes are acquired by object-based classification and multiresolution segmentation [
41,
42]. As object-based classification uses image objects rather than a single pixel, it shows high performance when using a high spatial-resolution image [
42]. Multiresolution segmentation is used to make objects from an image using the clustering method.
Figure 4a shows the original orthogonal image and (b) shows the segmented image. Classification has been conducted using the orthogonal image and height from the surface. All classes are classified using nearest neighbor and knowledge-based rule sets. Some objects showing irregular patterns, such as the bridge, which is asphalt but has a height, are manually modified.
Figure 4c shows the results of the classification.
2.3.2. Design of the Scenario
Scenarios were classified into five according to land use and were analyzed according to panel efficiency and panel orientation, respectively. Five land use classes were used to design the scenario. Four classes—building roof, grass, sand, and asphalt—were extracted from the land use classification, and one class, building façade, was extracted from the vertical plane in the building area. Tree class was excluded under all scenarios. Grass, sand, and asphalt classes are currently not preferred areas but can have high potential in the future. Even motorcar roads, which were included in the asphalt class, were considered as sites for a future solar power system. In the case of building façades, various products such as a building integrated photovoltaic (BIPV) system had already been studied and applied.
Five land use scenarios are designed with assumptions regarding how many solar panels will be installed in each class. Areas with less than 40 kWh/m
2/year, which is less than 1000 Wh/m
2/day irradiance, are excluded in the calculation. Scenario 1 covers all the area of the classes except for asphalt. As the asphalt area is used as a motorcar road, 50% of the total area is assumed to be installed. This scenario represents the maximum potential with the highest investment and future technology. Scenarios 2 through 5 assume a lower investment in turn: higher, high, practical, and poor investment at the current level, respectively. Detailed land use ratio and panel efficiency of each basic scenario are shown in
Table 1.
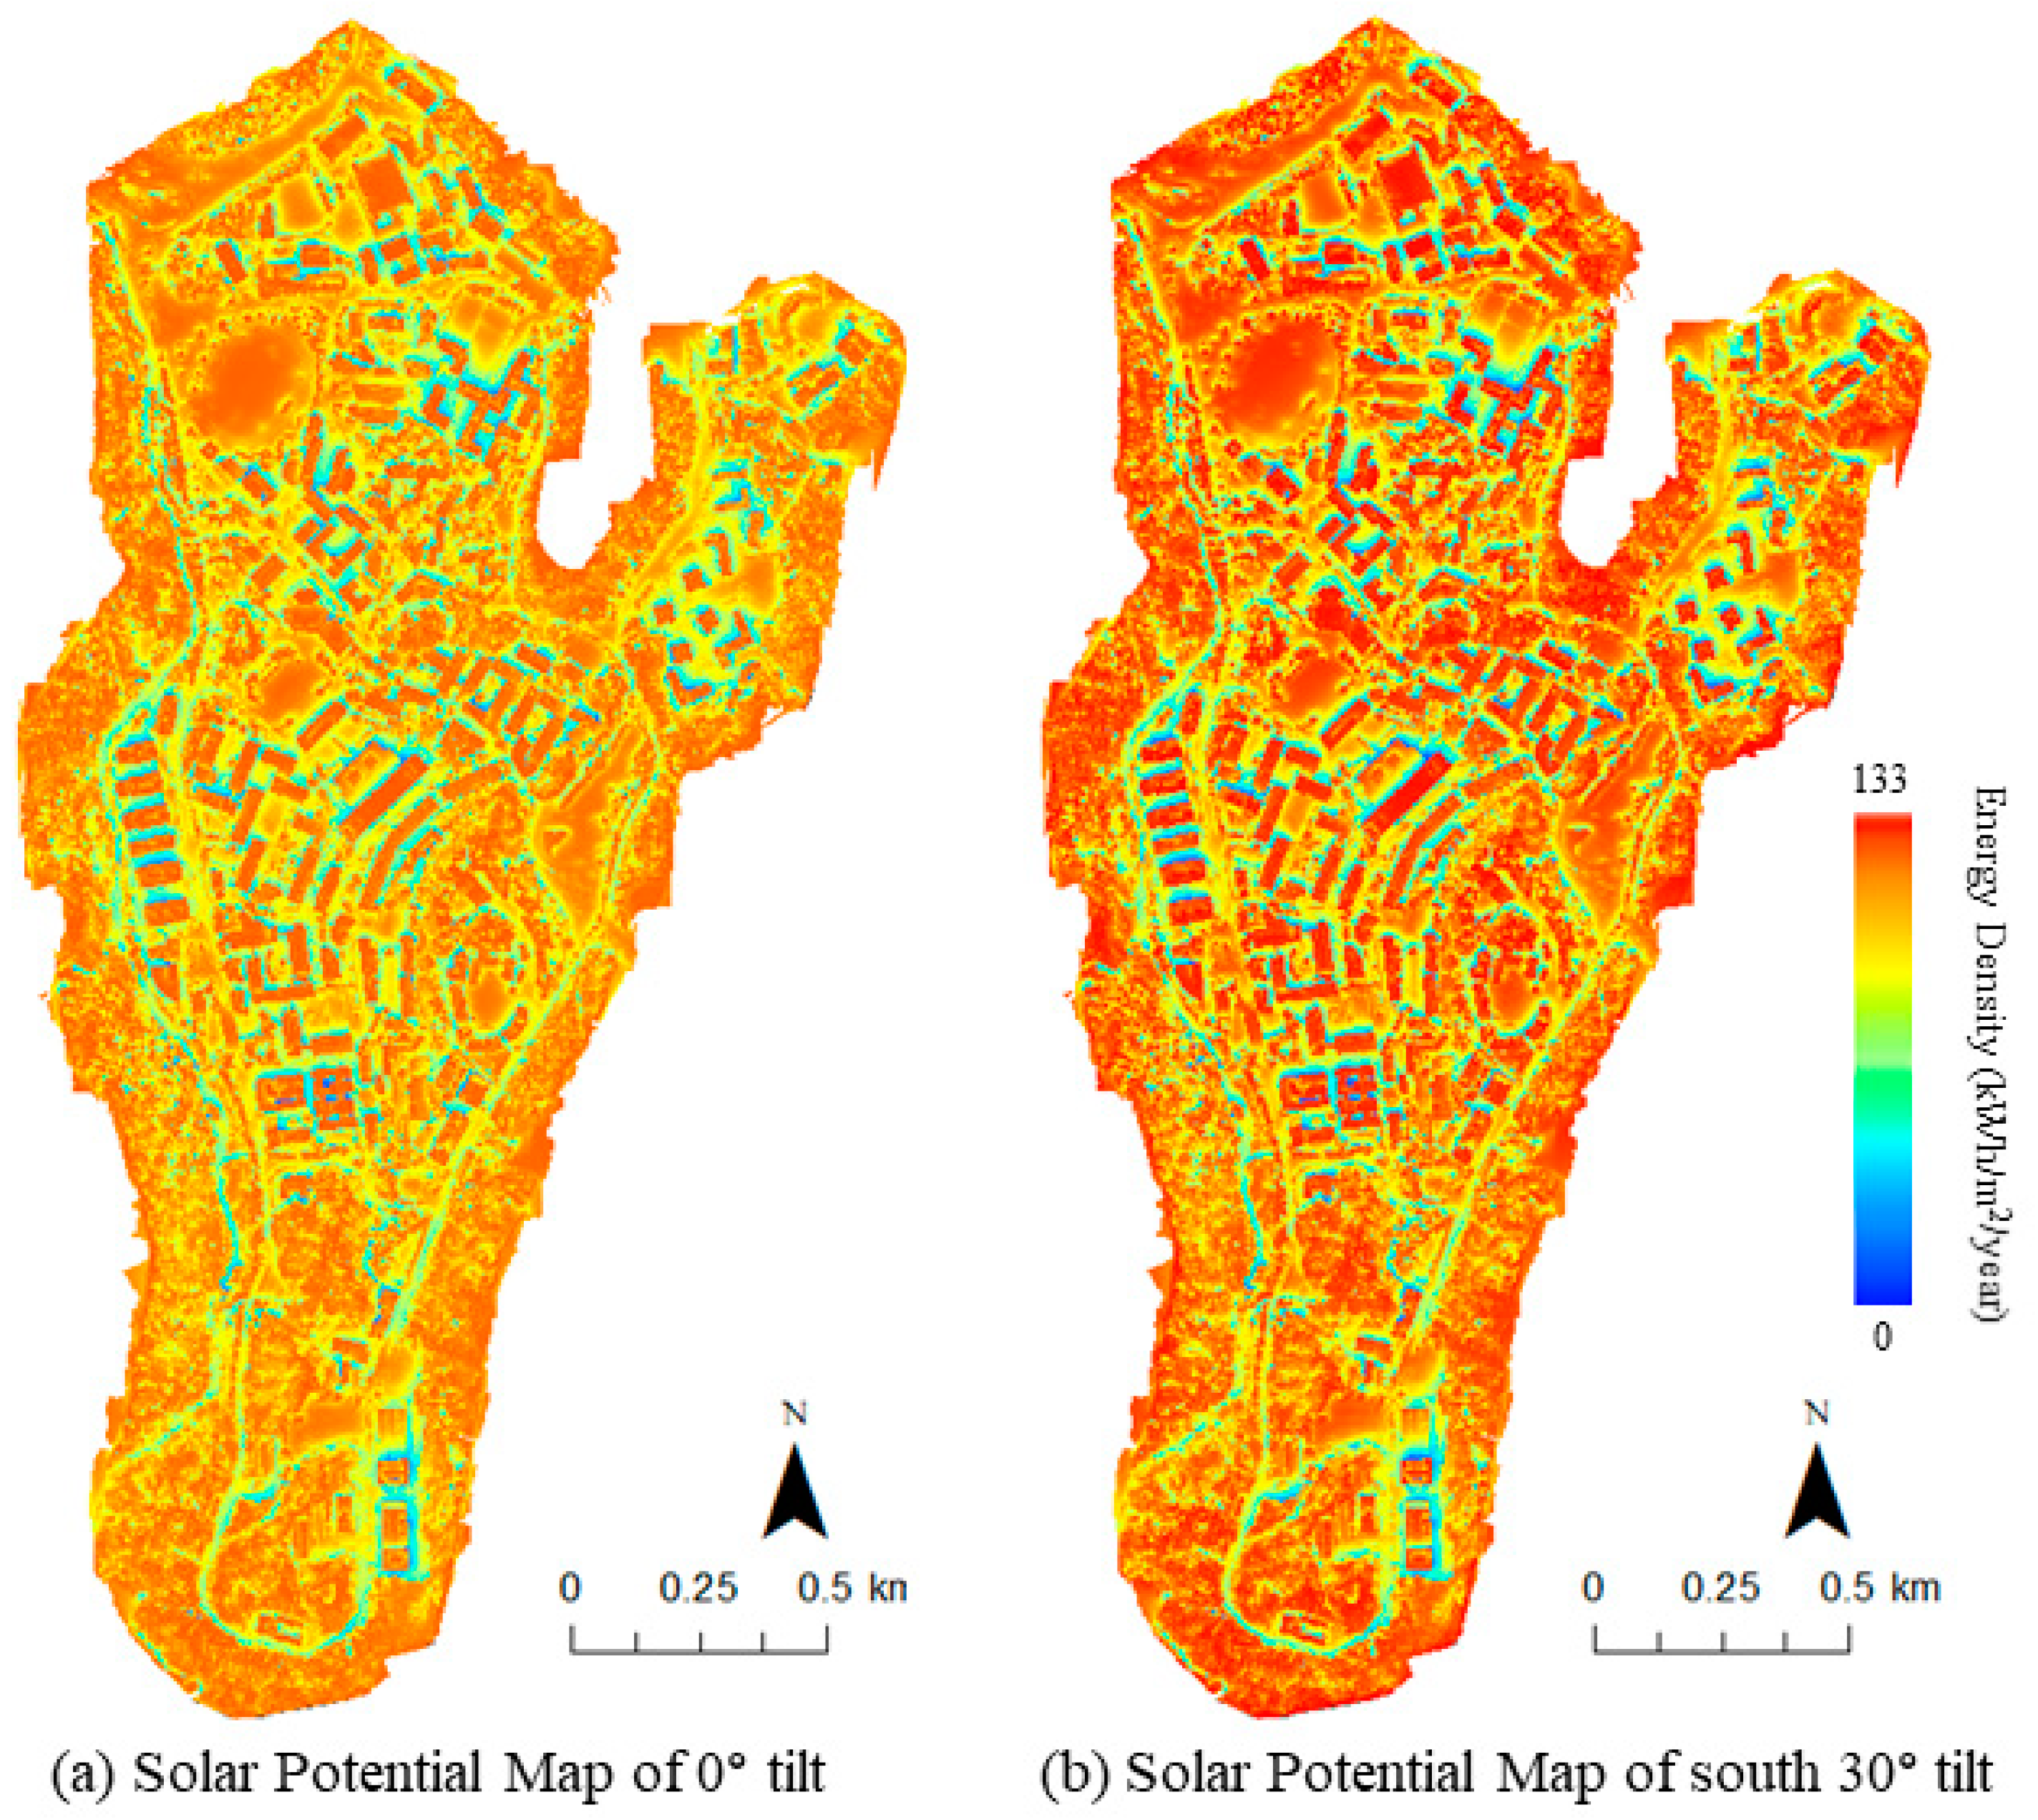
The panel efficiency is changed from 12% to 30%, and the result according to technology development is analyzed. Two panel orientations—flat and 30° tilt angles—are used to analyze the scenario. The flat angle scenario assumes that the solar panel is installed at a 0° tilt, which results in lower irradiance but a higher possible system capacity. As these systems have lower irradiance, they will have a low capacity factor. However, more solar panels can be installed because the separation distance does not need to be considered. The 30° tilt angle scenario assumes that the solar panel is installed at a southward 30° tilt, which is similar to the latitudinal angle of the study area. This angle is widely used and has relatively high energy efficiency; however, a separation distance is needed.
2.4. Temporal Volatility
Two temporal volatility—hourly and monthly—are calculated according to scenarios. Hourly ramp and monthly variance from net demand are analyzed. In terms of power systems, electricity production should always be consistent with demand. If production is higher, energy is wasted and, if demand is higher, a blackout could occur. In the volatility of hour unit, the steep ramp must be reduced [
1] because abrupt ramp requires immediate and flexible power sources such as batteries and diesel generators. The higher the ramp, the greater the capacity and the more equipment required. In addition, as the solar power supply increases, the mitigation of oversupply becomes important. To manage oversupply, energy storage systems (ESS) must be used, however, the required amount can be reduced when hourly volatility is reduced. Therefore, the maximum hourly ramp is calculated with respect to panel direction and scenarios.
In the volatility of the month unit, the variance is important in terms of long-term energy composition. To accommodate energy fluctuations over several months, it is necessary to use huge amount of ESS or different energy sources on a monthly basis. The monthly energy mix is important when the solar power ratio is low, but ESS becomes more important as the solar power ratio increases. As ESS has a high cost currently, mitigation of monthly volatility can be an economically important strategy. Unlike hourly volatility, in this case, the difference between the monthly value and standard deviation are more important than a ramp. Therefore, the standard deviation is calculated with respect to panel direction and scenarios.
Figure 5 shows the amount and volatility of energy usage in the study area. The study area is currently using both electricity and gas, which have some fluctuations but are steadily increasing over time. Although total usage has increased, patterns of monthly and hourly usage have been similar for the past three years as shown in
Figure 5b,c. However, energy usage in the morning showed a slightly increasing tendency in hourly patterns.
2.5. The Optimal Orientation of the Solar Panel
The optimal orientation for one condition can be estimated as one value, however, that for multiple conditions with economic factors cannot be estimated as one value. Therefore, the optimal orientation is analyzed under three conditions, annual production, hourly volatility, and monthly volatility. In annual production, energy density according to panel orientation and GCR are analyzed. Energy density is the most important factor, but GCR also can be important in a limited area. In volatility analysis, correlation and standard deviation of temporal patterns are analyzed. The net demands according to the scenario are also analyzed based on ramp and volatility. Since the optimal orientation can be changed according to factors such as project target, area, and economic factors, this study presents the optimal orientation according to several scenarios and objectives.
4. Discussion
4.1. Solar Potential
A most significant factor for solar potential in each class is the area. As the study area has little vacant lot area, buildings and motorcar roads cover large areas. The building façade area is similar to that of the building roof but slightly less. The mean energy density of the four non-vertical classes shows a maximum difference of 20%. This implies a photovoltaic system can be installed in every classes according to technological development. Although the energy density of building facade is approximately 60% of that of other ground classes, it has the advantage of utilizing hidden space. As results, the total solar potential of the study area is heavily influenced by the usage of each class area and discussions on land use from a long-term perspective are needed.
Although the results show electricity generation could exceed the electricity consumption in 2018, land use Scenario 1 is too ideal approach and electricity consumption is steadily increasing. Therefore, 100% of the electricity supply seems to be impossible without a technological breakthrough or expand the sites with cutting trees. From the current perspective, a supply ratio of less than 30% is expected to be practical. Even in these cases, tens of MW capacity and tens of GW/year electricity are expected.
As panel efficiency is generally approximately 20%, an increase of 1% can have a large impact on the total value. Recent studies show that the efficiency of silicon photovoltaic cells is greater than 26% [
43]. Although these laboratory results may differ from those in industry, these studies could be expected to improve the efficiency of commercial solar panels in the future. Another important factor is the degradation of the system over time. However, such degradation is expected to be compensated by maintenance methods and various techniques such as monitoring systems [
44,
45].
4.2. Temporal Volatility and Optimization of Panel Orientation
The current study area is connected to the national grid. Therefore, the analysis of temporal volatility in the university may not be meaningful. However, as mentioned in the introduction, the microgrid is studied for various reasons and this research is essential if the system partly adopts to the microgrid. The analysis of the hourly volatility implies that microgrid at the university campus has advantages in the absence of evening peak demand. However, the analysis of the monthly volatility implies that there are huge deviations of several months. To solve this problem and to construct the microgrid, large ESS should be constructed from a long-term perspective. Pumped hydro energy storage (PHES) can be an alternative for high renewable energy supply [
46]. This study area is favorable in this respect because it is located in the mountain area, but the actual installation of PHES requires further study.
When applying orientation optimization, there is an easy way to connect with architecture. The orientation of the building is oriented not in the south but in various orientations depending on the terrain and the object. If photovoltaic power plants are installed in buildings with appropriate orientation, both architectural and system stability aspects can be beneficial. The buildings in this study area are also mostly oriented to the southeast rather than the south. In addition, vertical tilt angles on the building façade can help to reduce monthly volatility. However, if the photovoltaic system uses tracking solar panel, optimization of panel direction is not necessary. Nevertheless, optimal orientation analysis is very important because fixed solar panels are constantly being used because of maintenance, additional energy use, and economic reasons.
5. Conclusions
The solar potential of the university is estimated using the developed tool and various scenarios. The optimistic and ideal scenario shows a high solar potential that can exceed the total energy consumption in 2018 with high panel efficiency. However, the practical scenarios show less than 25% of the total consumption is available. Temporal volatility is analyzed on an hourly and monthly basis, each of which was used to maintain short-term stability and long-term stability. The university has advantages in terms of low electricity demand in the evening, but monthly demand shows a pattern opposite to solar power generation. Optimal orientation of solar panel for mitigation of temporal volatility is estimated according to objectives and solar power supply ratio.
The potential, optimal orientation and electricity usage can vary from region to region. Other university campuses with different location and life patterns can show different results. The results can also change if new technology emerges or the environment of the sites changes. Nevertheless, the methodology and results can aid future urban energy planning. The solar potential can be used to understand the objectives of projects and compatibility of a microgrid on the university campus. The results of volatility and optimal orientation can be used to optimize the system and understand future perspectives. There will be more campaigns for environment-friendly campuses and microgrid in the university. This study is expected to help the decision-making and the design of a solar power system for these campaigns.


