Article

Effects of Fuel Injection Pressure on Combustion and Emission Characteristics under Low Speed Conditions in a Diesel Engine Fueled with Palm Oil Biodiesel

Division of Mechanical Design Engineering, Chonbuk National University, 567 Baekje-daero, Deokjin-gu, Jeonju-si, Jeollabuk-do, Jeonju-si 54896, Korea
*
Author to whom correspondence should be addressed.
Energies 2019, 12(17), 3264; https://doi.org/10.3390/en12173264
Submission received: 23 July 2019 / Revised: 16 August 2019 / Accepted: 23 August 2019 / Published: 24 August 2019

Abstract

:
In this study, the effect of injection pressure on combustion and emission characteristics was evaluated on a common rail direct injection diesel engine fueled with palm oil biodiesel. Recently, many studies have been conducted to utilize biodiesel produced from various sources to prevent environmental pollution and the depletion of petroleum resources. The oxygen content and high cetane number of biodiesel can reduce the production of exhaust pollutants by improving the combustion, but its high viscosity deteriorates the atomization of the injected fuel. Particularly at low engine speed conditions like idle, poor atomization and low airflow in the cylinder deteriorates the combustion efficiency. Increasing the fuel injection pressure is one of the effective methods to improve the atomization of biodiesel without mechanical modification of the current diesel engine. In this study, combustion characteristics and emission levels of pollutants were measured by varying the fuel injection pressure applying palm oil biodiesel. As a result, it was confirmed that increasing the injection pressure to apply palm oil biodiesel at low engine speed can reduce ignition delay and improve combustion efficiency so that nitrogen oxides (NOx) is increased but soot formation is reduced. Carbon monoxide (CO) and hydrocarbon (HC) are slightly reduced but these are increased again when using 100% palm oil biodiesel. The increased NOx due to increased injection pressure can be reduced by applying exhaust gas recirculation (EGR).

1. Introduction

Environmental pollution and depletion of petroleum resources are accelerating as the use of internal combustion engines using fossil fuels increases [1]. Thus, the regulations on exhaust pollutants emitted from internal combustion engines have been strengthened [2,3], and many engineers are exploring methods to improve the efficiency of internal combustion engines. The improvement of engine hardware and precise combustion control reduce exhaust emission while maintaining high performance [4]. Another way to improve efficiency is the improvement of the fuel itself, which is the energy source of the internal combustion engine—that is the use of biofuels. Bioethanol and biodiesel are the representative biofuels, and they are considered as alternatives to slow down the depletion of petroleum resources while also reducing environmental pollution [5]. Biodiesel can be produced using various animal fat and vegetable raw materials [6]. However, due to its high viscosity, density, and low volatility, bio-oils from raw materials cannot be used in raw form, but through the transesterification process, biodiesel can be produced for use in commercial engines [6].
Biodiesel is similar to petroleum diesel, thus it can be applied directly without redesigning the diesel engine or additional modification [5,6]. It is also known that the oxygen contained in the biodiesel increases the combustion efficiency, thereby reducing carbon monoxide (CO), hydrocarbon (HC), and smoke, but nitrogen oxide (NOx) is increased [7,8]. Moreover, biodiesel has a low calorific value and high viscosity and density. The low calorific value dictates more fuel is required to produce the same output, which results in more fuel consumption than petroleum fuel. The high viscosity, density, and surface tension also exacerbate the combustion of the fuel injected into the cylinder because of poor atomization and increased mean droplet size of the injected fuel [9,10]. The study of combustion and pollutant emission characteristics applied palm oil biodiesel and shows that the power of engine decreased and particulate matter (PM) emission decreased as the blend ratio of palm oil biodiesel increased [11]. At an idling operation condition of low-speed engine rotation, applying the blended palm oil biodiesel deteriorates the fuel-air mixing through poor atomization. The larger droplet by poor atomization of injected fuel leads to the increasing CO and HC, but the lower combustion temperature makes NOx stay constant [12]. Studies on the unregulated environmental pollutants that are known as VOCs emitted from engines using biodiesel are also underway [13,14].
There are various combustion control methods for optimizing combustion in diesel engines. It is known that the increase of injection pressure is the most effective method for improving fuel atomization. The high fuel injection pressure promotes atomization and is advantageous for the starting of combustion [4,15,16]. When the injection pressure is low, the droplet size becomes larger and the droplet evaporation needs more time so that HC and CO levels are increased. Further, the combustion duration is increased so that the combustion progresses during the expansion stroke resulting in increased heat consumption [17]. Therefore, it is necessary to confirm the influence of fuel injection pressure on combustion efficiency and emission to use biodiesel which has high viscosity and density.
In this study, palm oil biodiesel is applied to a common rail diesel internal combustion engine used in commercial automobiles. Additionally, the effects of the fuel injection pressure on the engine performance, combustion phenomena, and generation of exhaust pollutants were observed. Further, the feasibility of exhaust gas recirculation (EGR) applying for reducing NOx increased under higher injection pressure was checked.

2. Methodology

2.1. Test Fuels

In this study, palm oil biodiesel was selected. Palm has a high oil content and can produce more biodiesel than other materials, resulting in lower production costs. It is also known as a renewable and acceptable alternative fuel that is clean and nontoxic because it produces less greenhouse gases and other toxic pollutants than petroleum diesel [18]. Here, the name of the test fuel is expressed as PD, which is the abbreviation for palm oil biodiesel. PD0 means 100% petroleum diesel and PD100 means 100% palm oil biodiesel. The properties of petroleum diesel and palm oil biodiesel are shown in Table 1. Similar to other studies [19,20] of palm oil biodiesel applied in diesel engines, this higher viscosity and lower calorific value than petroleum diesel was observed.
Additionally, PD20 was used. This is the test fuel blended with 20% palm oil biodiesel and 80% petroleum diesel in volumetric ratio. A blend of 20% biodiesel and 80% petroleum diesel is known as the optimal ratio compared with other blends [7,21,22]. Minnesota of the United States announced the plan to increase biodiesel content from 10% to 20% from May 2018 [23].

2.2. Experimental Setup and Measurements

2.2.1. Engine Setup

The test engine used in this study is a four-cylinder 2.0-liter turbocharged-intercooled common rail direct injection diesel engine applied in commercial vehicles. Detailed specifications are shown in Table 2. A Bosch FIE System (fuel injection equipment system, i.e., solenoid injectors, fuel pump, common rail and ECU (engine control unit) were applied.

2.2.2. Experimental Equipment

As shown in the experimental equipment diagram of Figure 1, the test engine was installed on an eddy current type dynamometer (DY-230kW, Hwanwoong Mechatronics, Gyeongsangnam-do, Korea) equipped with a fuel supply system and a fuel pump. A multi-gas analyzer (HPC501, Pantong Huapeng Electronics, China) measured the levels of CO, HC, and NOx. A partial flow collecting type soot analyzer (OPA-102, Qurotech, Korea) was used to measure the smoke opacity. The combustion pressure for combustion analysis was acquired using a piezo-electric type pressure sensor (Kistler, 6056a, Winterthur, Switzerland) at the position of the glow plug and was recorded by a DAQ board (PCI 6040e, National Instrument, Austin, TX, USA).

2.2.3. Test Procedure

In this experiment, the rotational speed of the engine was set to idle—750 rpm as the ECU setting. The engine loads were 40 Nm to simulate the condition of an external load on the actual vehicle. The pilot injection was applied in a similar fashion to that currently used in diesel automobile engines today. The main injection timing was fixed at before top dead center (BTDC) 2 crank angle (°CA) and pilot injection timing was fixed at BTDC 20 °CA and the injection pressure was applied at 200 and 380 bar, respectively. The injection timings and durations by injection pressures are shown in Figure 2. As injection pressure increased, the pilot duration is reduced from 1.7 °CA to 1.3 °CA and the main injection duration is reduced from 5.2 °CA to 2.7 °CA. This is because an increase in the fuel injection pressure shortens the period of time required to inject the same fuel quantity [17].
The combustion pressure and exhaust measurement were started when the engine speed was stabilized within 750 ± 10 rpm and coolant temperature 85 ± 5 °C for each experimental condition. The combustion pressure is calculated as the average of 200 cycles. The EGR rate of 10% was applied at injection pressure 380 bar to evaluate the feasibility of reducing the increased NOx. The experimental conditions are summarized in Table 3.

2.2.4. Data Analysis

The combustion pressure and heat release rate were averaged over 200 cycles of the engine running through the combustion analyzer. The heat release rate was calculated using the following formula [12,13,24,25]:
d Q d θ = k k 1 P d V d θ + 1 k 1 V d P d θ
Here, k is the specific heat ratio and used as 1.35. Additionally, P is the combustion pressure, and θ is the crank angle. The piston cylinder volume (V, m3) can be calculated as a function of crank angle from the compression ratio, bore, stroke, and length of connecting the rod vis the sider-crank system. The volume of the cylinder (V, m3) is given by Equation (2) as follows [12,24,25]:
V = V d r 1 + V d 2 ( 1 + R cos θ R 2 s i n 2 θ )
where Vd is the displacement volume (m3), r is the compression ratio, and R is the stroke-to-bore ratio.
The mass fraction burned (MFB) is calculated as a function of crank angle using the following formula [26,27]:
MFB ( θ ) = θ s θ d Q d θ d θ θ s θ e d Q d θ d θ
Here, θ s is the start of energy release and θ e is the end of energy release.
The brake specific fuel consumption (BSFC) is calculated using the following formula [12,24]:
BSFC = m f ˙ 2 π N T
Here, m f ˙ is the fuel flow rate, N is the engine speed, and T is the brake torque from the engine dynamometer for an engine load of 40 Nm.
The brake thermal efficiency (BTE) is calculated using the following formula [26]:
BTE = 1 B S F C × L H V
Here, LHV is the lower heating value of blended palm oil biodiesel. The LHV of the blended test fuel, PD20, is calculated [28].
To verify the combustion stability of the diesel engine operation at idle using each test fuel, the coefficient of variation (COV) for the indicated mean effective pressure was used, which is defined as [12,13,29]:
COV I M E P = 1 N i = 1 N { I M E P ( i ) X } 2 1 N i = 1 N I M E P ( i )
Here, the numerator is the standard deviation of indicated mean effective pressure (IMEP) over 200 cycles (here, N = 200) and the denominator is the average of IMEP over 200 cycles. IMEP(i) is the indicated mean effective pressure (here, i = 1, 2, 3, …, 200).
The formula for the rate of EGR is as follows [8,24]:
EGR ( % ) = m E G R m i × 100
Here, m E G R is the mass of the recycled exhaust gas and m i is the total intake gas including the recycled exhaust gas.

3. Results

3.1. Engine Performance

3.1.1. Combustion Characteristics

The properties of biodiesel in which oxygen content, high cetane number, low calorific value, and high viscosity have a great influence on fuel injection and combustion in the cylinder [19,20]. The viscosity of biodiesel, such as palm oil biodiesel, is higher than that of petroleum diesel and has a high surface tension so that the atomization of injected fuel in the cylinder is not well developed at the same injection pressure [30,31]. Particularly, while idling with a low engine rotational speed, mixing of the intake air into the cylinder with the injected fuel becomes poor. Moreover, under idling conditions, the lower fuel injection pressure yields much poorer atomization of the injected fuel. As the blend ratio of palm oil biodiesel increases, the deterioration of the atomization also increases.
Figure 3a–c show the combustion pressure and heat release rate under injection pressures of 200 and 380 bar applied each test fuel. It can be seen that the combustion pressure and heat release rate are higher under higher injection pressure in all test fuels. As the injection pressure is reduced, the points of the maximum combustion pressure and heat release rate are also retarded and the combustion of the pilot injection is deteriorated, as shown at the graph of heat release rate. As shown in Figure 3d, as the blend ratio of biodiesel increases, the combustion is improved via the influence of oxygen so that the maximum combustion pressure and heat release rate are increased.
As the combustion pressure increases, the atomization of the fuel injected into the cylinder is improved, and the combustion of the pilot injection is surely started. As the combustion environment of the main injection is improved, the values of maximum pressure and heat release rate are increased. Additionally, the maximum pressure and heat release points are advanced.
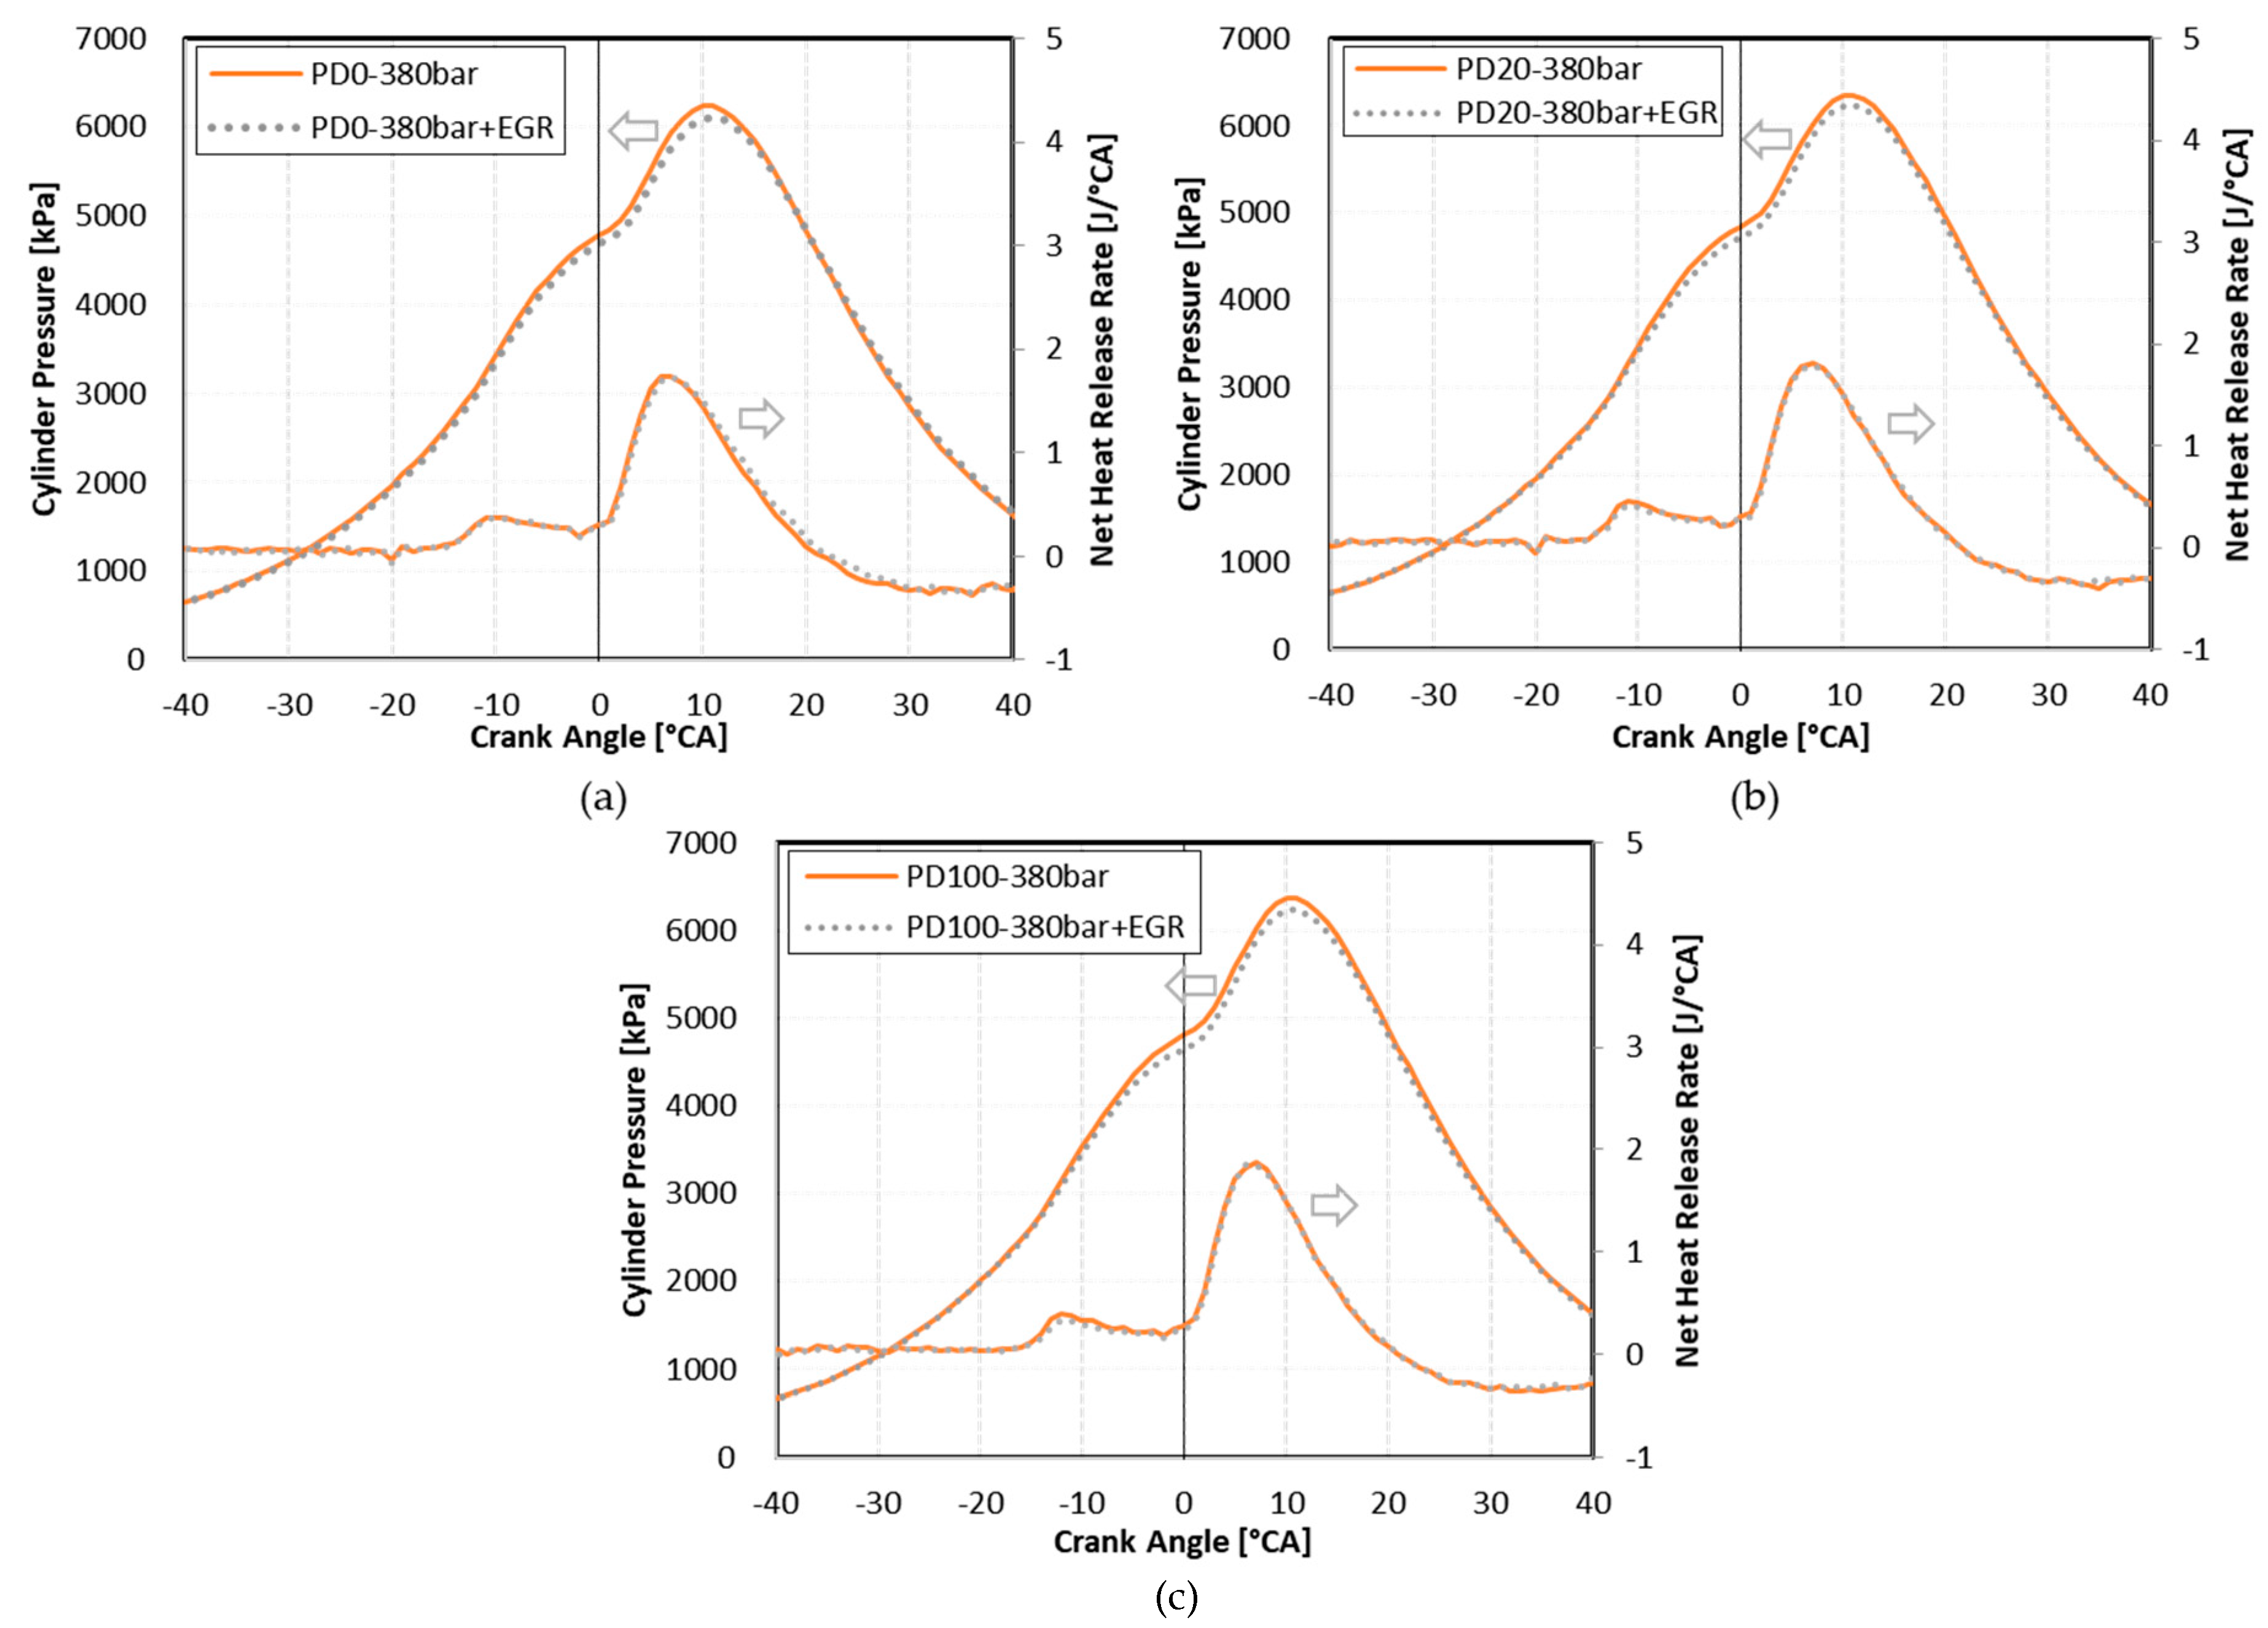
Figure 4 shows the combustion pressure and heat release rate under the fuel injection pressure of 380 bar with EGR applied. It can be seen that applying EGR reduces the maximum combustion pressure and reduces the heat release rate of the pilot injection. This leads to reducing NOx.

3.1.2. Ignition Delay and Combustion Duration

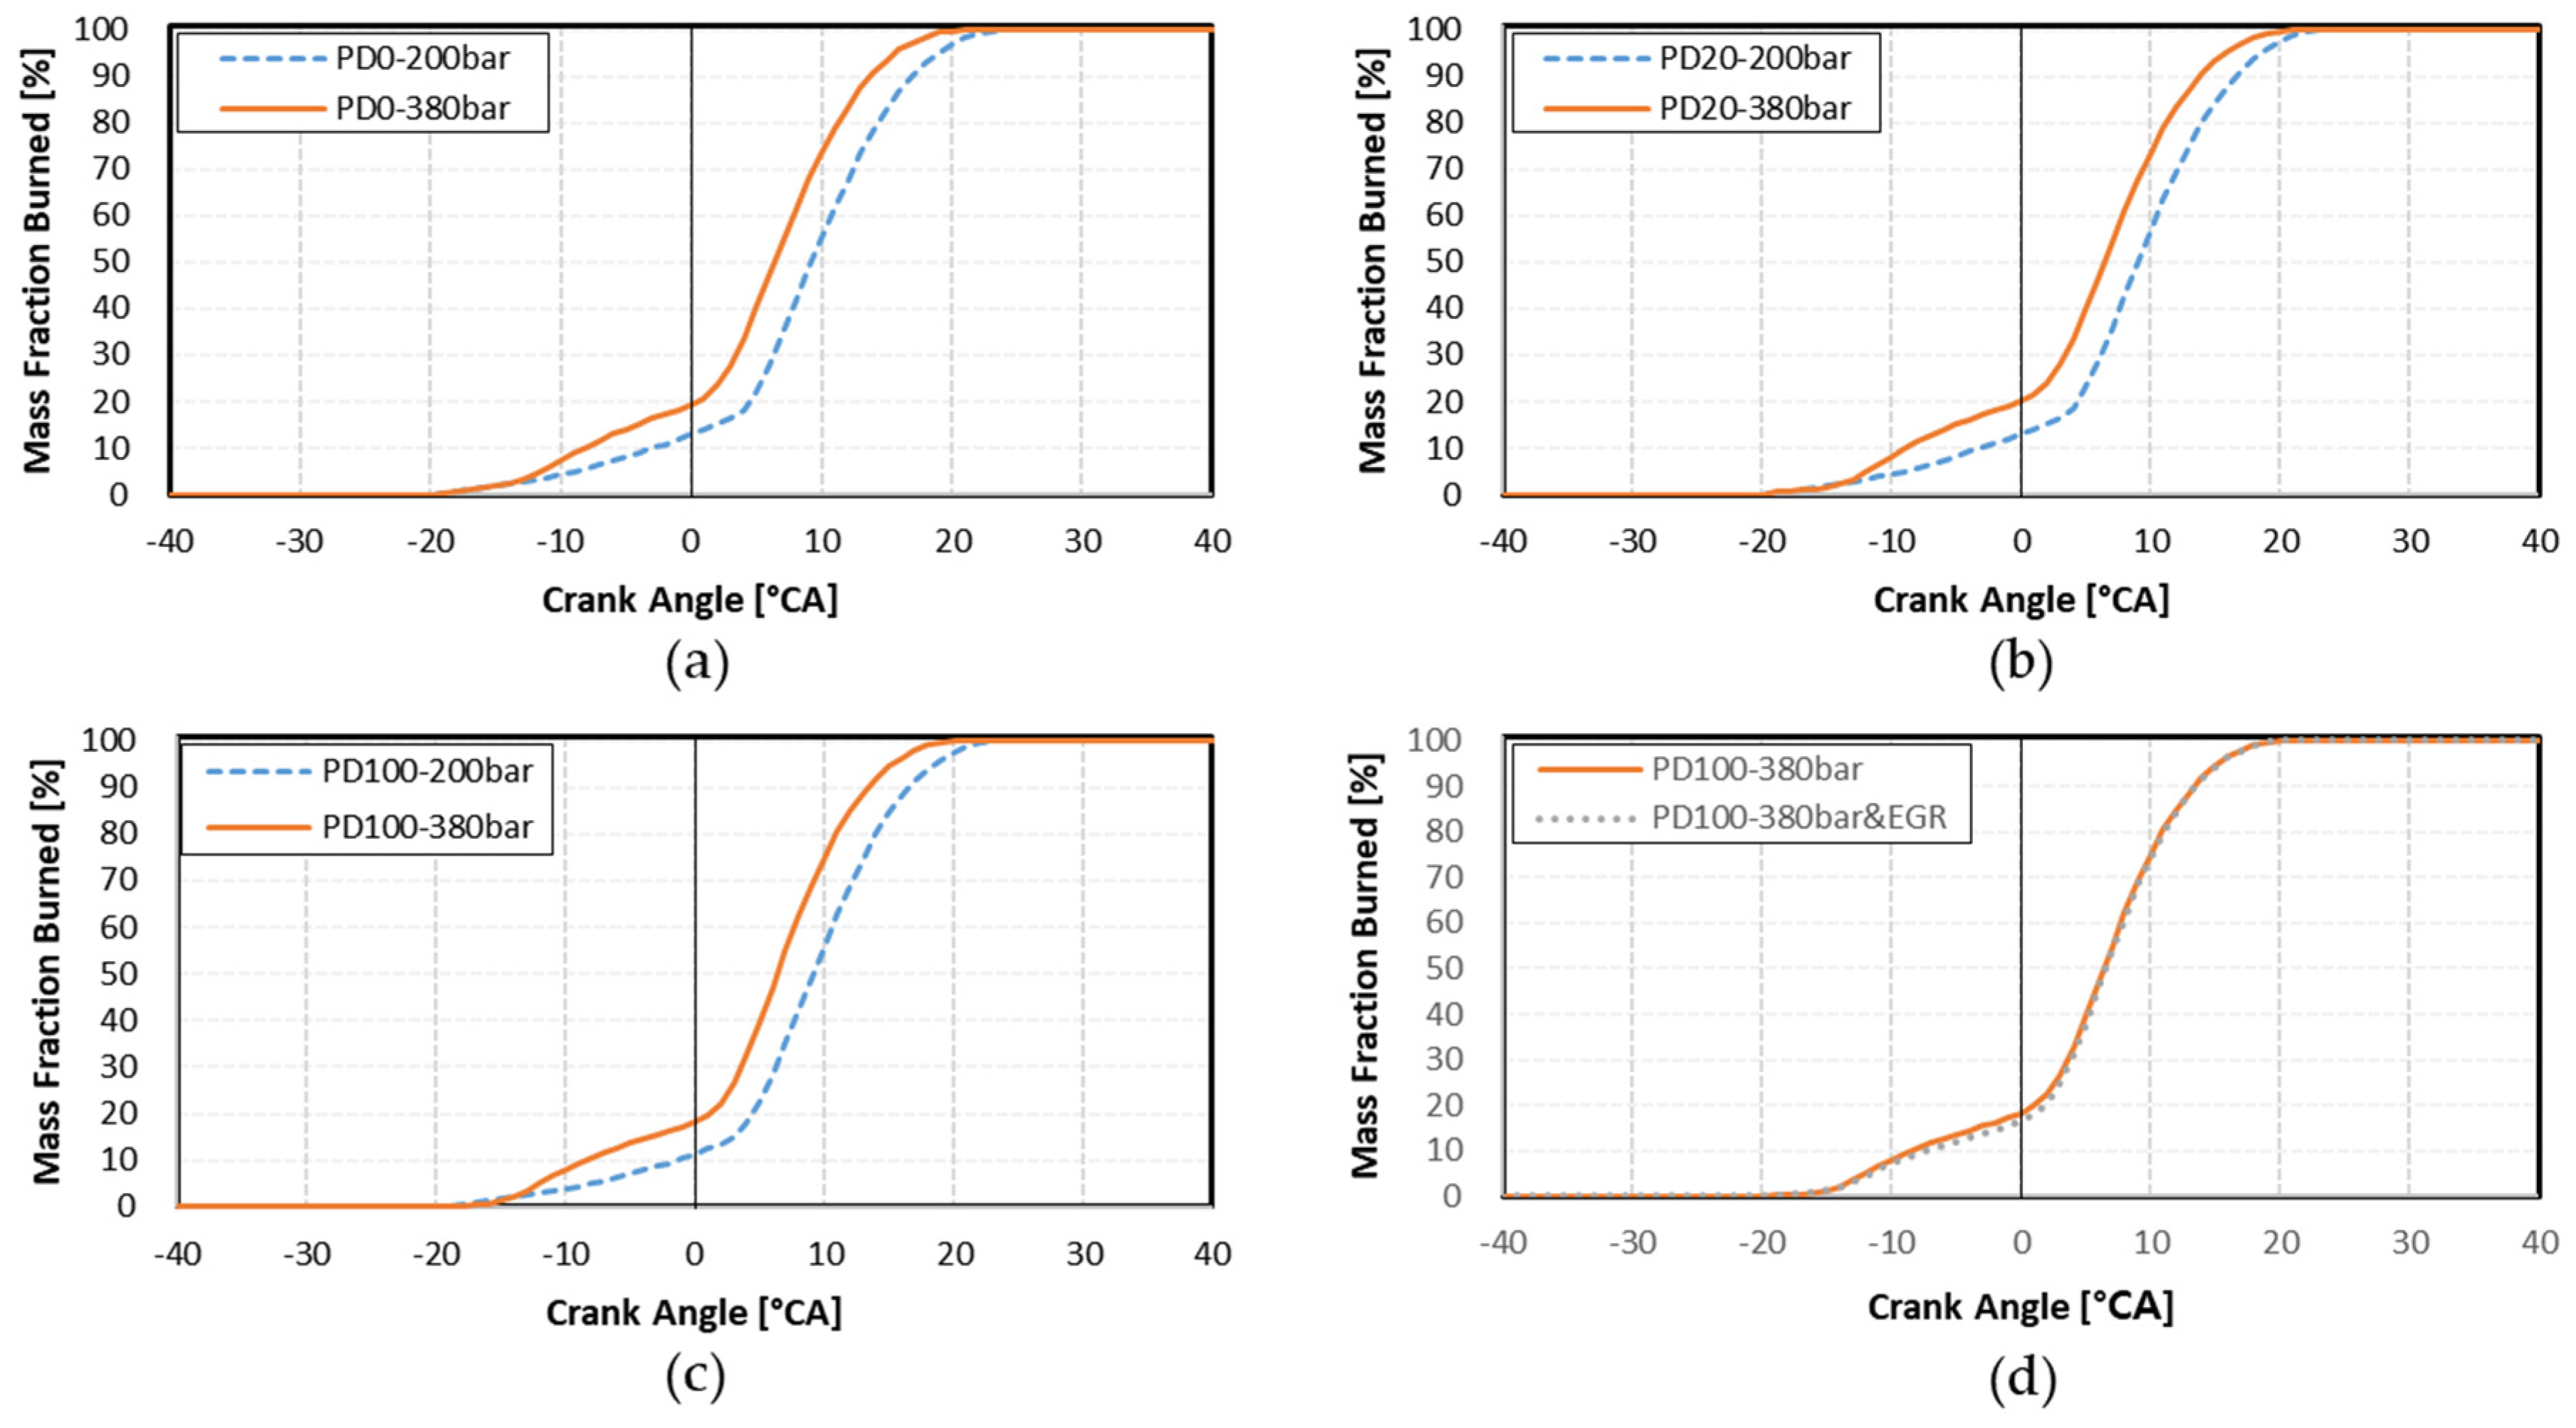
Mass Fraction Burned (MFB) is used to evaluate ignition delay and combustion duration by dividing the amount of accumulated fuel or accumulated heat during the combustion period by the total fuel or total heat release [17,24,32]. Figure 5 shows the MFB at each blend ratio as well as 200 bar and 380 bar injection pressure. As shown in (a–c), a lower fuel injection pressure yields a slower rise of the MFB profile according to crank angle. There is no clear symptom for the combustion of the pilot injection at low injection pressure. When EGR is applied as shown as (d), the initial rise of MFB becomes slightly slower.
The combustion state occurring in the cylinder can be distinguished by the MFB. From the start of fuel injection, the crank position where the MFB becomes 10% is noted as CA10, and the point where the MFB becomes 90% is noted as CA90 [24,25,32,33]. The difference between the fuel injection start point and CA10 is called the flame-development angle or ignition delay, and the difference between CA10 and CA90 is called the rapid-burning angle or combustion duration. CA50 denotes where the MFB is 50%, which means that 50% of the injected fuel is converted to energy [32,33]. Table 4 shows the ignition delay and combustion delay calculated by analyzing the MFB at each experimental condition. Figure 6 is a graph comparing ignition delay and combustion duration under each condition.
As shown in Figure 6a,b, the ignition delay becomes shorter and the combustion duration becomes longer as the fuel injection pressure increases. However, ignition delay due to EGR application at a high injection pressure and the variation of combustion duration are small. The CA50 in Figure 6c is advanced with increasing fuel injection pressure and does not change with increasing biodiesel blend ratio and EGR.

3.1.3. Stability of Combustion

As shown in Figure 7, the COVs for IMEP under each experimental condition are all below 2.0%, which means the combustion is very stable [12,34]. Figure 7a,b are the measurements of PD20 and PD100 for IMEP during 200 cycles, respectively. The COV shown as (c) increases slightly as the fuel injection pressure increases, but this is considered to be caused by the improved combustion in the cylinder due to the improved atomization of the injected palm oil biodiesel. In addition, when biodiesel is applied, combustion due to increased oxygen content is improved and COV is lowered.

3.2. Emission Characteristics

3.2.1. Pollutant Emissions

Table 5 shows the levels of pollutant emissions which are NOx, Soot, HC, and CO on each test condition. Figure 8 shows the result of NOx and Soot. As the fuel injection pressure increases, the amount of NOx generated increases because the atomization of the injected fuel is improved and the combustion efficiency is increased. The same result is obtained even when the blend ratio of palm oil biodiesel increases. Furthermore, the amount of soot decreases as the fuel injection pressure increases.
Increased pressure improves atomization, reduces ignition delay and improves mixing with air in the cylinder, improving combustion conditions. This leads to an increase in NOx and at the same time a decrease in soot. By applying EGR at a high fuel injection pressure, the level of NOx generation can be reduced by lower combustion temperature while maintaining a slight increase in soot formation.
As shown in Figure 9, the emissions of CO and HC decrease as the fuel injection pressure increases. As the blend ratio of palm oil biodiesel increases, the CO and HC emissions are initially reduced, but increased again above a certain level. In the case of PD100, the CO and HC levels are similar under all injection pressure conditions.

3.2.2. Thermal Efficiency and Fuel Consumption

As the fuel injection pressure increases, the brake thermal efficiency increases and the fuel consumption decreases. As shown in Figure 10a, the BSFC of the higher injection pressure is lower, while (b) shows the Brake Thermal Efficiency according to fuel injection pressure and shows a much higher efficiency at the higher fuel injection pressure. The exhaust gas temperature rises as the Brake Thermal Efficiency increases, as noted in (c).
As the fuel injection pressure is increased, the atomization of the injected fuel is improved, the combustion efficiency is increased, and the fuel consumption rate is decreased. At low fuel injection pressures, an increase in blend ratio of palm oil biodiesel increases the BSFC. Therefore, when palm oil biodiesel is mixed and used, it is advantageous to improve fuel efficiency by increasing the fuel injection pressure. Moreover, the increase in BSFC due to the application of EGR is less than that observed with low fuel injection pressure. It can be seen that the increased NOx upon rising fuel injection pressure can be reduced by EGR implementation to an acceptable level without deterioration of fuel efficiency.

4. Discussion

As a result of this test, it was observed that the combustion pressure and heat release rate in the cylinder becomes higher as the fuel injection pressure increases. The increase in fuel injection pressure promotes the atomization of the injected fuel. Thus, the points of max combustion pressure and heat release were advanced. On the contrary, when the injection pressure was low, the size of the fuel droplet becomes larger, and the time required for the droplet to evaporate became much longer. Kannan et al. [16] and Agarwal et al. [17,35] investigated the effect of injection pressure on combustion characteristics and these studies showed that the combustion pressure and heat release rate on the condition of higher injection pressure tend to be high. Under low-speed conditions such as idling, the atomization of injected fuel is considered to have a significant effect on combustion. At lower fuel injection pressures in this study, the heat release by the combustion of pilot injection was not clear. This means the combustion of pilot injected fuel did not occur well. It is due to the larger droplet size by lower injection pressure and longer ignition delay.
The relationship on ignition delay about injection pressure can be confirmed by analysis of the Mass Fraction Burned (MFB). At lower injection pressures, ignition delay (which is the difference from the start of injection to CA10) increased, but the combustion duration (From CA10 to CA90) decreased. The overall combustion duration (ignition delay + combustion duration) of a lower injection pressure was longer than the one of higher injection pressure so that the combustion is delayed to the expansion phase. This phenomenon reduces combustion efficiency. Additionally, the point of CA50 was advanced. Other researchers [16,17,36] also found similar results about ignition delay and combustion duration by injection. And the study by Kuti et al. [37] investigated the ignition delay of biodiesel and diesel as the injection pressure increased from 100 to 300 MPa under simulated quiescent conditions in a constant-volume vessel. They found that the ignition delay decreased with the increasing of injection pressure. It could be attributed to the enhanced mixing achieved at increasing injection pressure.
Along with the oxygen content of biodiesel, the improvement of atomization by high injection pressures leads to increased NOx emissions and reduced CO, HC, and soot. Additionally, as increasing in injection pressure, BSFC was decreased as BTE increased, which shows the improvement of combustion. These results were similar to those by other researchers [4,17,36]. However, exhaust gas temperature was increased on lower injection pressure because of the poor combustion of pilot injection and long combustion duration by lower injection pressure. The increased NOx by the high injection pressure can be reduced by applying EGR to minimize soot increasing and fuel consumption without reduced engine power.

5. Conclusions

The effect of injection pressure of combustion and emission characteristics under low speed conditions on a diesel engine fueled with palm oil biodiesel were investigated.
The levels of combustion pressure and heat release were increased with the increase injection pressure. At low injection pressure, the combustion of pilot injection did not occur well. Additionally, the points of max combustion pressure and heat release were advanced, as reduced ignition delay increased injection pressure.
As increasing injection pressure, ignition delay was reduced, but combustion duration was increased. The overall combustion duration under lower injection pressure was longer because of longer ignition delay. The points of CA50 were advanced as increasing injection pressure.
Higher injection pressure reduced the exhaust emission such as CO, HC, and soot but increased the NOx emission due to shorter ignition delay by improved atomization and oxygen content in palm oil biodiesel. Additionally, BSFC is decreased by improved BTE due to improved atomization because of higher injection pressure. Applying EGR can reduce increased NOx by high injection pressure while minimizing soot emissions, fuel consumption, and power reduction.
To use palm oil biodiesel that has a higher viscosity than petroleum diesel in the commercial engines, the control of injection pressure is the most effective and easiest method to improve combustion efficiency. Further, another method is to the control of injection timing. Many studies [16,17] have been conducted to determine the optimum combustion state by controlling fuel injection pressure and injection timing simultaneously in a diesel engine fueled with biodiesel. However, in these studies, the speed conditions are higher than idle. In the future, the study on the combustion improvement of the combustion of palm oil biodiesel having high viscosity by injection timing under low-speed condition will be needed.

Author Contributions

H.Y.K. suggested this research, performed the experiments, analyzed all experimental data, and wrote this paper. J.C.G. performed the experiments and contributed to combustion analysis. N.J.C. performed the data analysis and contributed to the discussion, and supervised the work and the manuscript. All authors participated in the evaluation of the data, and reading and approving the final manuscript.

Funding

This research was supported by Basic Science Research Program through the National Research Foundation of Korea (NRF) funded by the Ministry of Education (No. 2016R1D1A1B03931616 and No. 2019R1I1A1A01057727), and the Korea government (MSIT) (No. 2019R1F1A1063154).

Conflicts of Interest

The authors declare no conflict of interest.

Abbreviations

The following abbreviations are used in this manuscript.
PDPalm Oil Biodiesel
CRDICommon-Rail Direct Injection
°CACrank Angle
NOxNitric Oxide
PMParticulate Matter
COCarbon Monoxide
HCHydrocarbon
PD00% Palm Oil Biodiesel + 100% Diesel
PD2020% Palm Oil Biodiesel + 80% Diesel
PD100100% Palm Oil Biodiesel + 0% Diesel
COVCoefficient of Variation
IMEPIndicated Mean Effective Pressure
dQ/dθHeat Release Rate
kSpecific heat ratio
PCombustion pressure
θCrank angle
VCylinder volume
VdDisplacement volume
rCompression ratio
RStroke-to-Bore ratio
m f ˙ Fuel flow rate
NEngine Speed
TEngine Torque
MFBMass Fraction Burned
BSFCBrake Specific Fuel Consumption
BTEBrake Thermal Efficiency
LHVLower Heating Value
CA10The crank angle of 10% Mass Fraction Burned
CA50The crank angle of 50% Mass Fraction Burned
CA90The crank angle of 90% Mass Fraction Burned
BTDCBefore Top Dead Center
ATDCAfter Top Dead Center

References

  1. Campbell, C.J.; Laherrère, J.H. The end of cheap oil. Sci. Am. 1998, 278, 78–83. [Google Scholar] [CrossRef]
  2. EU: Cars and Light Trucks. Available online: https://www.dieselnet.com/standards/eu/ld.php (accessed on 16 July 2019).
  3. Johnson, T.; Joshi, A. Review of Vehicle Engine Efficiency and Emissions. SAE Int. J. Engines 2018, 11, 1307–1330. [Google Scholar] [CrossRef]
  4. Gumus, M.; Sayin, C.; Canakci, M. The impact of fuel injection pressure on the exhaust emissions of a direct injection diesel engine fueled with biodiesel–diesel fuel blends. Fuel 2012, 95, 486–494. [Google Scholar] [CrossRef]
  5. Mahmudul, H.; Hagos, F.Y.; Mamat, R.; Adam, A.A.; Ishak, W.; Alenezi, R. Production, characterization and performance of biodiesel as an alternative fuel in diesel engines—A review. Renew. Sustain. Energy Rev. 2017, 72, 497–509. [Google Scholar] [CrossRef]
  6. Bajpai, D.; Tyagi, V.; Tripathy, D. Biodiesel: Source, Production, Composition, Properties and Its Benefits. J. Oleo Sci. 2006, 55, 487–502. [Google Scholar] [CrossRef] [Green Version]
  7. Ge, J.; Yoon, S.; Kim, M.; Choi, N. Application of canola oil biodiesel/diesel blends in a common rail diesel engine. Appl. Sci. 2017, 7, 34. [Google Scholar] [CrossRef]
  8. Ge, J.C.; Yoon, S.K.; Choi, N.J. Using Canola Oil Biodiesel as an Alternative Fuel in Diesel Engines: A Review. Appl. Sci. 2017, 7, 881. [Google Scholar] [CrossRef]
  9. Seo, Y.T.; Suh, H.K.; Lee, C.S. A study on the injection characteristics of biodiesel fuels injected through common-rail injection system. Trans. Korean Soc. Automot. Eng. 2007, 15, 97–104. [Google Scholar]
  10. Park, S.H.; Kim, H.J.; Suh, H.K.; Lee, C.S. A study on the fuel injection and atomization characteristics of soybean oil methyl ester (SME). Int. J. Heat Fluid Flow 2009, 30, 108–116. [Google Scholar] [CrossRef]
  11. Yusop, A.F.; Mamat, R.; Yusaf, T.; Najafi, G.; Yasin, M.H.M.; Khathri, A.M. Analysis of Particulate Matter (PM) Emissions in Diesel Engines Using Palm Oil Biodiesel Blended with Diesel Fuel. Energies 2018, 11, 1039. [Google Scholar] [CrossRef]
  12. Kim, H.Y.; Ge, J.C.; Choi, N.J. Application of Palm Oil Biodiesel Blends under Idle Operating Conditions in a Common-Rail Direct-Injection Diesel Engine. Appl. Sci. 2018, 8, 2665. [Google Scholar] [CrossRef]
  13. Ge, J.C.; Kim, H.Y.; Yoon, S.K.; Choi, N.J. Reducing volatile organic compound emissions from diesel engines using canola oil biodiesel fuel and blends. Fuel 2018, 218, 266–274. [Google Scholar] [CrossRef]
  14. Karavalakis, G.; Stournas, S.; Bakeas, E. Light vehicle regulated and unregulated emissions from different biodiesels. Sci. Total Environ. 2009, 407, 3338–3346. [Google Scholar] [CrossRef]
  15. Puhan, S.; Jegan, R.; Balasubbramanian, K.; Nagarajan, G. Effect of injection pressure on performance, emission and combustion characteristics of high linolenic linseed oil methyl ester in a DI diesel engine. Renew. Energy 2009, 34, 1227–1233. [Google Scholar] [CrossRef]
  16. Kannan, G.; Anand, R. Effect of injection pressure and injection timing on DI diesel engine fuelled with biodiesel from waste cooking oil. Biomass Bioenergy 2012, 46, 343–352. [Google Scholar] [CrossRef]
  17. Agarwal, A.K.; Dhar, A.; Gupta, J.G.; Kim, W.I.; Choi, K.; Lee, C.S.; Park, S. Effect of fuel injection pressure and injection timing of Karanja biodiesel blends on fuel spray, engine performance, emissions and combustion characteristics. Energy Convers. Manag. 2015, 91, 302–314. [Google Scholar] [CrossRef]
  18. Zahan, K.A.; Kano, M. Biodiesel Production from Palm Oil, Its By-Products, and Mill Effluent: A Review. Energies 2018, 11, 2132. [Google Scholar] [CrossRef]
  19. El-Araby, R.; Amin, A.; El Morsi, A.; El-Ibiari, N.; El-Diwani, G. Study on the characteristics of palm oil–biodiesel–diesel fuel blend. Egypt. J. Pet. 2018, 27, 187–194. [Google Scholar] [CrossRef]
  20. Lim, Y.K.; Jeon, C.H.; Kim, S.; Yim, E.S.; Song, H.O.; Shin, S.C.; Kim, D.K. Determination of fuel properties for blended biodiesel from various vegetable oils. Korean Chem. Eng. Res. 2009, 47, 237–242. [Google Scholar]
  21. Steiner, S.; Czerwinski, J.; Comte, P.; Popovicheva, O.; Kireeva, E.; Müller, L.; Heeb, N.; Mayer, A.; Fink, A.; Rothen-Rutishauser, B. Comparison of the toxicity of diesel exhaust produced by bio- and fossil diesel combustion in human lung cells in vitro. Atmos. Environ. 2013, 81, 380–388. [Google Scholar] [CrossRef] [Green Version]
  22. Yoon, S.K.; Kim, M.S.; Kim, H.J.; Choi, N.J. Effects of Canola Oil Biodiesel Fuel Blends on Combustion, Performance, and Emissions Reduction in a Common Rail Diesel Engine. Energies 2014, 7, 8132–8149. [Google Scholar] [CrossRef] [Green Version]
  23. Minnesota Statutes, 239.77 Biodiesel Content Madate. 2018. Available online: https://www.revisor.mn.gov/statutes/cite/239.77 (accessed on 12 August 2019).
  24. Heywood, J.B. Internal Combustion Engine Fundamentals; McGraw-Hill Education: New York, NY, USA, 1988. [Google Scholar]
  25. Alagumalai, A. Combustion characteristics of lemongrass (Cymbopogon flexuosus) oil in a partial premixed charge compression ignition engine. Alex. Eng. J. 2015, 54, 405–413. [Google Scholar] [CrossRef]
  26. Ryu, K. Effects of pilot injection timing on the combustion and emissions characteristics in a diesel engine using biodiesel–CNG dual fuel. Appl. Energy 2013, 111, 721–730. [Google Scholar] [CrossRef]
  27. Huang, Z. Combustion behaviors of a compression-ignition engine fuelled with diesel/methanol blends under various fuel delivery advance angles. Bioresour. Technol. 2004, 95, 331–341. [Google Scholar] [CrossRef]
  28. Amin, A.; Gadallah, A.; El Morsi, A.; El-Ibiari, N.; El-Diwani, G. Experimental and empirical study of diesel and castor biodiesel blending effect, on kinematic viscosity, density and calorific value. Egypt. J. Pet. 2016, 25, 509–514. [Google Scholar] [CrossRef] [Green Version]
  29. Huang, Z.H.; Liu, L.X.; Jiang, D.M.; Ren, Y.; Liu, B.; Zeng, K.; Wang, Q.; Huang, Z. Study on cycle-by-cycle variations of combustion in a natural-gas direct-injection engine. Proc. Inst. Mech. Eng. Part D J. Automob. Eng. 2008, 222, 1657–1667. [Google Scholar] [CrossRef]
  30. Lee, C.S.; Park, S.W.; Kwon, S.I. An Experimental Study on the Atomization and Combustion Characteristics of Biodiesel-Blended Fuels. Energy Fuels 2005, 19, 2201–2208. [Google Scholar] [CrossRef]
  31. Tziourtzioumis, D.N.; Stamatelos, A.M. Experimental Investigation of the Effect of Biodiesel Blends on a DI Diesel Engine’s Injection and Combustion. Energies 2017, 10, 970. [Google Scholar] [CrossRef]
  32. Cooney, C.P.; Yeliana; Worm, J.J.; Naber, J.D. Combustion Characterization in an Internal Combustion Engine with Ethanol−Gasoline Blended Fuels Varying Compression Ratios and Ignition Timing. Energy Fuels 2009, 23, 2319–2324. [Google Scholar] [CrossRef]
  33. Li, B.; Li, Y.; Liu, H.; Liu, F.; Wang, Z.; Wang, J. Combustion and emission characteristics of diesel engine fueled with biodiesel/PODE blends. Appl. Energy 2017, 206, 425–431. [Google Scholar] [CrossRef]
  34. Han, S.B. Investigation of cyclic variations of IMEP under idling operation in spark ignition engines. KSME Int. J. 2001, 15, 81–87. [Google Scholar] [CrossRef]
  35. Agarwal, A.K.; Dhar, A.; Gupta, J.G.; Kim, W.I.; Lee, C.S.; Park, S. Effect of fuel injection pressure and injection timing on spray characteristics and particulate size–number distribution in a biodiesel fuelled common rail direct injection diesel engine. Appl. Energy 2014, 130, 212–221. [Google Scholar] [CrossRef]
  36. Aalam, C.S.; Saravanan, C.; Anand, B.P. Impact of high fuel injection pressure on the characteristics of CRDI diesel engine powered by mahua methyl ester blend. Appl. Therm. Eng. 2016, 106, 702–711. [Google Scholar] [CrossRef]
  37. Kuti, O.A.; Zhu, J.; Nishida, K.; Wang, X.; Huang, Z. Characterization of spray and combustion processes of biodiesel fuel injected by diesel engine common rail system. Fuel 2013, 104, 838–846. [Google Scholar] [CrossRef]
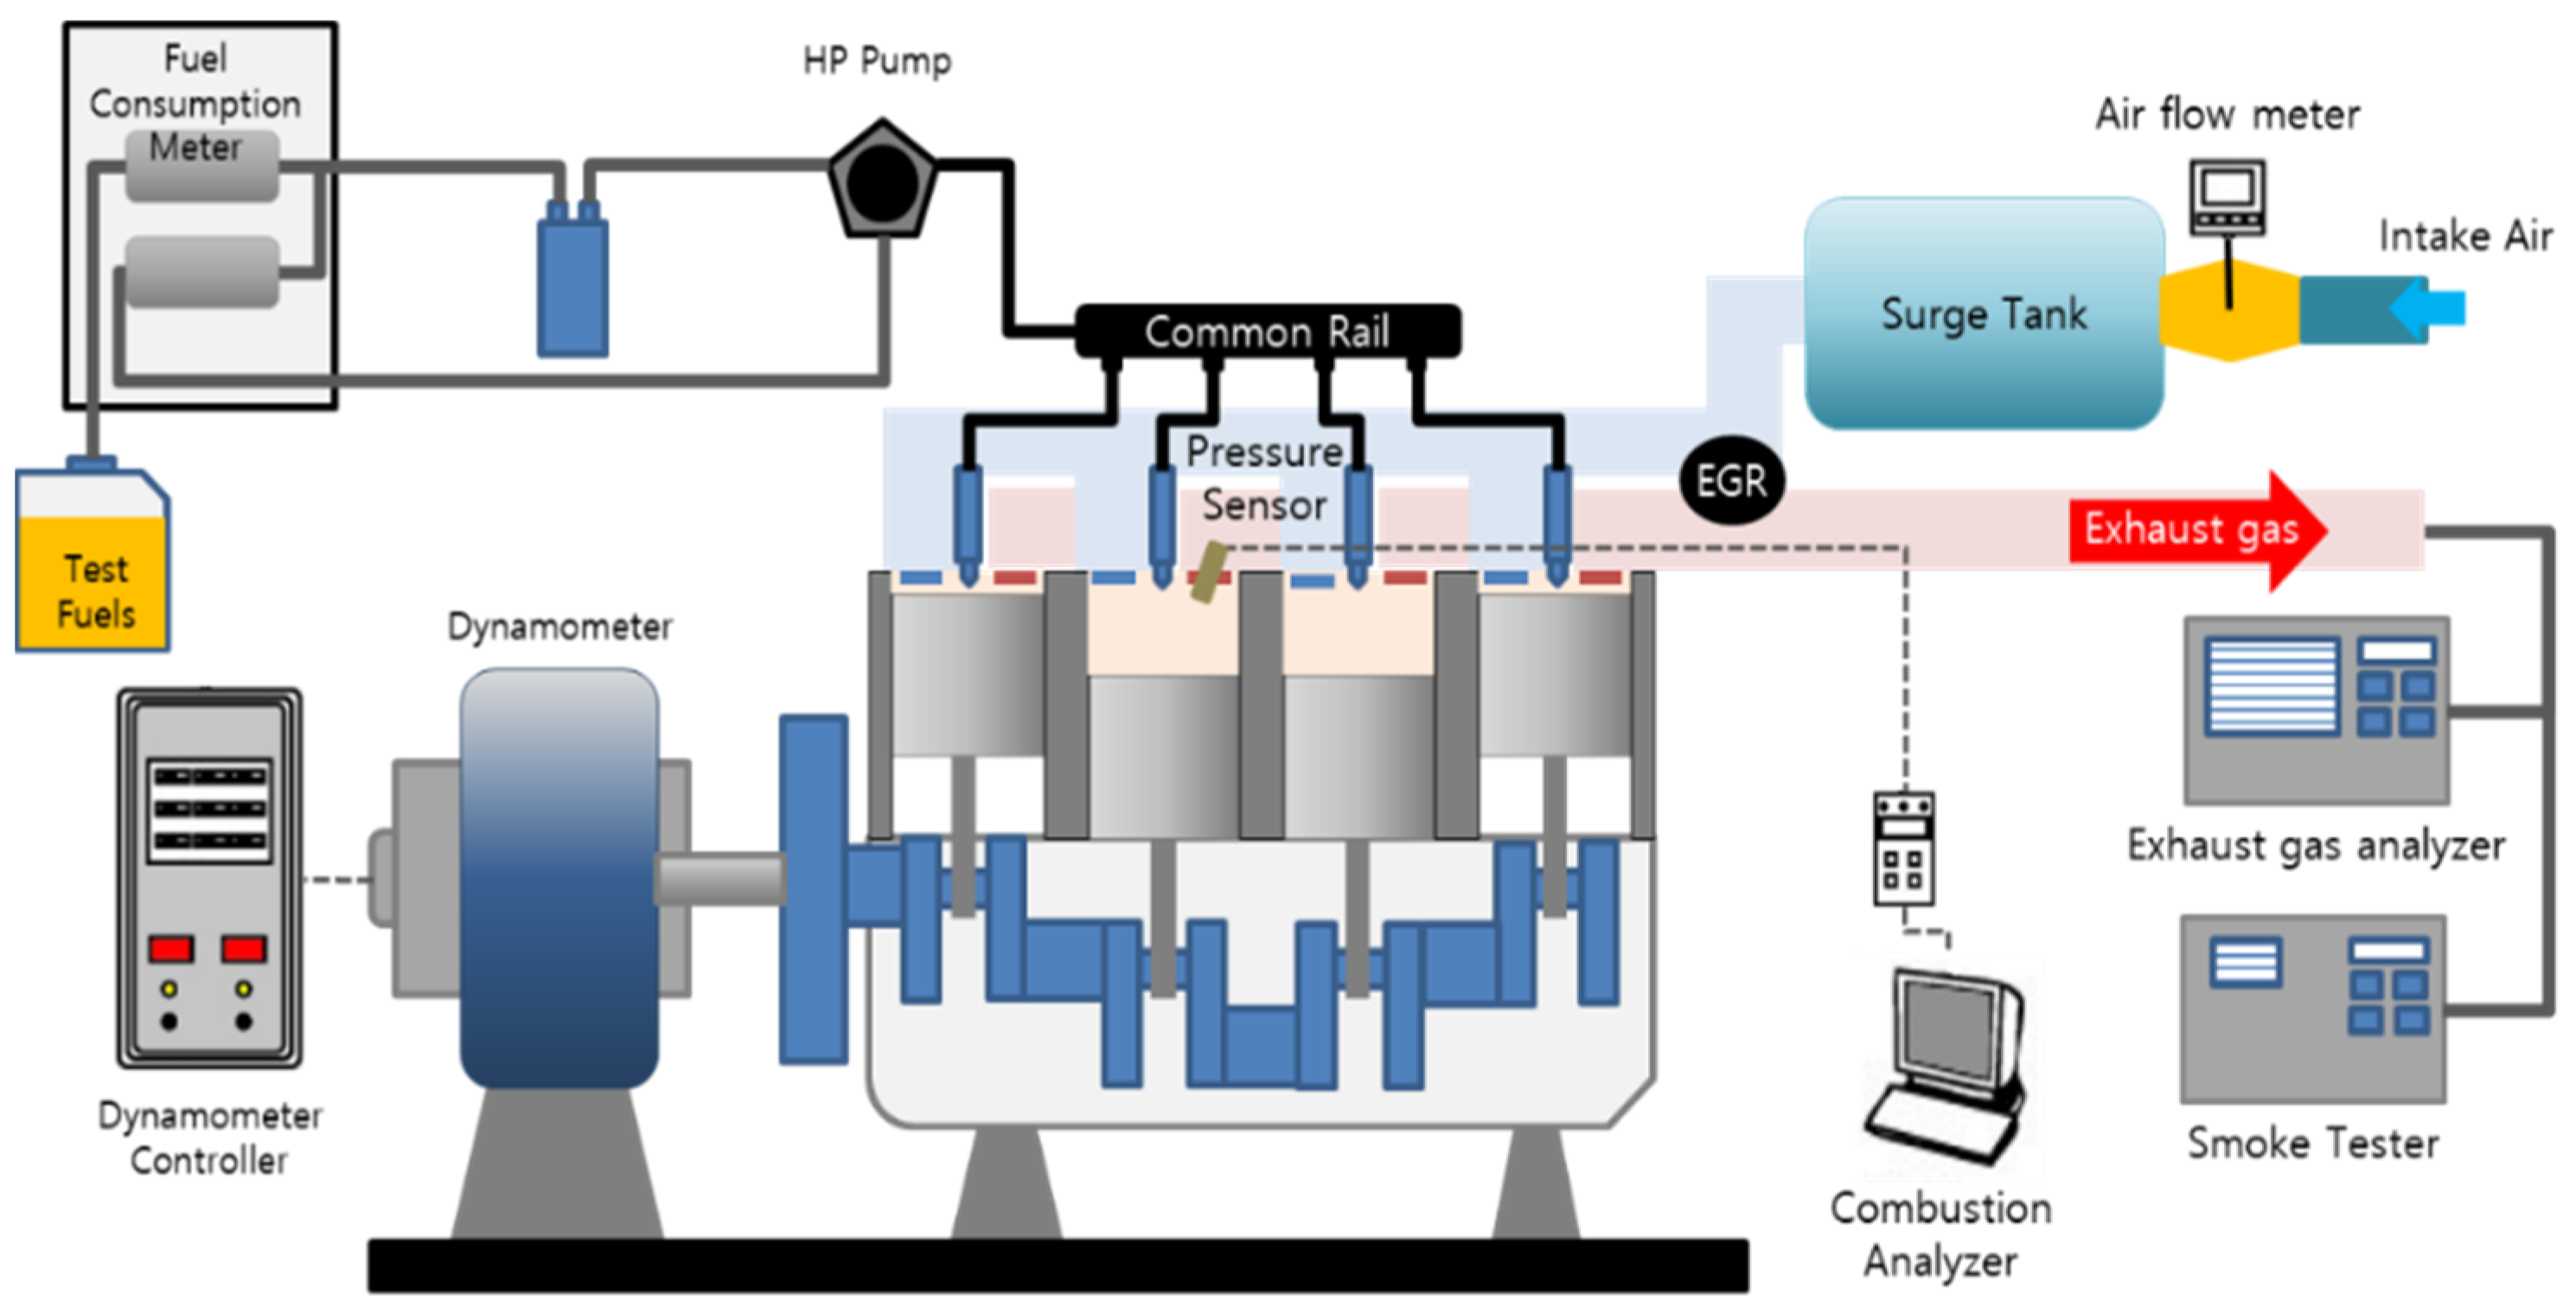
Figure 1. Schematic diagram of the experimental setups.
Energies 12 03264 g001
Figure 2. Injection timings and duration of pilot and main. (a) Injection Pressure 200 bar and (b) injection pressure 380 bar.
Energies 12 03264 g002
Figure 3. Combustion pressure and heat release rate. (a) PD0, (b) PD20, (c) PD100, and (d) all test fuels under 380 bar.
Energies 12 03264 g003
Figure 4. Combustion pressure and heat release rate with exhaust gas recirculation (EGR) rate 10% under 380 bar. (a) PD0, (b) PD20, and (c) PD100.
Energies 12 03264 g004
Figure 5. Mass Fraction Burned. (a) PD0, (b) PD20, (c) PD100, and (d) PD100 under 380 bar with EGR rate 10%.
Energies 12 03264 g005
Figure 6. Mass Fraction Burned. (a) Ignition delay, (b) combustion duration, and (c) CA50.
Energies 12 03264 g006
Figure 7. The variation of indicated mean effective pressure (IMEP) and coefficient of variation (COV). (a) IMEP of PD20, (b) IMEP of PD100, and (c) COV of IMEP.
Energies 12 03264 g007
Figure 8. NOx and PM. (a) NOx and (b) smoke opacity by PM.
Energies 12 03264 g008
Figure 9. CO (a) and HC (b).
Energies 12 03264 g009
Figure 10. Thermal Efficiency and fuel consumption. (a) brake specific fuel consumption (BSFC), (b) brake thermal efficiency (BTE), and (c) exhaust gas temperature.
Energies 12 03264 g010
Table 1. Properties of test fuels.
PropertiesDieselPalm Oil BiodieselTest Method
Density at 15 °C (kg/m3)836.8877ASTM D941
Viscosity at 40 °C (mm2/s)2.7194.56ASTM D445
Lower heating value (MJ/kg)43.9639.72ASTM D4809
Calculated cetane index55.857.3ASTM D4737
Flash point (°C)55196.0ASTM D93
Pour point (°C)−2112.0ASTM D97
Oxygen content (wt.%)011.26-
Sulfur content (wt.%)0.110.004ASTM D5453
Hydrogen content (wt.%)13.0612.35ASTM D5453
Carbon content (wt.%)85.7379.03ASTM D5291
Table 2. Engine specification.
Engine ParametersUnitSpecification
Engine Type-In-line 4 Cylinder, Turbocharged, EGR
Maximum Power/TorquekW/Nm83.5(@4000rpm)/255(@2000rpm)
Bore × Strokemm × mm83 × 92
Displacementcc1991
Compression Ratio-17.7: 1
Number of Injector nozzle holes-5
Injector type-Solenoid
Injector hole diametermm0.17
Table 3. Test conditions.
Table.UnitCondition
Engine Speedrpm750 ± 10 (idle speed)
Engine LoadNm40 *
Cooling Water Temperature°C85 ± 5
Intake Air Temperature°C25 ± 5
Fuel Injection Pressurebar200 & 380
Injection Timing°CAMain BTDC 2/Pilot BTDC 20
EGR rate%0 & 10
* To simulate the use of external load devices of the actual vehicle such as air conditioners and electric devices.
Table 4. Ignition delay and combustion duration under test conditions.
Test FuelsFuel Injection PressureEGR RateStart of Pilot Injection *Mass Fraction BurnedIgnition DelayCombustion Duration
CA10 *CA50 *CA90 *
(bar)(%)(°CA)(°CA)(°CA)(°CA)(°CA)(ms **)(°CA)(ms **)
PD0200-−20−39.217.0173.7204.4
380-−20−8.26.413.811.82.6224.9
38010−20−7.96.814.512.12.722.45.0
PD20200-−20−3.3916.616.73.719.94.4
380-−20−8.96.413.811.12.522.75.0
38010−20−8.36.613.911.72.622.24.9
PD100200-−20−1.49.216.518.64.117.94.0
380-−20−8.56.313.211.52.521.74.8
38010−20−7.26.613.512.82.820.74.6
* In the columns of Start of Pilot Injection, CA10, CA50, and CA90 in Mass Fraction Burned, a negative number means BTDC and a positive number means ATDC. ** The ignition delay and combustion duration can be converted to time by time (ms) = °CA/(0.006 × N) × 1000. Here, N is the engine speed (rpm) [24,25].
Table 5. Pollutant emissions.
Test FuelsFuel Injection PressureEGR RatePollutant Emissions
NOxSootHCCO
(bar)(%)(ppm)(%)(ppm)(%)
PD0200-4917.8210.061
380-9223.4200.060
380107184.1210.060
PD20200-5672.7200.054
380-10111.4190.050
380108242.7210.050
PD100200-5822.1210.053
380-10951.2210.053
380108761.9210.053