Article

Study on Flow and Heat Transfer Characteristics of Porous Media in Engine Particulate Filters Based on Lattice Boltzmann Method

1
School of Energy and Environmental Engineering, Hebei University of Technology, Tianjin 300401, China
2
National Engineering Laboratory for Mobile Source Emission Control Technology, China Automotive Technology & Research Center, Tianjin 300300, China
*
Author to whom correspondence should be addressed.
Energies 2019, 12(17), 3319; https://doi.org/10.3390/en12173319
Submission received: 18 July 2019 / Revised: 24 August 2019 / Accepted: 27 August 2019 / Published: 28 August 2019
(This article belongs to the Section J: Thermal Management)

Abstract

:
To investigate the laminar flow characteristics of porous media in the inner core of engine particulate filters, a two-dimensional lattice Boltzmann–Cellular Automata (LB–CA) probabilistic model is used to simulate the flow characteristics of porous media. The variation of dimensionless permeability of various numerical structures on pore scale with Reynolds number is analyzed, and the heat transfer as well as particle filtration are considered. The results show that the flow law of different structures obeys Darcy law under the condition of low Reynolds number (Re < 1). The dimensionless permeability coefficient of the ordered structure is significantly higher than that of the disordered structure; however. the filtration efficiency of the ordered structure decreases. With the increase of Reynolds number, the heat transfer increases. Furthermore, it is found that the particle size has a great influence on the filtration efficiency.

1. Introduction

Emission regulations are becoming increasingly strict all over the world. Euro 6 and China 6 have set strict emission standards for particulate matter. Particulate matter emitted from engines range in size from 10 nm to 1 μm [1,2], which cause serious damage to human health after being inhaled. According to the China 6 Standard [3], the particulate matter limit and particulate number limit of emission are 0.0045 g/km and 6 × 10¹¹ #/km, respectively. To solve this problem, people have developed the engine particulate filters, which is a very effective aftertreatment equipment and has been widely used to filter particulate matter in vehicles exhaust system. The internal material of the engine particulate filters is usually a wall-flow honeycomb ceramics with cordierite or silicon carbide as raw materials. By alternately blocking the ends of the holes of the honeycomb-like porous ceramics, the airflow is forced to pass through the wall composed of porous media, so that the particles are trapped in the wall holes, and the filtration efficiency can reach more than 90%. The structure principle is shown in Figure 1.
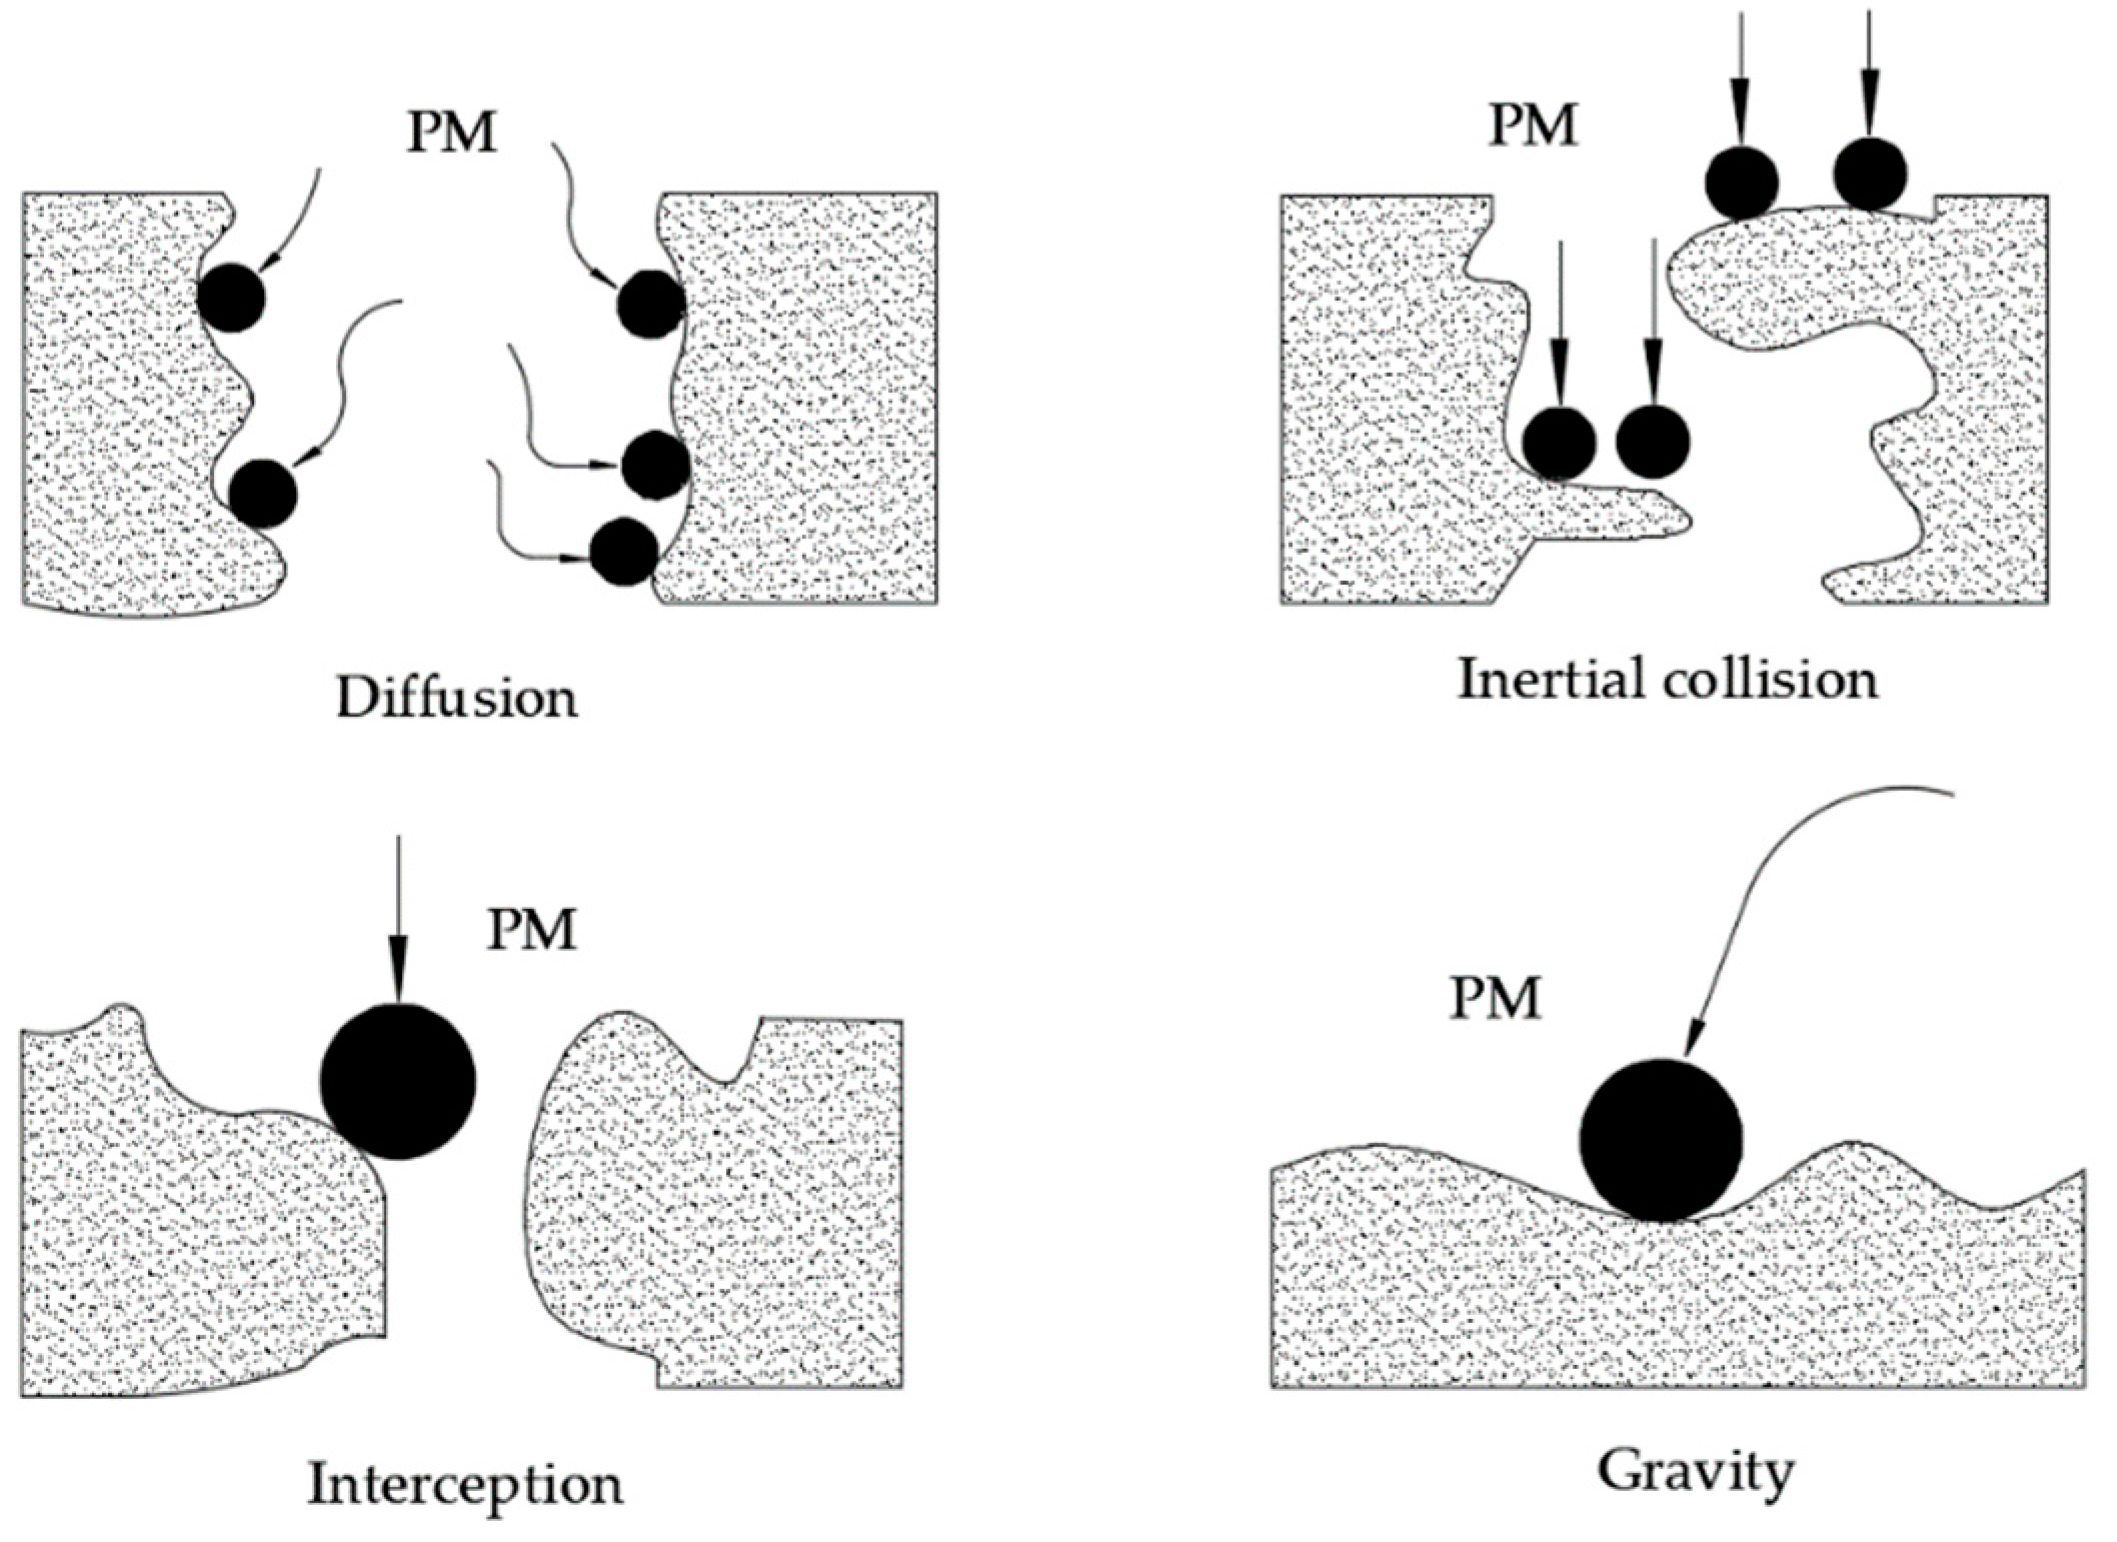
There are four main forms of particulate matter filtration on porous media walls, namely diffusion, inertia, interception and gravity [4]. Diffusion deposition is a process in which small particles are captured by fibers under Brownian force; inertial deposition is captured by collision with fibers when large particles move along airflow; interception deposition is captured when the particle size is larger than the pore size of fibers; gravity deposition is the gradual deposition of particles due to their own gravity movements between the pore. The schematic diagram of the filtration mechanism is shown in Figure 2.
The working environment of the particulate filters is extremely harsh, and it is in a high exhaust temperature environment. At the same time, because of the regeneration process, the temperature changes dramatically. Due to the uneven thermal stress, the particulate filters are prone to fracture. To ensure the high efficiency of the engine, the exhaust back pressure should be reduced as much as possible, and the filtration efficiency should be ensured at the same time, which puts forward higher requirements for the performance of the particulate filters. Cordierite is a typical material of particulate filters, which is sintered from magnesium aluminosilicate [5]. During the filtration process, soot particles will become very dense due to the deposition of soot particles, and there may be some zigzag paths and dead angles [5]. The pore scale LBM method is a direct way to apply LBM to porous flow based on detailed pore shape. The main advantage of pore LB simulation is that detailed flow information can be obtained in the medium, which is conducive to revealing the relationship between macroscopic seepage flow and microscopic mechanism. Therefore, the core of particulate filters with high solid volume fraction and complex geometric characteristics needs to be analyzed by pore size simulation.
There are three methods to simulate fluid flow and heat transfer: macroscopic, mesoscopic and microscopic. At the macroscopic level, fluid is assumed to be continuum, among which the finite difference method, among which the finite volume method and the spectral method belong to the macroscopic method. Lattice Boltzmann method is a mesoscopic method between macroscopic and microscopic. At the mesoscopic level, fluid is no longer assumed to be continuum. Therefore, the lattice Boltzmann method can be used to calculate small-scale fluid systems with macroscopic model failure. For the same fluid system, the macroscopic, mesoscopic and microscopic models all obey the conservation of mass, momentum and energy, so they are equivalent under certain conditions. However, according to different specific problems, the three models have their own scope of application.
According to Bao et al. [6], the spatial and temporal scales applicable to different numerical methods are shown in Figure 3.
Compared with traditional computational fluid dynamics methods, the lattice Boltzmann method has the following advantages:
(1) The pressure in the lattice Boltzmann method can be solved directly by the equation of state.
(2) It has high parallelism.
(3) It can directly simulate the flow field in the connected region such as porous media with complex geometric boundary, without the need for computational grids transformation.
In conclusion, it is necessary to simulate and analyze the flow and heat transfer of porous media in particulate filters using the lattice Boltzmann method on mesoscopic scale.
Many domestic and foreign scholars have studied the filtration mechanism of the engine particulate filters from macroscopic experiments and mesoscopic numerical simulation. Bensaid et al. [7] found that the flow field inside the filter has a great influence on the distribution of soot along the axial coordinate; the particle size of soot particles has a significant impact on the filtration efficiency; the most penetrating particle size is between 200 and 500 nm. Viswanathan et al. [2] changed the characteristics of imported particles and studied their effects on the filtration performance of cordierite materials. It was found that in the range of 100–200 nm particle size, the filtration efficiency is independent of the particle shape because of the dominant diffusion effect, while the particle mobility, particle size and particle deposition quality are the main factors affecting the performance of the particulate filters. Serrano et al. [8] proposed a wall-flow particulate filters filtration model based on spherical particle packed bed theory. It was found that under clean conditions, the filtration efficiency was related to the sticking coefficient. Moreover, with the change of loading soot particles, the dynamic changes of pressure drop and filtration efficiency depended on the thickness of soot layer. Liu et al. [9] established a two-dimensional gas-particle two-phase flow model in an inlet channel of diesel particulate filters. The Lagrangian method is used to simulate the movement and deposition of particles. The results show that drag force plays a major role in particle movement and deposition; with the increase of Peclet and Reynolds number, the inertia force of particles increases, while the influence of Brownian motion decreases. Lee et al. [10] established a stochastic overlapping solid sphere array model to represent the porous media of a particulate filters for a wall-flow diesel engine. The results show that the random overlapping array structure model can simulate the flow of porous media reliably and accurately in the range of solid volume fraction from 0.01 to 0.8. Kong et al. [11] established a two-dimensional mesoscopic gas-solid two-phase flow model, solved the flow using the incompressible lattice Boltzmann model, and described the transport of solid particles by cellular automata probability model. The results show that the inlet velocity has a great influence on the distribution of velocity field and pressure field in the channel. Compared with the influence of particle size, the influence of inlet velocity on particle deposition distribution is greater. Abchouyeh et al. [12] used the lattice Boltzmann method to numerically analyze the heat transfer of two-dimensional incompressible nanofluids around four sinusoidal obstacles in a horizontal channel. It is found that the distance and arrangement of obstacles are important parameters affecting the flow characteristics. With the increase of the concentration of nanoparticles and the decrease of the distance between obstacles, the average Nusselt number raises. Using the lattice Boltzmann method, Mohebbi et al. [13] studied the thermal gravitational convection of nanofluids in a Γ-shaped cover consisting of a local heater. The results show that with the increase of Rayleigh number and nanoparticle concentration, the mean Nusselt number would also increase. Lupše et al. [14] established the one-dimensional oxygen composition equation and energy equation in the filter wall perpendicular to the wall direction, considered the oxidation reaction and heat conduction in the filter wall, and carried out multiphase flow calculation. Galindo et al. [15] treated heat transfer between porous wall, particulate layer and pore fluid as two-dimensional thermal resistance, besides, the flow field uses a simplified one-dimensional flow heat transfer equation. Yamamoto et al. [16] simplified the porous medium structure to two-dimensional plate heat transfer. The fluid-solid interface considered that the temperature and heat flux were equal. The two-dimensional flow heat transfer calculation was carried out, while the study of particle movement needed to be further investigated. For the lattice Boltzmann method of pure particle flow, Eshghinejadfar et al. [17] used LBM model to consider the interaction between fluid and particles, and used thermal lattice calculation without considering the interaction between particles. Zhang et al. [18] used the lattice Boltzmann method as well as discrete element method to describe the interaction between particulate matter and fluid, particulate matter and particulate matter, in the meantime, they have carried out two-dimensional flow calculation without considering the effect of heat transfer.
In this paper, a two-dimensional LB–CA model is established to analyze Darcy flow and transition flow in porous media inside the core of an engine particulate filters on the pore scale of parallel arrangement structure, staggered arrangement structure, random arrangement structure and quartet structure generation set. The simulation of particulate matter is also carried out. The relationship between particle size and filtration efficiency is analyzed as well.

2. LBM Theoretical Model

2.1. Two-Dimensional LBM Model

The model adopted in this paper is D2Q9 model in LBM, and the velocity field can be obtained by the evolution of density distribution function. The sketch diagram of the velocity model is shown in Figure 4.
The speed configuration of the D2Q9 model is as follows [19]
e a = { ( 0 , 0 ) α = 0 c ( c o s [ ( a 1 ) π 2 ] , s i n [ ( a 1 ) π 2 ] ) α = 1 , 2 , 3 , 4 2 c ( c o s [ ( 2 α 1 ) π 4 ] , s i n [ ( 2 α 1 ) π 4 ] ) α = 5 , 6 , 7 , 8
where e a is the lattice velocity in α direction; and c = δ x / δ t ; δ x , δ t are the lattice spacing and time step in lattice unit respectively.
The evolution equation f α of its density distribution function is as follows [20]
f α ( r + e α δ t , t + δ t ) f α ( r , t ) = 1 τ [ f α ( r , t ) f α e q ( r , t ) ]
where f α is the distribution function, r is the position vector, f α e q is the equilibrium distribution function of particles in all directions, τ is a dimensionless relaxation. The equilibrium distribution function f α e q is defined as [21]
f α e q = ρ ω α [ 1 + ( e α · u ) c s 2 + ( e α · u ) 2 2 c s 4 u 2 2 c s 2 ]
where c s is the lattice sound speed, u is the velocity vector of the fluid, ω α is the weight coefficient, it as
ω α = { 4 / 9 α = 0 1 / 9 α = 1 , 2 , 3 , 4 1 / 36 α = 5 , 6 , 7 , 8
The macroscopic density and velocity of the fluid are ρ and u, respectively [22]
ρ = α f α
ρ u = α e α f α
The macroscopic pressure p is determined by the equation of state p = ρ c s 2 .
Since the temperature is a first-order scalar, the temperature model adopts D2Q4 model, which can reduce the calculation time and meet the accuracy requirement [23]. The evolution equation of temperature distribution function g α is [24]
g α ( r + e α δ t , t + δ t ) g α ( r , t ) = 1 τ g [ g α ( r , t ) g α e q ( r , t ) ]
where α = 1 , 2 , 3 , 4 , τ g is a dimensionless relaxation time based on thermal diffusion coefficient.
The temperature equilibrium distribution function g α e q is defined as [25]
g α e q ( r , t ) = ω α T ( r , t ) ( 1 + ( e α · u ) c s 2 )
where ω α = 1 / 4 .
Macro temperature is [25]
T = α g α

2.2. Boundary Conditions

The boundary conditions used in this paper are the periodic boundary and rebound boundary, where the inlet and outlet boundary are the periodic boundaries. When fluid particles leave the flow field from one boundary, they will enter the periodic boundary of the flow field from the other boundary at the next moment, which can strictly guarantee the mass and momentum conservation of the whole system. Periodic boundary processing format is [26]
f 1 , 5 , 8 ( 0 , j ) = f 1 , 5 , 8 ( N x , j )
f 3 , 6 , 7 ( N x + 1 , j ) = f 3 , 6 , 7 ( 1 , j )
The flow boundary condition is a standard rebound format, which is implemented as follows
f 2 , 5 , 6 ( i , 1 ) = f 4 , 7 , 8 ( i , 1 )
where f 4 , 7 , 8 ( i , 1 ) is obtained from f 4 ( i , 2 ) , f 7 ( i + 1 , 2 ) and f 8 ( i 1 , 2 ) respectively.
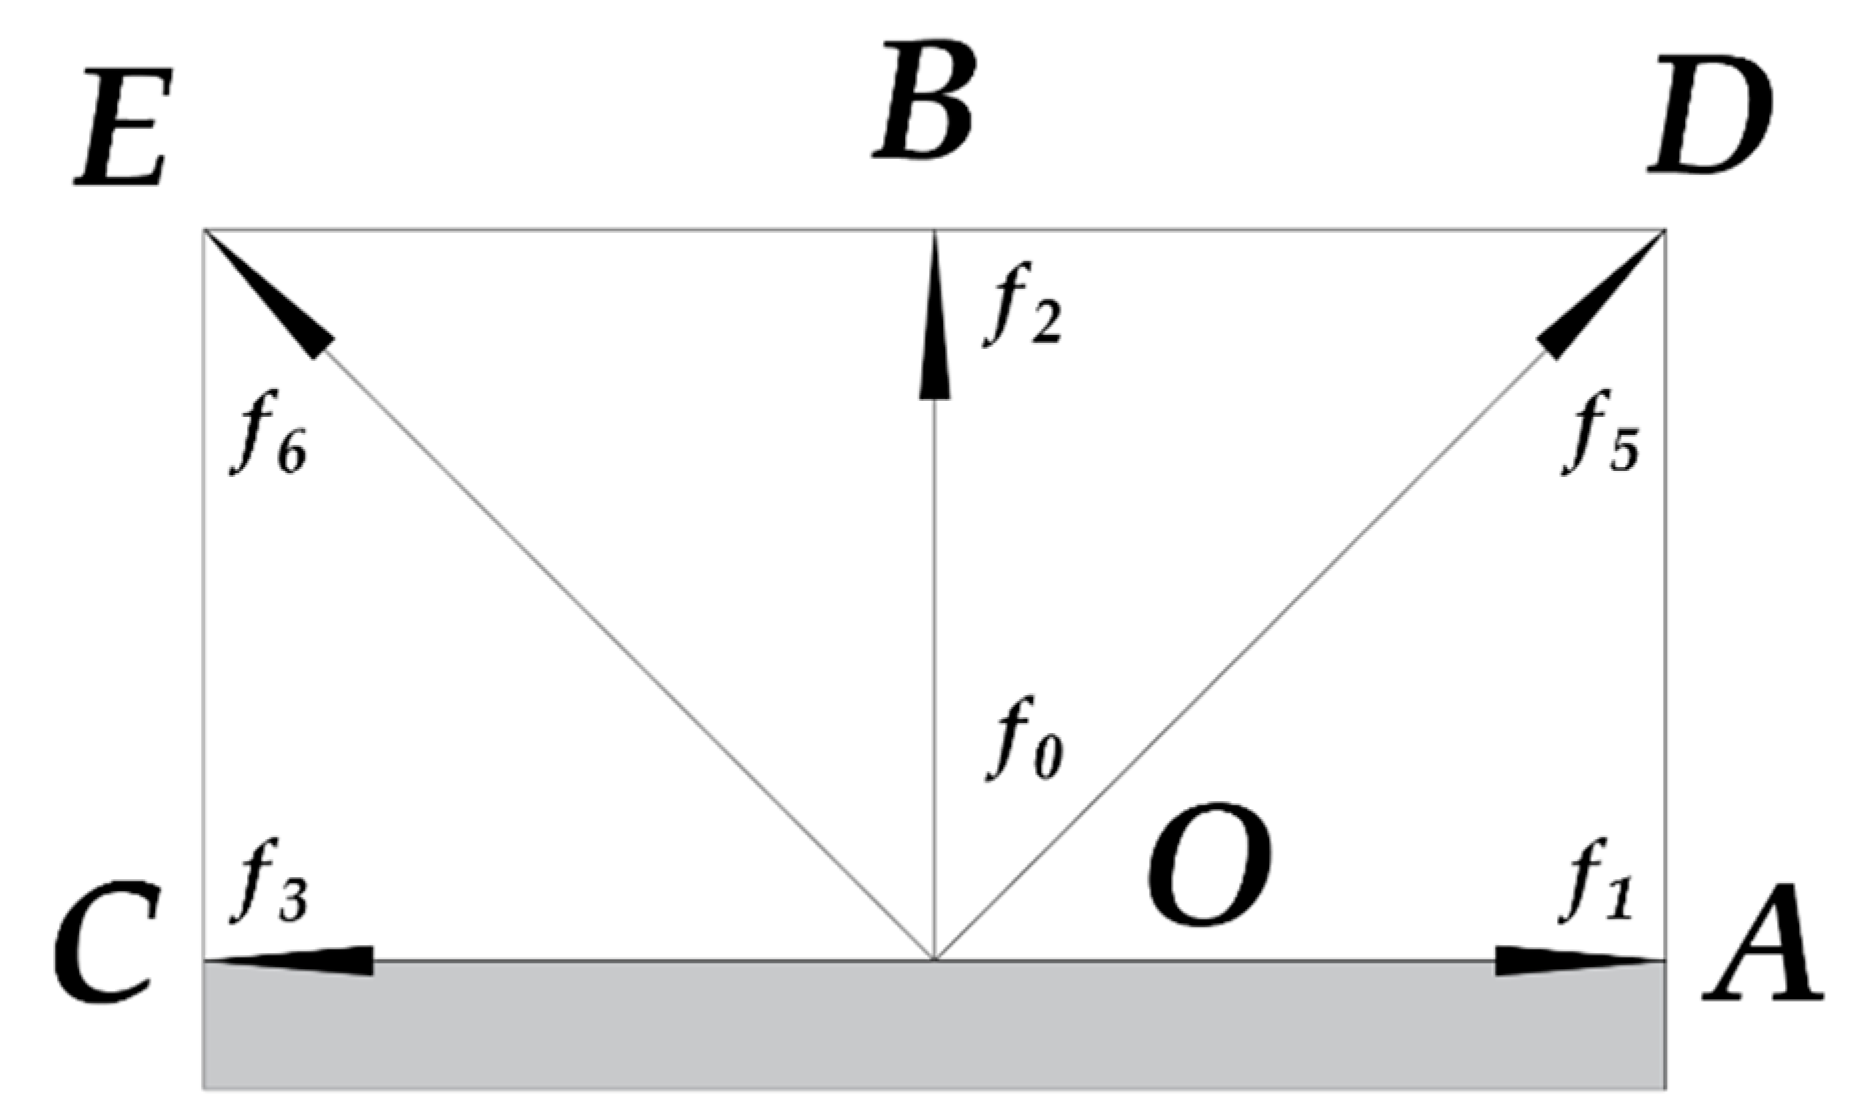
According to Guo et al. [27], the temperature boundary condition is a non-equilibrium extrapolation format. As shown in Figure 5, assuming that C, O, A is on the boundary and E, B, D is in the flow field.
The distribution function of boundary node O is as follows
g α ( O , t ) = g α e q ( O , t ) + [ g α ( B , t ) g α e q ( B , t ) ]

2.3. Construction of Porous Media by Quartet Structure Generation Set

A quartet structure generation set [28] can control the morphological characteristics of the medium by adjusting the parameters. The pore part is non-growth phase and the solid structure part is growth phase. The growth steps are as follows
(1) the growth core of the first growth phase is randomly generated on the grid with probability c d , which is less than the porosity ε .
(2) for each growth core, it grows to the direction of i with the probability d i .
(3) repeat step (2) until it reaches the given porosity ε .

2.4. Cellular Automata Model

Masselot and Chopard [29] proposed a cellular automaton probability model to describe particle transport, the probability of each particle moving to an adjacent node is proportional to the projection of the actual displacement of the particle in that direction, among which solid particles and fluid particles move on the same mesh node, besides, the probability of their moving to adjacent nodes is influenced by the combined effects of the local fluid flow, Brownian diffusion force and gravity. The average pore size of a common engine particulate filters is between 8 and 10 μm, and the smoke particles are almost 1 μm or less. Therefore, interception deposition is not considered in the simulation of particulate matter. According to the CA model improved by Wang et al. [30], particle motion is determined by the following equation [11,30]
d u p d t = F f + F B + F G = u u p τ p + ς ( 216 μ k B T π ρ p 2 d p 2 Δ t ) 1 / 2 + ( ρ p ρ ) g ρ p
where u p is the velocity of the particle, which is defined as u p = d X p / d t ; τ p is the relaxation time of the particle; and τ p = ρ p d p 2 / ( 18 μ ) ; ρ p is the particle density; d p is the particle diameter; μ is the dynamic viscosity of gas; ρ is the gas density; Ff is the drag force; FB is the Brownian force; FG is the gravity; ς is a zero-mean unit-variance independent Gaussian random number; k B is the Boltzmann constant; T is the gas temperature; g is the gravitational acceleration. The velocity and displacement of particles can be obtained by integrating the motion equation of particles with time t
u p * = u p e ( Δ t / τ p ) + ( u + F B τ p + ( ρ p ρ ) g τ p ρ p ) ( 1 e ( Δ t / τ p ) )
X p * = X p + ( u p u ) ( 1 e ( Δ t / τ p ) ) + ( u + ( ρ p ρ ) g τ p ρ p ) Δ t + ( Δ t + ( 1 e ( Δ t / τ p ) τ p ) ) F B τ p
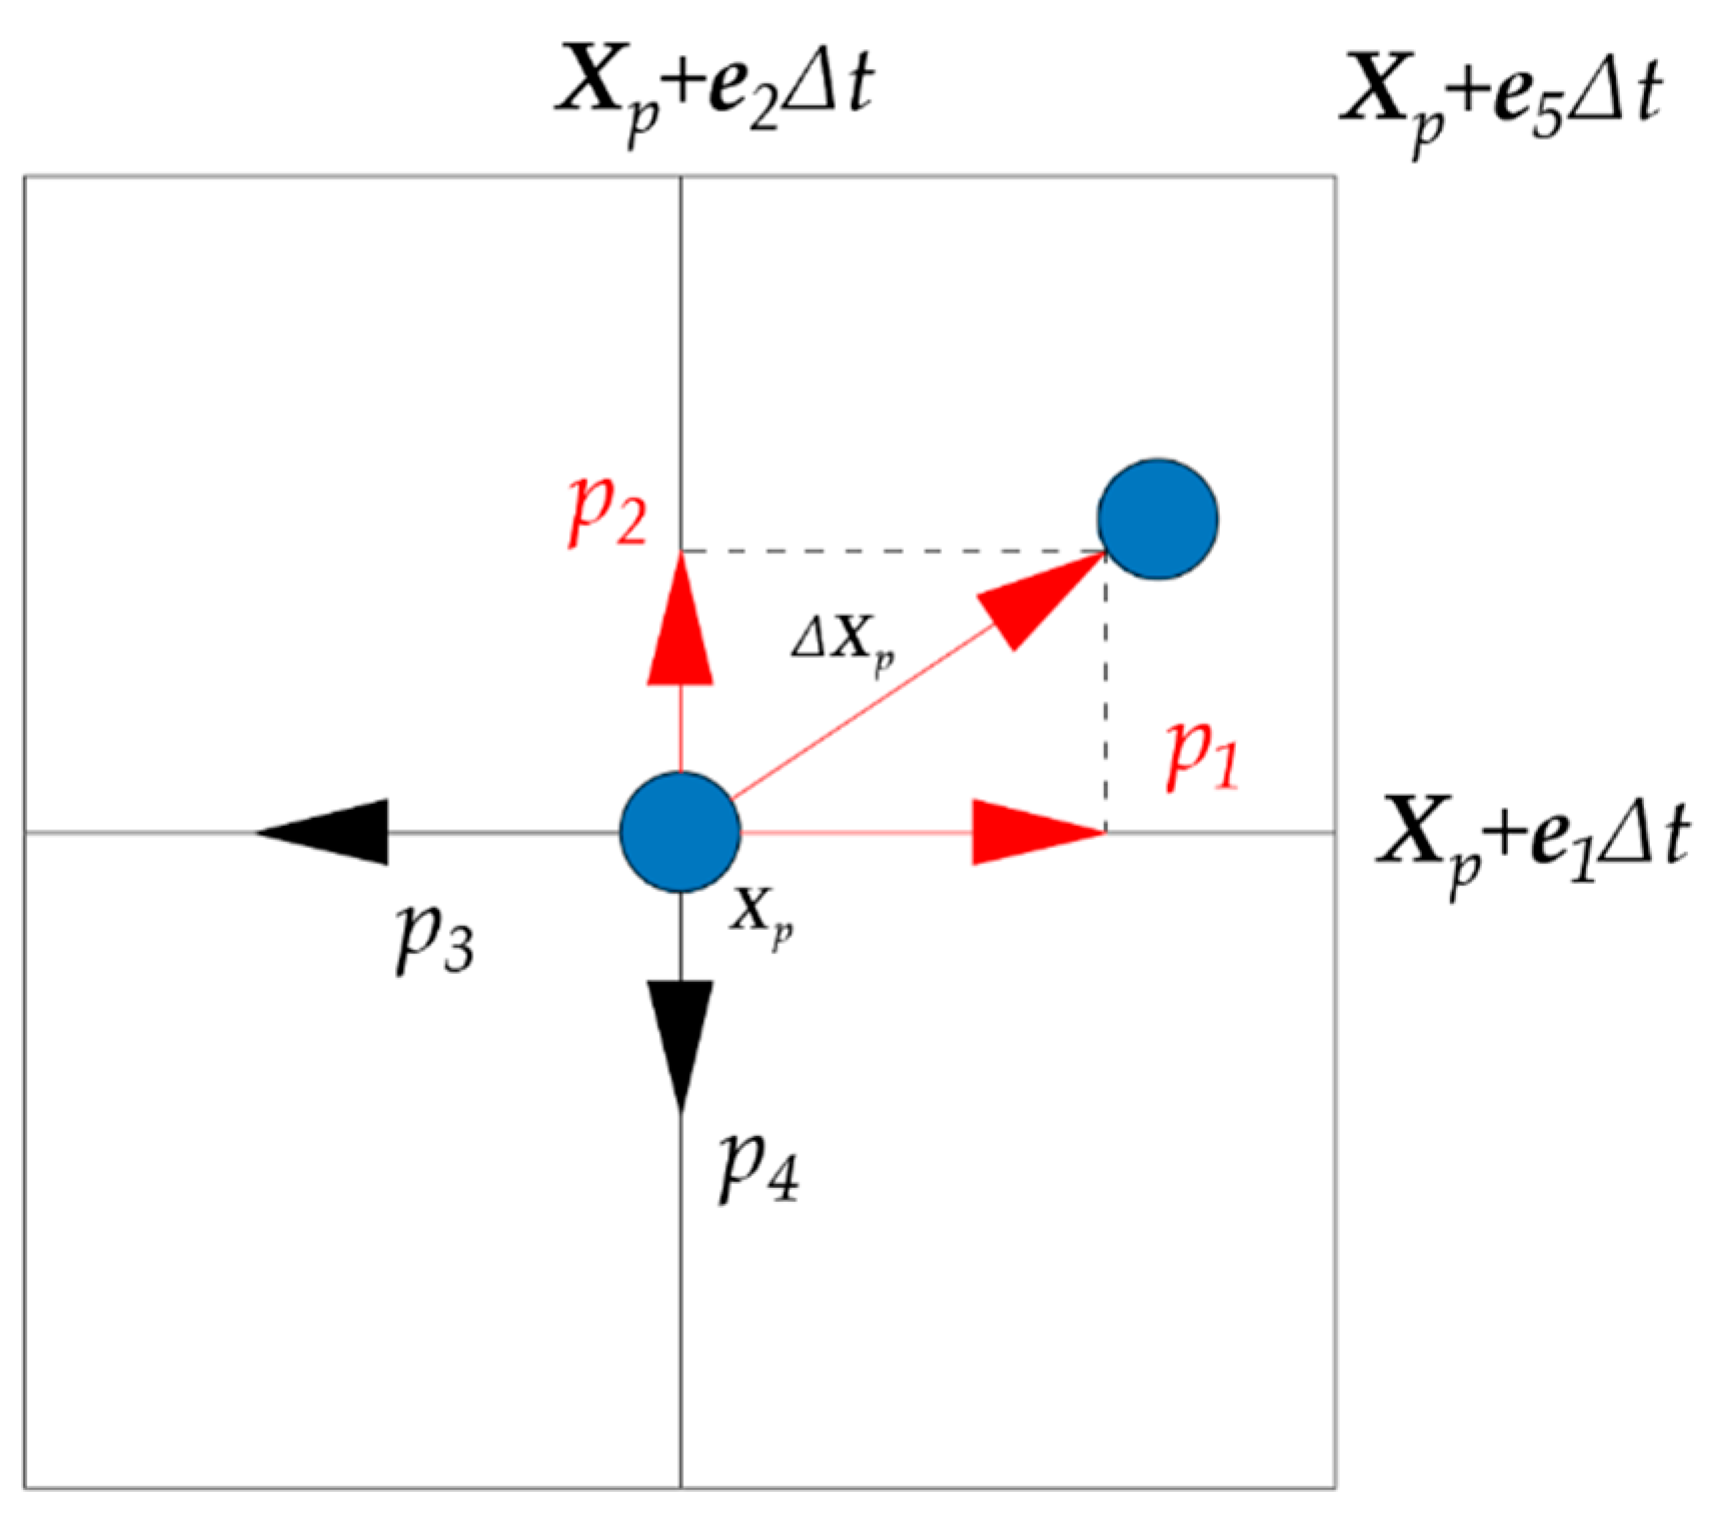
The superscript * denotes the next moment. The probability of particles moving east, north, west and south is p 1 , p 2 , p 3 and p 4 respectively, it can be calculated by D2Q9 model
p i = m a x ( 0 , ( u p · e i ) Δ t Δ x ) = m a x ( 0 , Δ x p Δ x · e i ) , i = 1 , 2 , 3 , 4
where Δ x p is the actual displacement of the particle within the time step Δ t , It can be known from Equation (16), Δ x p = X p * X p . Obviously, e i = e i + 4 . Depending on the probability of movement in directions 1, 2, 3, and 4, the solid particle may remain at the original node or move to the nearest adjacent node
X p * = X P + θ 1 e 1 + θ 2 e 2 + θ 3 e 3 + θ 4 e 4
where θ i is a Boolean variable, which equal to 1 with probability p i . As shown in Figure 6, p 1 > 0 , p 2 > 0 , p 3 = 0 , p 4 = 0 , so the particle may remain stationary with probability ( 1 p 1 ) ( 1 p 2 ) , or move to east with probability p 1 ( 1 p 2 ) , or north with probability p 2 ( 1 p 1 ) , or northeast with probability p 1 p 2 . The Monte Carlo method is used to determine the new position of the particle under the following conditions
{ i f   r 1 > p 1   a n d   r 2 > p 2 ,   X p * = X p i f   r 1 > p 1   a n d   r 2 > p 2 ,   X p * = X p + e 1 Δ t i f   r 1 > p 1   a n d   r 2 > p 2 ,   X p * = X p + e 2 Δ t i f   r 1 > p 1   a n d   r 2 > p 2 ,   X p * = X p + e 5 Δ t
where, r 1 and r 2 are two independent random numbers subject to uniform distribution on the interval [0,1]. By comparing ( r 1 , p 1 ) and ( r 2 , p 2 ) , the new location of particles can be determined.
In this study, a program for simulating the motion of fluids and particles was written using MATLAB. The flow chart of the LB–CA model algorithm is shown in Figure 7.

2.5. Program Validation

2.5.1. Lid Driven Cavity Flow

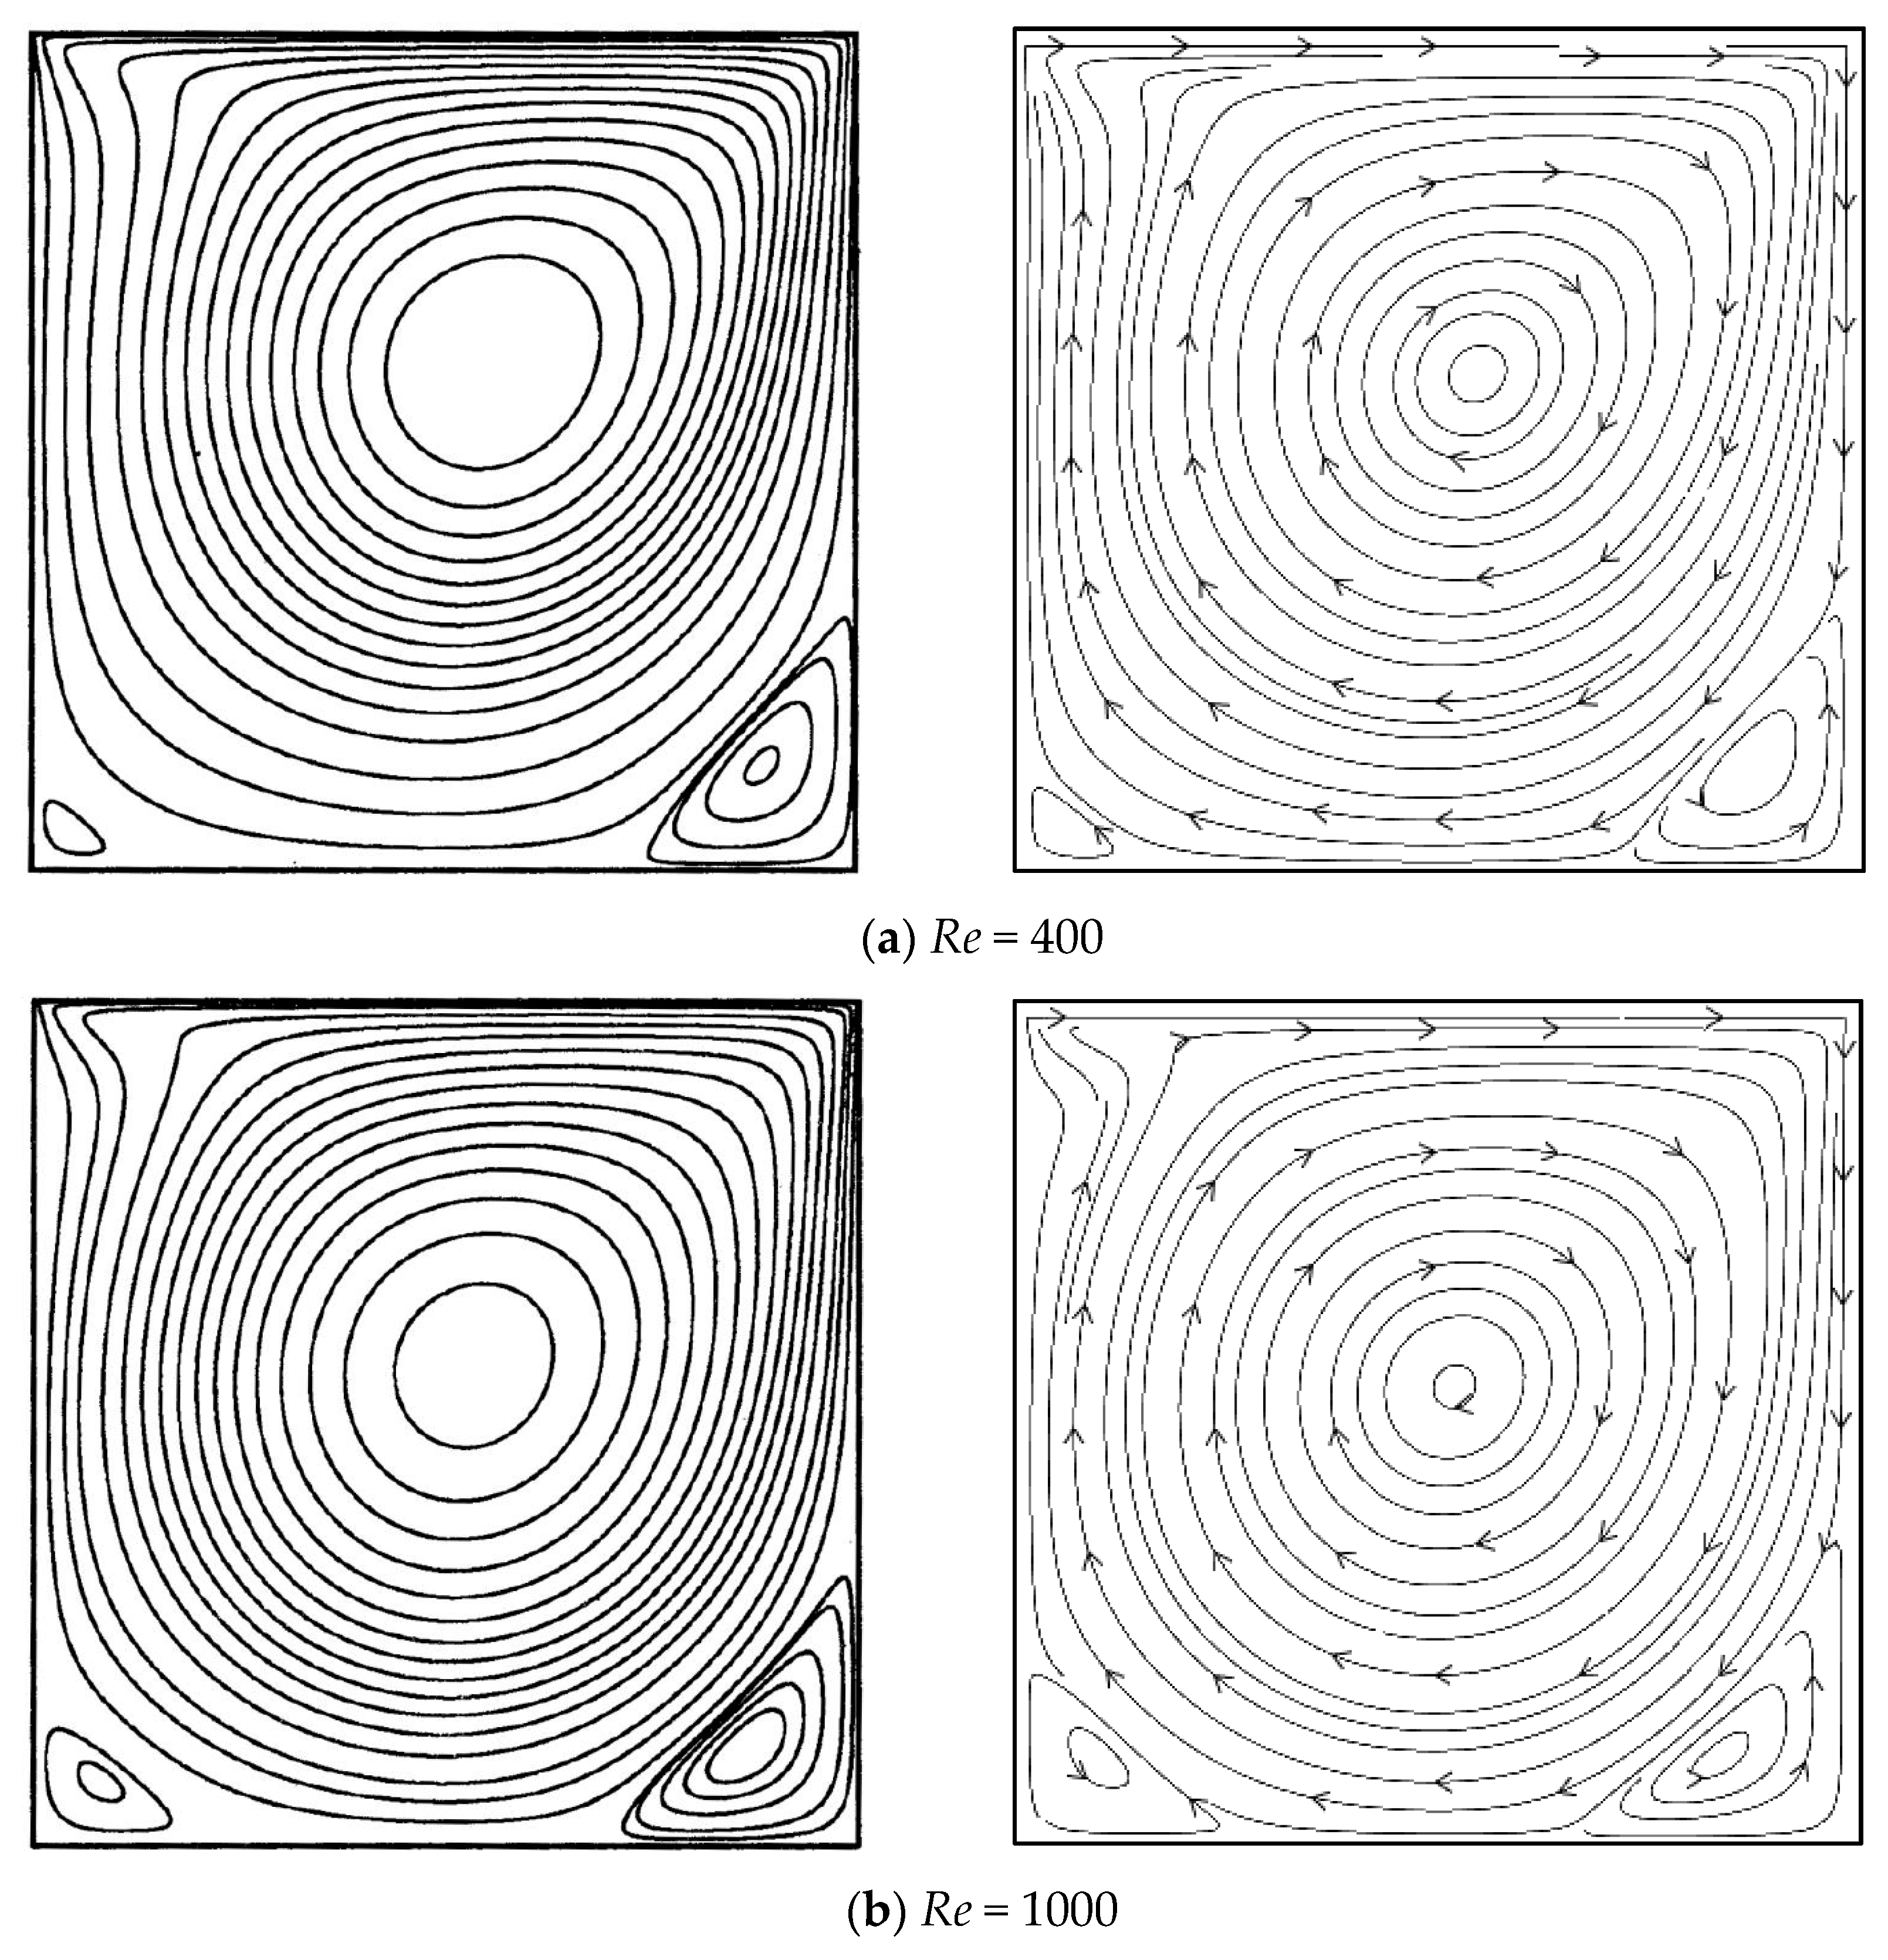
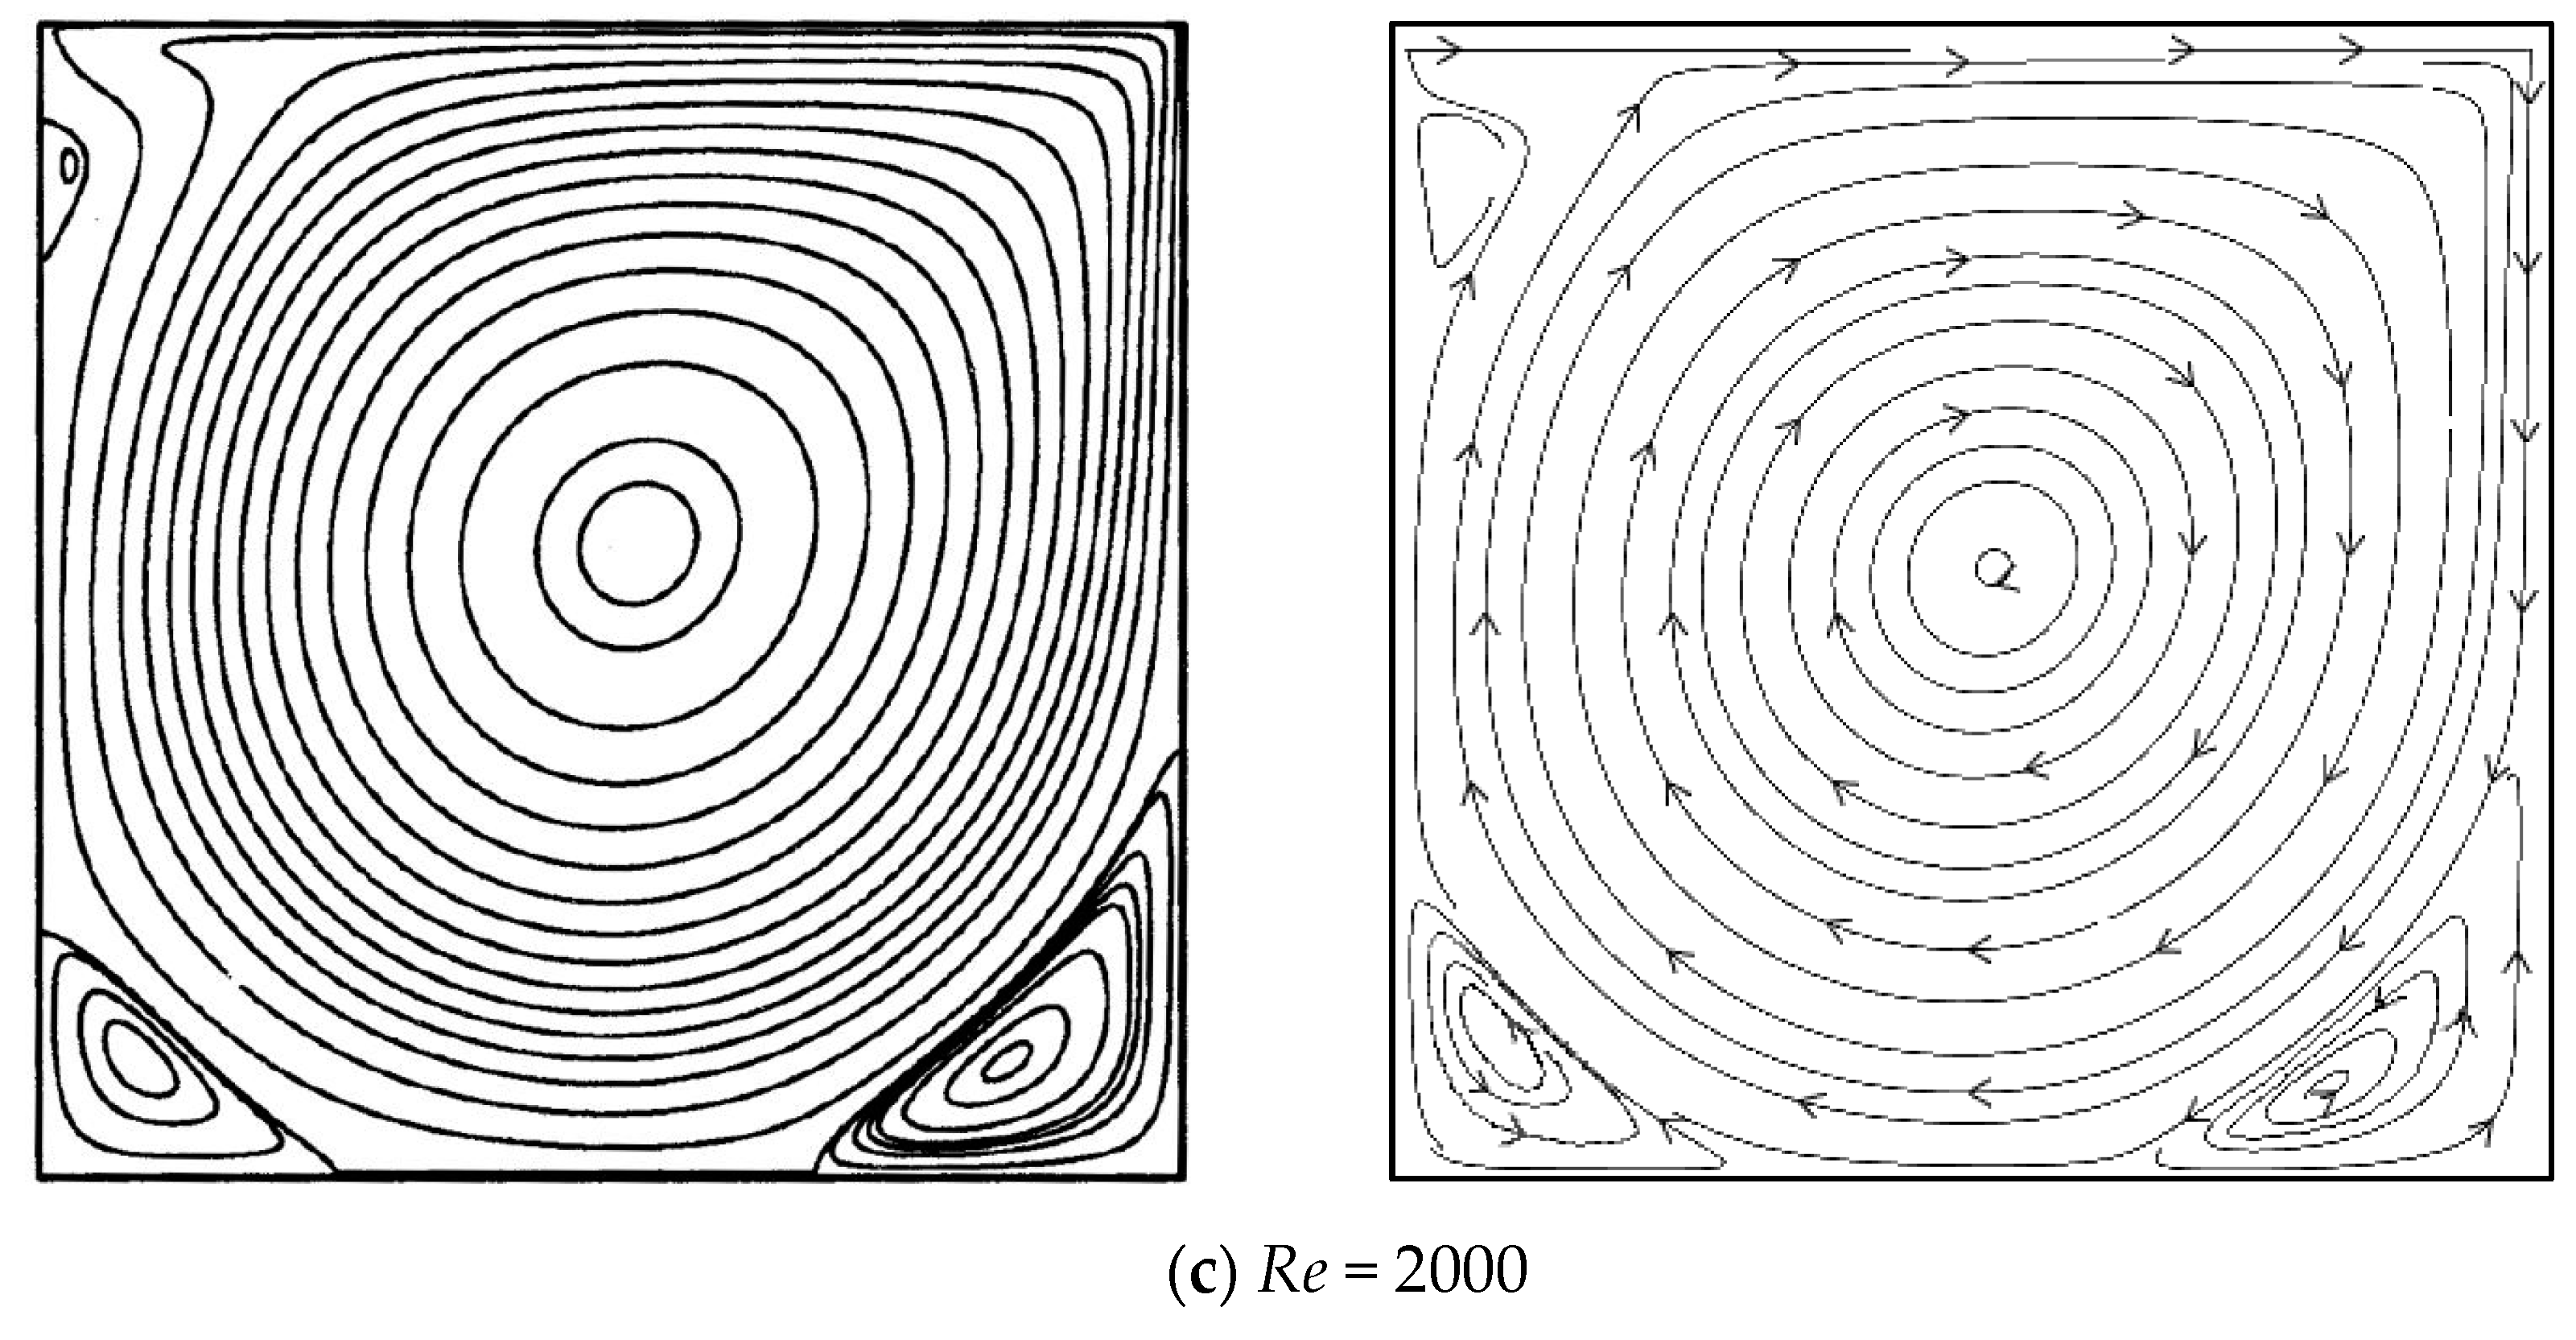
In this paper, an example of lid driven cavity flow was selected to validate the program. In the lid driven cavity flow, the upper boundary of the square cavity flows horizontally to the right at a constant speed, while the other three boundaries remain stationary. The flow characteristics are such that when the flow reaches a steady state, there is a large first-order vortex in the center of the square cavity, while a second-order vorticity appears in the lower left corner and the lower right corner, respectively. When the Reynolds number exceeds a critical value, a vortex will appear in the upper left corner of the square cavity. The grid number is 200 × 200, the initial density ρ of the flow field is 1; and the driving velocity u of the lid cover is 0.1.
Figure 7 shows the flow chart at the Reynolds number of 400, 1000 and 2000, respectively. It can be seen from the figure that when the Reynolds number is small, there is a first-order vortex in the center of the square cavity and a second-order vortex in the lower left corner and the lower right corner. When the Reynolds number is 2000, a second-order vortex appears in the upper left corner of the square cavity. With the increase of the Reynolds number, the center of the first-order vortex moves to the central position of the square cavity. In Figure 8, the left side shows the simulation results of literature [31]. It can be found that the simulation results are in good agreement with the literature.

2.5.2. Natural Convection in a Square Cavity

In this paper, a natural convection example in a 2D square cavity was selected to verify the temperature model. The height and width of the square cavity are H, as well as, the left wall is high temperature Th, while the right wall is low temperature Tc, and the upper and lower walls are adiabatic. The range of the Rayleigh number is 103–106, besides the Prandtl number is 0.71, and the mesh number is 100 × 100. Figure 9 shows the streamline and isotherm of the square cavity under different Rayleigh numbers. From the streamline diagram, it can be found that when the Rayleigh number is low, a vortex appears in the center of the square cavity. With the increase of the Rayleigh number, the vortices gradually become elliptical and break up into two vortices. In addition, when Ra =106, the two vortices move to the walls on both sides, and a third vortices appear in the center of the square cavity. From the isotherm diagram, it can be concluded that with the increase of the Rayleigh number, the main mode of heat transfer gradually changes from heat conduction to convection. At a low Rayleigh number, the isotherm is basically vertical distribution. Moreover, with the increase of the Rayleigh number, the isotherm only distributes vertically on both sides of the wall but horizontally in the center of the square cavity. The above results are very close to the simulation results of Guo et al. [32], de Vahl Davis et al. [33], and Hortmann et al. [34].

2.5.3. Poiseuille Flow in 2D Porous Media

The Poiseuille flow of porous media filled with staggered structures between plates is considered. According to Hu [35], when the flow field reaches the steady state, the flow control equation is as follows:
ν 2 u y 2 + ε G x ε ν k u ε F ε k u 2 = 0
where, ν is the kinematic viscosity; ε is the porosity; G x is the volume force; k is the permeability; and F ε is the structure function related to ε . Ignoring the nonlinear inertia effect ( F ε = 0 ), by solving the above equation, the following equation can be obtained
u ( y ) = G x k ν ( 1 c o s h ( λ ( y H 2 ) ) c o s h ( λ H 2 ) )
where, λ = ε k , H is the length of the calculation domain.
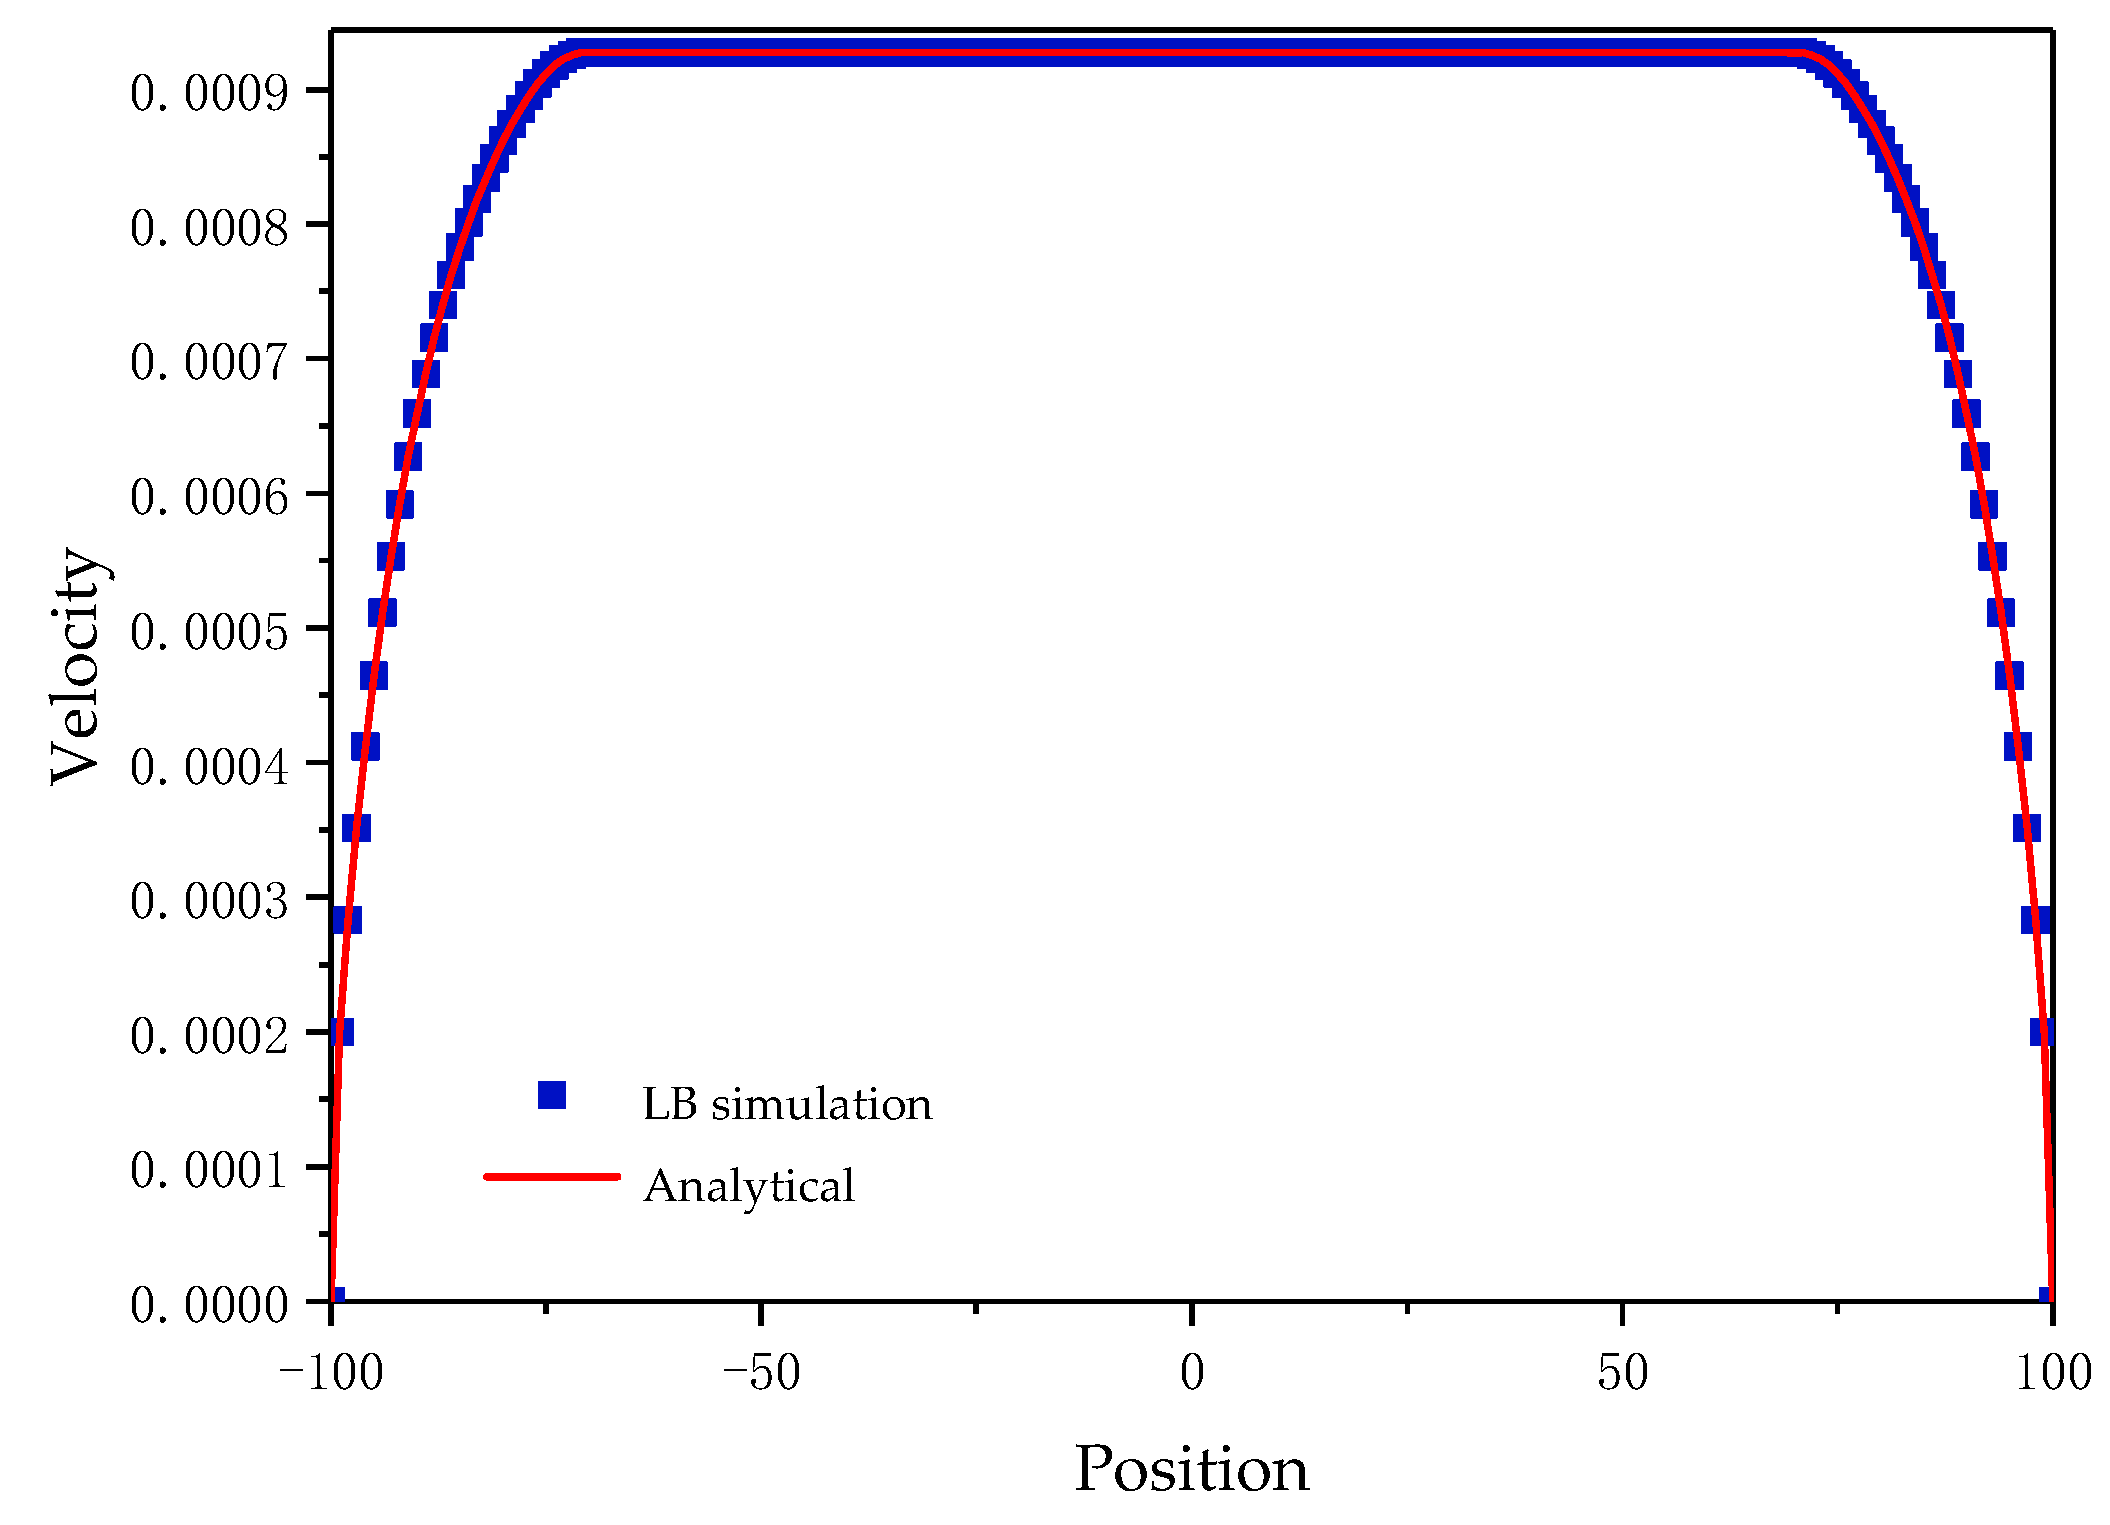
In the example, the calculation domain is 200 × 200, the porosity of porous media between plates is 0.2; the inlet and outlet are periodic boundaries, and the upper and lower walls between plates are standard rebound boundaries. The initial density is 1, the Reynolds number is 0.1, and the criterion of program convergence is
u n + 1 u n 2 u n + 1 2 10 8
Figure 10 shows the velocity distribution of the longitudinal section of the simulated region and the comparison with the analytical solution. It can be found that the simulation results agrees well with the analytical solutions.

2.5.4. CA Model Validation

To verify the validity of the probability model of cellular automaton established in this paper, LB-Lagrangian method and LB–CA method were used for comparison. According to Wang et al. [36], the validation example was the gas-solid two-phase flow at the backward-facing step, and the calculation region was shown in Figure 11.
The effect of particle motion on flow is not taken into account, while Re = 496, and velocity of inlet is
u ( y ) = u m a x y h h ( 1 y h h ) ,   h y 2 h
where u m a x is the maximum velocity of inlet along the center line, and its value is 1. The boundary condition is non-slip, besides, the outlet is considered to be fully developed. The mesh number of calculation area is 50 × 750. Particles are injected to the special positions of the inlet (numbered 1,2).
Figure 12 shows the trajectories of particles in the flow field calculated by the LB-Lagrangian method and LB–CA method. It was found that the particle trajectories calculated by the two methods are in good agreement with Wang’s results.

2.5.5. Mesh Sensitivity Analysis

The effect of grid on dimensionless permeability is shown in Figure 13. The results show that the dimensionless permeability is sensitive to the grid density. In this paper, the difference of permeability from the number of grids 50 × 50 to 500 × 500 is calculated. As shown in the figure, when the number of grids increases to 150 × 150, the permeability hardly changes any more, but with the increase of the number of grids, the calculation time increases significantly. Therefore, 200 × 200 grids are selected to ensure the accuracy of calculation and reduce the calculation time.

3. Results and Discussion

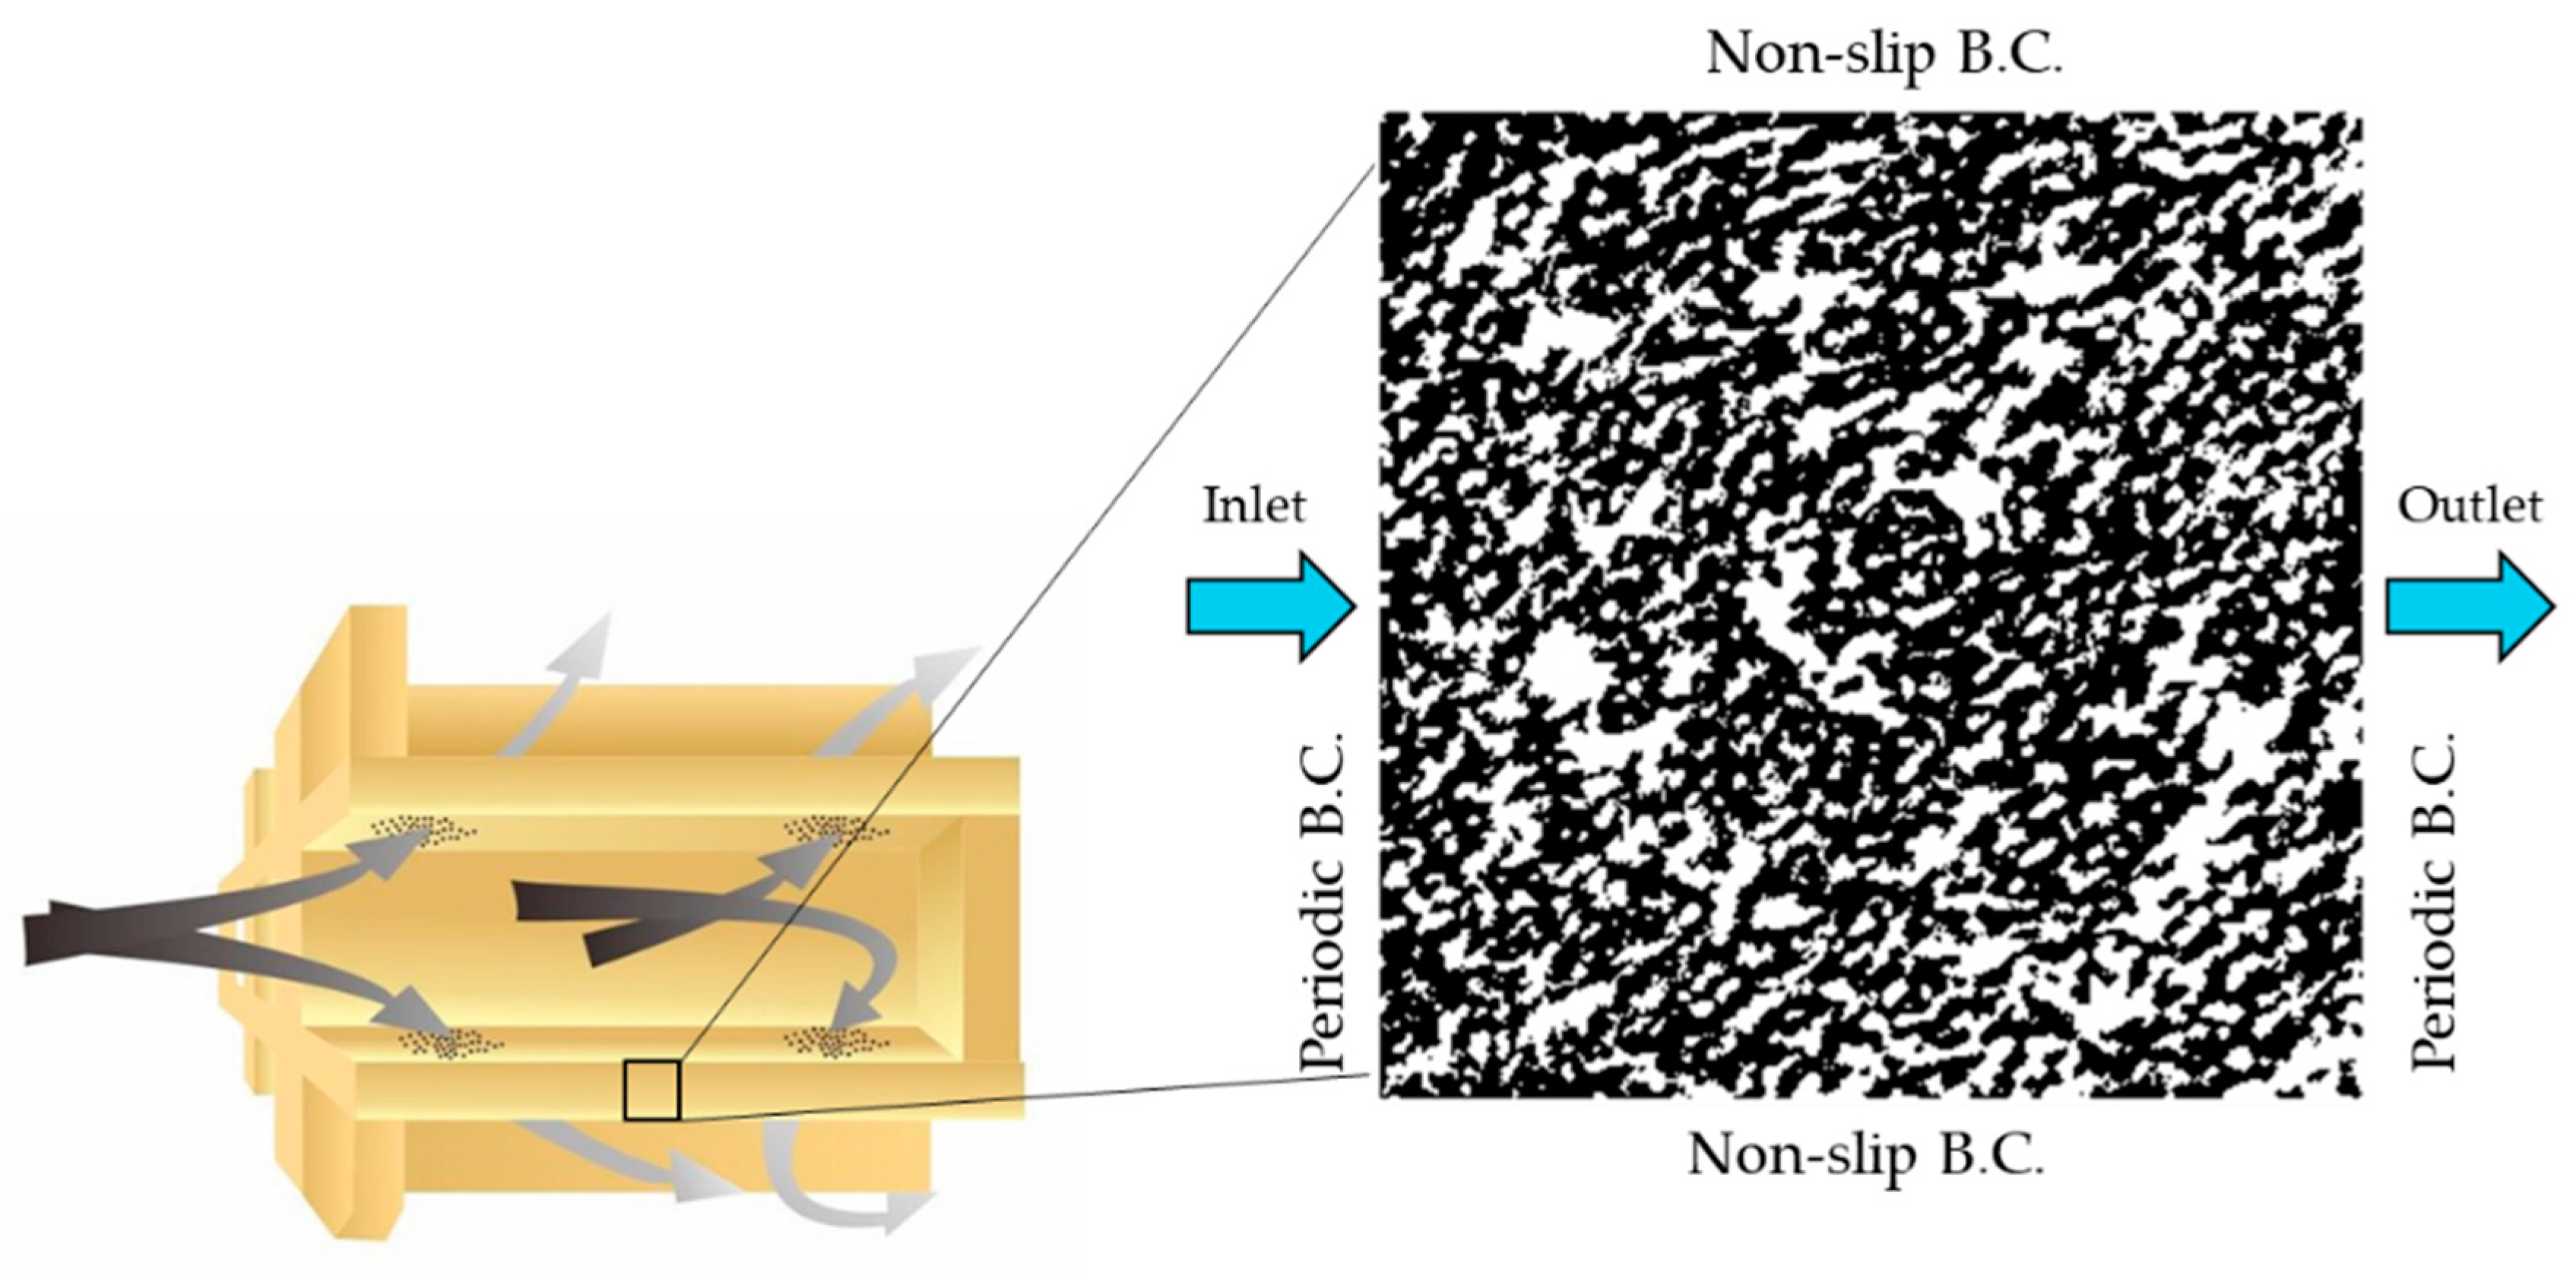
A Skyscan 1174v2x-ct tomographic scanner was used to take the sample of the engine particulate filters. The material of sample is cordierite. The area of the sample was the inner wall of the filter channel with 23.1 um pixels. Five valid images were sampled at intervals of 0.1 mm in the direction of passing through the wall. Figure 14 is schematic diagram of the calculation area. The black area is porous and the white area is solid. The image was imported into Photoshop to collect the number of black and white pixels, and the porosity of the sample was calculated to be about 0.6. It can be seen from the figure that its material is anisotropic, but because its wall thickness is too small, it is impossible to collect enough pictures for three-dimensional modeling. Therefore, four numerical methods, namely parallel arrangement structure, staggered arrangement structure, random structure and QSGS, are used to generate the model of porous material inside the particulate filters. Among them, the parallel arrangement structure, the staggered arrangement structure and the random structure are composed of a certain number of circular fibers with equal diameter in order or random arrangement. According to Liu and Wang [37], and Yazdchi et al. [38,39], the model can well characterize the steady-state filtration process of porous media. The porosity of the engine particulate filters is generally between 0.5 and 0.7 [40]. Meanwhile, according to the results of tomography, the porosity discussed in the numerical model established in this paper is 0.6. At the same time, the flow characteristics with other porosities are briefly analyzed.

3.1. Flow and Heat Transfer Analysis of Parallel and Staggered Structures

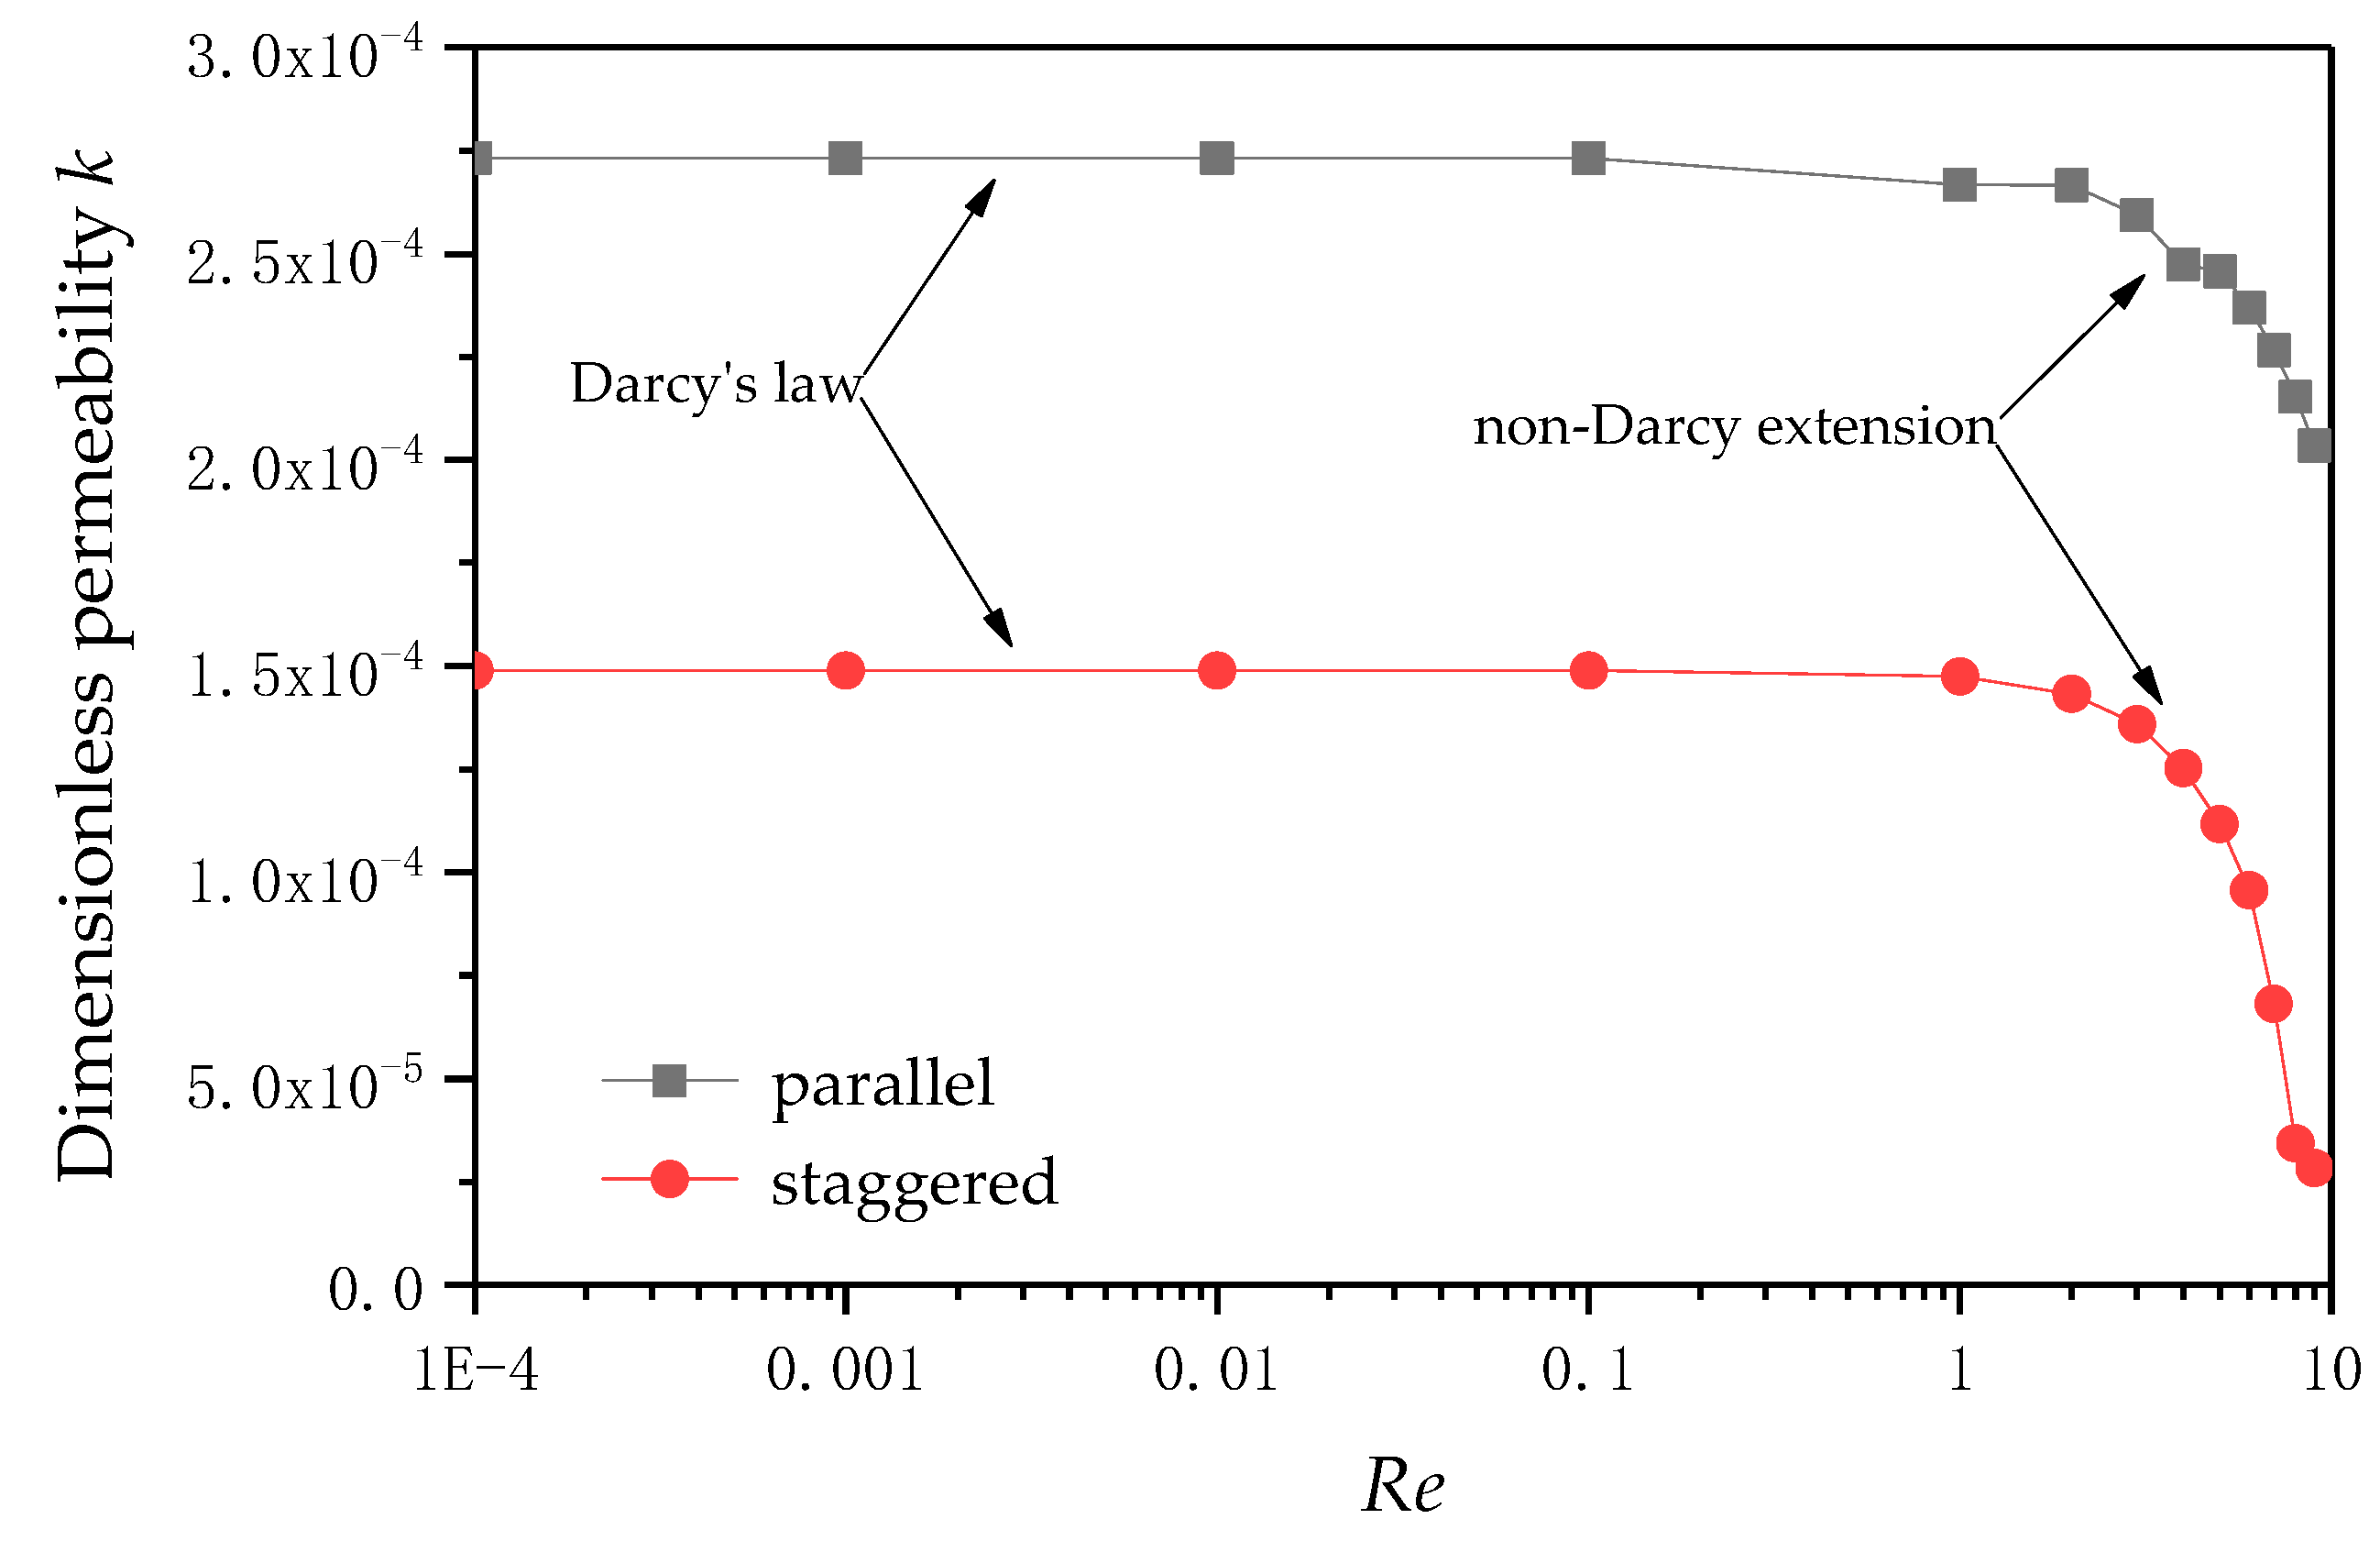
Darcy’s law is usually used to describe the flow in porous media [41]. However, Darcy’s law is only valid at a very low Reynolds number (Re < 1). At this time, the permeability is independent of the fluid properties such as density, viscosity and pressure gradient, and the average velocity of the fluid has a linear relationship with the pressure gradient. Darcy’s law is described by the following equation
p = μ k u
where p is the pressure gradient.
According to Darcy’s law, the dimensionless permeability is calculated and expressed by LB parameter as [42]
k L B = μ u p = μ · N x · δ x c s 2 · Δ ρ · 1 N x N y δ x 2 i = 1 N x j = 1 N y u ( i , j )
where, Δ ρ is the density difference between import and export, while Nx and Ny are the numbers of discretization nodes in the x and y direction, respectively.
At a high Reynolds number, the fluid inertia force will produce additional pressure drop. At this time, the average velocity of the fluid is non-linear with the pressure gradient, and the permeability varies with the flow conditions. In this case, the non-Darcy effect must be considered, in which the transition region is within the range of a Reynolds number greater than 1 and less than 10. According to Firdaouss et al. [43], Marusic-Paloka and Mikielic [44], Mei and Ariault [45], and Newman and Yin [46], cubic terms are introduced to modify Darcy’s law to describe the flow in porous media
p = μ k u + a u 3
where a is a constant.
The Reynolds number based on fiber diameter can be defined as
R e = u D μ
where D is the diameter of the fibers.
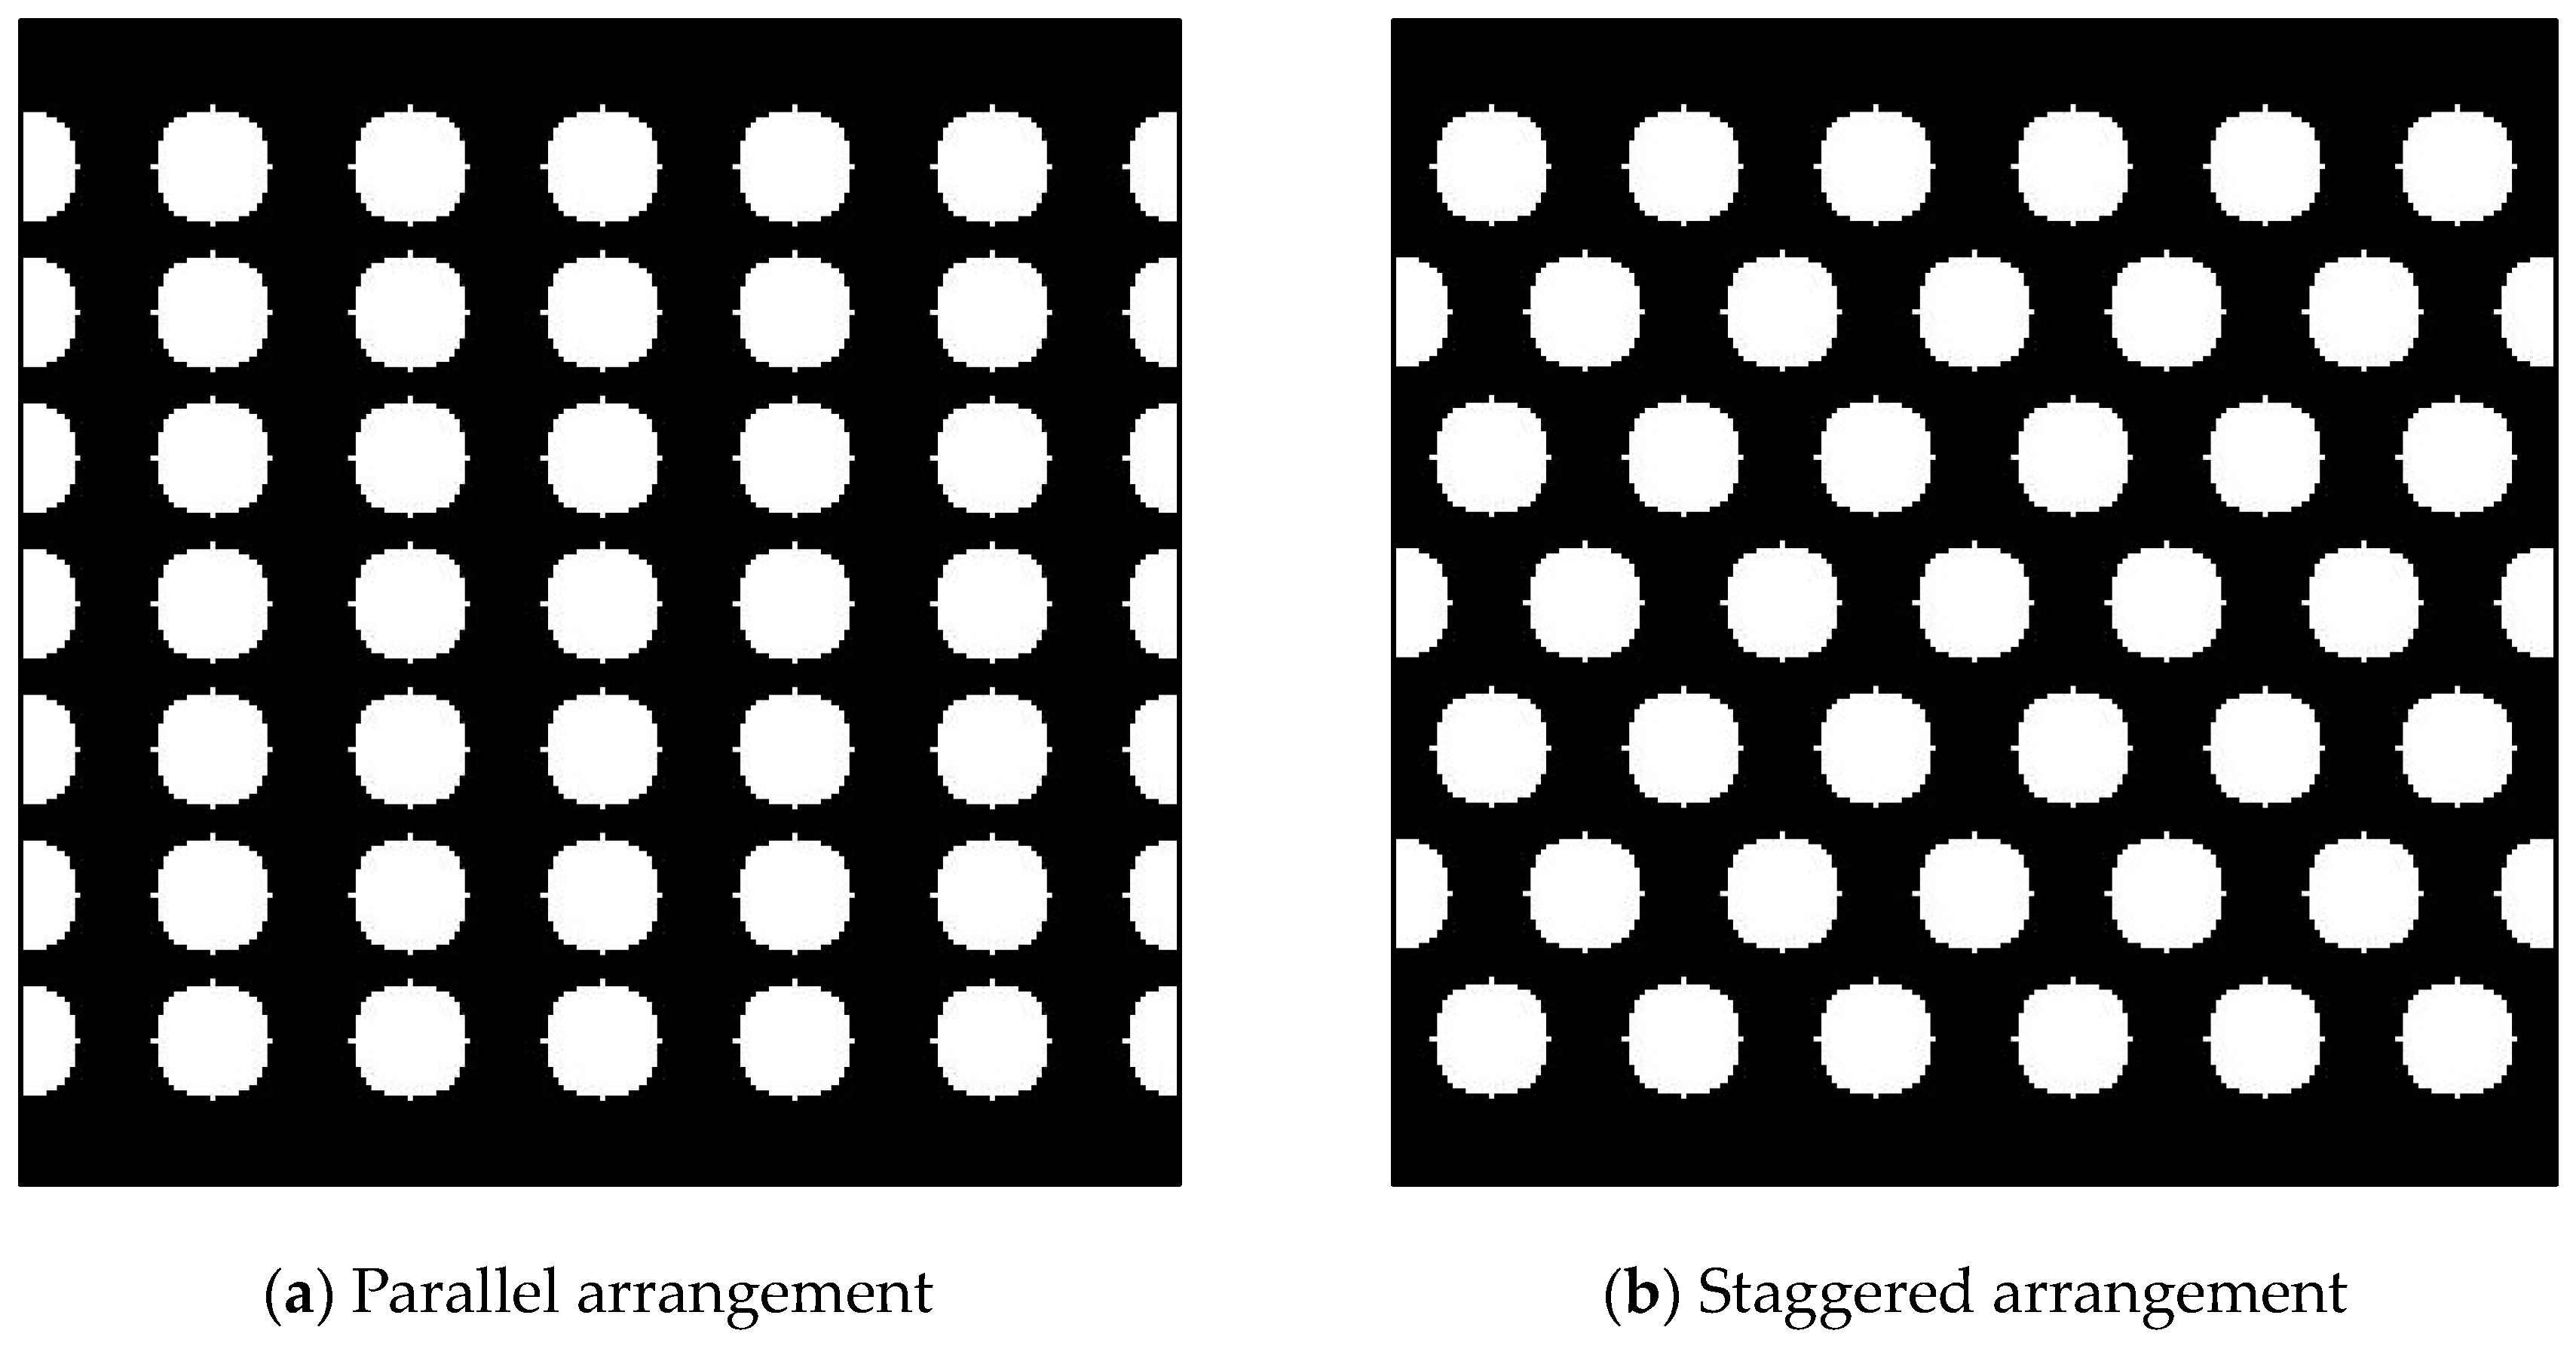
Figure 15 is a schematic diagram of the parallel arrangement model and the staggered arrangement model when the porosity is 0.6.
Figure 16 shows that the dimensionless filtration efficiency of parallel and staggered arrangement structures varies under different Reynolds numbers. When Re < 1, the dimensionless filtration efficiency is basically unchanged. It is consistent with the results of Lee et al. [10] in Darcy’s law region and transition region. When Re > 1, the dimensionless filtration efficiency decreases sharply with the increase of the Reynolds number, which indicates that the flow is non-Darcy flow, and the inertia force of the fluid plays a major role (1 < Re < 10 is the transition region). At the same time, it can be observed that the dimensionless permeability of the parallel arrangement structure is larger than that of the staggered arrangement structure, because the interspace of the staggered structure sphere is relatively small and the resistance to fluid flow is larger.
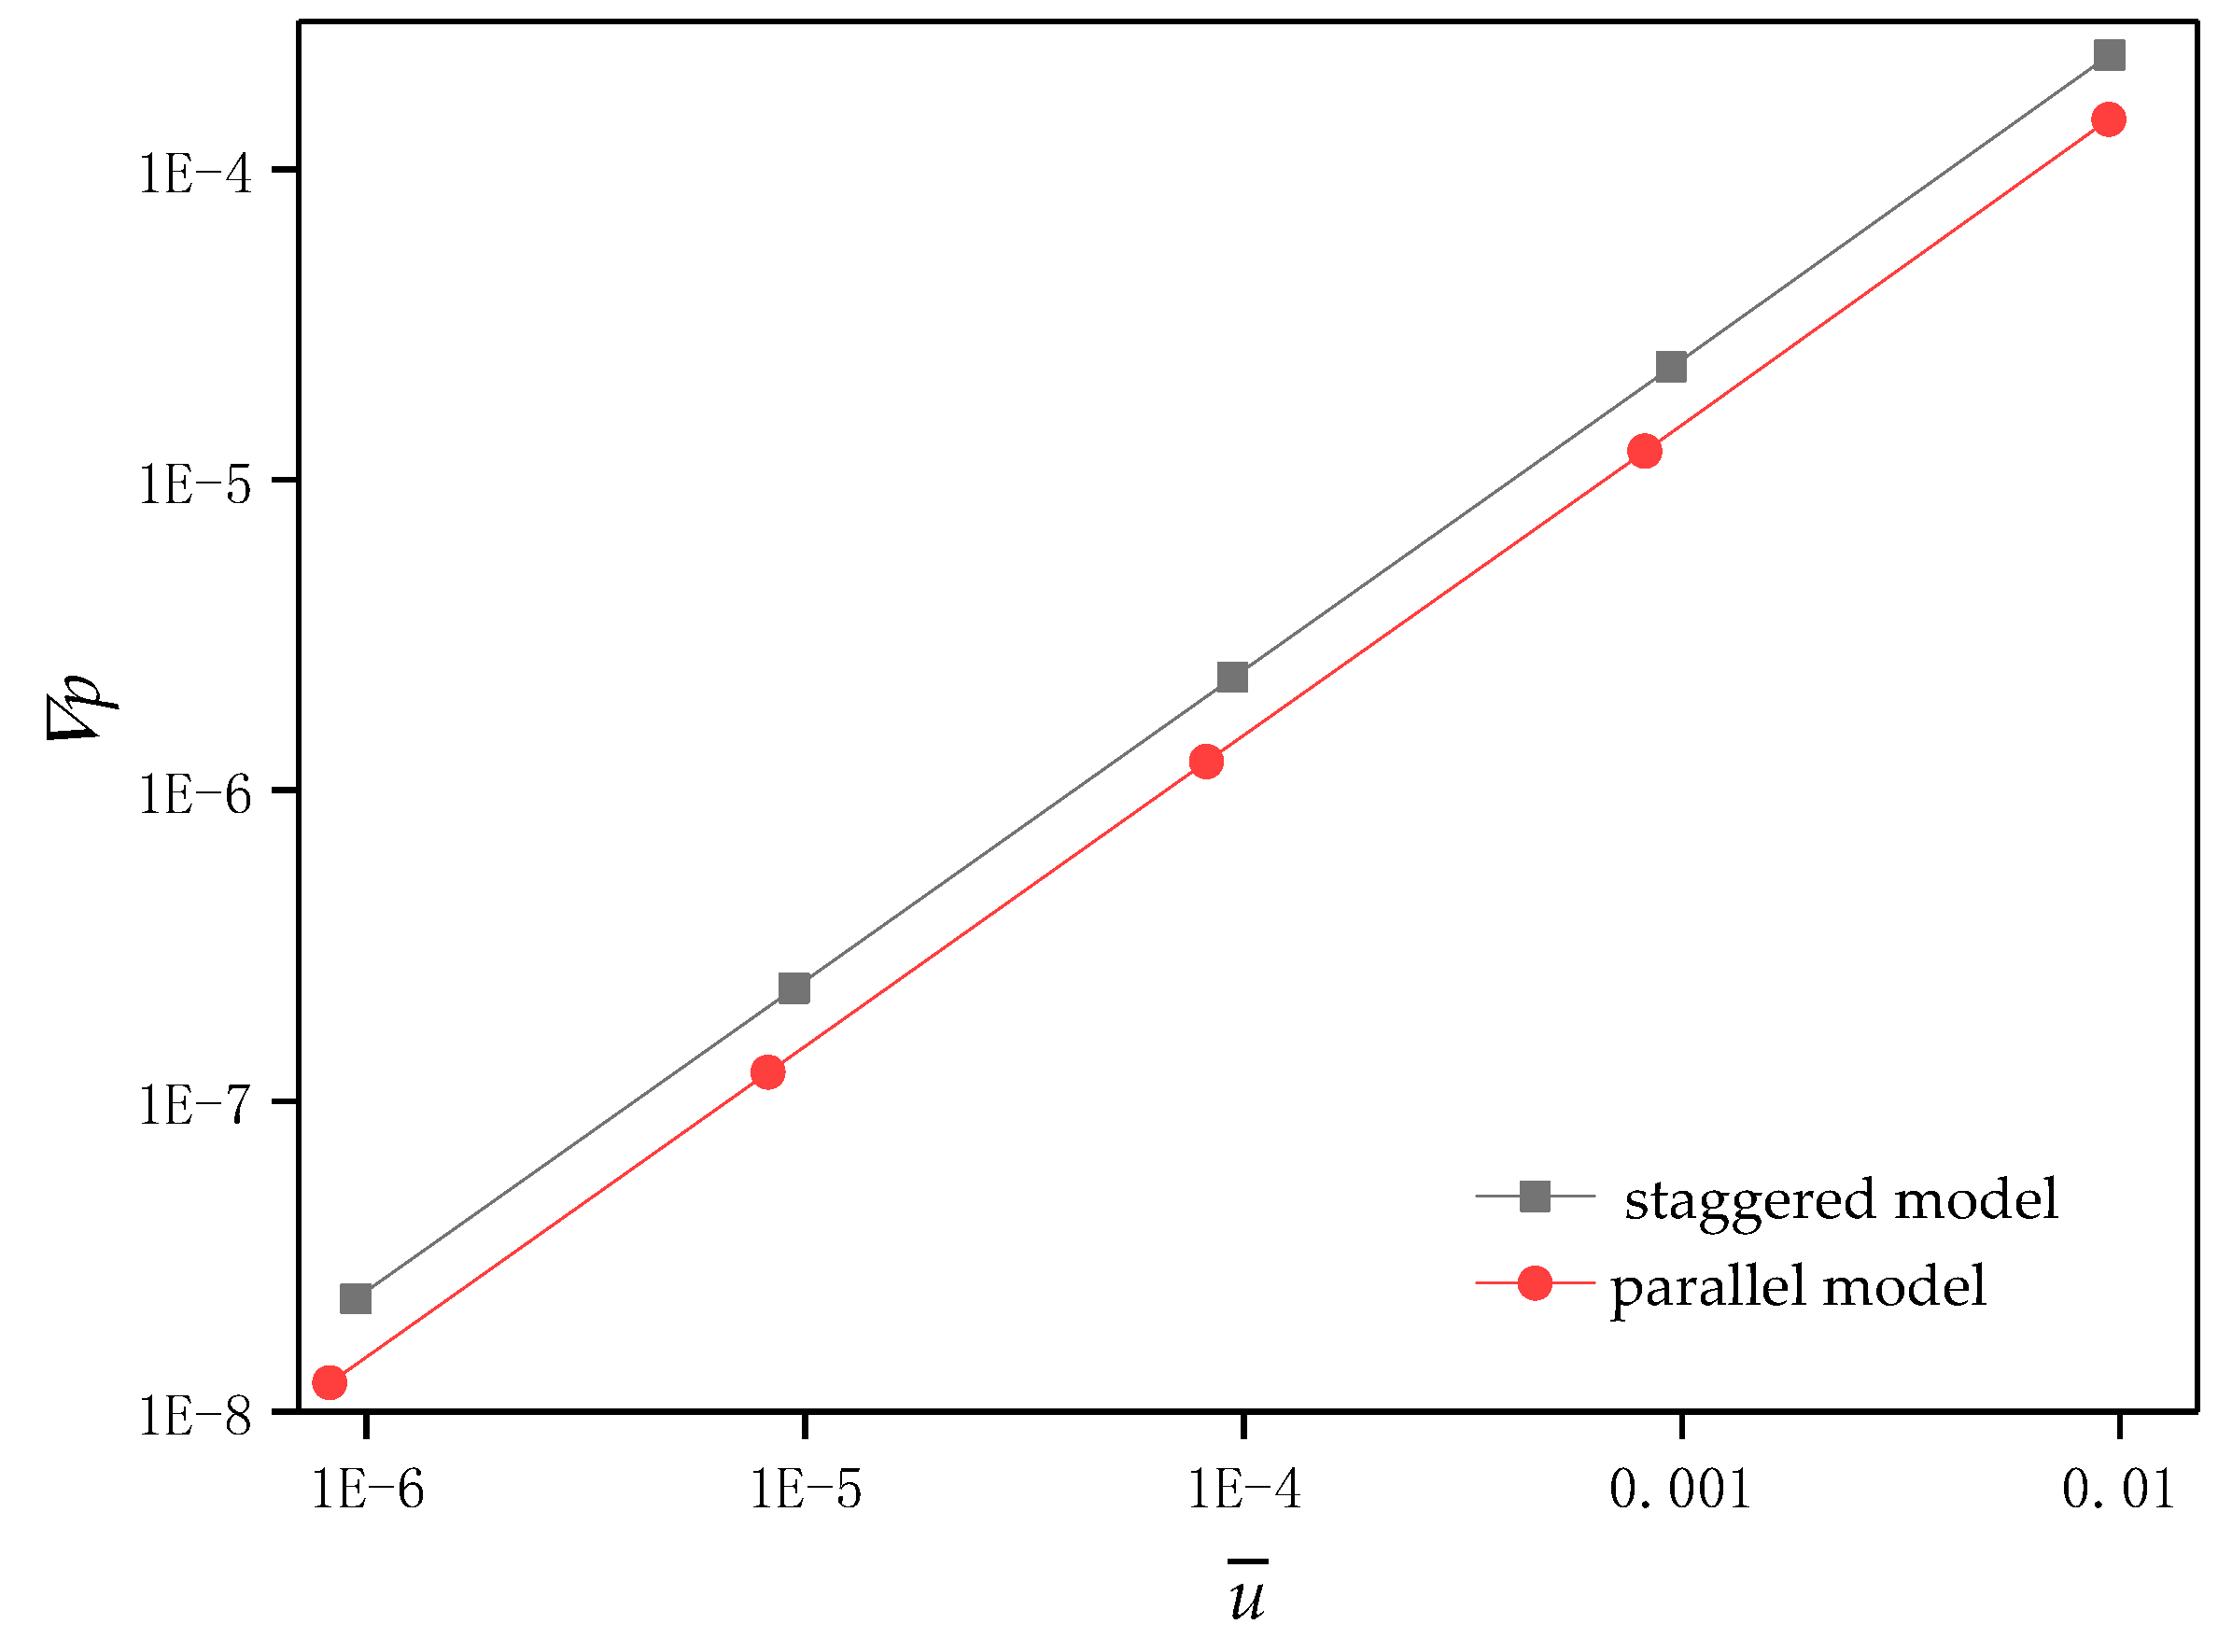
Figure 17 shows the relationship between the average velocity and pressure drop in the two structures, which is consistent with the conclusions of Lin [47] and Tang [48]. It can be seen that the velocity and pressure gradient of the fluid are linear and conform with Darcy’s law when the velocity is very low (Re ≤ 1), and the pressure gradient of the staggered structure is larger than that of the parallel structure, which conforms to its structure characteristic.
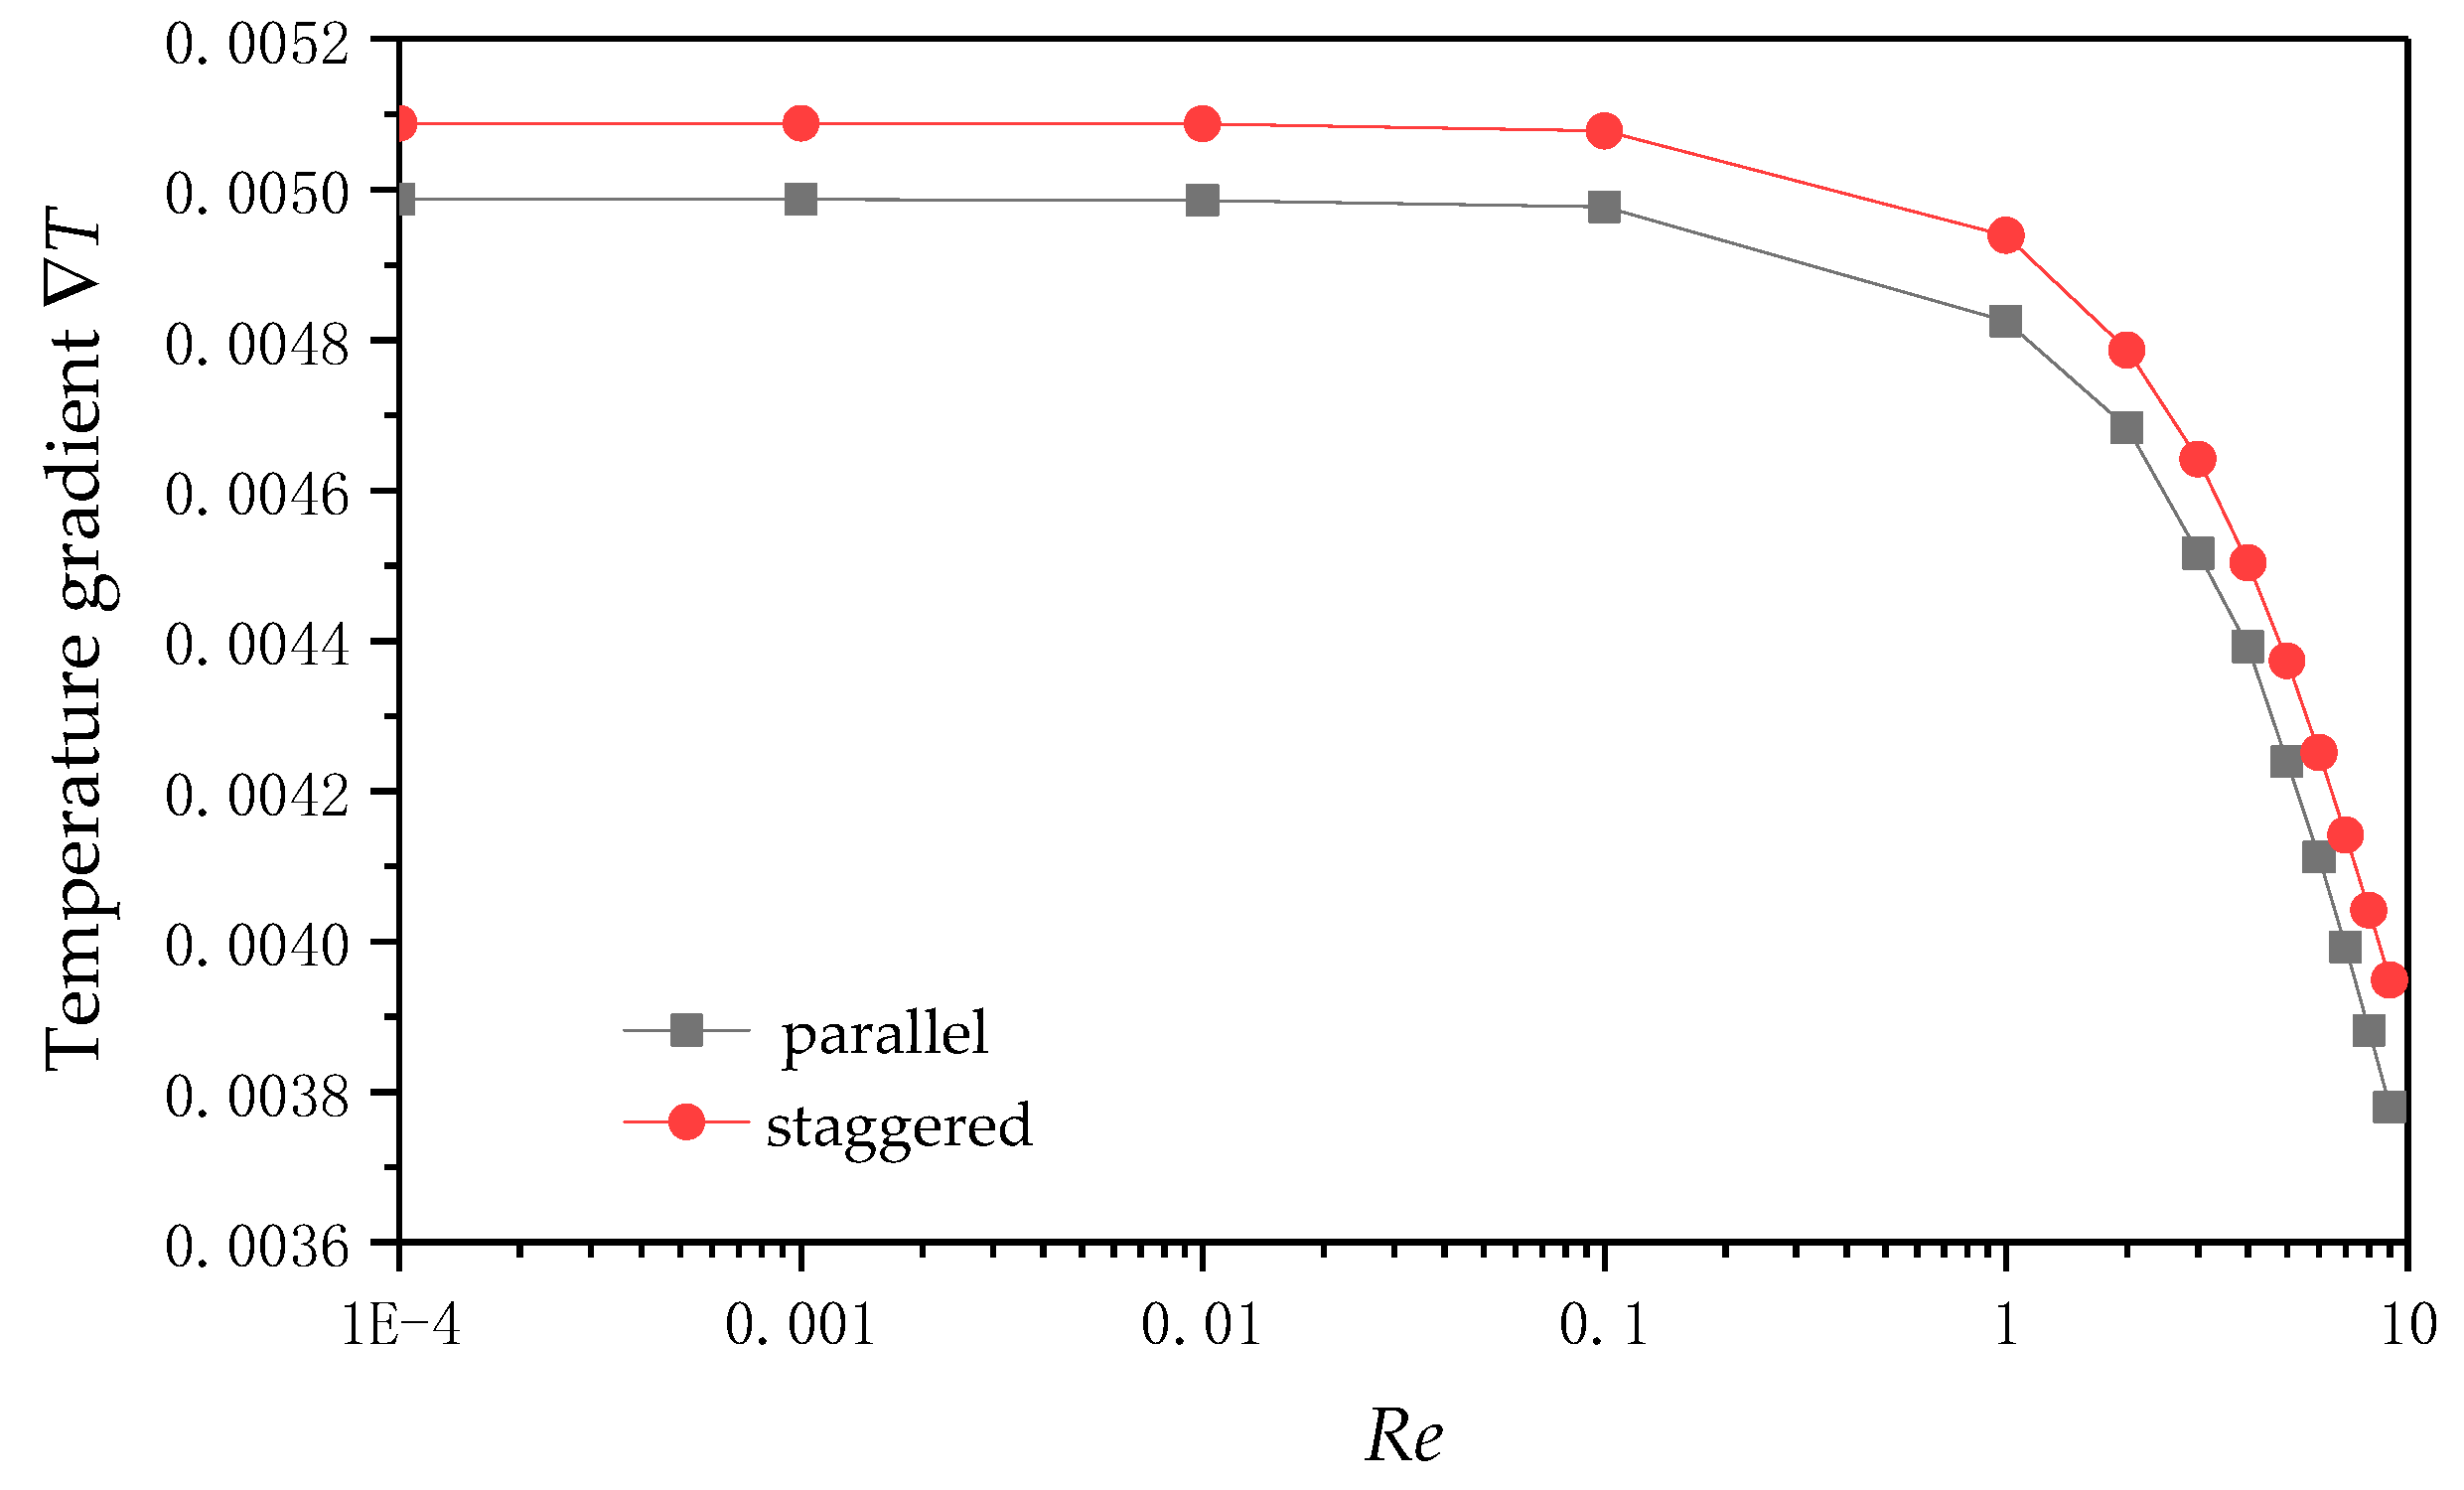
Figure 18 shows that the dimensionless temperature gradient changes of the domain are calculated under the conditions of different Reynolds numbers for the parallel arrangement structure and staggered arrangement structure. When Re < 0.1, the temperature gradient is almost unchanged, because the fluid flow is Darcy flow, while the velocity is small; the fluid flow is mainly affected by viscous force; the heat exchange between particles is stable, and the temperature gradient is large. As the Reynolds number increases, the velocity increases, and the inertial forces on the fluid take the main role. Meanwhile, in the process of fluid flow, the disturbance of the flow flowing process increases, together with the heat exchange increases, and the temperature distribution gradient of the whole computational domain decreases, so the temperature gradient of the fluid decreases sharply. It can also be observed that the temperature gradient of the staggered structure is larger than that of the parallel structure.
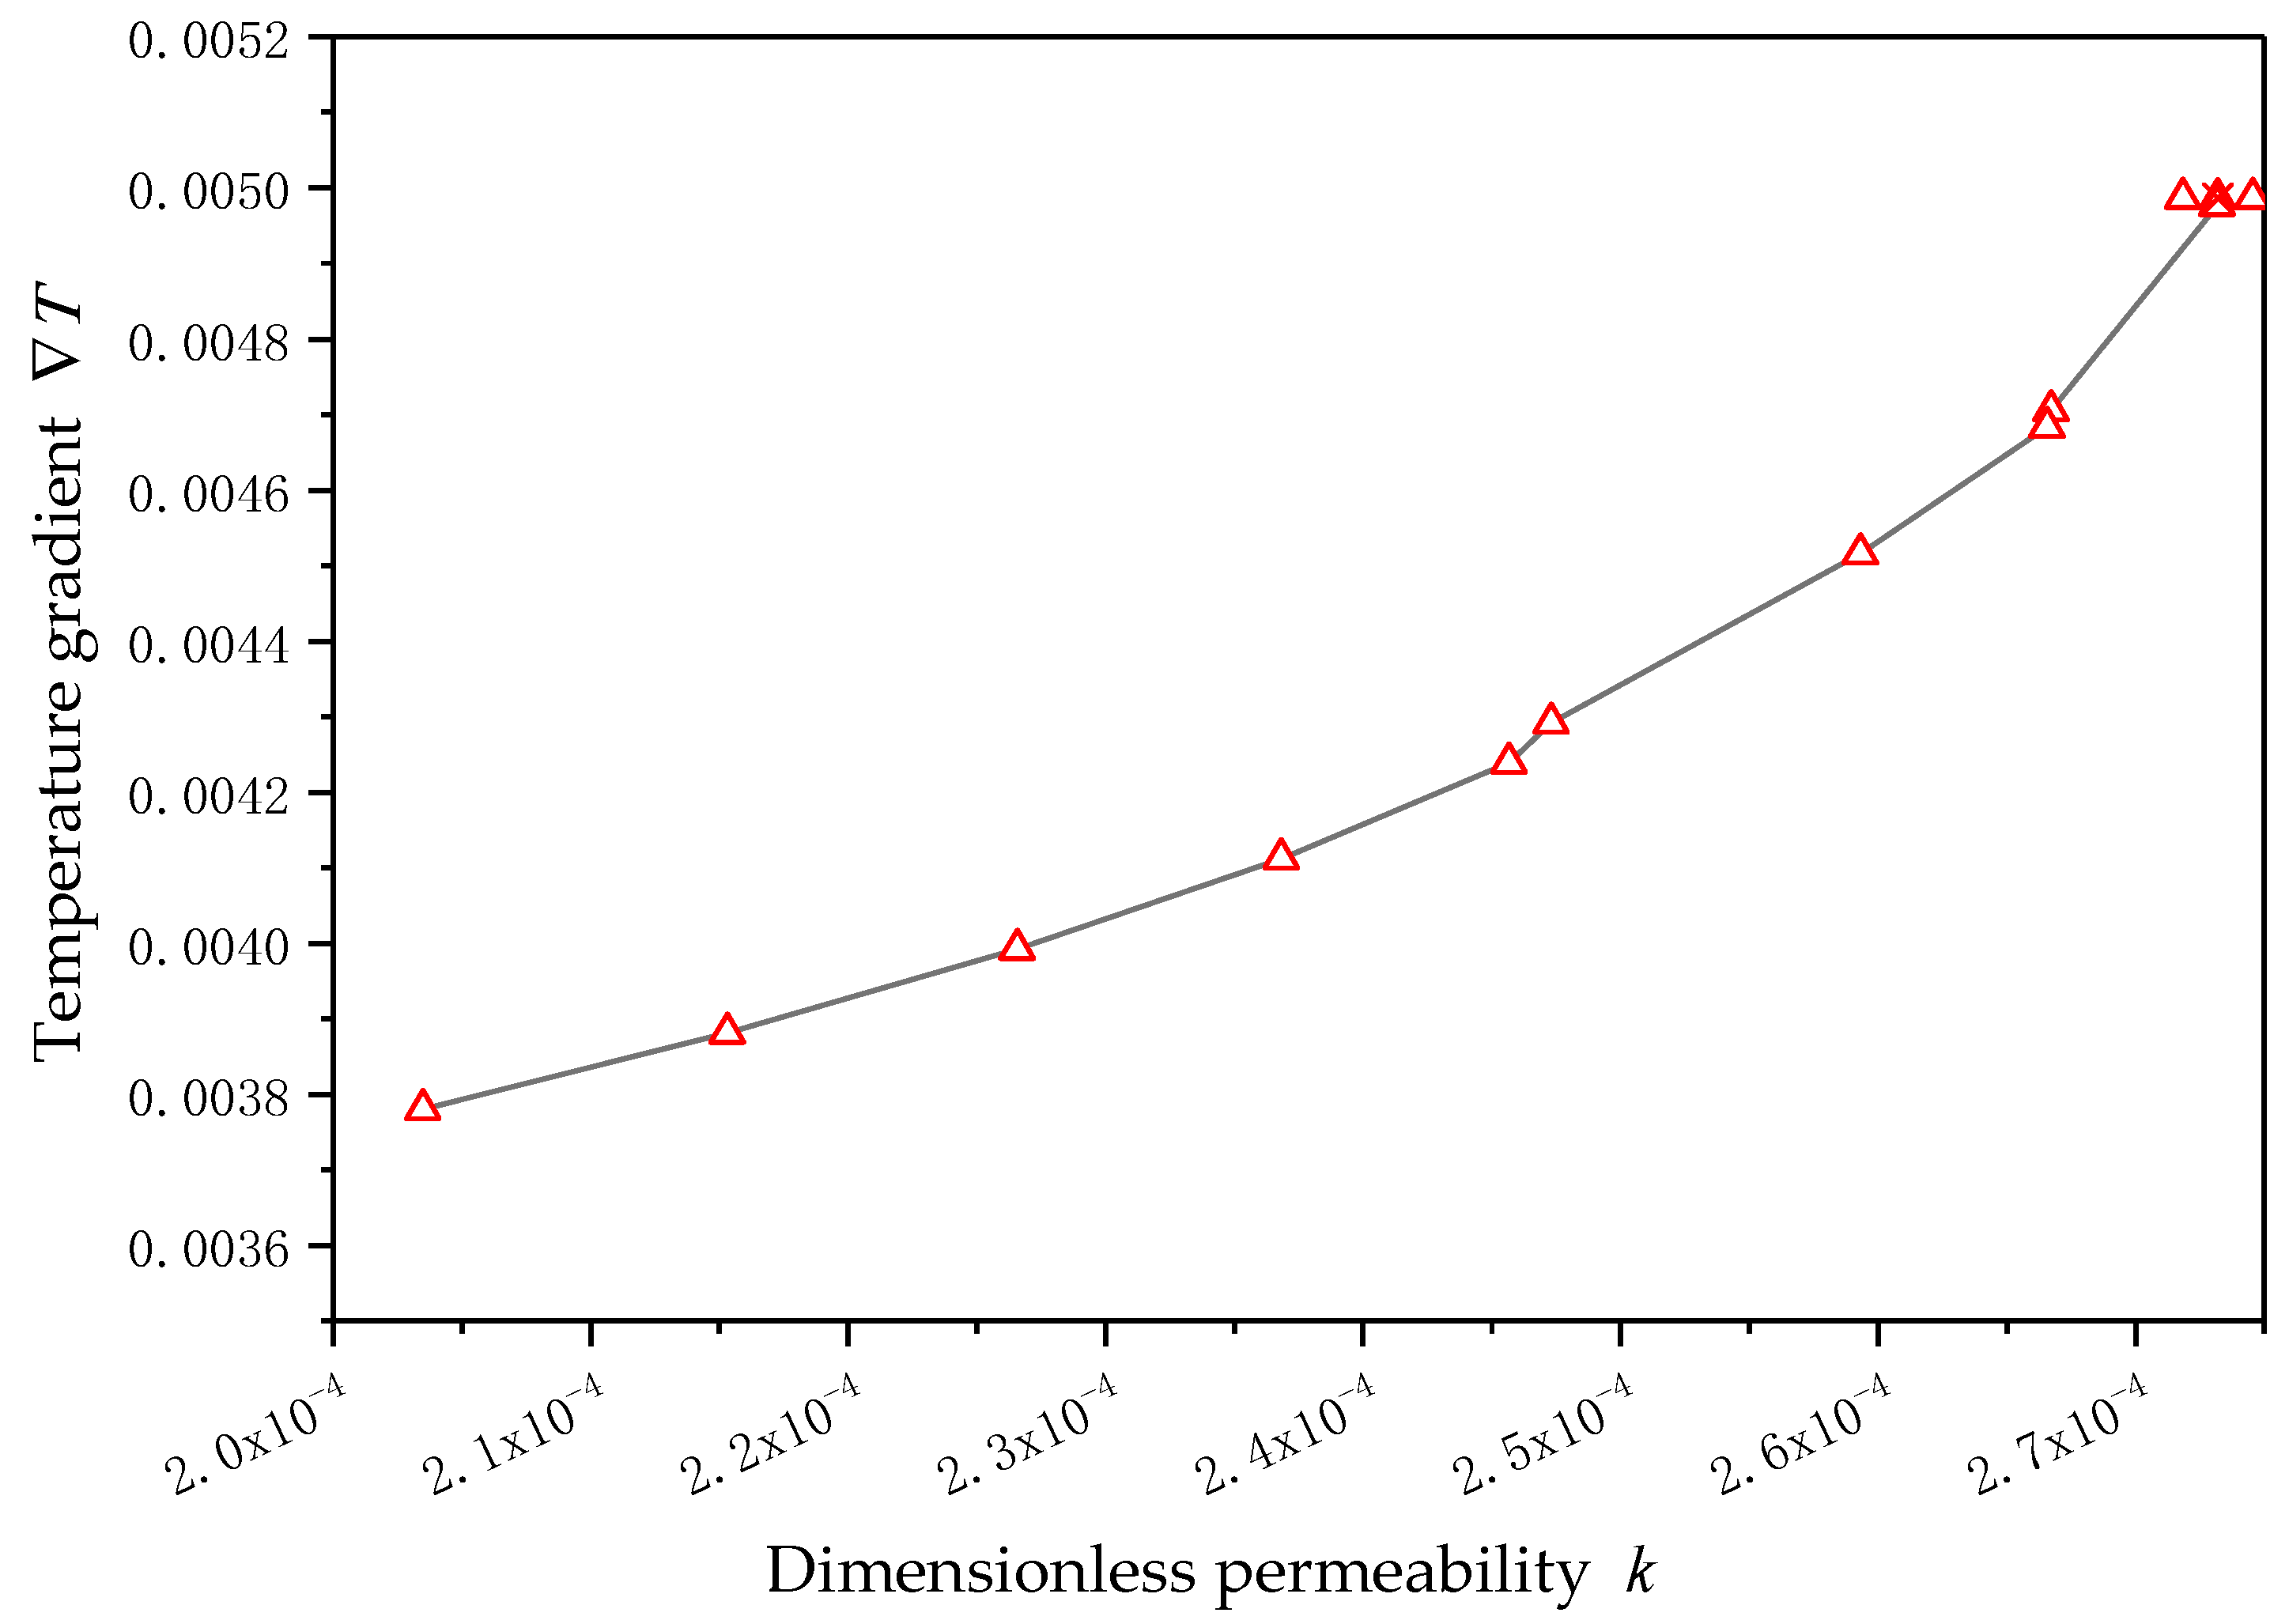
Figure 19 shows the relationship between dimensionless permeability and temperature gradient of parallel arrangement structure, which is consistent with the relationship within the Reynolds number and permeability, as well as the connection of the Reynolds number and temperature gradient. In the Darcy flow region, the dimensionless permeability and temperature gradient have no obvious change, so it can be found that the temperature gradient is very concentrated when the permeability is about 2.7 × 10⁻⁴. In the transition flow region, it can be found that with the increase of permeability, the temperature gradient increases correspondingly, and there is a positive relationship between them.
The expression of the average Nusselt number is
N u ¯ = h ¯ · D λ f
where, λ f is the thermal conductivity of fluid and h ¯ is the average convective heat transfer coefficient. Its expression is as follows:
h ¯ = q ¯ θ w θ f
where, q ¯ is the average heat flow, and its expression is
q ¯ = c p m Δ T = c p ρ q v ( θ o u t θ i n )
where, c p is the constant pressure heat capacity; m is the mass flow rate; q v is the volume flow rate. The average value of the temperature at the inlet and outlet of the fluid is expressed in terms of the temperature at the inlet and outlet of the fluid.
θ f = ( θ i n + θ o u t ) / 2
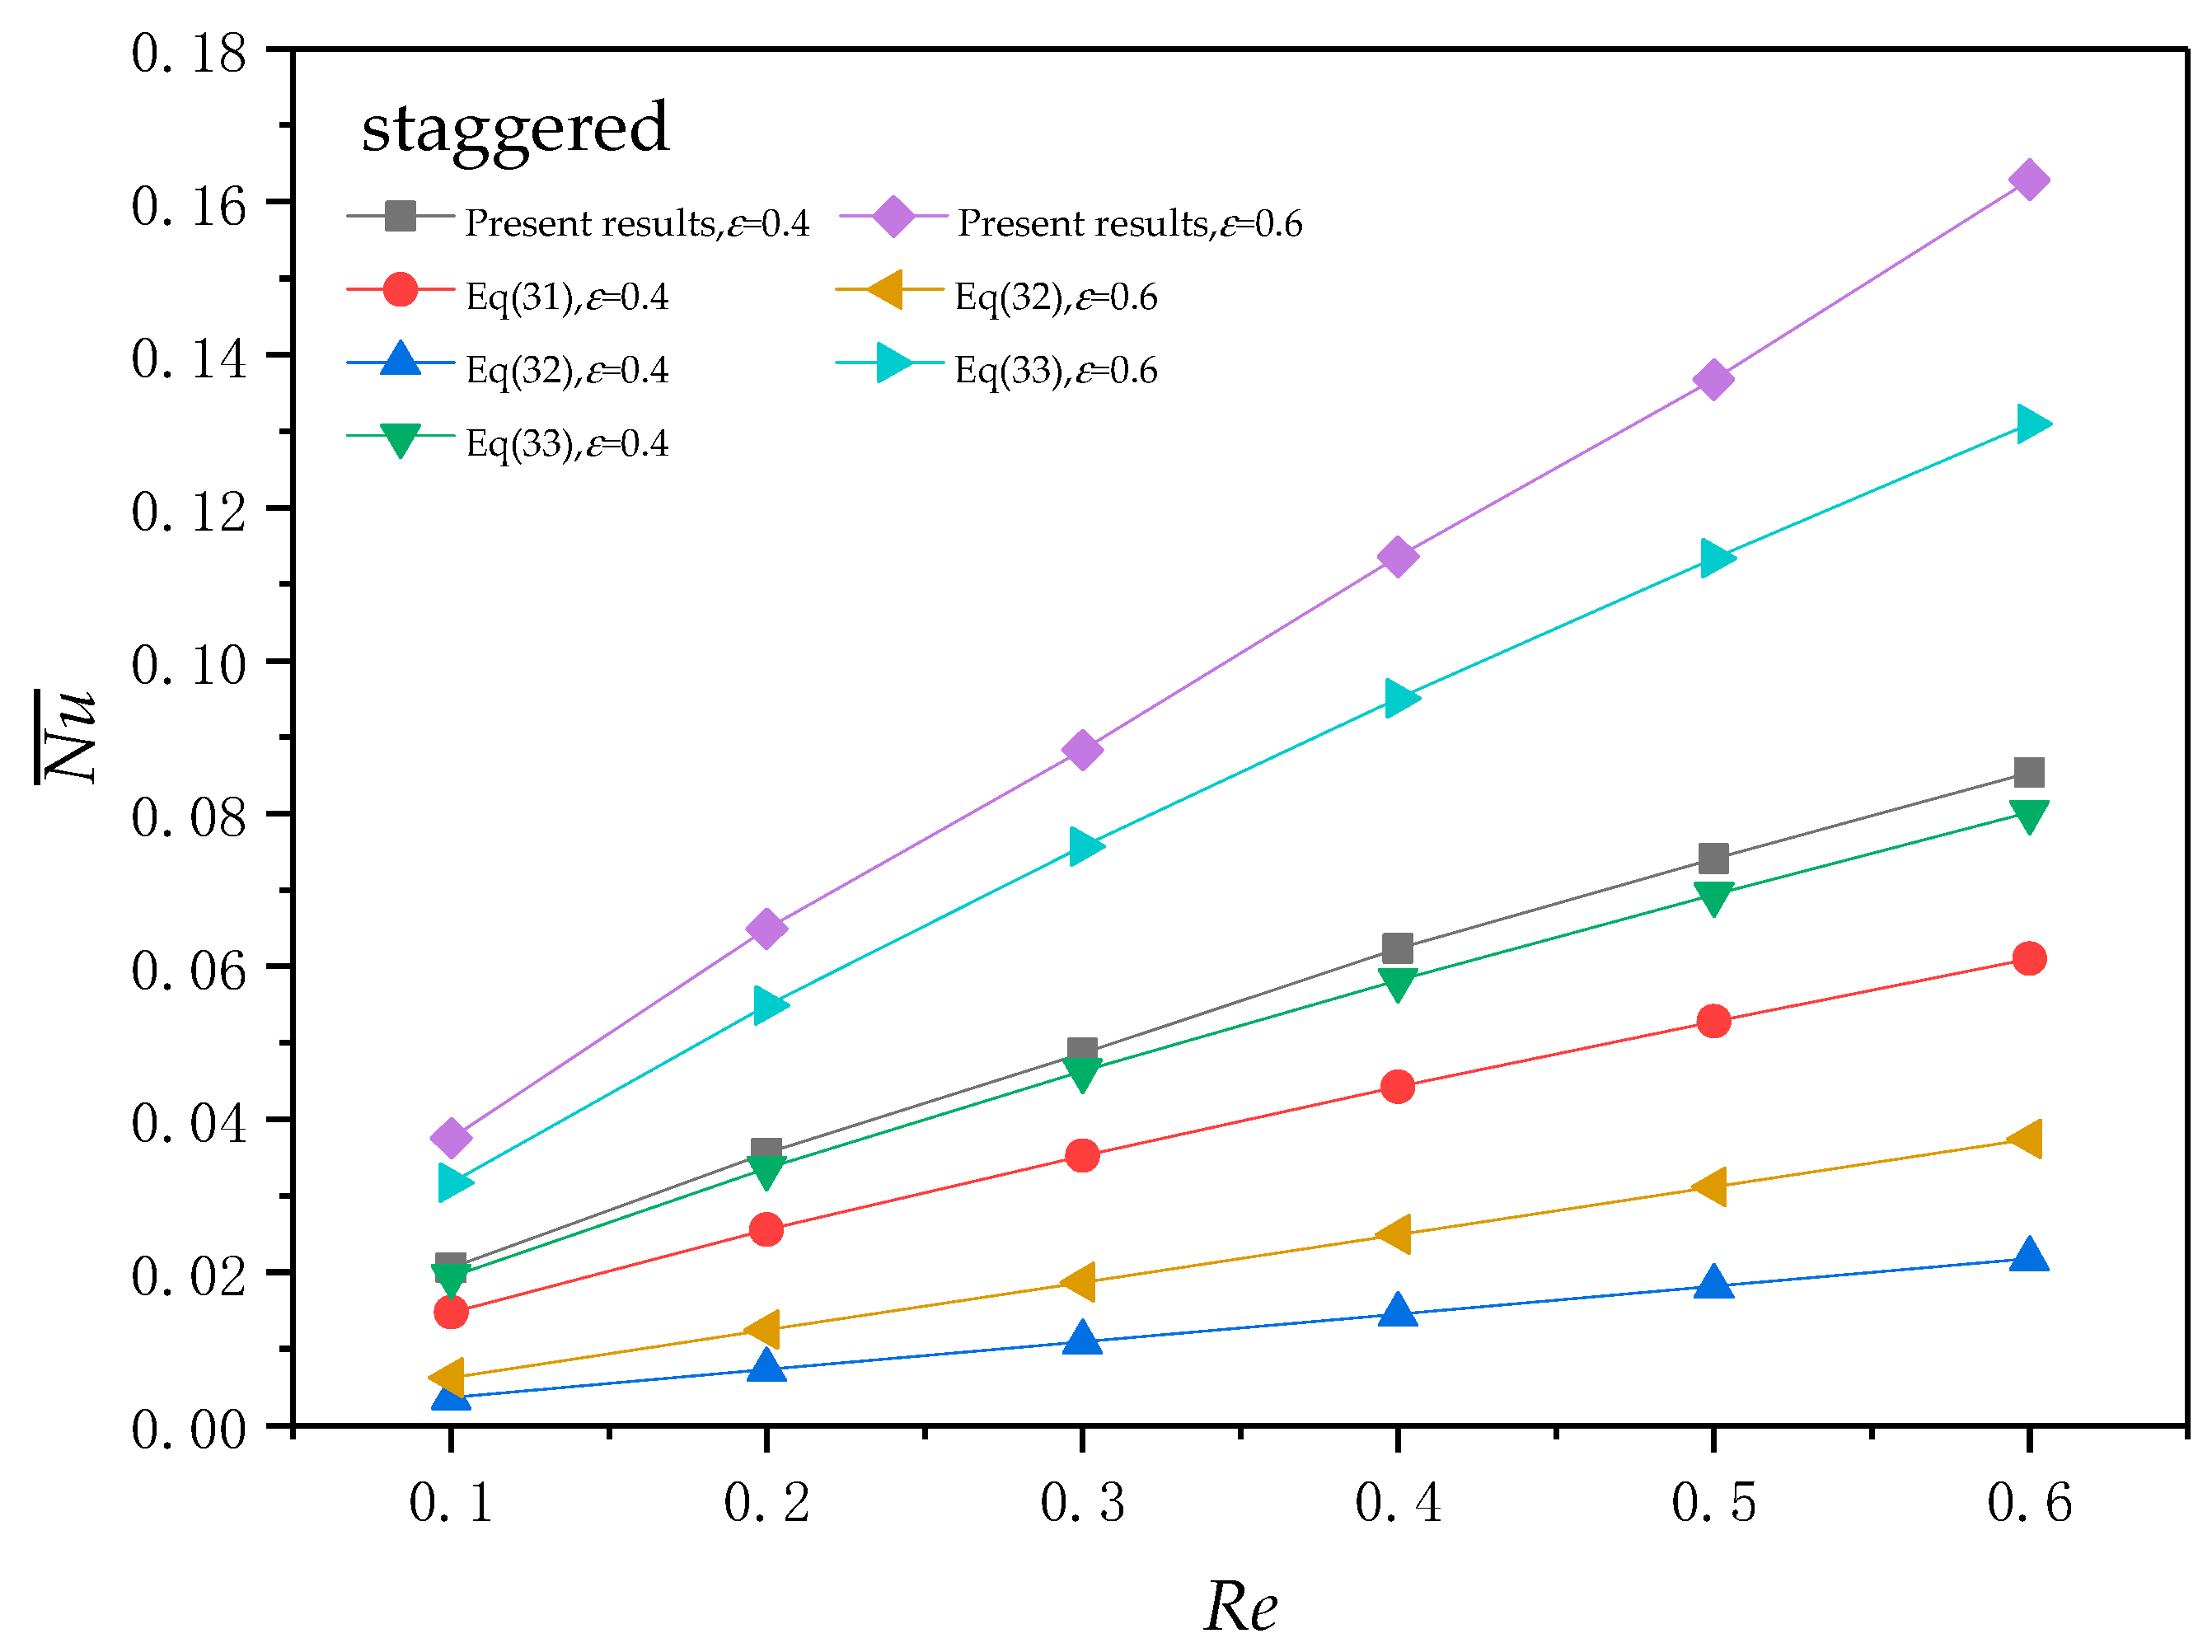
For heat transfer in porous media, many scholars have explored the relationship between the Nusselt and Reynolds numbers through experiments. Kamiuto and Yee [49] deduced the general correlation of the Nusselt and Reynolds numbers of porous materials through a series of experimental data, as shown in Equation (32). On this basis, Nakayama et al. [50], through experiments, introduced the porosity and established the general correlation between the Nusselt and Reynolds numbers, shown by Equation (33). Kuwahara et al. [51] studied the relationship between the Nusselt and Reynolds numbers in the range of 10 2 R e 10 3 , 0.36 ε 0.96 , 10 2 P r 10 2 and established their general correlation, as shown in Equation (34).
N u ¯ = 0.124 ( R e P r ) 0.791
N u ¯ = 0.07 ( ε 1 ε ) 2 / 3 R e P r
N u ¯ = 0.124 ( 3 π ε 4 ( 1 ε ) ) 0.605 ( R e P r ) 0.791
Figure 20 shows the relationship between the average Nusselt number and Reynolds number of the staggered structure, with porosity of 0.4 and 0.6, respectively. It can be found from the figure that the average Nusselt number is approximately linear with Reynolds number, and the average Nusselt number increases with the increase of Reynolds number. At the same Reynolds number, the simulation results of different porosity are larger than those of the corresponding three correlations. This is because the porous media model established in this paper is regularly arranged, and the correlation is based on the porous media experiments of real materials. At the same porosity, the results of simulation are closest to those of Equation (34). It can be seen that the relationship between average Nusselt number and Reynolds number is affected by many factors. The more correction terms in the correlation, the more accurate the results.
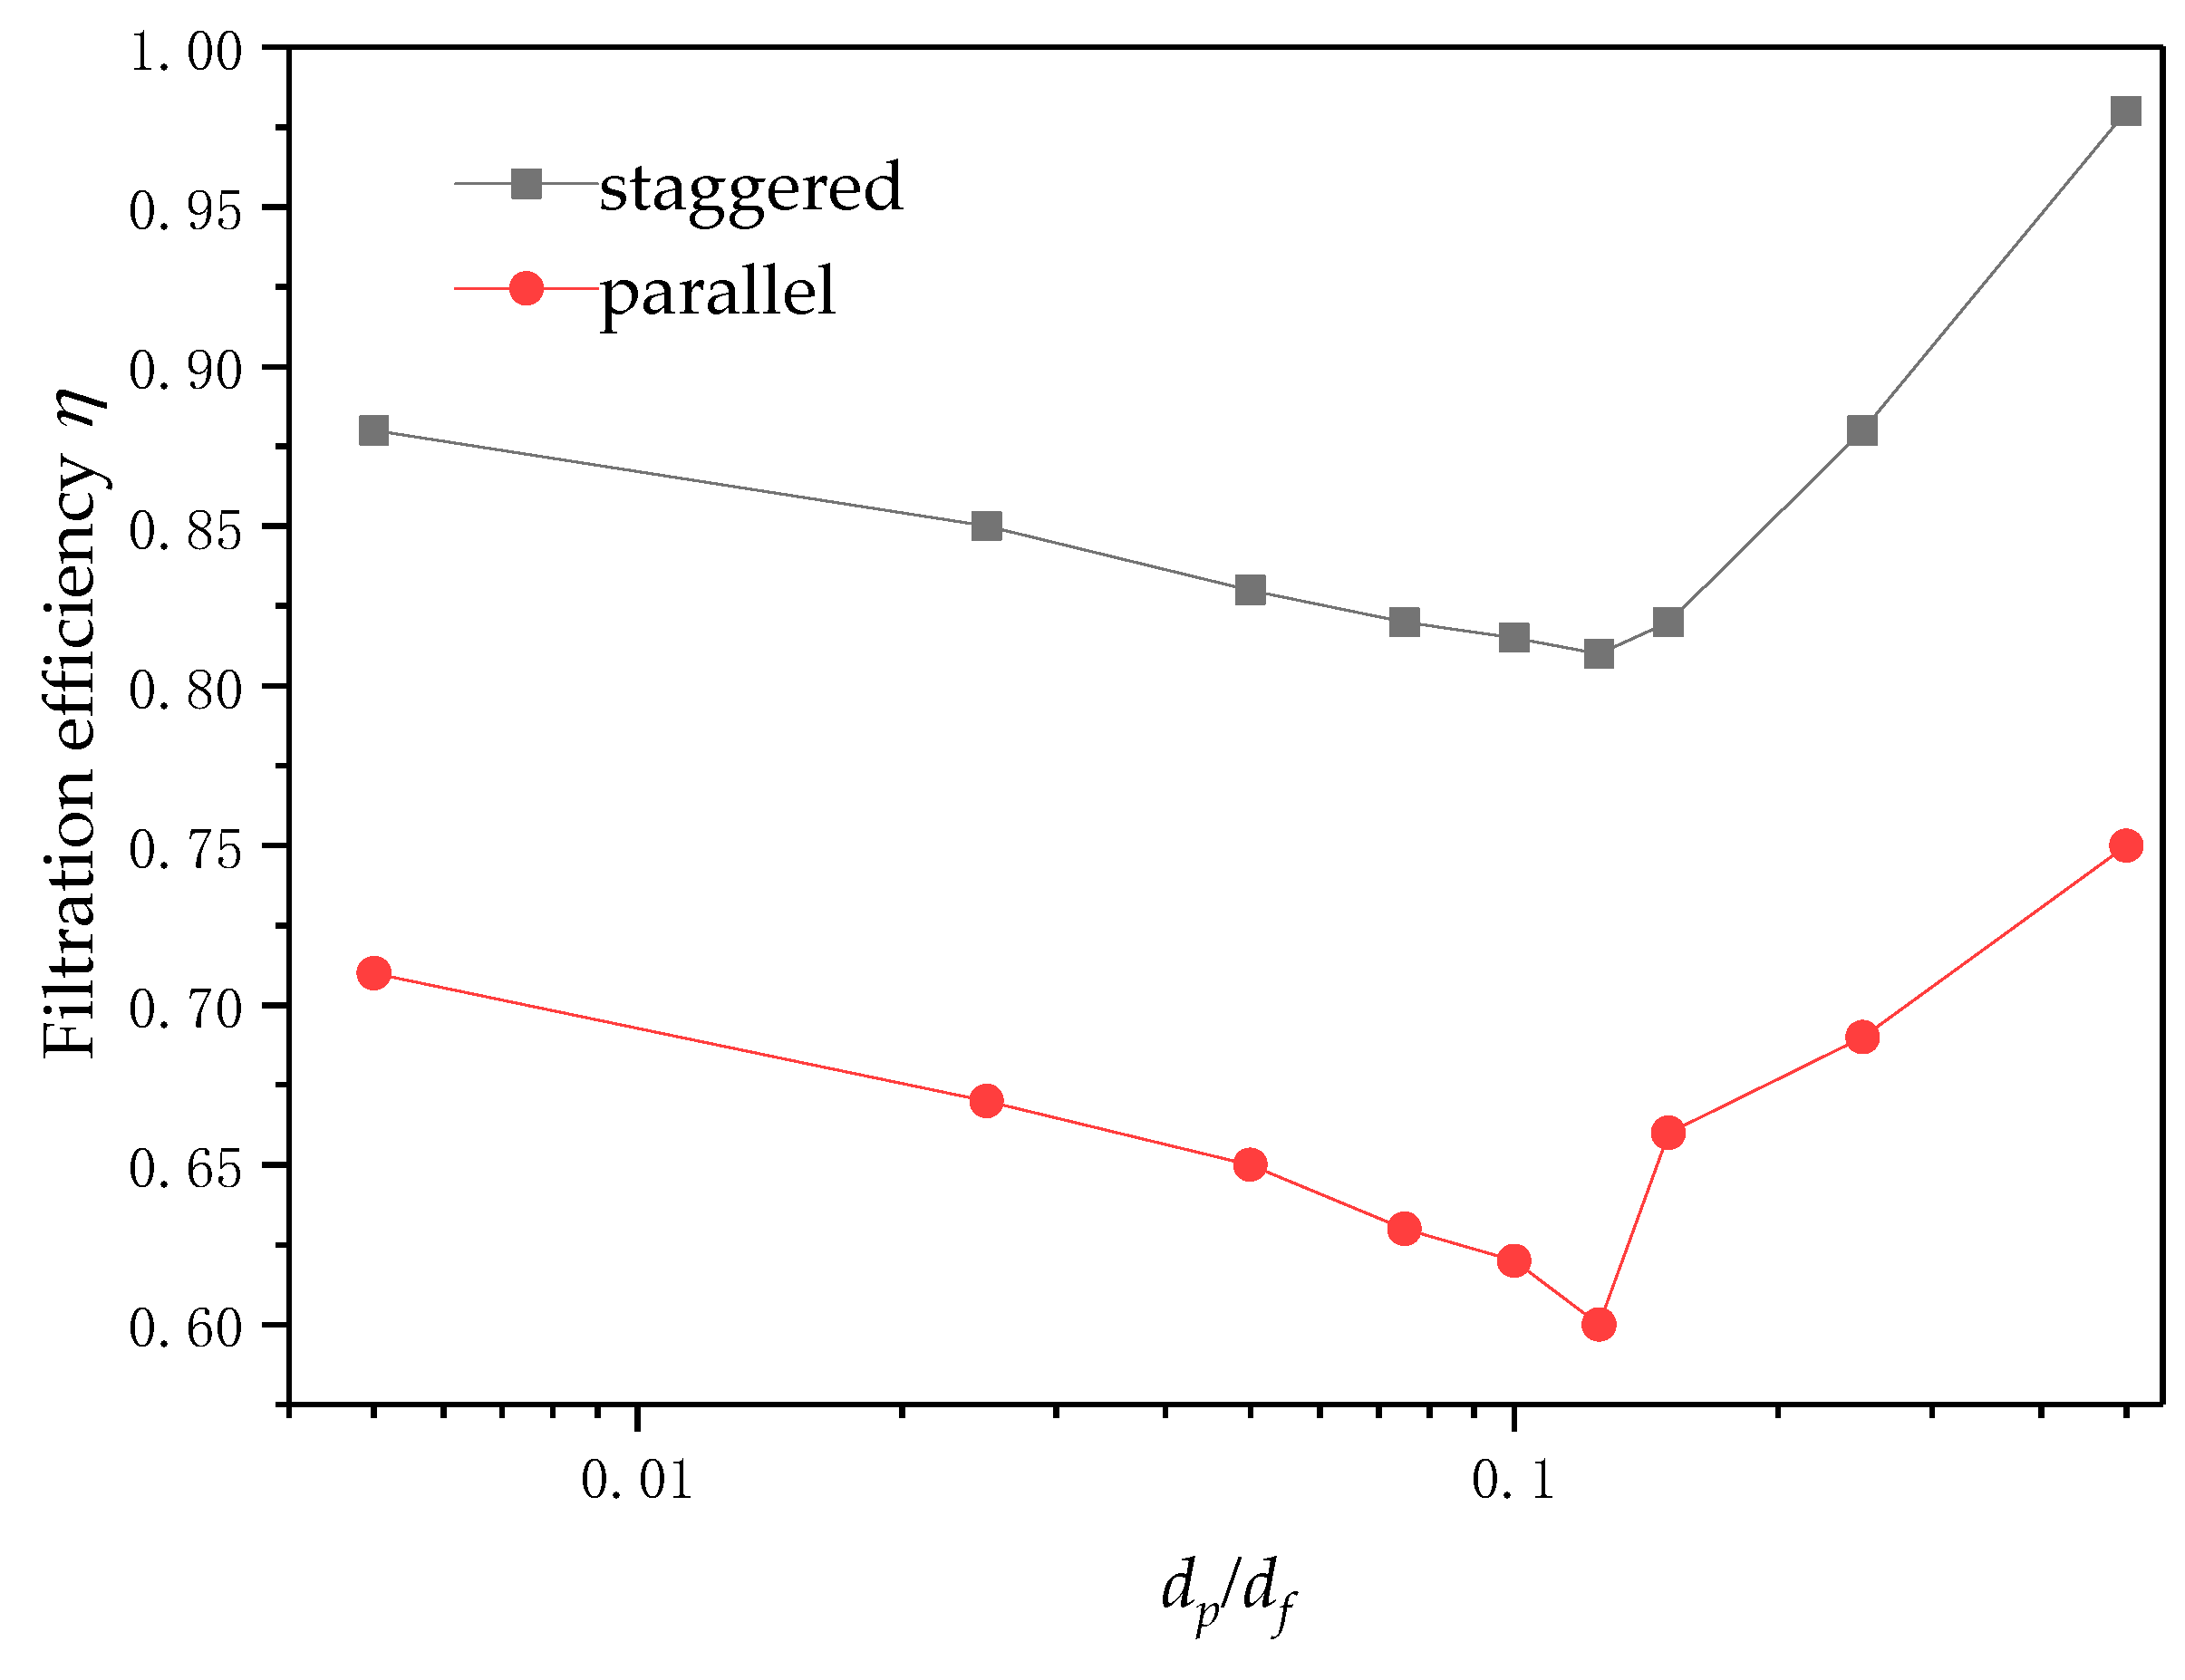
Figure 21 shows the relationship between the filtration efficiency of parallel and staggered structures and the particle size. Similar to Wang et al. [52] conclusion, when dp/df < 0.005, the smaller particles have stronger diffusion and are easily captured by fibers, so they have higher filtration efficiency. Large particles with larger inertia force (dp/df > 0.25) will deviate from the streamline and collide with the windward side of the fibers, and the filtration efficiency is also higher at this time. The medium size particles (0.005 < dp/df < 0.25) will move along the streamline, and their diffusion and inertia are relatively weak. The fibers can only capture a small number of particles, and the filtration efficiency will show a downward trend. The results also show that the staggered permutation model has higher filtering efficiency.

3.2. Flow and Heat Transfer Analysis of Random Structure

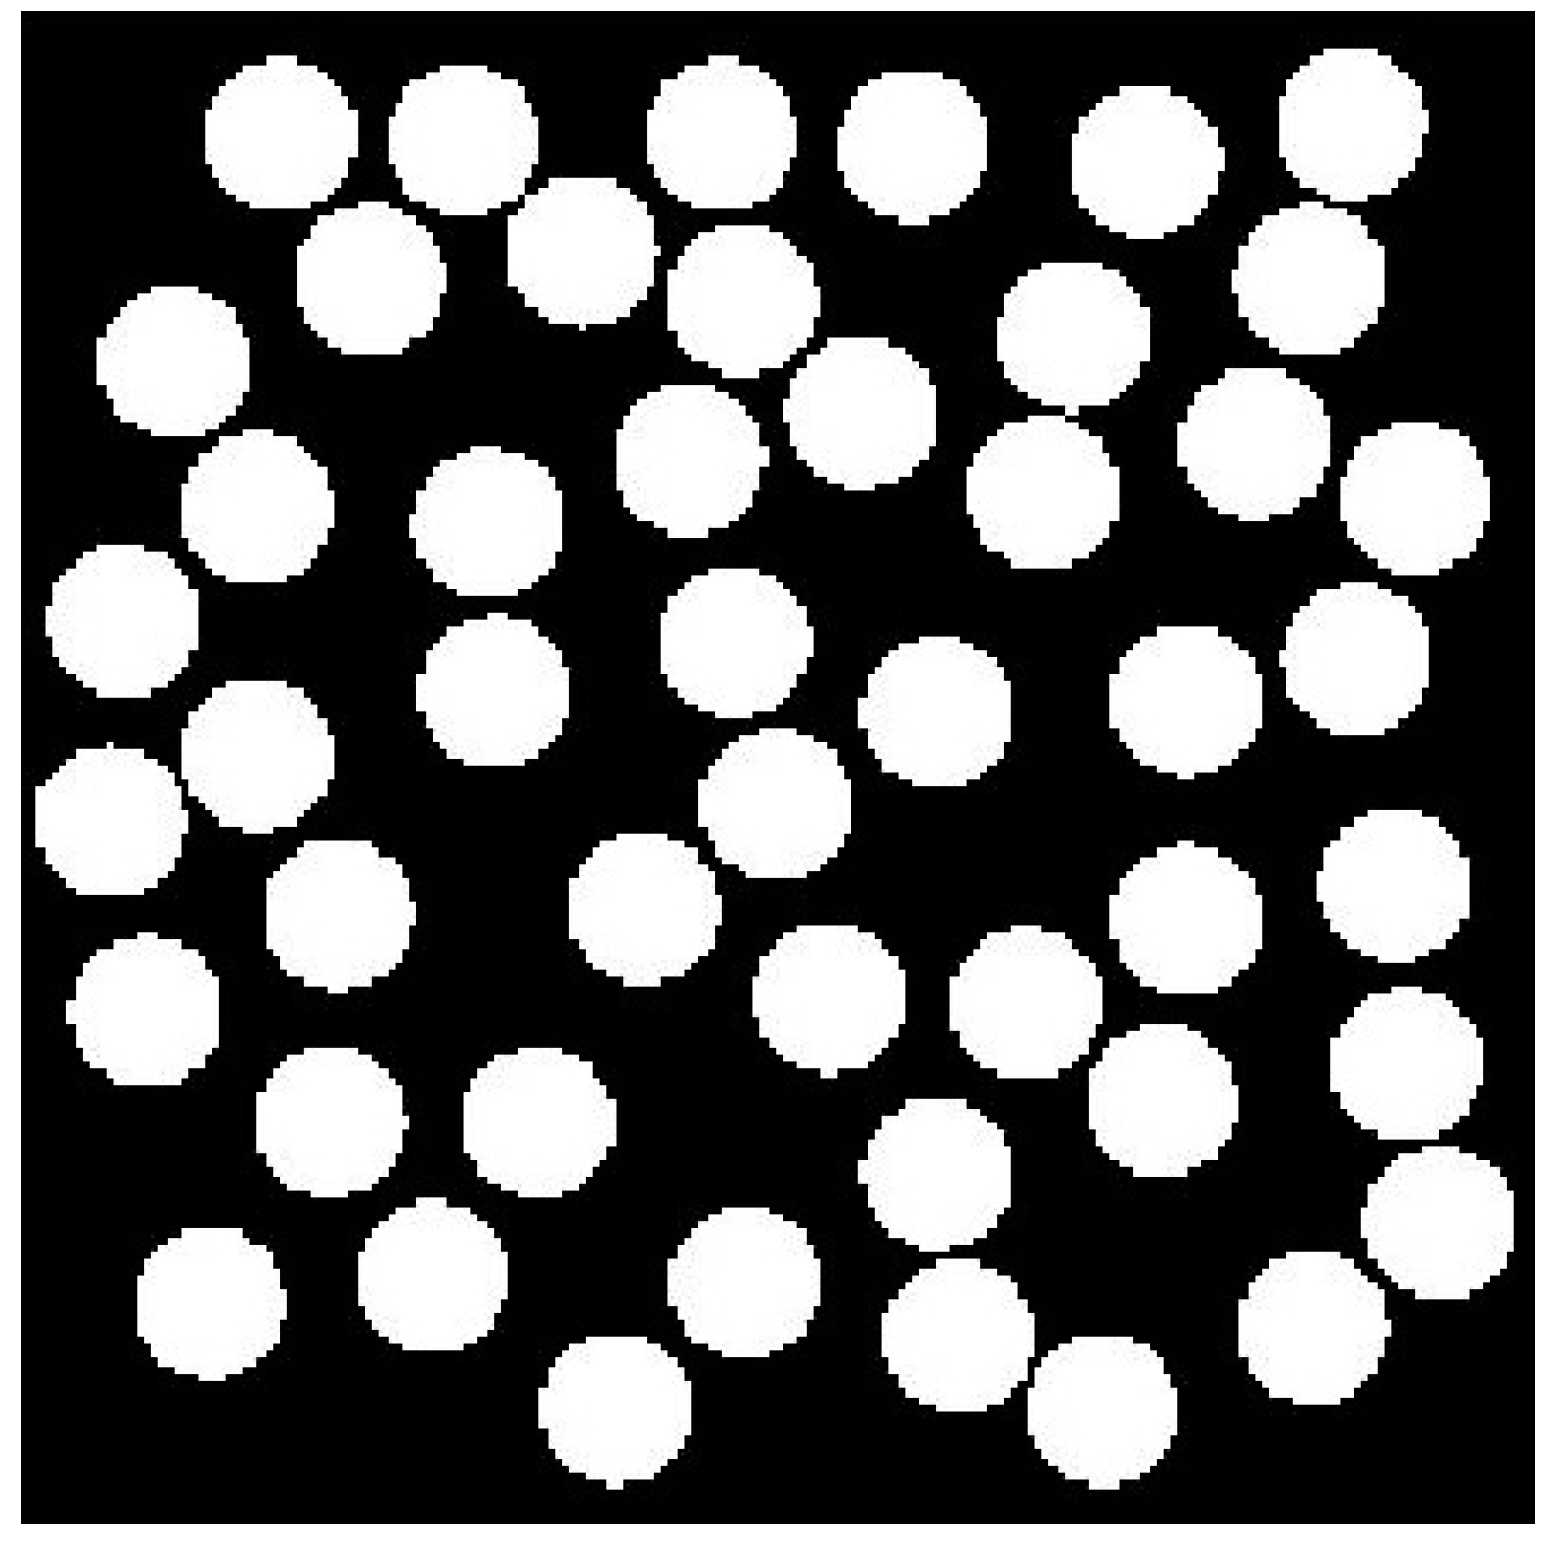
This paper investigates the flow characteristics of random structure. The random structure is to randomly place a certain number of circles with the same diameter into the computational domain with the size of 200 × 200 lattices to form a porous medium. The minimum distance between any two circles is set to (2R + 1), so that no overlap occurs between any two circles, where R is the radius of particles. Figure 22 shows that the random structure of porosity ε is 0.6.
Figure 23 shows the velocity nephogram and streamline of random arrangement structure, in which the Reynolds number of (a) is 0.0001 and the Reynolds number of (b) is 3. It can be found that at higher Re, the velocity between the pores is higher, and (c) is the temperature field nephogram at Reynolds number 3. In the three regions with large temperature gradient (block part), corresponding to the velocity nephogram, the velocity is very small and close to stagnation, and the convective heat transfer is weak, so the temperature gradient here is larger. (d) is a nephogram of pressure distribution with Reynolds number 3, which at the entrance, the pressure in the area with smaller velocity is larger (purple block part in the figure), and it can be found that the pressure decreases obviously in the direction from left to right (that is, in the flow direction), which is due to the extrusion of the flow between pores, the increasing of the average velocity and the decreasing of pressure after entering the calculation area.
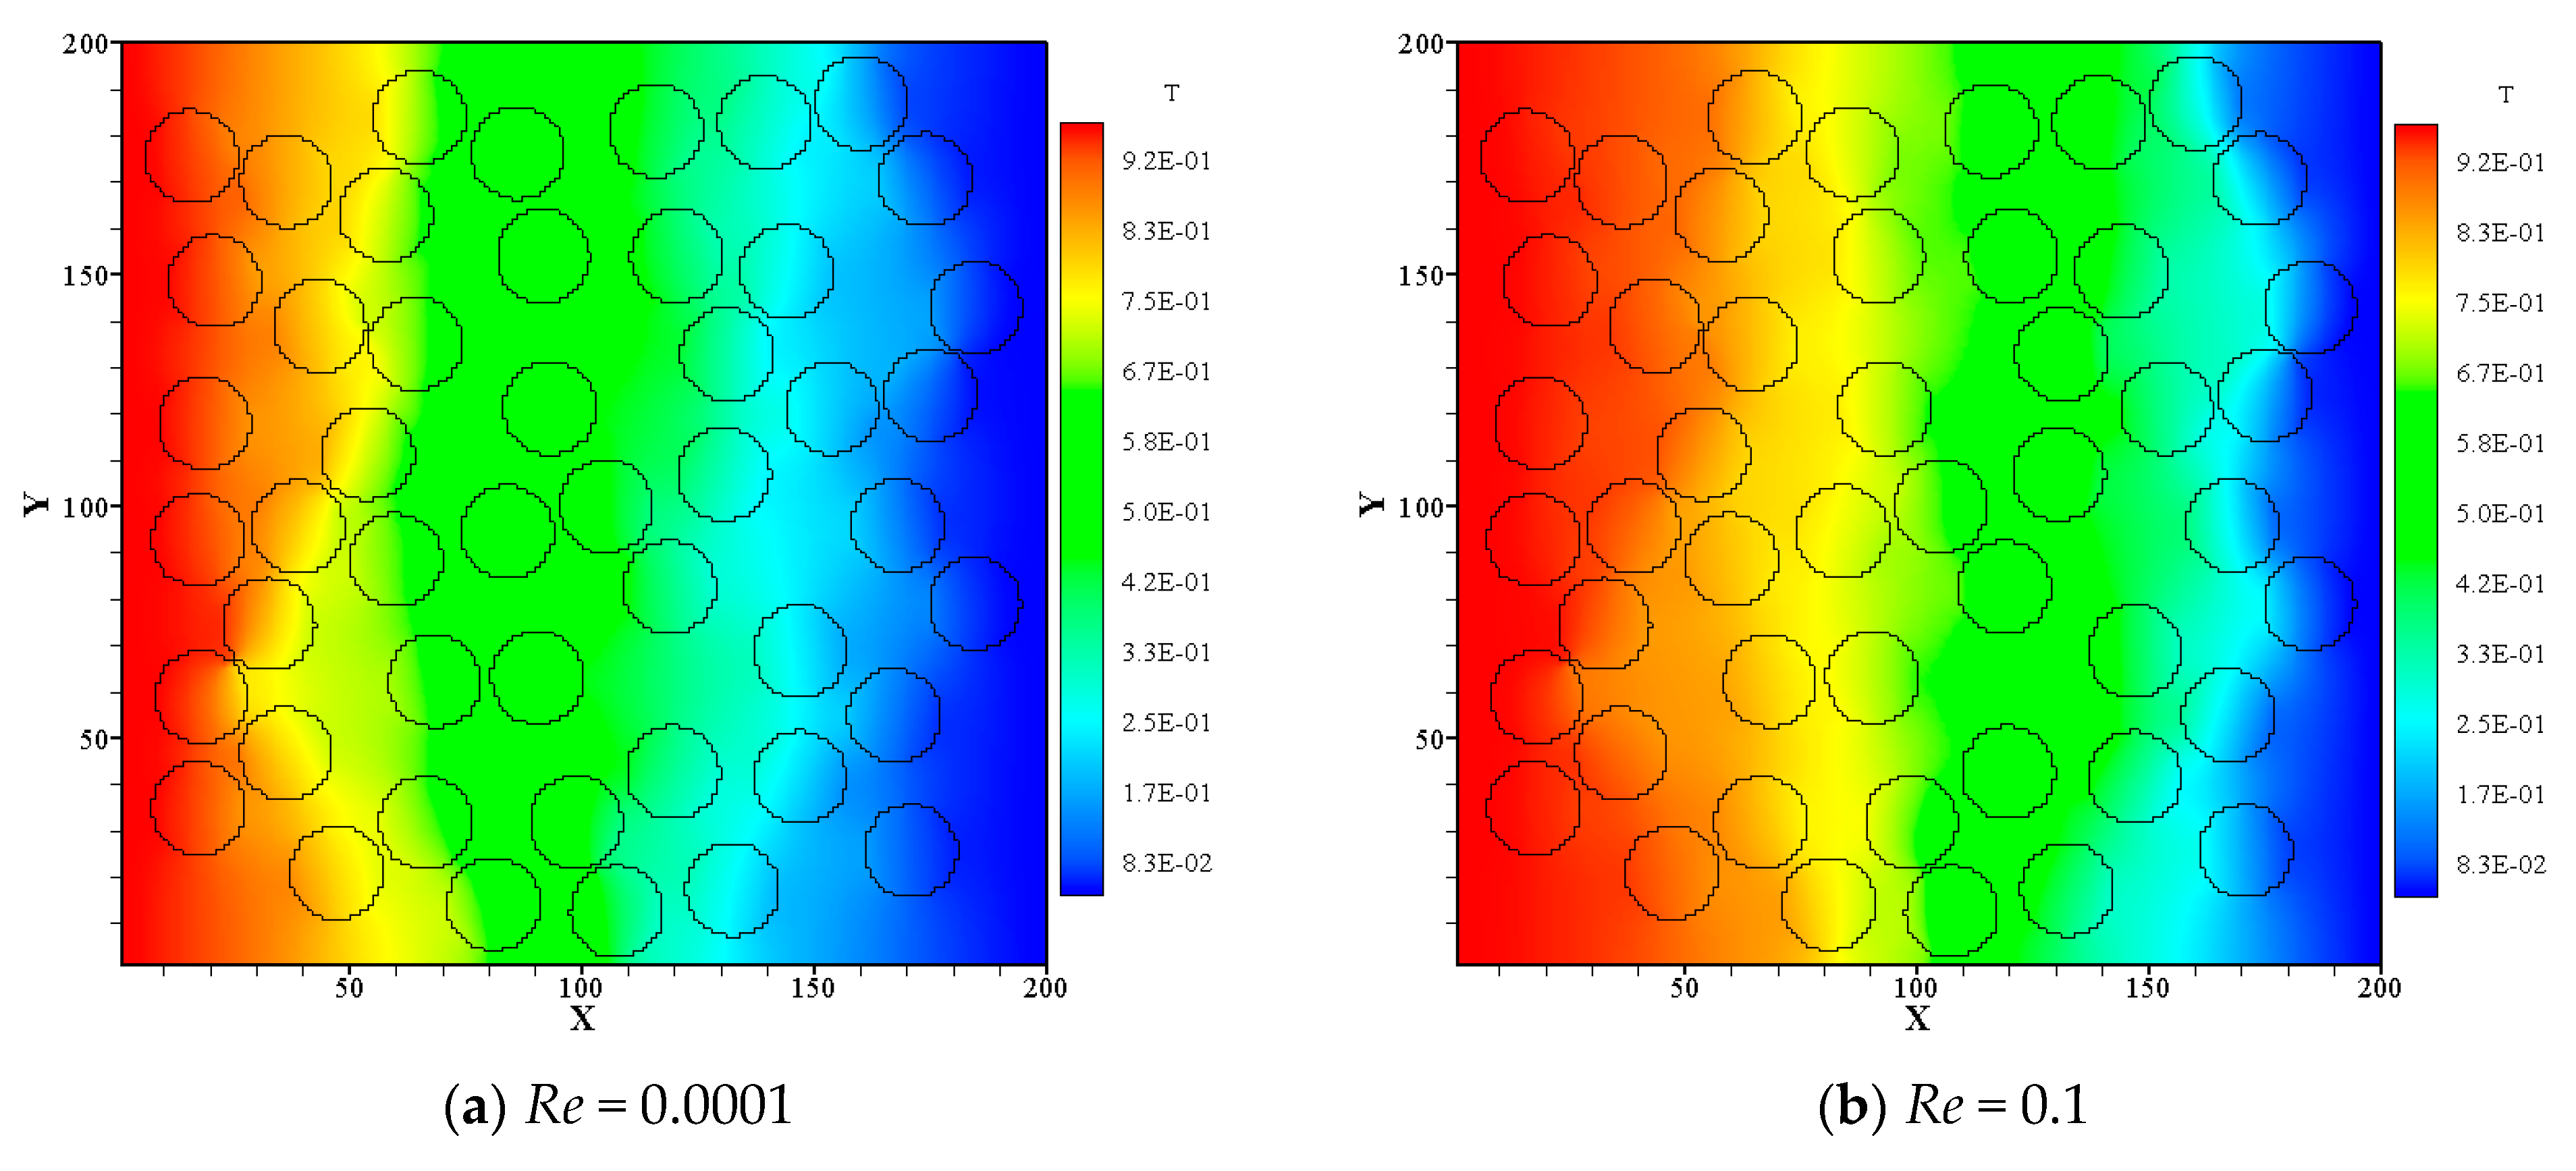
In Figure 24, (a) and (b) are temperature field nephogram with a Reynolds number of 0.0001 and a Reynolds number of 3, respectively. It can be seen from the figure that with the increase of Reynolds number, the range of right diffusion of high temperature region increases. As shown in Figure 17c, when the Reynolds number is 3, the temperature of the whole calculation region tends to be the same.

3.3. Flow Analysis of Quartet Structure Generation Set

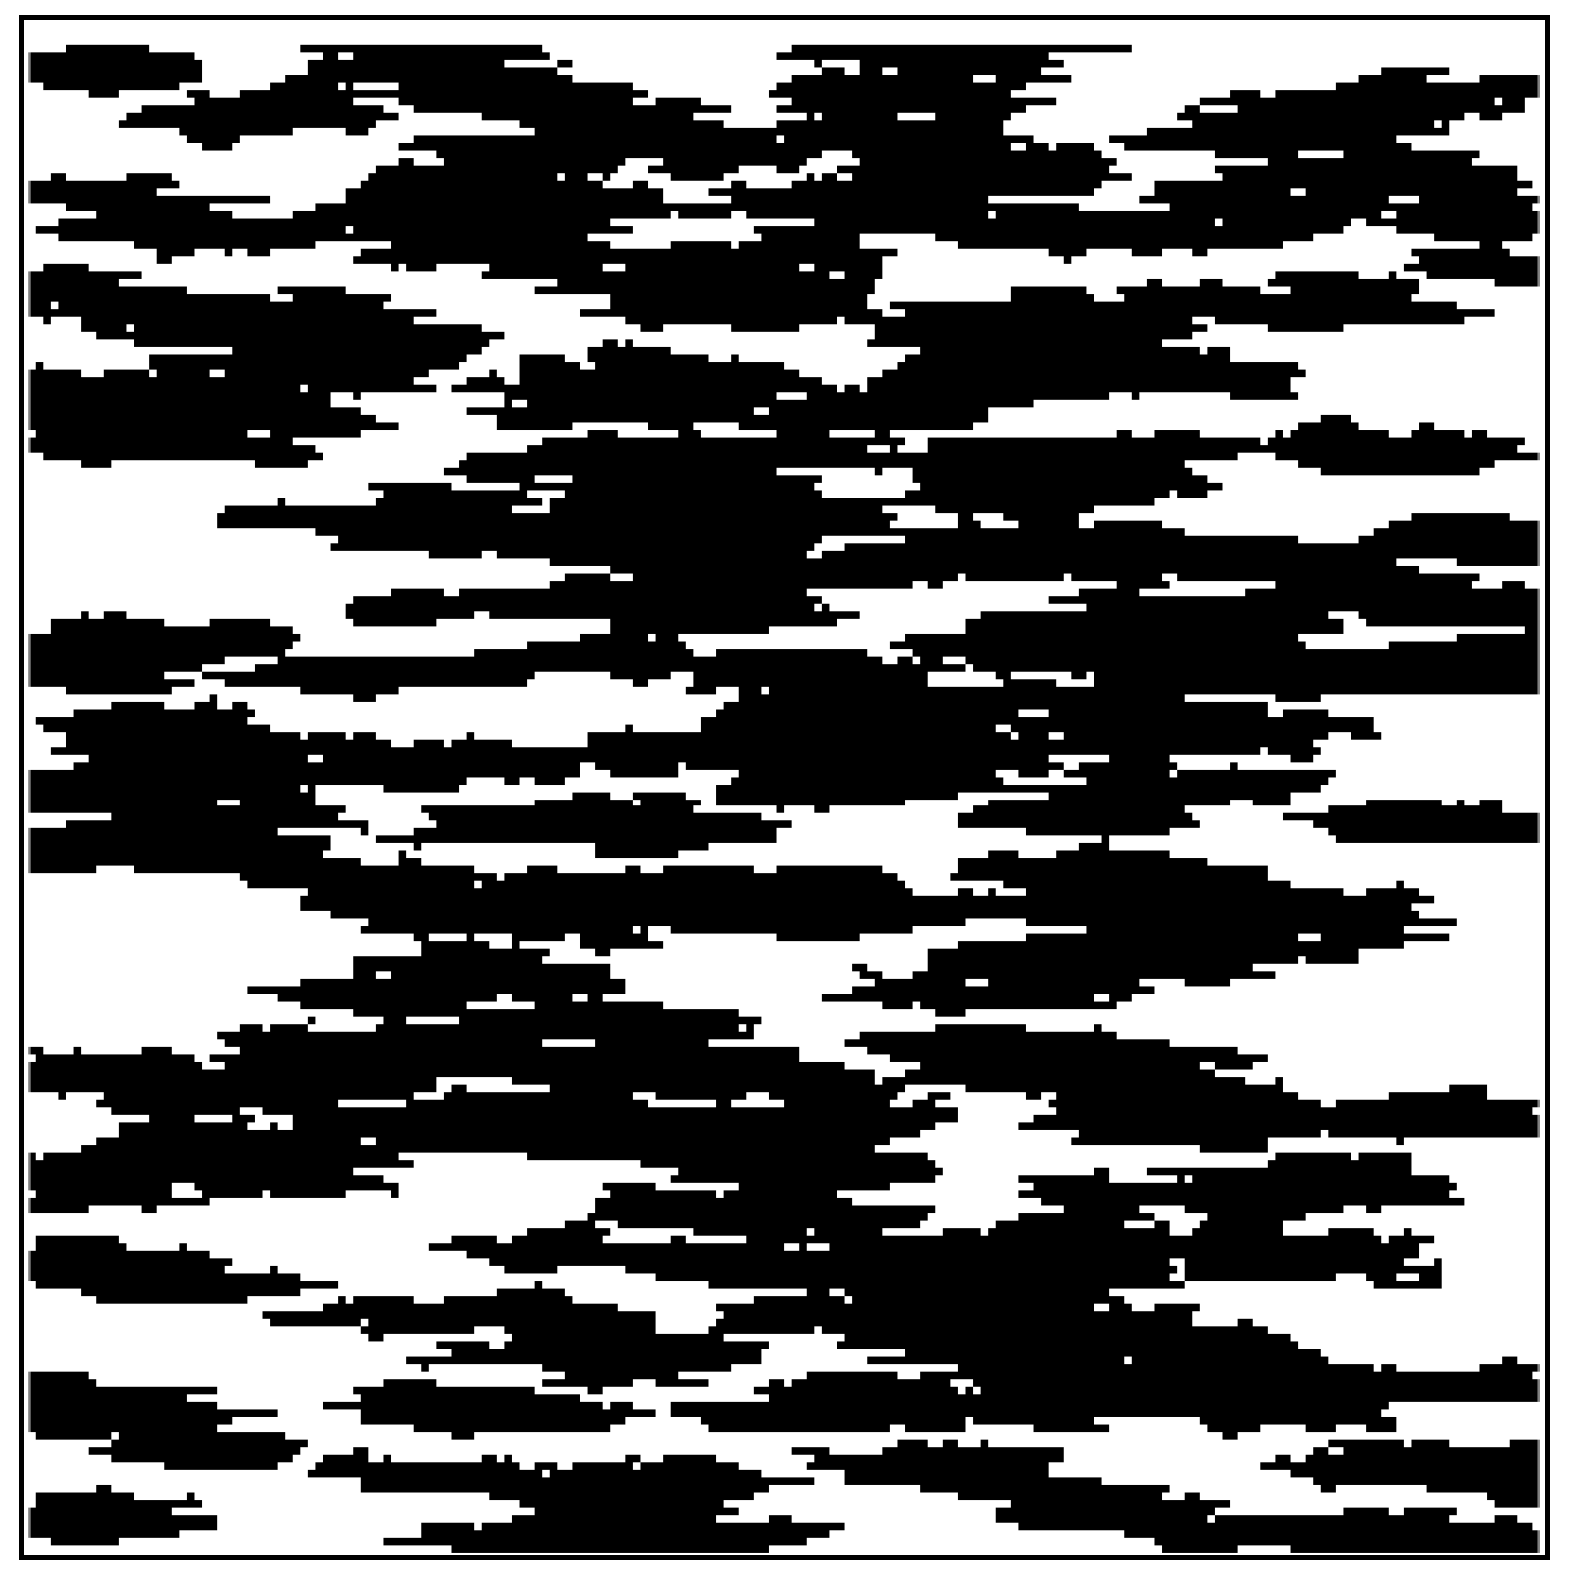
The porous media structure of particulate filters constructed by QSGS is shown in Figure 25. Where the porosity ε is 0.6; the probability in each direction is the growth core probability c d is 0.01; the probability of along the horizontal direction d l is 0.1; the probability of along the vertical direction d u is 0.001; and the probability of along the quadrangle direction d o is 0.001.
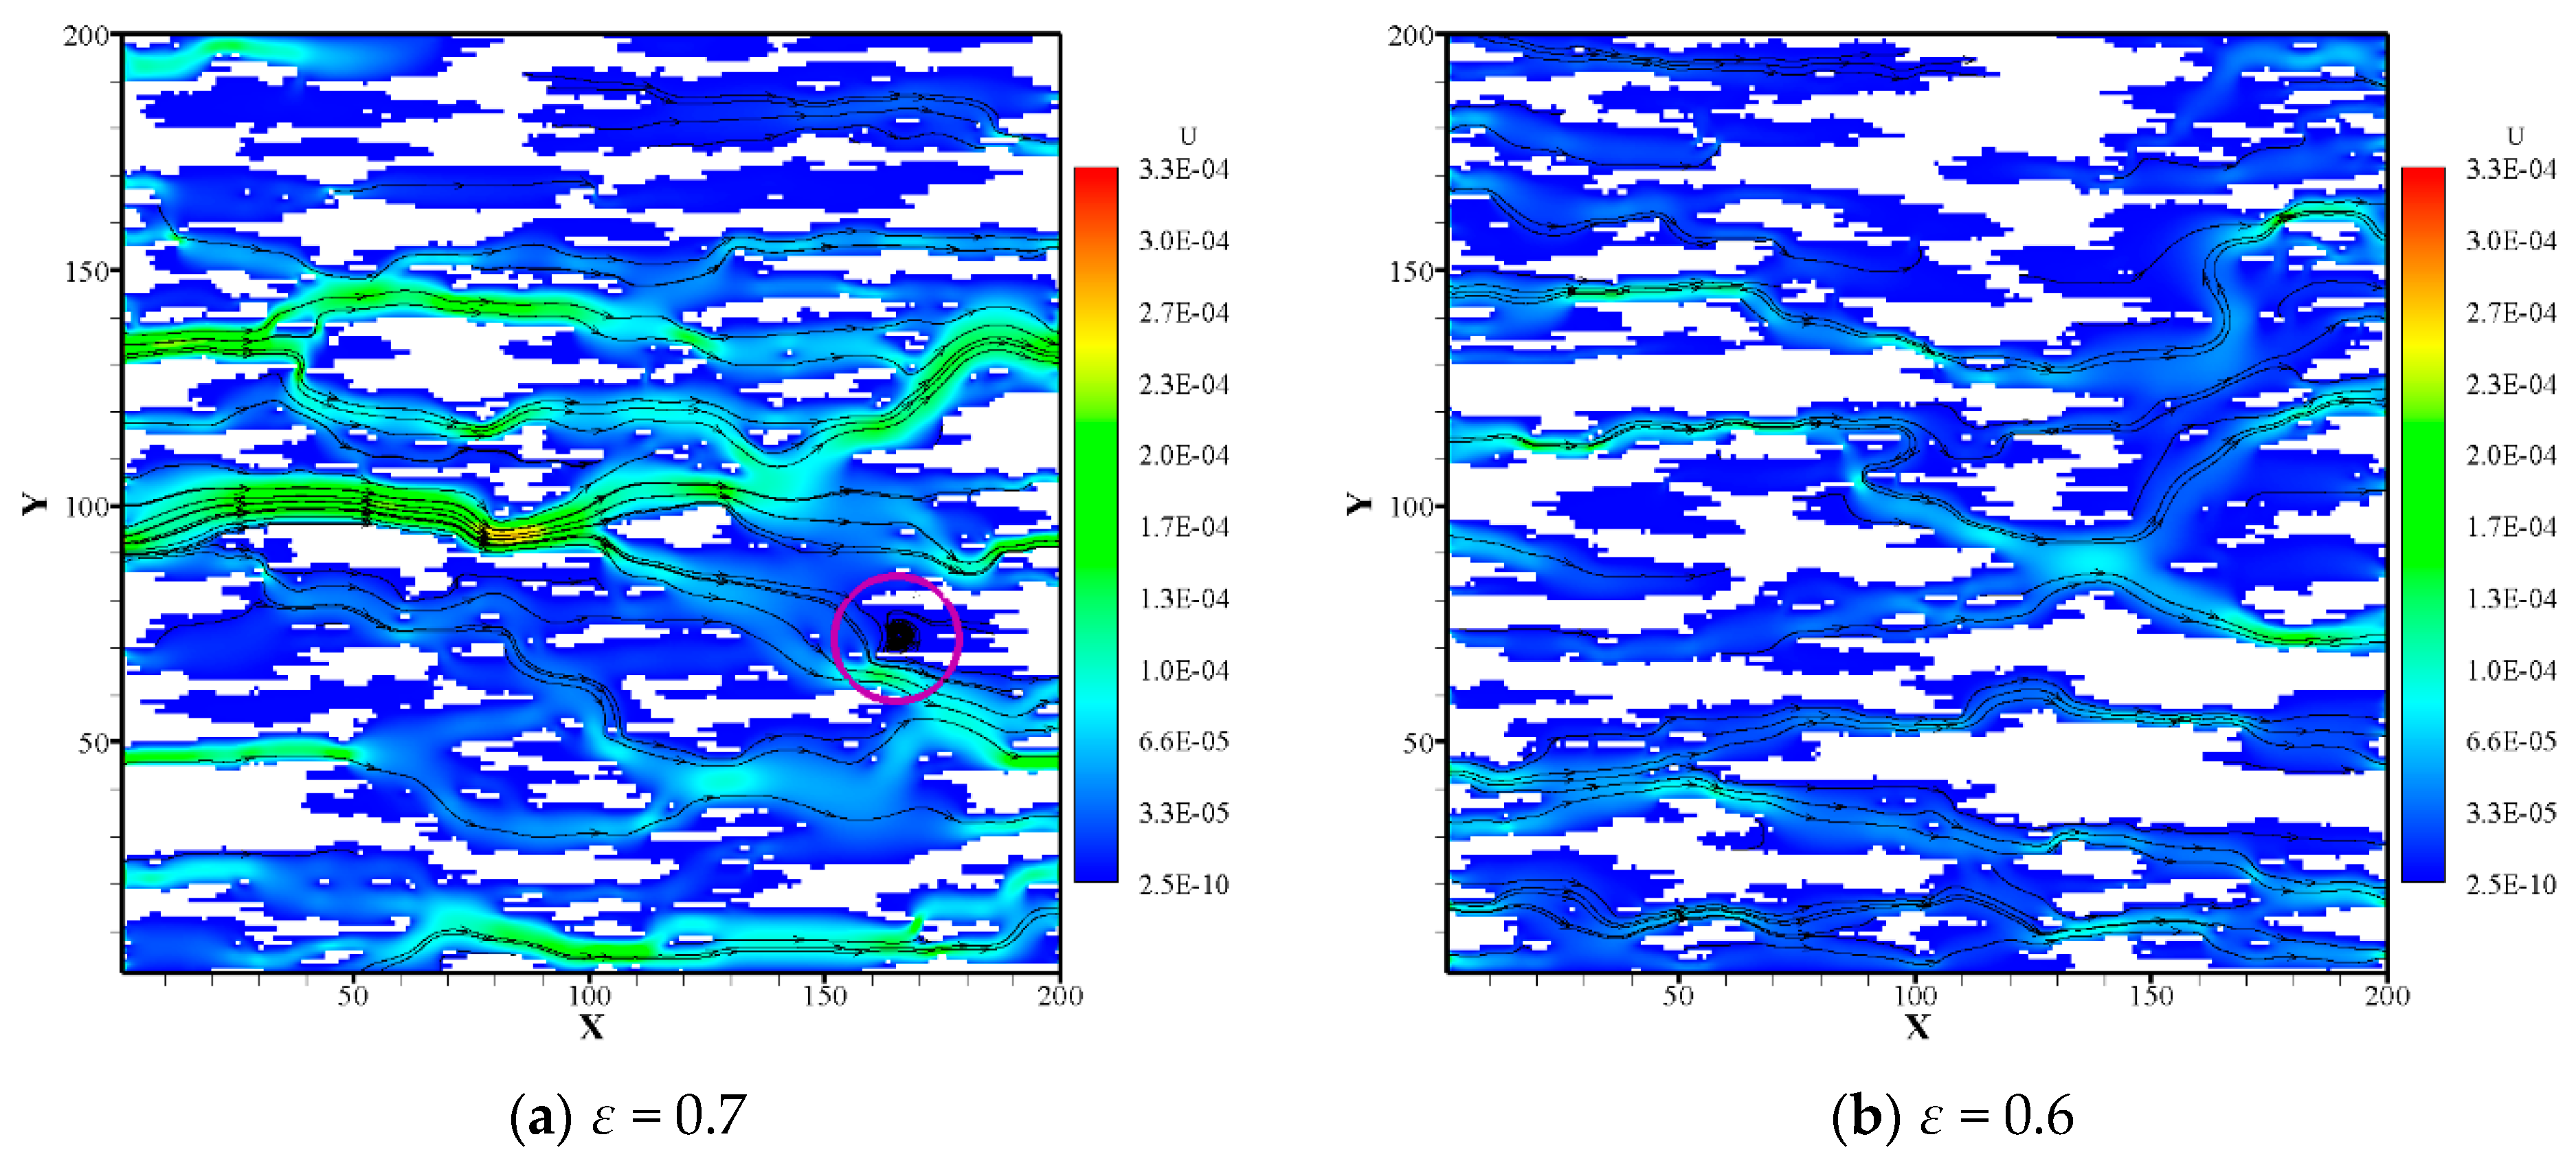
In Figure 26, (a) porosity is 0.7, while (b) porosity is 0.6, and the growth probability in all directions are: c d = 0.01, d l = 0.1, d u = 0.001, d o = 0.001. It can be seen from the figure that when the porosity is 0.7, the average velocity is larger. By comparing the velocity of fluid particles, it is found that the maximum velocity with porosity of 0.7 is less than the structure with porosity of 0.6. This is because the structure of low porosity is more tortuous and there are more dead angles. Under the condition of the same inlet velocity, the velocity of squeezed flow increases when the fluid flows through a smaller pore. The structure with the higher porosity has larger pore spacing, smoother fluid flow and larger average velocity. Under high Reynolds number, eddy current (purple circular marker) is easily generated in the tortuous pore.
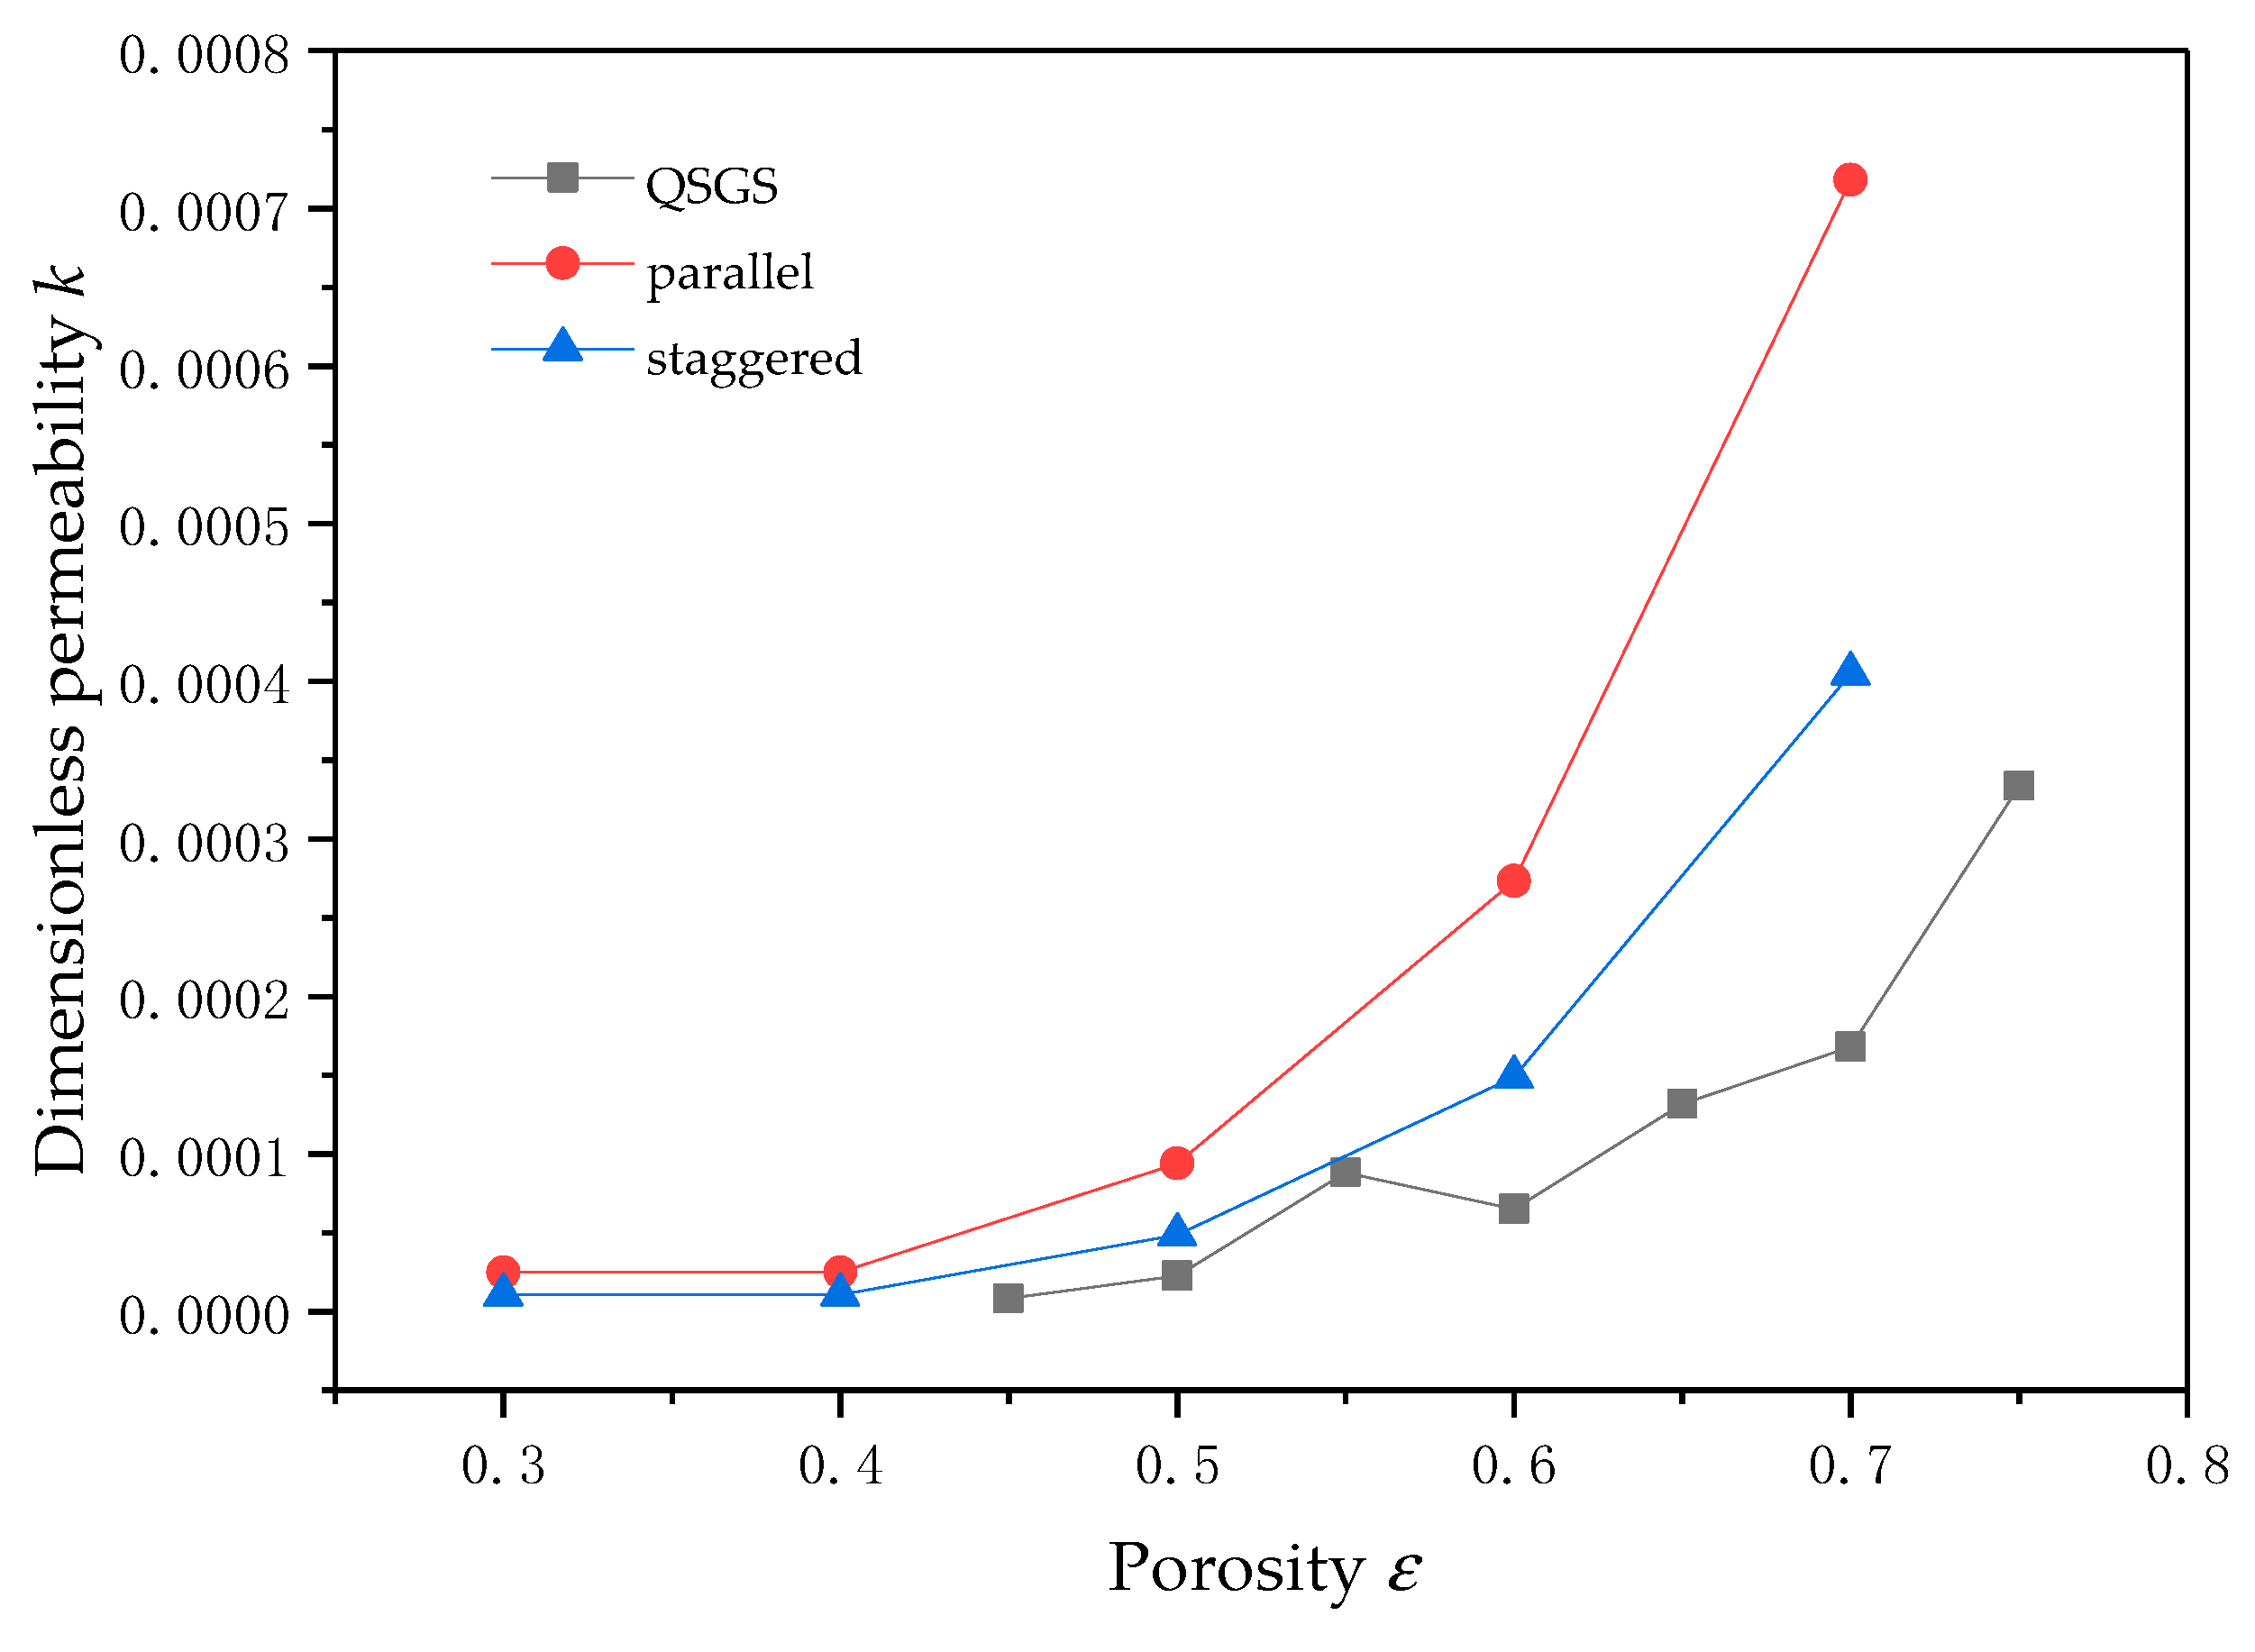
Figure 27 shows the variation of dimensionless permeability with porosity of parallel arrangement, staggered arrangement and QSGS, where Reynolds number is 0.1. It can be seen from the figure that the dimensionless permeability of the three structures increases with the increase of porosity, and the parallel arrangement structure is larger than the other two structures. This is because the staggered arrangement structure can hinder the inflow, and its pore is more tortuous than the parallel structure; while the QSGS has great randomness, there may be some tortuous paths and dead angles, which cannot form a path, and the permeability curve is not smooth enough, which has a certain volatility. In the simulation calculation, it is found that the QSGS cannot form a stable and complete pathway at a small porosity (ε < 0.43).
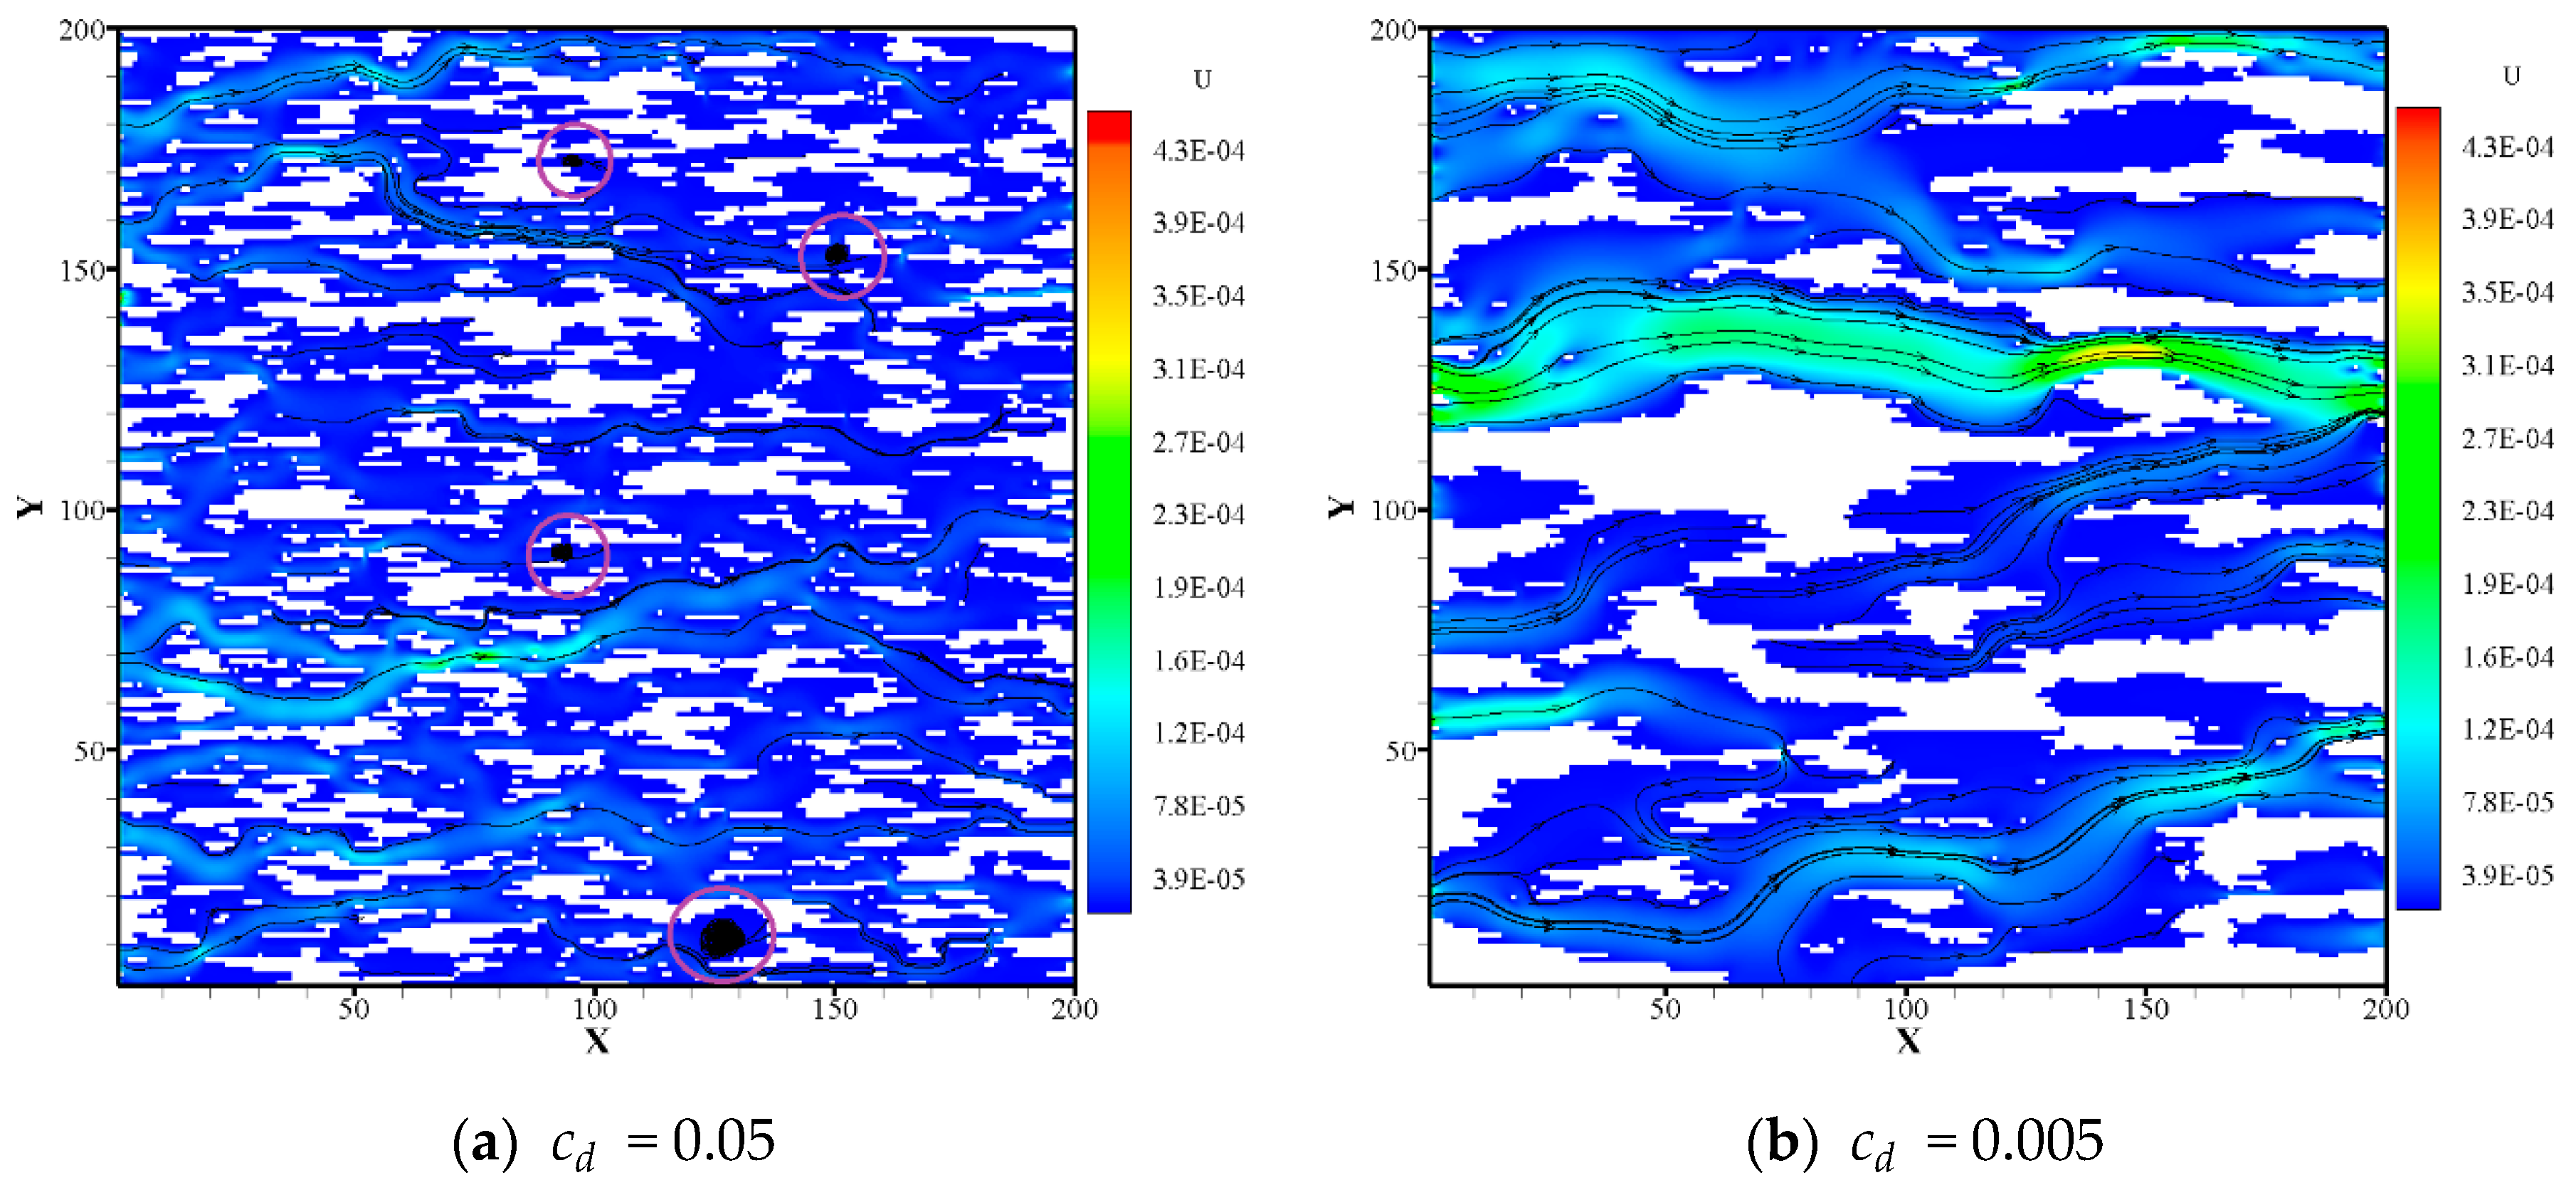
Changing the growth core probability, the larger the growth core probability c d is, the smaller the average size of the fibers and the more uniform the distribution is [28]. As shown in Figure 28, Porosity ε is 0.7, besides the probability of each direction is: d l = 0.1, d u = 0.001, d o = 0.001; Where (a) c d is 0.05 and (b) c d is 0.005.
As shown in Figure 29, with the increase of c d the permeability decreases gradually. This is due to the larger structure of c d ; the smaller average pore diameter; the easier formation of dead ends, and the easier generation of eddy currents at smaller pore sites, which hinders the passage of fluid.
Figure 30 shows a streamline diagram with growth core probabilities of 0.05 and 0.005, respectively. It can be seen that there are many eddies (purple circular markers) in the pore zigzags of higher c d structures, and the average velocity is lower than that of the lower c d structures.

4. Conclusions

In this paper, it is found by simulation that the flow law of different structures conforms to Darcy’s law at a low Reynolds number (Re < 1). For the parallel arrangement structure and the staggered arrangement structure, with the increase of Reynolds number, the temperature gradient decreases. The average Nusselt number of porous media increases approximately linearly with the increase of the Reynolds number, and the average Nusselt number of high porosity is larger than that of low porosity. The correlation between Nusselt number and Reynolds number is more consistent with the simulation results. The dimensionless permeability coefficient of the ordered structure is significantly larger than that of the disordered structure, but its filtration efficiency decreases. The particle size has a greater impact on the filtration efficiency. The particles with smaller and larger particle sizes have higher filtration efficiency, but for the particles with medium particle size, the filtration efficiency is relatively low because their Brownian force and inertia force are not obvious. The random structure has obvious temperature gradient and pressure gradient in the flow direction. There are many tortuous paths and dead ends in the QSGS, which have a great influence on dimensionless permeability.

Author Contributions

Conceptualization, T.Z. and X.L.; methodology, J.F.; validation, J.F. and X.L.; formal analysis, M.L.; investigation, J.F.; resources, T.Z., S.L. and X.Z.; writing—original draft preparation, J.F.; writing—review and editing, X.L. and M.L.; visualization, J.F.; supervision, T.Z. and X.L.; project administration, X.L.; funding acquisition, T.Z. and X.Z.

Funding

This research was funded by the Hebei Science and Technology Project (17274006D), the project “Research and Development of Purification Technology of Volatile Organic Compounds (VOCs) in GDI Gasoline Engine Exhaust”, National Engineering Laboratory for Mobile Source Emission Control Technology (NELMS2017B06), the project “Study on Particulate Matter Emission Control Technology of GDI Gasoline Vehicle Exhaust Meeting China 6 Standard”.

Conflicts of Interest

The authors declare no conflict of interest.

Nomenclature

Symbols
c d probability of growth core (QSGS)
c p constant pressure heat capacity
c s lattice sound speed
dffiber diameter
d i probability of growth in the direction i (QSGS)
d l probability of along the horizontal direction (QSGS)
d o probability of along the quadrangle direction (QSGS)
d p particle diameter
d u probability of along the vertical direction (QSGS)
e α lattice velocity in a direction
f α density distribution function
f α e q equilibrium distribution function for f α
F f drag force
F B Brownian force
F G gravity
F ε structure function related to ε
g gravitational acceleration
g α energy distribution function
g α e q equilibrium distribution function for g α
G x volume force
h ¯ average convective heat transfer coefficient
k B Boltzmann constant
k dimensionless permeability
m mass flow rate
NuNusselt number
N u ¯ average Nusselt number
Nx, Nynumbers of discretization nodes in the x and y direction
p pressure of gas
p i discrete motion probabilities
p pressure gradient
PrPrandtl number
q ¯ average heat flow
q v volume flow rate
rposition vector
RaRayleigh number
ReReynolds number
T gas temperature
u velocity vector of the gas
u p velocity vector of the particle
Δ x p displacement vector
X p displacement vector of the particle
#number
Greek Letters
δ x lattice spacing
δ t time step in lattice unit
ε porosity
ς zero-mean, unit-variance independent Gaussian random number
θ i a Boolean variable
λ f thermal conductivity of fluid
μ gas dynamic viscosity
ν gas kinematic viscosity
ρ density of gas
ρ p density of the particle
τ dimensionless relaxation time
τ g dimensionless relaxation time for g α
τ p relaxation time of the particle
ω α weight coefficient
Abbreviations
D2Q4the two-dimensional four-velocity lattice model
D2Q9the two-dimensional nine-velocity lattice model
LBMLattice Boltzmann Method
LB–CALattice Boltzmann–Cellular Automata
QSGSquartet structure generation set

References

  1. Price, P.; Stone, R.; OudeNijeweme, D.; Chen, X. Cold Start Particulate Emissions from a Second Generation DI Gasoline Engine. SAE Int. 2007. [Google Scholar] [CrossRef]
  2. Viswanathan, S.; Rothamer, D.; Zelenyuk, A.; Stewart, M.; Bell, D. Experimental investigation of the effect of inlet particle properties on the capture efficiency in an exhaust particulate filter. J. Aerosol Sci. 2017, 113, 250–264. [Google Scholar] [CrossRef]
  3. Limits and Measurement Methods for Emissions from Light-Duty Vehicles. GB: 18352.6-2016. 2016. Available online: http://www.vecc-mep.org.cn/info/one/889.html (accessed on 28 August 2019).
  4. Ohara, E.; Mizuno, Y.; Miyairi, Y.; Mizutani, T.; Yuuki, K.; Noguchi, Y.; Hiramatsu, T.; Makino, M.; Takahashi, A.; Sakai, H.; et al. Filtration Behavior of Diesel Particulate Filters (1). SAE Int. 2007. [Google Scholar] [CrossRef]
  5. Somiya, S. Handbook of Advanced Ceramics: Materials, Applications, Processing, and Properties; Academic Press: Cambridge, MA, USA, 2013. [Google Scholar]
  6. Bao, H.; Chen, J.; Gu, X.; Cao, B. A review of Simulation Methods in Micro/Nanoscale Heat Conduction. ES Energy Environ. 2018, 1, 16–55. [Google Scholar] [CrossRef]
  7. Bensaid, S.; Marchisio, D.L.; Fino, D.; Saracco, G.; Specchia, V. Modelling of diesel particulate filtration in wall-flow traps. Chem. Eng. J. 2009, 154, 211–218. [Google Scholar] [CrossRef]
  8. Serrano, J.R.; Climent, H.; Piqueras, P.; Angiolini, E. Filtration modelling in wall-flow particulate filters of low soot penetration thickness. Energy 2016, 112, 883–898. [Google Scholar] [CrossRef]
  9. Liu, Y.; Gong, J.; Fu, J.; Cai, H.; Long, G. Nanoparticle motion trajectories and deposition in an inlet channel of wall-flow diesel particulate filter. J. Aerosol Sci. 2009, 40, 307–323. [Google Scholar] [CrossRef]
  10. Lee, D.Y.; Lee, G.W.; Yoon, K.; Chun, B.; Jung, H.W. Lattice Boltzmann simulations for wall-flow dynamics in porous ceramic diesel particulate filters. Appl. Surf. Sci. 2018, 429, 72–80. [Google Scholar] [CrossRef]
  11. Kong, X.; Li, Z.; Shen, B.; Wu, Y.; Zhang, Y.; Cai, D. Simulation of flow and soot particle distribution in wall-flow DPF based on lattice Boltzmann method. Chem. Eng. Sci. 2019, 202, 169–185. [Google Scholar] [CrossRef]
  12. Abchouyeh, M.A.; Fard, O.S.; Mohebbi, R.; Sheremet, M.A. Enhancement of heat transfer of nanofluids in the presence of sinusoidal side obstacles between two parallel plates through the lattice Boltzmann method. Int. J. Mech. Sci. 2019, 156, 159–169. [Google Scholar] [CrossRef]
  13. Mohebbi, R.; Izadi, M.; Sajjadi, H.; Delouei, A.A.; Sheremet, M.A. Examining of nanofluid natural convection heat transfer in a Γ-shaped enclosure including a rectangular hot obstacle using the lattice Boltzmann method. Phys. A Stat. Mech. Its Appl. 2019, 526, 120831. [Google Scholar] [CrossRef]
  14. Lupše, J.; Campolo, M.; Soldati, A. Modelling soot deposition and monolith regeneration for optimal design of automotive DPFs. Chem. Eng. Sci. 2016, 151, 36–50. [Google Scholar] [CrossRef]
  15. Galindo, J.; Serrano, J.R.; Piqueras, P.; García-Afonso, Ó. Heat transfer modelling in honeycomb wall-flow diesel particulate filters. Energy 2012, 43, 201–213. [Google Scholar] [CrossRef]
  16. Yamamoto, K.; Nakamura, M. Simulation of heat conduction and soot combustion in diesel particulate filter. Prog. Comput. Fluid Dyn. Int. J. 2012, 12, 286–292. [Google Scholar] [CrossRef]
  17. Eshghinejadfard, A.; Thévenin, D. Numerical simulation of heat transfer in particulate flows using a thermal immersed boundary lattice Boltzmann method. Int. J. Heat Fluid Flow 2016, 60, 31–46. [Google Scholar] [CrossRef]
  18. Zhang, P.; Galindo-Torres, S.A.; Tang, H.; Jin, G.; Scheuermann, A.; Li, L. An efficient Discrete Element Lattice Boltzmann model for simulation of particle-fluid, particle-particle interactions. Comput. Fluids 2017, 147, 63–71. [Google Scholar] [CrossRef] [Green Version]
  19. Qian, Y.-H.; d’Humières, D.; Lallemand, P. Lattice BGK models for Navier-Stokes equation. EPL 1992, 17, 479. [Google Scholar] [CrossRef]
  20. Guo, Z.; Shi, B.; Wang, N. Lattice BGK Model for Incompressible Navier–Stokes Equation. J. Comput. Phys. 2000, 165, 288–306. [Google Scholar] [CrossRef]
  21. Delouei, A.A.; Nazari, M.; Kayhani, M.H.; Ahmadi, G. A non-Newtonian direct numerical study for stationary and moving objects with various shapes: An immersed boundary—Lattice Boltzmann approach. J. Aerosol Sci. 2016, 93, 45–62. [Google Scholar] [CrossRef]
  22. Chang, C.-C.; Yang, Y.-T.; Yen, T.-H.; Chen, C.O.-K. Numerical investigation into thermal mixing efficiency in Y-shaped channel using Lattice Boltzmann method and field synergy principle. Int. J. Therm. Sci. 2009, 48, 2092–2099. [Google Scholar] [CrossRef]
  23. Bohn, C.D.; Scott, S.A.; Dennis, J.S.; Müller, C.R. Validation of a lattice Boltzmann model for gas–solid reactions with experiments. J. Comput. Phys. 2012, 231, 5334–5350. [Google Scholar] [CrossRef]
  24. Wang, J.; Wang, M.; Li, Z. A lattice Boltzmann algorithm for fluid–solid conjugate heat transfer. Int. J. Therm. Sci. 2007, 46, 228–234. [Google Scholar] [CrossRef]
  25. Mohamad, A.A. Applied lattice Boltzmann method for transport phenomena, momentum, heat and mass transfer. Can. J. Chem. Eng. 2007, 85, 946. [Google Scholar]
  26. Succi, S. The Lattice Boltzmann Equation: For Fluid Dynamics and Beyond; Oxford University Press: Oxford, UK, 2001. [Google Scholar]
  27. Guo, Z.; Zheng, C.; Shi, B. Non-equilibrium extrapolation method for velocity and pressure boundary conditions in the lattice Boltzmann method. Chin. Phys. 2002, 11, 366. [Google Scholar] [CrossRef]
  28. Wang, M.; Pan, N.; Wang, J.; Chen, S. Mesoscopic simulations of phase distribution effects on the effective thermal conductivity of microgranular porous media. J. Colloid Interface Sci. 2007, 311, 562–570. [Google Scholar] [CrossRef] [Green Version]
  29. Chopard, B.; Masselot, A. Cellular automata and lattice Boltzmann methods: A new approach to computational fluid dynamics and particle transport. Future Gener. Comput. Syst. 1999, 16, 249–257. [Google Scholar] [CrossRef]
  30. Wang, H.; Zhao, H.; Guo, Z.; Zheng, C. Numerical simulation of particle capture process of fibrous filters using Lattice Boltzmann two-phase flow model. Powder Technol. 2012, 227, 111–122. [Google Scholar] [CrossRef]
  31. He, Y.; Wang, Y.; Li, Q. Lattice Boltzmann Method: Theory and Applications; Science: Beijing, China, 2009. [Google Scholar]
  32. Guo, Z.; Shi, B.; Zheng, C. A coupled lattice BGK model for the Boussinesq equations. Int. J. Numer. Methods Fluids 2002, 39, 325–342. [Google Scholar] [CrossRef]
  33. De Vahl Davis, G. Natural convection of air in a square cavity: A bench mark numerical solution. Int. J. Numer. Methods Fluids 1983, 3, 249–264. [Google Scholar] [CrossRef]
  34. Hortmann, M.; Perić, M.; Scheuerer, G. Finite volume multigrid prediction of laminar natural convection: Bench-mark solutions. Int. J. Numer. Methods Fluids 1990, 11, 189–207. [Google Scholar] [CrossRef]
  35. Hu, Y. Numerical Methods of Flow and Heat Transfer in Complex Geometries and Porous Media Based on Lattice Boltzmann Method; Beijing Jiaotong Univercity: Beijing, China, 2017. [Google Scholar]
  36. Wang, H.; Zhao, H.; Guo, Z.; He, Y.; Zheng, C. Lattice Boltzmann method for simulations of gas-particle flows over a backward-facing step. J. Comput. Phys. 2013, 239, 57–71. [Google Scholar] [CrossRef]
  37. Liu, Z.G.; Wang, P.K. Pressure Drop and Interception Efficiency of Multifiber Filters. Aerosol Sci. Technol. 1997, 26, 313–325. [Google Scholar] [CrossRef] [Green Version]
  38. Yazdchi, K.; Srivastava, S.; Luding, S. Micro–macro relations for flow through random arrays of cylinders. Compos. Part A Appl. Sci. Manuf. 2012, 43, 2007–2020. [Google Scholar] [CrossRef]
  39. Yazdchi, K.; Luding, S. Towards unified drag laws for inertial flow through fibrous materials. Chem. Eng. J. 2012, 207, 35–48. [Google Scholar] [CrossRef]
  40. Wen, J.; Teng, Q. A Research Review on Gasoline Particulate Filter Technology for Gasoline Direct Injection Engine. Small Intern. Combust. Engine Veh. Tech. 2016, 45, 77–83. [Google Scholar] [CrossRef]
  41. Bear, J. Dynamics of Fluids in Porous Media; Courier Corporation: North Chelmsford, MA, USA, 2013. [Google Scholar]
  42. Zhang, M.; Ye, G.; Breugel, K. Microstructure-based modeling of permeability of cementitious materials using multiple-relaxation-time lattice Boltzmann method. Comput. Mater. Sci. 2013, 68, 142–151. [Google Scholar] [CrossRef]
  43. Firdaouss, M.; Guermond, J.-L.; Le Quéré, P. Nonlinear corrections to Darcy’s law at low Reynolds numbers. J. Fluid Mech. 1997, 343, 331–350. [Google Scholar] [CrossRef]
  44. Marusic-Paloka, E.; Mikelic, A. The derivation of a nonlinear filtration law including the inertia effects via homogenization. Nonlinear Anal. 2000, 42, 97. [Google Scholar] [CrossRef]
  45. Mei, C.; Auriault, J.-L. The effect of weak inertia on flow through a porous medium. J. Fluid Mech. 1991, 222, 647–663. [Google Scholar] [CrossRef]
  46. Newman, M.S.; Yin, X. Lattice Boltzmann Simulation of Non-Darcy Flow In Stochastically Generated 2D Porous Media Geometries. SPE J. 2013, 18, 12–26. [Google Scholar] [CrossRef]
  47. Lin, T. Numerical Study on Single Phase Flow and Heat Transfer in Porous Media with Lattice Boltzmann Method; China University of Petroleum: Beijing, China, 2016. [Google Scholar]
  48. Tang, W.; Kang, X. Lattice Boltzmann method simulating flow in porous media. J. Beijing Norm. Univ. 2016, 52, 12–16. [Google Scholar] [CrossRef]
  49. Kamiuto, K.; Yee, S.S. Heat transfer correlations for open-cellular porous materials. Int. Commun. Heat Mass Transf. 2005, 32, 947–953. [Google Scholar] [CrossRef]
  50. Nakayama, A.; Ando, K.; Yang, C.; Sano, Y.; Kuwahara, F.; Liu, J. A study on interstitial heat transfer in consolidated and unconsolidated porous media. Heat Mass Transf. 2009, 45, 1365–1372. [Google Scholar] [CrossRef]
  51. Kuwahara, F.; Shirota, M.; Nakayama, A. A numerical study of interfacial convective heat transfer coefficient in two-energy equation model for convection in porous media. Int. J. Heat Mass Transf. 2001, 44, 1153–1159. [Google Scholar] [CrossRef]
  52. Wang, H.; Zhao, H.; Wang, K.; He, Y.; Zheng, C. Simulation of filtration process for multi-fiber filter using the Lattice-Boltzmann two-phase flow model. J. Aerosol Sci. 2013, 66, 164–178. [Google Scholar] [CrossRef]
Figure 1. Schematic diagram of engine particulate filters structure.
Energies 12 03319 g001
Figure 2. Filtration mechanism of particulate filters.
Energies 12 03319 g002
Figure 3. Approximate length and time scales for the commonly used computational methods.
Energies 12 03319 g003
Figure 4. Diagram of D2Q9 Model.
Energies 12 03319 g004
Figure 5. Non-equilibrium extrapolation format.
Energies 12 03319 g005
Figure 6. Particle motion diagram in cellular automata probability model.
Energies 12 03319 g006
Figure 7. LB–CA model algorithmic flow chart.
Energies 12 03319 g007
Figure 8. Lid driven cavity flow streamline diagrams with different Re.
Energies 12 03319 g008aEnergies 12 03319 g008b
Figure 9. Streamlines and isothermal lines of natural convection for different Ra.
Energies 12 03319 g009aEnergies 12 03319 g009b
Figure 10. Comparison of LB simulation results and analytical solutions for Poiseuille flow in porous media.
Energies 12 03319 g010
Figure 11. Schematic diagram of calculation region of backward-facing step flow field.
Energies 12 03319 g011
Figure 12. Comparison of particle trajectories between the LB-Lagrangian and LB–CA methods.
Energies 12 03319 g012
Figure 13. Mesh sensitivity study for dimensionless permeability.
Energies 12 03319 g013
Figure 14. The structure of the inner wall of the particulate filters by tomography and the schematic diagram of calculating area.
Energies 12 03319 g014
Figure 15. Parallel arrangement structure and staggered arrangement structure.
Energies 12 03319 g015
Figure 16. Relation between dimensionless permeability and Reynolds number of parallel and staggered structures.
Energies 12 03319 g016
Figure 17. The relationship between pressure gradient and mean velocity of parallel and staggered structures.
Energies 12 03319 g017
Figure 18. Relation between Reynolds number and temperature gradient of parallel and staggered structures.
Energies 12 03319 g018
Figure 19. The relationship between dimensionless permeability and temperature gradient of parallel arrangement structure.
Energies 12 03319 g019
Figure 20. The relationship between average Nusselt number and Reynolds number.
Energies 12 03319 g020
Figure 21. The relationship between filtration efficiency and particle size of parallel and staggered structures.
Energies 12 03319 g021
Figure 22. Random structural diagram.
Energies 12 03319 g022
Figure 23. Nephogram of flow field, temperature field and pressure distribution in random structure.
Energies 12 03319 g023
Figure 24. Temperature field nephogram of random structure with different Reynolds numbers.
Energies 12 03319 g024
Figure 25. Schematic diagram of quartet structure generation set.
Energies 12 03319 g025
Figure 26. Flow field nephogram of quartet structure generation set with different porosity.
Energies 12 03319 g026
Figure 27. Relationships between porosity and dimensionless permeability of parallel, staggered and quartet structure generation set.
Energies 12 03319 g027
Figure 28. Quartet structure generation set with different growth core probabilities.
Energies 12 03319 g028
Figure 29. The relationship between growth core probability and dimensionless permeability of quartet structure generation set.
Energies 12 03319 g029
Figure 30. Streamline diagrams of quartet structure generation set with different growth core probabilities.
Energies 12 03319 g030