Abstract
This study analyzes the possibility to use the wind’s kinetic energy to produce electricity in Northern Qatar for the natural gas processing industry. An evaluation of the wind potentiality is performed based on a thorough analysis of parameters such as wind speed and direction, temperature, atmospheric pressure, and air density. In addition, based on the measured parameters, a commercial wind turbine is selected, and a case study is presented in order to quantify the energy that a wind farm could produce and its environmental benefits. Furthermore, an economical assessment is made to quantify the repercussions that it could produce if this wind farm substitutes a fraction of the energy demand (within the oil and gas field) that is currently generated by traditional hydrocarbons. The results indicate that the environmental parameters, led by a 5.06 m/s wind speed mean, allow the production of wind energy in the area with an annual CO2 savings of 6.813 tons in a 17 MW wind power plant. This enables Qatar to reduce its internal oil and gas consumption. As a result, the amount of hydrocarbon (natural gas) saved could be used for exportation purposes, generating a positive outcome for the economy with a cost savings of about 3.32 million US$ per year through such a small size wind power plant. From the energy production point of view, the natural parameters enable a single wind turbine to produce an average of 6995.26 MWh of electricity. Furthermore, the wind farm utilized in the case study is capable of generating an average of 34.976 MWh in a year.
1. Introduction
In recent years, there has been an increase in the concerns of environmental conservation. For this reason, several studies and measures have been made in order to reduce the amount of pollution generated around the world. One of the solutions is to lower the amount of greenhouse gas (GHG) that is released to the atmosphere in large amounts due to energy generation and consumption.
From a national point of view, Qatar’s energy consumption has increased at an accelerated pace in recent years. This escalation is associated with the population’s growth, higher living standards, and industry growth in the country. In addition, due to the hot weather of the region approximately 80% of the generated electricity in Qatar is used for cooling purposes (air conditioning). Furthermore, these energy requirements are largely met by generating electricity from fossil fuels (natural gas and petroleum) which are limited resources and should be conserved [1].
The State of Qatar has taken into account the impact the growth indicated above is having on the environment. For this reason, the country redacted the fourth pillar of the Qatar National Vision 2030, which indicates that Qatar has an obligation to face local environmental issues, such as the impact of diminishing natural resource use, such as water and hydrocarbons, pollution, and the environment’s deteriorating state. This vision also addresses international environmental matters such as the impact of global warming on water levels, and its direct impact on the nation’s coastal development [2]. One of the methods to reduce the consumption of hydrocarbon resources and meet the energy demands of a growing country is to generate electricity from a nonpolluting, renewable natural resources, such as wind energy. The rapid growth in wind energy use is associated with an increase of its efficiency and a decrease in the cost of wind turbines to a point where wind power generation is competitive with traditional methods [1].
This study utilizes real on-site wind measurements to determine the wind energy potential and to propose a wind farm near natural gas processing plants for self-consumption. This can lead to reduction of the GHG emissions originating from oil and gas industry, and form a “greener” approach to the supply of electricity to the industries. This paper has a different approach than other previous publications in that it contributes not only by analyzing Qatar’s wind energy potential to generate sustainable electricity, but also the associated environmental impact reduction due to use of wind energy, and the economic benefits achieved due to the reduction in internal oil and gas consumption (used for energy production) and converting the consumed internal hydrocarbon consumption to exported products. This demonstrates the significance of utilizing wind energy even for hydrocarbon-based countries. In this regard, the specific objectives of this research are to:
- Determine the wind energy potential in Qatar for power generation need of the natural gas industry.
- Calculate the producible amount of energy from a wind farm located in the north of Qatar.
- Elaborate on the environmental impact reduction achieved through wind energy production
- Assess the potential economic benefits led by less internal oil and gas consumption and additional natural gas export.
2. Previous Studies
The evolution of the wind energy technology and the increase of the environmentally friendly mentality has resulted in several studies about wind energy in the region. Not only from the potential point of view, but also from an economical approach. For instance, in 1990, a combined analysis of solar and wind energy in Qatar was conducted. This research concluded that the solar power density is 9.5 times larger than the wind power density Also, based on the data collected, the annual maximum attainable potential was 306 kWh/m2/y for wind, and 2.5 MWh/m2/y for solar energy [3]. It is important to note that in this case, the wind energy potential was based on measurements made 10 m above ground level, and only a small extrapolation to 25 m was made. This can underestimate the actual wind potential of large wind turbines.
In a more recent study [1], an economic feasibility for an on-shore/off-shore wind energy system for Qatar was performed. The results of that case study showed that the use of wind to produce electricity is economically competitive with conventional energy sources. Also, the study performed a comparison between the generation cost per unit of energy output from a gas turbine and wind farm in Qatar, highlighting that the second option could have values as low as 0.0289 ECU/kWh versus 0.0342 ECU/kWh from the traditional fossil fuel. As a result, the utilization of small to medium-size wind energy turbines can be efficient and competitive [1].
In order to find an environmentally friendly solution to small-scale applications, a study for the implementation of a green hybrid power plant using photovoltaic and wind energy was performed [4]. The results of that scenario were positive, indicating that both solar and wind energy are viable in Qatar, with solar having more potential than wind energy. Furthermore, that paper highlighted that the use of small to medium-size wind turbine generators is reasonable, even though the analysis was made based on measurements taken only 20 m above ground level, without performing any type of extrapolation [4].
The studies focusing in Qatar so far indicate the possibility to use wind energy to generate low-cost electricity. However, most of these studies were inspired by the negative impact of region-wide environmental analysis, in which Qatar is highlighted as one of the biggest CO2/capita contributors in the world due to being one of the largest LNG exporters. The research indicated that in 2010, it was the leader of CO2 generation with 46 metric tons CO2/capita. Furthermore, it highlights that the country has a 10% renewable energy target by 2030 that shows the interest of Qatar to improve their impact on the world. Concerning the wind potential in the country, the investigation indicated that this natural resource is economically viable based on the fact that the country has 1421 h of full-load wind per year, and any location with a value above 1400 h has the potential for wind energy production [5]. A broader analysis for the GCC countries is also considered here. Similar to the previous study, a review of renewable energy potential in the GCC region was conducted in 2013. It was stated that Qatar and Kuwait present the highest ecological impact rate per capita. Qatar’s oil and gas industry was the source of 67% of the 2009 emissions. In addition, it indicated that Qatar has set a target to generate at least 2% of electrical power from solar energy by 2020. Regarding wind energy, the study indicated that Qatar has a reasonable power density that allows the country to use this natural energy source [6].
Using a different approach, a renewable energy policy trend analysis was made for the GCC countries [7]. The study indicated that Qatar uses natural gas to cover over 60% of their primary energy needs and nearly 100% of their power demand. As well, in 2014, Qatar consumed approximately 16% of its oil. As a target, Qatar is aimed towards an economic diversification away from hydrocarbons. As a conclusion, the paper indicated that the tendency in renewable energy policy design is the support the integration of cost-effective renewables into energy systems with a low impact on government finances. This trend is significant in the power sector where environmentally friendly energy technologies are becoming economically viable across the world at an accelerated pace [7]. An analysis of the policy variation in the GCC counties focusing on the adaption of renewable energy technologies was also performed [8]. It suggested that research collaboration with international and regional institutes, and business partnerships with large corporations were important for such development. That study highlighted the interest of Qatar to implement renewable energy within the country in order to improve its environmental footprint [8].
The source of the studies and policies mentioned above is the ecological footprint that the GCC countries have, originating from the elevated level of GHG emissions. According to the study published in 2009 [9], the GCC countries produce a significantly large quota of the global CO2 emissions, and the most of their emissions originate from the energy extraction and conversion sectors, primarily from oil and natural gas drilling and electricity production. Qatar, in particular, has the highest per capita CO2 emission of the region with 68.15 tons [9], a value that is higher than that of some top developed countries such as Australia, and approximately seven times greater than Japan’s per capita emissions (9.6 tons) [9].
In order to counteract the negative impact of the region on the environment, the wind’s capacity to generate energy in the Arabian Gulf was also studied [10]. The results indicated that the central region of the Arabian Gulf (Qatar, Bahrain, and Saudi Arabia) has an appropriate wind power source for economical installation of large-scale wind farms, based on the annual (average) wind power obtained, which were 277, 300, and 275 w/m2, respectively. The wind power density is especially attractive in the summer season [10].
From a more global point of view, the search for new locations to utilize wind energy is not limited to the Middle East. In fact, an assessment to utilize the wind potential of the Caspian Sea has recently been done [11]. The paper indicated that the northern part of the Caspian Sea has the best potential for wind energy, obtaining wind speeds as high as 9 m/s. In their conclusion, they indicated that despite the fact that the Caspian Sea is associated with hydrocarbon extractions, there is interest to design an adequate wind farm according to the electricity demand of the coastal communities [11]. This concept is similar to Qatar’s situation due to rich hydrocarbon resources. In our study, wind energy is proposed not only for communities but also for hydrocarbon extraction and processing facilities.
A recent study in Mexico introduced the possibility of cogeneration using the current thermal power plants and modeled wind farms [12]. The paper indicates that wind farms will reduce peak demands for the current power plants. More specifically, if these wind farms are installed in the Northeast region, they can deliver about 2.7 MW to the grid. This is just one of the many studies that Mexico has done in order to fulfill a 35% clean energy goal for 2024 [12].
Even a country like Iceland that has a high level of environmentally friendly energy production (geothermal) continues to study the possibility of implementing wind as an energy source. In their study [13], Búrfell, located in the south part of the country, has shown a high potential for wind energy, obtaining a power production share between 37.90% and 38.38% with an average of 38.15%. This value is above the European production mean, which is approximately 21% [13].
3. System Description and Analysis
The present study calculates the amount of energy that a 17 MW wind farm can produce in the designated location based on the actual wind measurements. The wind farm contains five 3.4 MW wind turbines that will be placed in a straight line, one beside the other, in order to prevent the wake effect. In order to optimize the wind usage, the wind turbines will be facing SE direction (see Section 3.3.2). This case study will be located on land in the North of Qatar, near the oil and gas fields refinery (see Figure 1). This location is selected for two reasons. Firstly, in order to analyze the environmental and cost impact that this proposed wind farm could have if it was integrated as an energy source in the power grid of oil & gas processing facilities. This integration is possible because of several technical advancements that the selected wind turbine presents. The Senvion turbine has a SCADA system that enables the possibility of monitoring each turbine with the option of power management. Moreover, the turbine combines a gearbox, converter, and generator with the control and monitoring system. This offers a direct access to the power management unit which measures voltage and frequency at the grid connection point. If these deviate from the desired value, active and reactive power is automatically regulated. Secondly, the environmental parameters (wind speed, temperature etc.) needed to calculate the wind potential are based on a location in the North of Doha (Lusail), measured by Supreme Committee for Delivery & Legacy in Qatar.
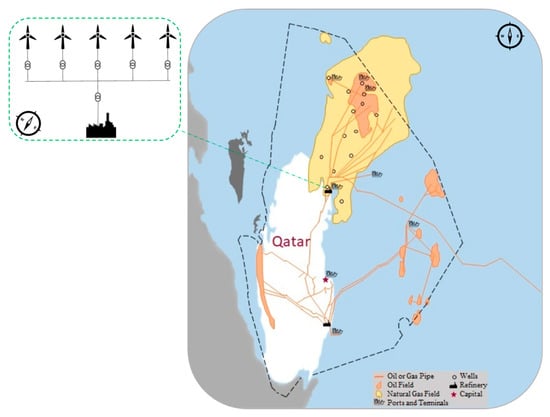
Figure 1.
Map of Qatar with oil and gas fields, refinery, and the proposed wind farm.
3.1. Wind Potential Diagnosis
To obtain the potential output from wind energy production in a specific area, the wind behavior and other environmental parameters should be studied. All the data used for this study were recorded in Lusail, Qatar, every five minutes at an altitude of 10 m from June 2016 to June 2018.
3.2. Wind Characteristics
To utilize the wind energy properly, two significant parameters should be considered; wind speed and wind direction.
3.2.1. Wind Speed
Wind speed is highly influenced by two elements; height and roughness of the terrain. In this case, the measurements must be extrapolated from its original measured height (10 m) to an adequate altitude of 130 m (selected wind turbine’s hub height) using the following expression [14]:
where:
- V is the wind speed at height H (130 m in this case).
- V0 is the wind speed at height H0 (10 m in this case).
- α is the friction coefficient or Hellmann Index.
The friction coefficient depends on the terrain characteristics, as shown in Table 1 [15]. For this case, the friction coefficient is selected as 1/7 due to absence of obstacles (natural or man-made) in the selected location.

Table 1.
Friction coefficient.
Implementing Equation (1), all the data are extrapolated to the desired height. Furthermore, the recurrence of the wind speeds is calculated, obtaining the results shown in Table 2 and Figure 2. From Table 1, initially a value of α within the “Slightly uneven terrain” option is chosen (the selected value was 1/7). Then, the value of α in Equation (1) is used to extrapolate every wind speed measurement from 10 m to 130 m. After this step, the number of hours of every wind speed obtained after the extrapolation process is counted and added (see Table 2). Finally, the “total” column from Table 2 is plotted and shown in Figure 2.
Table 2.
Wind speed distribution.
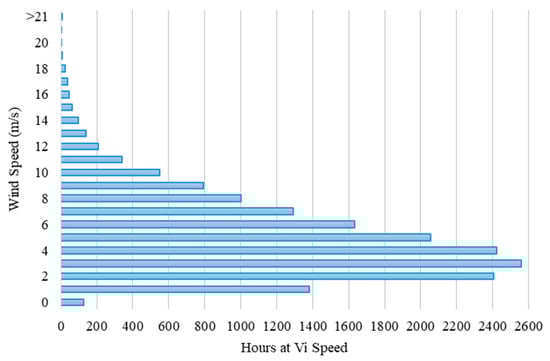
Figure 2.
Wind speed recurrence.
The information obtained in Figure 2 and Table 2 indicate that wind speeds between 2 and 6 m/s are the ones with the most frequent recurrence. For a more detailed analysis, the values presented in Table 3 are calculated, in which it can be observed that the overall mean and median are within the specified range. To corroborate the data indicated in Table 3, a statistical evaluation of the data needs to be performed.
Table 3.
Wind speed summary.
First, box and whiskers plots are implemented (see Figure 3). The box represents the middle 50% of the ranked data and is plotted between the lower and the upper quartile value (for example, the 25th to 75th percentile). A division inside the box can be observed, it represents the median, which is equivalent to the 50th percentile, indicating that the same number of measurements are reflected above and below this line. The vertical lines extending outward from the ends of the box are called whiskers; they represent the outer range of the data. The highest wind speed value is represented by the x [16].
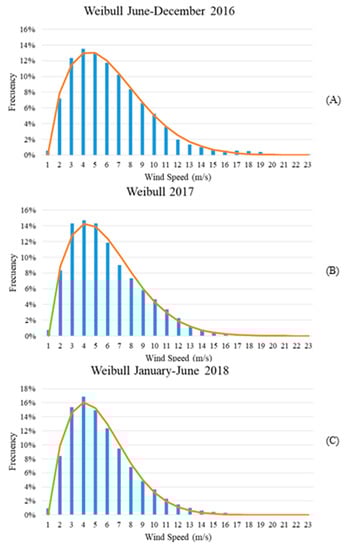
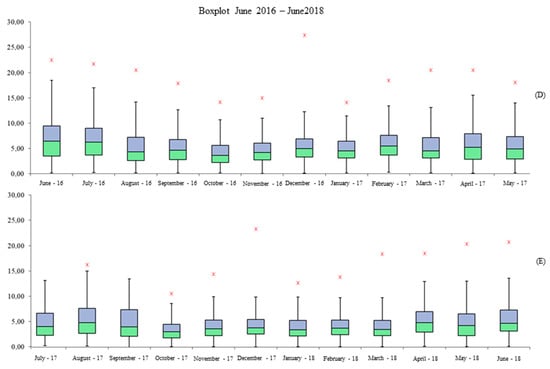
Figure 3.
Statistical evaluation of the wind speed. (A) Weibull distribution for June–December 2016; (B) Weibull distribution for 2017; (C) Weibull distribution for January–June 2018; (D) Boxplot for June 2016–May 2017; (E) Boxplot for July 2017–June 2018.
Additionally, the Weibull distribution is implemented. This method allows us to establish the wind regime’s characteristics. This is a two-parameter distribution, depending only on scale and shape parameters. For this purpose, there are several methods that could be studied, such as the Weibull probability density function, the wind variability method, the standard deviation method, the power density method, the Moroccan method, and so on [17]. All of these methods have one objective in common which is validating Weibull parameters. In this paper, these factors will be calculated as a function of the median and quartiles using Equations (2) and (3) [18].
where
- Vm is the median speed.
- V0.25 is the first quartile, also known as Q1.
- V0.75 is the third quartile, also known as Q3.
- c is the shape parameter.
- k is the scale parameter.
Using the information indicated above with the data recollected, the results shown in Table 4 and Figure 3 are obtained.
Table 4.
Weibull parameters.
The boxplot of the whole period studied (Figure 3) indicates that the values between the first and third quartiles fluctuates between 1.85 m/s and 9.47 m/s. This reflects that approximately 50% of the data recollected is distributed within this range. The median or second quartile fluctuates within 3.05 m/s and 6.46 m/s. This spectrum concurs with the data reflected in Table 2. Furthermore, Figure 3D indicates that the maximum wind speed (27.42 m/s) was measured in December 2016. In addition, in the Weibull graphs (Figure 3A–C), it can be observed that the wind speed values with higher probability of occurrence are between 3 and 6 m/s. This information corroborates that the mean of every year is located within this range (see Table 2). Moreover, the measured wind speeds (see Figure 2) reflect the behavior of this statistical tool. Finally, by overlapping the results obtained from these graphs and the boxplot (Figure 3D,E), the results verify that the values with higher probability of occurrence are within the first and third quartile.
3.2.2. Wind Direction
The wind direction is defined as the path that the wind follows in its movement. This course is named according to where that wind comes from. Thus, when mentioning an east wind, it is referring to a wind that blows from the east to the west. To accurately detect the direction of the wind and its variations, a simple measuring instrument, called a vane, is used and using these measurements, the wind rose can be plotted [19]. The wind rose is a tool used to determine the direction of the wind throughout a year. This is one of the best ways of knowing the direction that a wind turbine should face in order to effectively produce power from the natural resource (wind). By properly locating the wind turbine, the power production throughout the year will be higher compared to other directions. The wind rose consists of bars or extensions that originate from the center of a circle and extend to a specific point that illustrates the direction of the wind. The length of each extension indicates the percentage of time in which the wind flows towards that direction [20]. Hence, based on the data recollected, Figure 4 is obtained for three different periods.
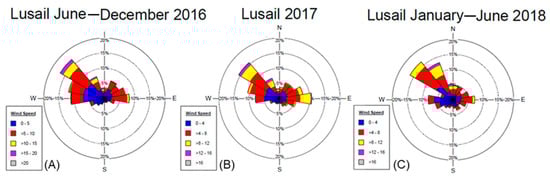
Figure 4.
Wind rose plots for the studied period (June 2016–June 2018). (A) Wind rose plot for June–December 2016; (B) Wind rose plot for 2017; (C) Wind rose plot for January–June 2018.
Figure 4 highlights that the wind direction has a wide range of movement, with January–June 2018 (Figure 4C) being the less disperse period and 2017 (Figure 4B) the most spread out year. However, Figure 4C concurs with the more recent measurements, showing that the wind is predominant in the NW direction. This means that most of the time the wind originates from the SE and moves towards the NW.
3.3. Environmental Parameters
The objective of this section is to use measured parameters such as temperature (T) and atmospheric pressure (P) to calculate air density (ρ).
3.3.1. Temperature
This parameter varies during the studied period, with 274.15 K as its lowest value and 322.10 K as its highest one. In addition, the overall mean value is 302.25 K. It is important to highlight that this parameter is measured in °C, but the analysis is made in K.
3.3.2. Atmospheric Pressure
Similar to the temperature, the original unit is changed from hPa to N/m2 to carry out the density (ρ) calculation. The atmospheric pressure does not have huge variations. With 99149.40 N/m2 and 102855.90 N/m2 as its lowest and highest values respectively. Finally, the overall mean of the atmospheric pressure is 100899.79 N/m2.
3.3.3. Air Density
Using the parameters indicated above, air density (ρ) can be calculated by implementing Equation (4) [14]:
where
- ρ is the air density
- T is the temperature
- P is the atmospheric pressure
- R is the specific gas constant of the air which has a value of 287 J/kg K.
The environmental values and calculated average air density values are given Table 5.
Table 5.
Environmental parameters.
3.4. Wind Power Density (WPD)
The calculation of the WPD is the final step in order to estimate the wind potential to produce power in watts per swept area (W/m2). By implementing Equation (5), with the all the wind speed data recollected and using the values of air density (ρ) indicated in Table 5, the values reflected in Table 6 are obtained [14].
where
Table 6.
Wind power density.
- ρ is the air density (kg/m3)
- V is the is the wind speed (m/s)
- n is the number measurements.
3.5. Energy Production Calculation
In order to estimate the total amount of energy that the selected wind turbine will produce, the power generated by the turbine at a certain wind speed must be calculated, and then multiplied by the number of hours of recurrence of that velocity. One way of estimating the power generation of a wind turbine is to match a wind speed with the power curve; however, this must be done taking into consideration that the air density in which the power curve was developed may not concur with the actual value of this parameter in the location where the turbine will be installed. In order to obtain a more realistic value, Equation (6) will be used to calculate the power based on the turbine’s power coefficient (Cp) [21].
where
- ρ is the air density (kg/m3)
- V is the is the wind speed (m/s)
- A is the turbine’s rotor area (m2)
- Cp is the turbine’s power coefficient
4. Results and Discussion
In order to calculate the amount of energy that could be produced, initially, an appropriate wind turbine must be selected that can exploit the wind in this area as much as possible. Furthermore, by using its power curve, the energy production can be determined.
Table 6 indicates that the WPD has the same behavior as the wind speed. Also, it is important to indicate that this is the wind’s potential to generate power (kinetic energy potential), and the final power output depends on the wind turbine and its specifications.
Based on the wind analysis, the selected turbine is the Senvion 3.44M140 wind turbine with a nominal capacity of 3.4 MW. This turbine has a low cut-in speed (3 m/s); this means that, most of the time, it can generate power. In addition, it is important to indicate that the hub height is 130 m and the rotor’s diameter is 140 m [22].
Table 7 and Figure 5 reflect how the behavior of the wind turbine will be at a determined speed, indicating that power generation is possible with speeds between 3 m/s (cut-in speed) and 22 m/s (cut-out speed). One element to highlight is that the power production increases with the wind speed up to 3.4 MW at 11 m/s. At this point, the power generation maintains constant until 22 m/s, where the production automatically stops due to safety reasons. On the other hand, the Cp presents the highest values between 3 m/s and 10 m/s, and at elevated speeds the value is low. This indicates that in order for the turbine to generate power with high-speed wind, it must sacrifice efficiency, and at low speed, the efficiency effect is inverse. The energy production from a wind turbine is calculated based on Section 3.4 and Section 3.5. Applying Equation (6) with the information indicated in Table 2 and Table 7 and considering the rotor swept area of the selected wind turbine (A = 15,393.80 m2), the results indicated in Table 8 and Figure 6 are obtained.
Table 7.
Wind turbine power curve.
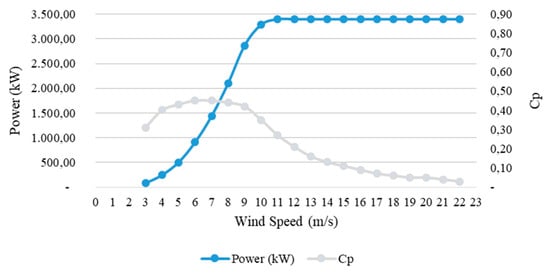
Figure 5.
Wind turbine power curve.
Table 8.
Energy production for a single wind turbine (rotor diameter: 140 m).
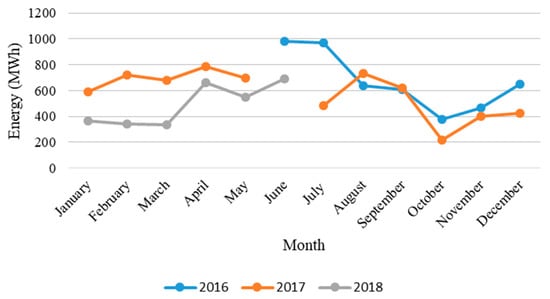
Figure 6.
Energy production for a single wind turbine (rotor diameter: 140 m).
The results for a single wind turbine shown above indicates that the highest production period is between the months of April and August, obtaining the highest value of energy production in June 2016 with 984 MWh, and the lowest power production in October, with October 2017 being the lowest value, with 219 MWh. This behavior concurs with the wind speed variation during the studied interval of time. Also, from Table 8, the overall yearly mean energy production for a single Senvion 3.44M140 wind turbine is calculated, obtaining a value of 6.995 MWh.
In order to analyze the energy production of a wind farm, a number of elements should be taken into consideration. One of the main factors is the wake effect, which is a spatial region with a lower wind speed and with a slightly larger diameter than the wind turbine under study [23]. As a wind turbine draws energy, it leaves a wake characterized by reduced wind speed and increased turbulence. If one wind turbine is working within the wake region of another, or at a point within the wind farm where it is affected by several of these wakes, then the turbine will produce less energy than those wind turbines that interact directly with the natural wind flow [23]. However, this study does not include the analysis of the wake effect within a wind farm. Hence, to prevent the influence of this phenomenon, the amount of energy that five wind turbines in a wind farm may produce will be calculated. However, it is noted that they will be placed in a straight line, one beside the other. Based on this, the energy production from the wind farm for the studied period in the case study is plotted in Figure 7.
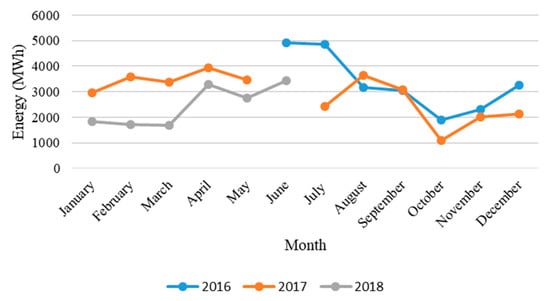
Figure 7.
Energy production from the proposed wind farm consisting of five wind turbines (rotor diameter: 140 m).
The highest production period for the five Senvion 3.44M140 wind turbines is between the months of April and August, obtaining the highest value of energy production in June 2016 with 4.920 MWh, and the worst month for power production is October, with October 2017 having the lowest value of 1.096 MWh. Also, from Table 9, the overall yearly mean of energy production for the case study is calculated, obtaining a value of 34.976 MWh.
Table 9.
Wind farm energy production (five wind turbines).
Once a wind farm is installed, further work can be done in order to compare the calculated values and the real power production and behavior of the turbines. This type of study has been done in other small wind farms, such as the analysis performed in a case study of Ørland in Norway [24].
Environmental and Cost Assessment Results
Electricity generation is one of the main causes of GHG emissions both in the world and in Qatar. Natural gas combustion as well as diesel generators are the fundamental electricity generation routes in Qatar. Table 10 shows the CO2 emissions from natural gas and diesel fuel due to combustion in power plants and generators, respectively. It is noted that these values are only during operation, hence other life cycle phases are not accounted for. The values represent only CO2 emissions, not all GHG emissions.
Table 10.
CO2 emissions associated with generation of 1 kWh of energy from natural gas, diesel, and wind energy.
Diesel generators are quite common in Qatar for remote areas and offshore platforms. Based on the previous calculations, the proposed wind turbine can produce about 34.976 MWh in a year on average (average of the studied period). For a hypothetical case, it is considered that this amount of energy is produced from wind turbines rather than combustion of natural gas and diesel fuel. It is assumed that 80% of this electricity (27.980 MWh) originates from natural gas combustion and 20% (6.995 MWh) is from diesel combustion. In this way, the associated CO2 emissions are calculated and given in Table 11 and Figure 8.
Table 11.
Annual carbon dioxide emissions from diesel and natural gas for 34.976 MWh electricity generation.
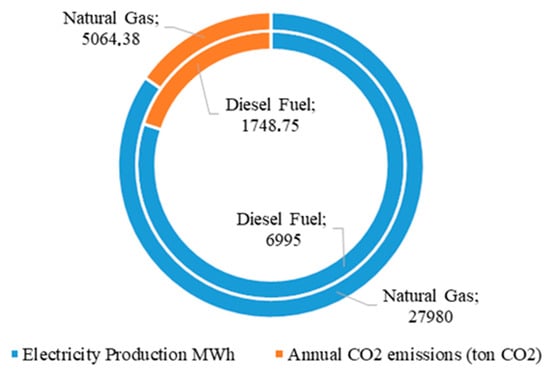
Figure 8.
Annual CO2 emissions for 34.976 MWh electricity generation (Diesel: inner ring, Natural Gas: outer ring).
When the proposed wind power plant (5 × 3.4 MW) is operational, there will be about 6.813 tons of annual CO2 savings because wind power plants do not emit any emissions during operation. Note that this value does not include other emissions such as NOX or SOX, which also have environmental consequences. Hence, wind power plants are very environmentally friendly compared to hydrocarbon fuels.
Similar to the environmental assessment, the cost savings achieved by wind power generation can also be quantified. The electricity generated through wind turbines will act as a replacement of natural gas and diesel. In this way, this will allow Qatar to export more natural gas to the international market. It is known from the literature that the average heating value of natural gas is about 13.1 kWh/kg. Considering that 27.980 MWh of electricity production (produced by wind energy) is equivalent to about 69.950 MWh of chemical energy in natural gas, assuming 40% energy conversion efficiency (from natural gas to electricity via combined cycle power plant), the required natural gas amount is calculated as 5.340 tons, which can be exported to overseas at the selling price. The average selling price of LNG is taken as 415.2 US$/ton (8 US$ per MMBTU). Therefore, the annual cost saving is calculated about 2.22 million US$. Similarly, by producing 6.995 MWh of electricity from wind energy rather than from diesel generators, the annual cost saving is about 1.1 million US$ in case the diesel price is 0.54 US$/L [26]. In total, there is a cost saving of about 3.32 million US$ per year through 17 MW wind power generation plant.
5. Conclusions
This study analyzes the potential of wind power in Qatar by calculating the wind power density using actual measurements. Additionally, assessment of the amount of energy produced by a single 3.4 MW wind turbine and a 5 × 3.4 MW wind farm is performed. Furthermore, an environmental impact reduction is estimated by calculating the tons of annual CO2 savings due to implementation of the proposed wind farm. Finally, a basic economic assessment is performed to obtain the cost savings per year by reducing the local consumption of natural gas.
Some of the main results of the study include:
- The overall wind speed mean is 5.06 m/s. Approximately 50% of the wind speed data fluctuates within 3.05 m/s and 6.46 m/s. This result indicates that the wind speed is good enough for use as a natural source to move wind turbines for energy production. Moreover, these measurements guarantee that the selected wind turbine used in the case study will be able to generate energy more than 50% of the time.
- The wind direction is disperse but mostly originates from the SE and moves towards the NW. This means that in order to utilize the wind in a more efficient way, the turbines should face SE. Modern turbines have mechanisms to move on their axis; however, in order to prevent energy consumption and reduce the impact of the wake effect within the wind farm, more recurrent wind direction must be considered.
- During the period studied, the WPD is about 187.5 W/m2. This value confirms the viability of wind energy at a small to medium scale.
- Based on the studied period, one Senvion 3.44M140 wind turbine with a nominal capacity of 3.4 MW is capable of generating 6995.26 MWh of electricity in a year.
- The proposed wind power plant (5 × 3.4 MW) is distributed in a straight line, one beside the other, in order to prevent the wake effect and can produce about 34.976 MWh on average per year (based on the studied period). The wake effect can lower the energy production of a wind farm depending on the turbines’ distribution. By distributing the turbines as indicated above, the turbulence and lower wind speed resulting from this phenomenon will be avoided. As a result, the 5 × 3.4 MW wind farm will be able to generate the amount of energy reflected, because it will properly utilize wind speeds distributed within the cut-in and cut-out velocities.
- By implementing the 5 × 3.4 MW wind farm, annual CO2 emissions reduction of approximately 6.813 tons can be achieved because wind power plants do not generate CO2 while producing energy. The decrease in emissions originates from replacing the amount of diesel and natural gas burned in order to generate energy.
- Based on the case study, 3.32 million US$ per year could be saved by replacing gas and diesel-generated energy with wind power generation. Specifically, by reducing the amount of diesel utilized to produce energy and implementing the case study, 1.1 million US$ can be saved. However, Qatar could use the LNG saved, and obtain revenue via exportation.
Author Contributions
Conceptualization, Y.B.; methodology, Y.B. and C.M.; software, C.M.; formal analysis, C.M.; resources, Y.B.; data curation, C.M.; writing—original draft preparation, C.M. and Y.B.; writing—review and editing, Y.B. and C.M.; visualization, C.M. and Y.B.; supervision, Y.B.
Funding
This research was funded by Hamad Bin Khalifa University, Qatar Foundation (210008390). The APC was funded by Qatar National Library (QNL).
Acknowledgments
The authors recognize the support provided by the Hamad Bin Khalifa University, Qatar Foundation. Also, the authors would like to thank the Supreme Committee for Delivery & Legacy, and Marco Frioni for providing the wind measurement data and all the assistance. The contents herein are solely the responsibility of the authors.
Conflicts of Interest
The authors declare no conflict of interest.
Nomenclature
| A | Turbine’s rotor area (m2) |
| C | Shape Parameter |
| Cp | Power Coefficient |
| CO2 | Carbon dioxide |
| H | Height (m) |
| H0 | Original height (m) |
| k | Scale Parameter |
| n | Number of measurements |
| NOx | Nitrogen oxide |
| P | Power (W) |
| P | Atmospheric Pressure (hPa, N/m2) |
| R | Specific gas constant (287 J/kg K) |
| SOx | Sulfur dioxide |
| T | Temperature (K, °C) |
| V | Wind Speed (m/s) |
| V0 | Wind Speed at height H0 (m/s) |
| V0.25 | First Quartile, also known as Q1 |
| V0.75 | Third Quartile, also known as Q3 |
| Vm | Median Speed (m/s) |
| Greek letters | |
| α | Friction coefficient |
| ρ | Air Density (kg/m3) |
| Acronyms | |
| GCC | Gulf Cooperation Council |
| GHG | Green House Gases |
| LNG | Liquefied Natural Gas |
| NW | North West |
| SE | South East |
| WPD | Wind Power Density |
References
- Marafia, A.-H.; Ashour, H.A. Economics of off-shore/on-shore wind energy systems in Qatar. Renew. Energy 2003, 28, 1953–1963. [Google Scholar] [CrossRef]
- General Secretariat for Development Planning. Qatar National Vision 2030. 2008. Available online: https://www.mdps.gov.qa/en/qnv1/Documents/QNV2030_English_v2.pdf (accessed on 7 March 2019).
- Al-Naser, W.E.; Al-Mohanadi, A.H. Wind and Solar Energy in Qatar. Energy 1990, 15, 931–934. [Google Scholar] [CrossRef]
- Moghbelli, H.; Toliyat, H.; Abu-Bub, H.A. Green Hybrid Power Plant using Photovoltaic and Wind Energy with Power Quality Improvement in Qatar. In Proceedings of the ASEE Annual Conference and Exposition, Vancouver, BC, Canada, 26–29 June 2011. [Google Scholar]
- Ferroukhi, R.; Ghazal-Aswad, N.; Androulaki, S.; Hawila, D.; Mezher, T. Renewable energy in the GCC: Status and challenges. Int. J. Energy Sect. Manag. 2013, 7, 84–112. [Google Scholar] [CrossRef]
- Munawwar, S.; Ghedira, H.A. Review of renewable energy and solar industry growth in the GCC region. Energy Procedia 2014, 57, 3191–3202. [Google Scholar] [CrossRef]
- Griffiths, S. Renewable energy policy trends and recommendations for GCC countries. Energy Transit. 2017, 1, 3. [Google Scholar] [CrossRef]
- Atalay, Y.; Biermann, F.; Kalfagianni, A. Adoption of renewable energy technologies in oil-rich countries: Explaining policy variation in the Gulf Cooperation Council states. Renew. Energy 2016, 85, 206–214. [Google Scholar] [CrossRef]
- Qader, M. Electricity Consumption and GHG Emissions in GCC Countries. Energies 2009, 2, 1201–1213. [Google Scholar] [CrossRef]
- Al-Salem, K.; Neelamani, S.; Al-Nassar, W. Wind Energy Map of Arabian Gulf. Nat. Resour. 2018, 9, 212–228. [Google Scholar] [CrossRef]
- Onea, F.; Rusu, E. An Assessment of Wind Energy Potential in the Caspian Sea. Energies 2019, 12, 2525. [Google Scholar] [CrossRef]
- Hernandez-Escobedo, Q.; Garrido, J.; Rueda-Martinez, F.; Alcalá, G.; Perea-Moreno, A. Wind Power Cogeneration to Reduce Peak Electricity Demand in Mexican States Along the Gulf of Mexico. Energies 2019, 12, 2330. [Google Scholar] [CrossRef]
- Ragnarsson, B.; Oddsson, G.; Unnthorsson, R.; Hrafnkelsson, B. Levelized Cost of Energy Analysis of aWind Power Generation System at Búrfell in Iceland. Energies 2015, 8, 9464–9485. [Google Scholar] [CrossRef]
- Hernández, A.; Ortega, O. Análisis Estadístico Del Viento Como Recurso Energético; Instituto Politécnico Nacional: Mexico City, Mexico, 2014; ESIA Ticomán “Ciencias de la Tierra”. D.F. México. [Google Scholar]
- Fernández, P. Energía Eólica; Universidad de Cantabria, Departamento de Energía Eléctrica y Energética: Santander, Spain, 2002. [Google Scholar]
- Banacos, P. Box and Whisker Plot for Local Climate Datasets: Interpretation and creation using Excel 2007/2010, Eastern Region echnical Attachment; January 2011; No. 2011-01. Burlington, VT, USA.
- El Khchine, Y.; Sriti, M.; Eddine, N.; Elyamani, E. Evaluation of wind energy potential and trends in Morocco. Heliyon 2019, 5, e01830. [Google Scholar] [CrossRef] [PubMed]
- Justus, C.; Hargraves, W.; Mikhail, A.; Graber, D. Methods for Estimating Wind Speed Frequency Distributions. J. Appl. Meteorol. 1977, 17, 350–353. [Google Scholar] [CrossRef]
- Méndez, C.; González, F. Evaluación del Impacto de la Integración del Parque Eólico los Taques al Sistema Eléctrico de la Península de Paraguaná. Bachelor’s Thesis, Universidad Nacional Experimental Politécnica de la Fuerza Armada (UNEFA), Maracay, Venezuela, 2009. [Google Scholar]
- Ahrens, C. Essentials of Meteorology: An invitation to the Atmosphere, 2nd ed.; Wadsworth Publishing Company: Belmont, CA, USA, 1998. [Google Scholar]
- Sedaghat, A.; Gaith, M.; Khanafer, K.; Bani-Hani, E. Rated Wind Speed Reality of Muth for Optimization in Design of Wind Turbines. In Proceedings of the Eleventh International Conference on Ecological Vehicles and Renewable Energies (EVER), Monte Carlo, Monaco, 6–8 April 2016. [Google Scholar]
- Wind Turbine Model. Available online: https://en.wind-turbine-models.com/turbines/1283-senvion-3.4m140#powercurve (accessed on 7 March 2019).
- Burton, T.; Sharpe, D.; Jenkins, N.; Bossanyi, E. Wind Energy Handbook; John Wiley and Sons: West Sussex, UK, 2003. [Google Scholar]
- Marjan, A.; Shafiee, M. Evaluation of Wind Resources and the Effect of Market Price Components on Wind-Farm Income: A Case Study of Ørland in Norway. Energies 2018, 11, 2955. [Google Scholar] [CrossRef]
- How much carbon dioxide is produced when different fuels are burned?—FAQ—U.S. Energy Information Administration (EIA). US Energy Inf Adm 2018. Available online: https://www.eia.gov/tools/faqs/faq.php?id=73&t=11 (accessed on 26 December 2018).
- Fuel Price. WOQOD Qatar 2019. Available online: http://www.woqod.com/EN/Gas/Pages/Fuel-Price.aspx (accessed on 18 April 2019).


© 2019 by the authors. Licensee MDPI, Basel, Switzerland. This article is an open access article distributed under the terms and conditions of the Creative Commons Attribution (CC BY) license (http://creativecommons.org/licenses/by/4.0/).