Article

A Fast Online State of Health Estimation Method for Lithium-Ion Batteries Based on Incremental Capacity Analysis

1
School of Control Science and Engineering, Shandong University, Shandong 250061, China
2
State Key Laboratory of Automotive Simulation and Control, Jilin University, Changchun 130025, China
*
Author to whom correspondence should be addressed.
Energies 2019, 12(17), 3333; https://doi.org/10.3390/en12173333
Submission received: 15 July 2019 / Revised: 19 August 2019 / Accepted: 28 August 2019 / Published: 29 August 2019
(This article belongs to the Section E: Electric Vehicles)

Abstract

:
Efficient and accurate state of health (SoH) estimation is an important challenge for safe and efficient management of batteries. This paper proposes a fast and efficient online estimation method for lithium-ion batteries based on incremental capacity analysis (ICA), which can estimate SoH through the relationship between SoH and capacity differentiation over voltage (dQ/dV) at different states of charge (SoC). This method estimates SoH using arbitrary dQ/dV over a large range of charging processes, rather than just one or a limited number of incremental capacity peaks, and reduces the SoH estimation time greatly. Specifically, this method establishes a black box model based on fitting curves first, which has a smaller amount of calculation. Then, this paper analyzes the influence of different SoC ranges to obtain reasonable fitting curves. Additionally, the selection of a reasonable dV is taken into account to balance the efficiency and accuracy of the SoH estimation. Finally, experimental results validate the feasibility and accuracy of the method. The SoH estimation error is within 5% and the mean absolute error is 1.08%. The estimation time of this method is less than six minutes. Compared to traditional methods, this method is easier to obtain effective calculation samples and saves computation time.

1. Introduction

Developing electric vehicles (EVs) is an important measure to solve energy and environmental problems [1,2,3]. As the power source for electric vehicles, lithium-ion batteries directly affect the performance of EVs [4]. Accurate estimations of battery status, such as the state of charge (SoC), state of power (SoP), and state of health (SoH), are critical to the safe and efficient operation of EVs [5]. Among them, SoH is an important indicator to characterize battery degradation trends and availability. The fast and accurate estimation of SoH is an important challenge for efficient and safe management of batteries [6].
At present, there are three types of SoH estimation methods: the model-based method, the data-driven method, and the incremental capacity analysis (ICA) method. In the model-based method, SoH is usually calculated through the estimated internal resistance of the battery using an equivalent circuit model [7]. To achieve high estimation accuracy, a highly accurate model of the battery is needed. Moreover, the inconsistency of the battery’s environment and performance leads to its poor universality [8]. In the data-driven method, computational burden is usually caused [9,10], which reduces the estimated efficiency of the SoH and causes a higher request for CPU performance. ICA is another popular SoH estimation method, which shows a strong correlation with battery aging [11]. The concept of ICA originates from the study of the lithium intercalation process and the corresponding staging phenomenon [12,13,14]. When lithium-ion battery is charged at 0.04 C, its incremental capacity (IC) curve usually has 3–5 peaks, which can be used to estimate SoH [15]. Here, 1 C means that the current is numerically equal to the nominal capacity.
For traditional ICA methods, IC peaks are the primary premise to estimate the aging state of battery. However, there are only a limited number of peaks that can be used to estimate SoH [16,17,18,19], that is, the sample range available for SoH estimation is too narrow, and there is no guarantee that the voltage corresponding to the IC peak will be passed in each charging process. Moreover, since IC peaks are the extreme values of the incremental capacity (dQ) during the entire battery charging process, the time to calculate dQ is also the longest, accordingly. For example, if a voltage peak is 3.35 V, experimental results show that when dV = 0.1 V, it takes more than half an hour to calculate the dQ at 3.35 V. Additionally, if the charging time is taken into account, the estimated time of SoH can exceed one hour.
There are two reasons for difficulties in the estimated sample acquisition and the long estimation time of traditional ICA methods, which are the limited number of IC peaks and the excessive capacity calculation time at IC peaks. If an arbitrary capacity differentiation over voltage (dQ/dV) over a large range of charging processes can be used to estimate SoH instead of a few IC peaks, the efficiency and real-time performance of SoH estimation will be improved significantly. Therefore, a SoH estimation method using dQ/dV at different SoCs is proposed. Different from traditional ICA methods, the selection of dQ/dV used to estimate SoH in the proposed method is determined by SoC instead of IC peaks. In this method, the relationship between dQ/dV and SoH under different SoCs is first drawn through experiments. After that, the SoC of the sampling point is determined by calculation. The correspondence between dQ/dV and SoH under this SoC is found by the previously obtained fitting curves. Finally, the corresponding SoH can be estimated by calculating the dQ/dV at the sampling point. The estimated error is limited to 5% when the SoC is within the range of 0.3–0.8, and any dQ/dV in this range can be used to estimate the SoH, which overcomes the disadvantage of traditional ICA methods.

2. Experiment Setup

The experiments are performed on a Lishen LR1865EH lithium-ion battery with related battery parameters listed in Table 1. And the battery is produced by Tianjin Lishen Battery Co., Ltd., China. As shown in Figure 1, the test bench is NBT5V10AC16-T battery cycler produced by Ningbo Bayte Measurement and Control Technology Co., Ltd., and it consists of a lithium-ion battery, a programmable thermal chamber, and a host computer for monitoring and processing experimental data. The battery cycler has 16 dependent measurement channels with the voltage limits of 0–5 V and current limits of 0.3–10 A. The errors of the current and voltage sensors are both within 0.1%.
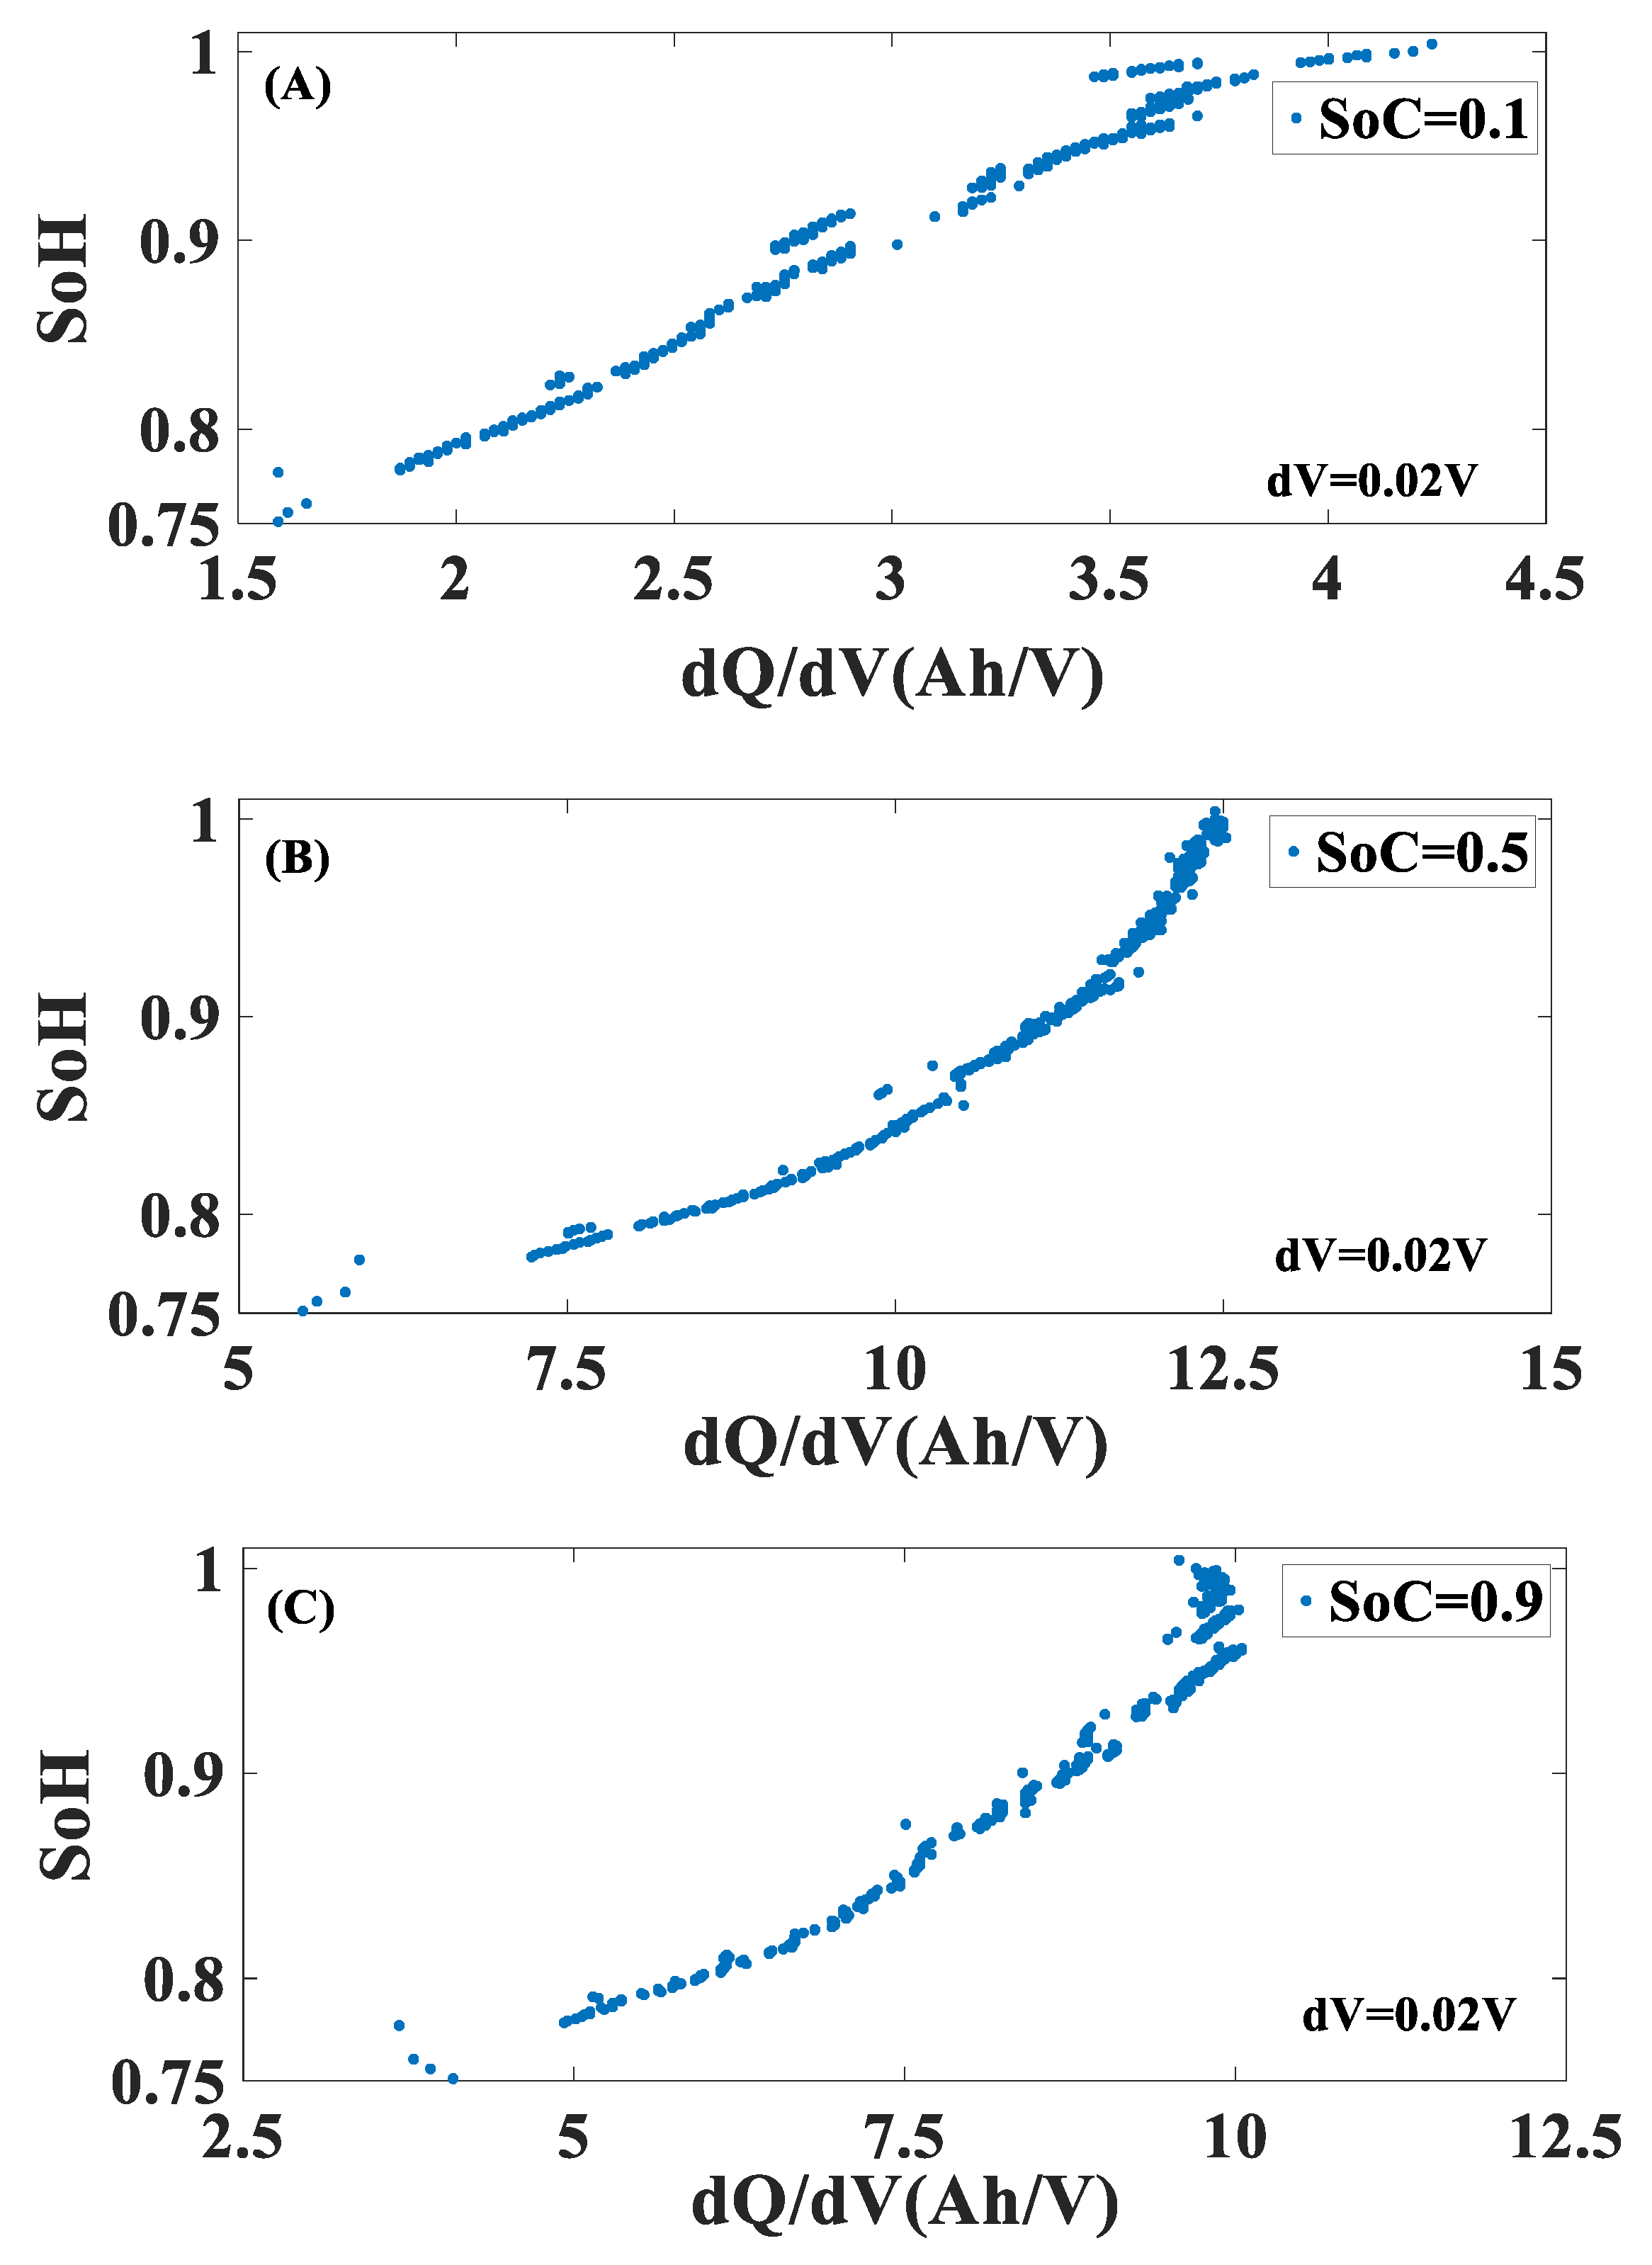
In actual operation, the battery is retired when the capacity declines to 80%. The relationship between SoH defined by the capacity and dQ/dV at different SoCs is shown in Figure 2. It can be seen that dQ/dV has a satisfactory monotonous relationship with SoH when the SoH is greater than 0.75, which meets the SoH range of actual operation on EVs completely. Therefore, the data of 0–400 cycles is used in the following experiments, and the SoH of 400 cycle is about 0.78.

3. SoH Estimation Method

3.1. Relationship between the dQ/dV and SoH Experiment

A monotonic relationship model between arbitrary dQ/dV and SoH is established by constraining SoC in this method. dQ/dV is defined as:
d Q d V = Q ( v 0 v x + Δ V ) Q ( v 0 v x ) Δ V , ( v x < Δ V )
where Q(v) represents the capacity Q at voltage v. ΔV is the voltage interval for calculating dQ and it is a fixed value. v0 represents the voltage at sampling point. vx is a small offset to ensure the overlap of adjacent sampling points, which improves the credibility of each sampling point.
The SoH is defined by capacity as follows:
SoH = Q 2 / Q 0
where Q0 represents the total capacity of the new battery and Q2 represents the total capacity of the current battery.
The definition of SoC is as follows:
SoC = Q 1 / Q 2
where Q1 represents the capacity charging to the sampling point.
Based on the above definition, the experiment is carried out as follows:
Step 1: For one entire charging process, current values are count up as the total capacity Q2, Equation (2) is used to calculate SoH of the charging process. The SoC point is sampled every 0.1 within the interval of 0.1 to 1.
Step 2: For the charging process selected in step 1, the capacity of SoC0 is calculated in the following equation:
Q 1 = S o C 0 Q 2
The point where the capacity reaches Q1 is recorded as i. The voltage value is recorded as Vi. After that, the capacity between the interval of [VidV/2, Vi + dV/2] can be accumulated as dQ/dV.
Step 3: Cycle steps 1 and 2 until 400 charging cycles are all processed. After that, the relationship between dQ/dV at SoC0 and SoH can be obtained.
Step 4: Next, the SoC sampling point is selected in the interval of 0–1 and steps 1, 2, and 3 are executed.
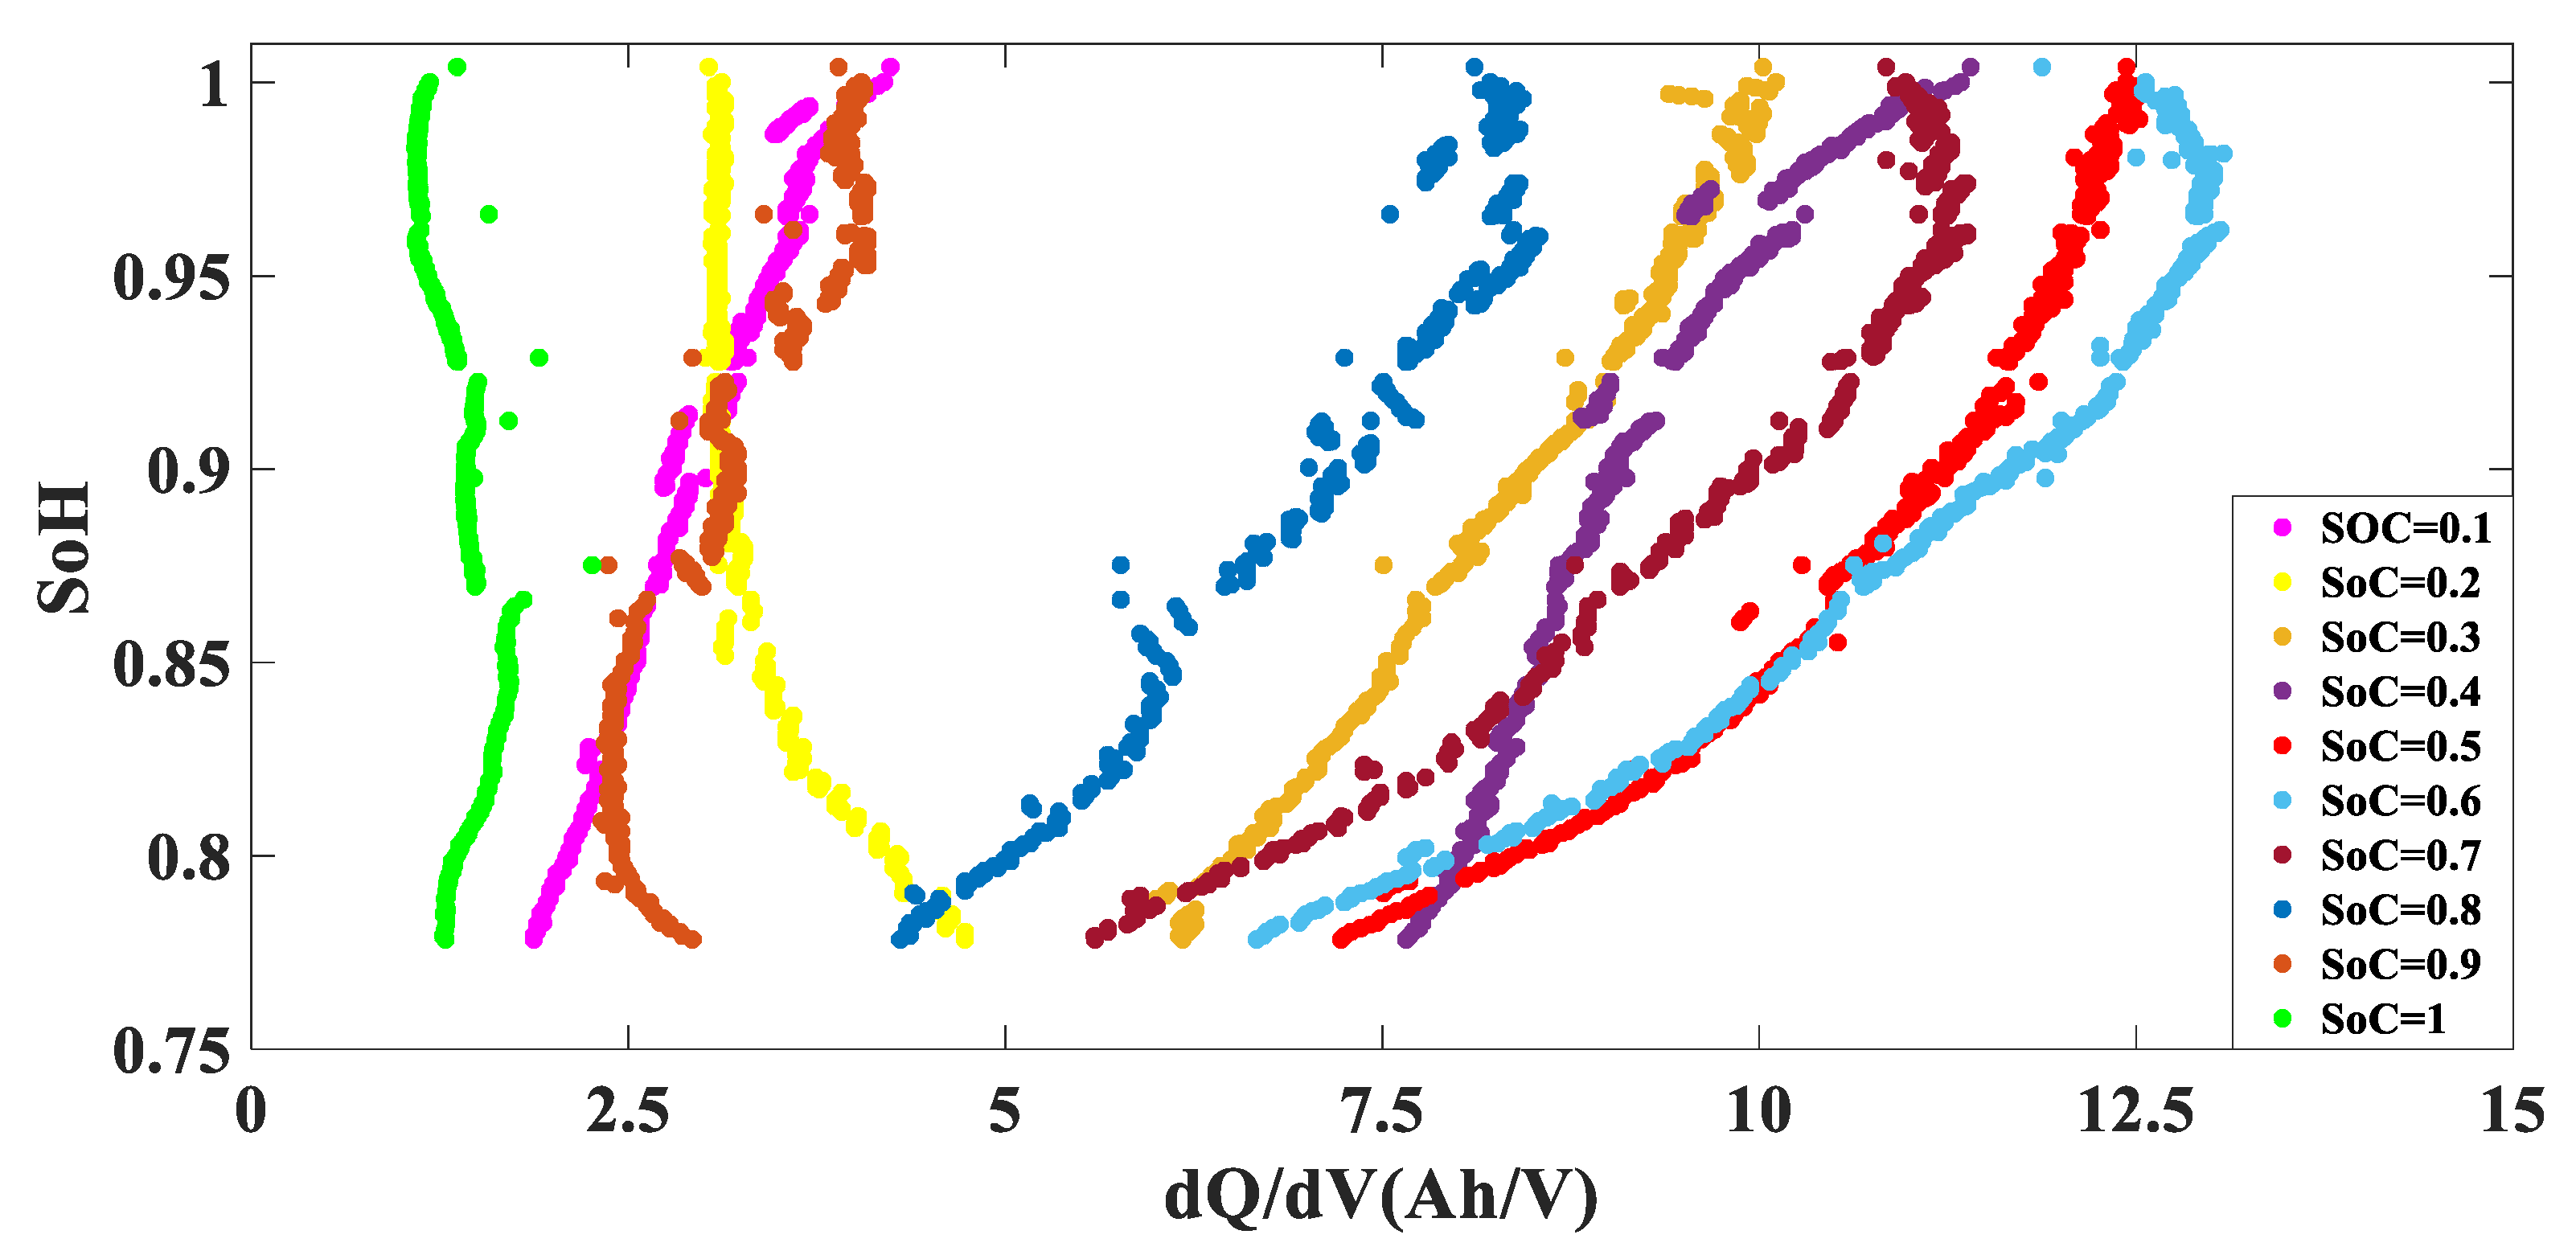
After the above four steps, the relationship between dQ/dV at 10 different SoCs and SoH can be obtained. As can be seen in Figure 3, green points representing SoC = 1 tends to a line parallel to the SoH axis, that is, the fitted curve of SoC = 1 can hardly be applied to the estimation of the SoH, while in the ten kinds of scatter plots, other scatter plots have satisfactory monotonicity, which can prove that the method is feasible over a large charging range.
Moreover, dQ and dV are usually represented by ΔQ and ΔV at the same time interval [11] or the same percent depth of discharge (% DOD) interval [20] in traditional ICA methods. Due to the differential property, dQ/dV is very sensitive to noise. Traditional ICA methods are sensitive to noise and a small measurement error may cause an obvious SoH estimation error. Therefore, traditional ICA methods generally require filtering, while, in this method, the interval of sampling points is determined by SoC instead of the time interval or % DOD interval. Most SoC points used in this paper are located in the voltage platform region where dV changes inconspicuously, relatively, and the influence of the voltage measurement error is also relatively reduced. Corresponding to the selection of sampling points, the new dQ/dV definition is also used in Equation (1). Only dQ is a quantity that varies with SoC. Therefore, the influence of dV measurement errors can be ignored. As can be seen in Figure 3, in the absence of any filtering denoising measure, there are no significant sharp points, that is, the method is relatively insensitive to noise and has satisfactory robustness.
It should be pointed out that in the process of estimating the SoH by the fitting curves in the later stage, in order to obtain the most accurate estimation effect with as few fitting curves as possible, five fitting curves are appropriately increased and some unnecessary curves are deleted. The estimated effect of this method is satisfactory in the SoC interval of 0.3–0.8. Details can be found in Section 4.1.

3.2. SoH Estimation Based on a Black Box Model

Through the above experiments and analysis, multiple fitting curves between dQ/dV at different SoCs and SoH can be obtained. Based on the fitting curves, the black box model of the SoH estimation method is established. In this model, the input is dQ/dV and the output is the estimated SoH, as shown in Figure 4. The SoH estimation method is introduced in detail below.
Eleven fitting curves of dQ/dV at different SoC (SoC1, SoC2, …, SoC11) and SoH are selected in this method, as shown in Table 2. The estimated SoH is SoH2 and the actual SoH is SoH0. Assuming that the SoC at the sampling point is SoCtemp, as can be seen in Table 2. SoCmin and SoCmax are defined as follows:
S o C m i n = max S o C i , S o C i < = S o C t e m p , i [ 1 , 11 ]
S o C max = min S o C i , S o C i > S o C t e m p , i [ 1 , 11 ]
The corresponding functions y1 = f1(x) and y2 = f2(x) of SoCmax and SoCmin can be obtained. Here, x is the value of dQ/dV, and f(x) is the calculated SoH value.
In practical application, SoH estimation follows the equation below:
S o H 2 = { f 2 ( x ) + ( f 1 ( x ) f 2 ( x ) ) ( S o C m a x S o C t e m p ) / ( S o C m a x S o C m i n ) , f 1 ( x ) > f 2 ( x ) f 1 ( x ) + ( f 2 ( x ) f 1 ( x ) ) ( S o C t e m p S o C m i n ) / ( S o C m a x S o C m i n ) , f 2 ( x ) > f 1 ( x )
As mentioned above, the SoH is about 0.78 at the 400 th cycle. The SoH value is not allowed to exceed 1. Therefore, the following rules can be set for SoH2. After the above treatment, the estimated SoH can be obtained.
S o H 2 = { 0.78 , S o H 2 < 0.78 S o H 2 , 0.78 S o H 2 1 1 , S o H 2 > 1

4. Influence Analysis of Different SoC and dV on SoH

4.1. Influence Analysis of Different SoC Ranges

To select sufficient and appropriate SoC, the figure of SoC, dQ/dV, and SoH is constructed. As shown in Figure 5, when SoC is in the interval of 0.45–0.75, the overall change rate of dQ/dV is not large. Therefore, fewer SoC points are needed in the interval 0.45–0.75. On the contrary, because the three-dimensional surface diagram in the two intervals of 0–0.45 and 0.75–1 are steep, so more SoC points are needed. Moreover, in Figure 6, dV = 0.005 V is selected to amplify the influence of noise, so that the SoC range applicable to the method can be observed more intuitively. In Figure 6, when SoC is 0.1, 0.2, 0.9, and 1, respectively, dQ/dV and SoH are difficult to form a satisfactory linear relationship. Therefore, in the final SoH estimation method, the final selected SoC interval is 0.3–0.8. Within this range, each SoC can be used to estimate the SoH.
Based on the above analysis, 11 fitting curves are selected. The third-order fitting R2 of the fitting curves are shown in Table 2. It can be found that the R2 of the selected fitting curves are all above 0.95, which indicates that the fitting effect is satisfactory.

4.2. Reasonable Selection of dV

To guarantee the estimated efficiency and accuracy of this method, an appropriate dV needs to be selected. A reasonable choice of dV is 0.02 V.
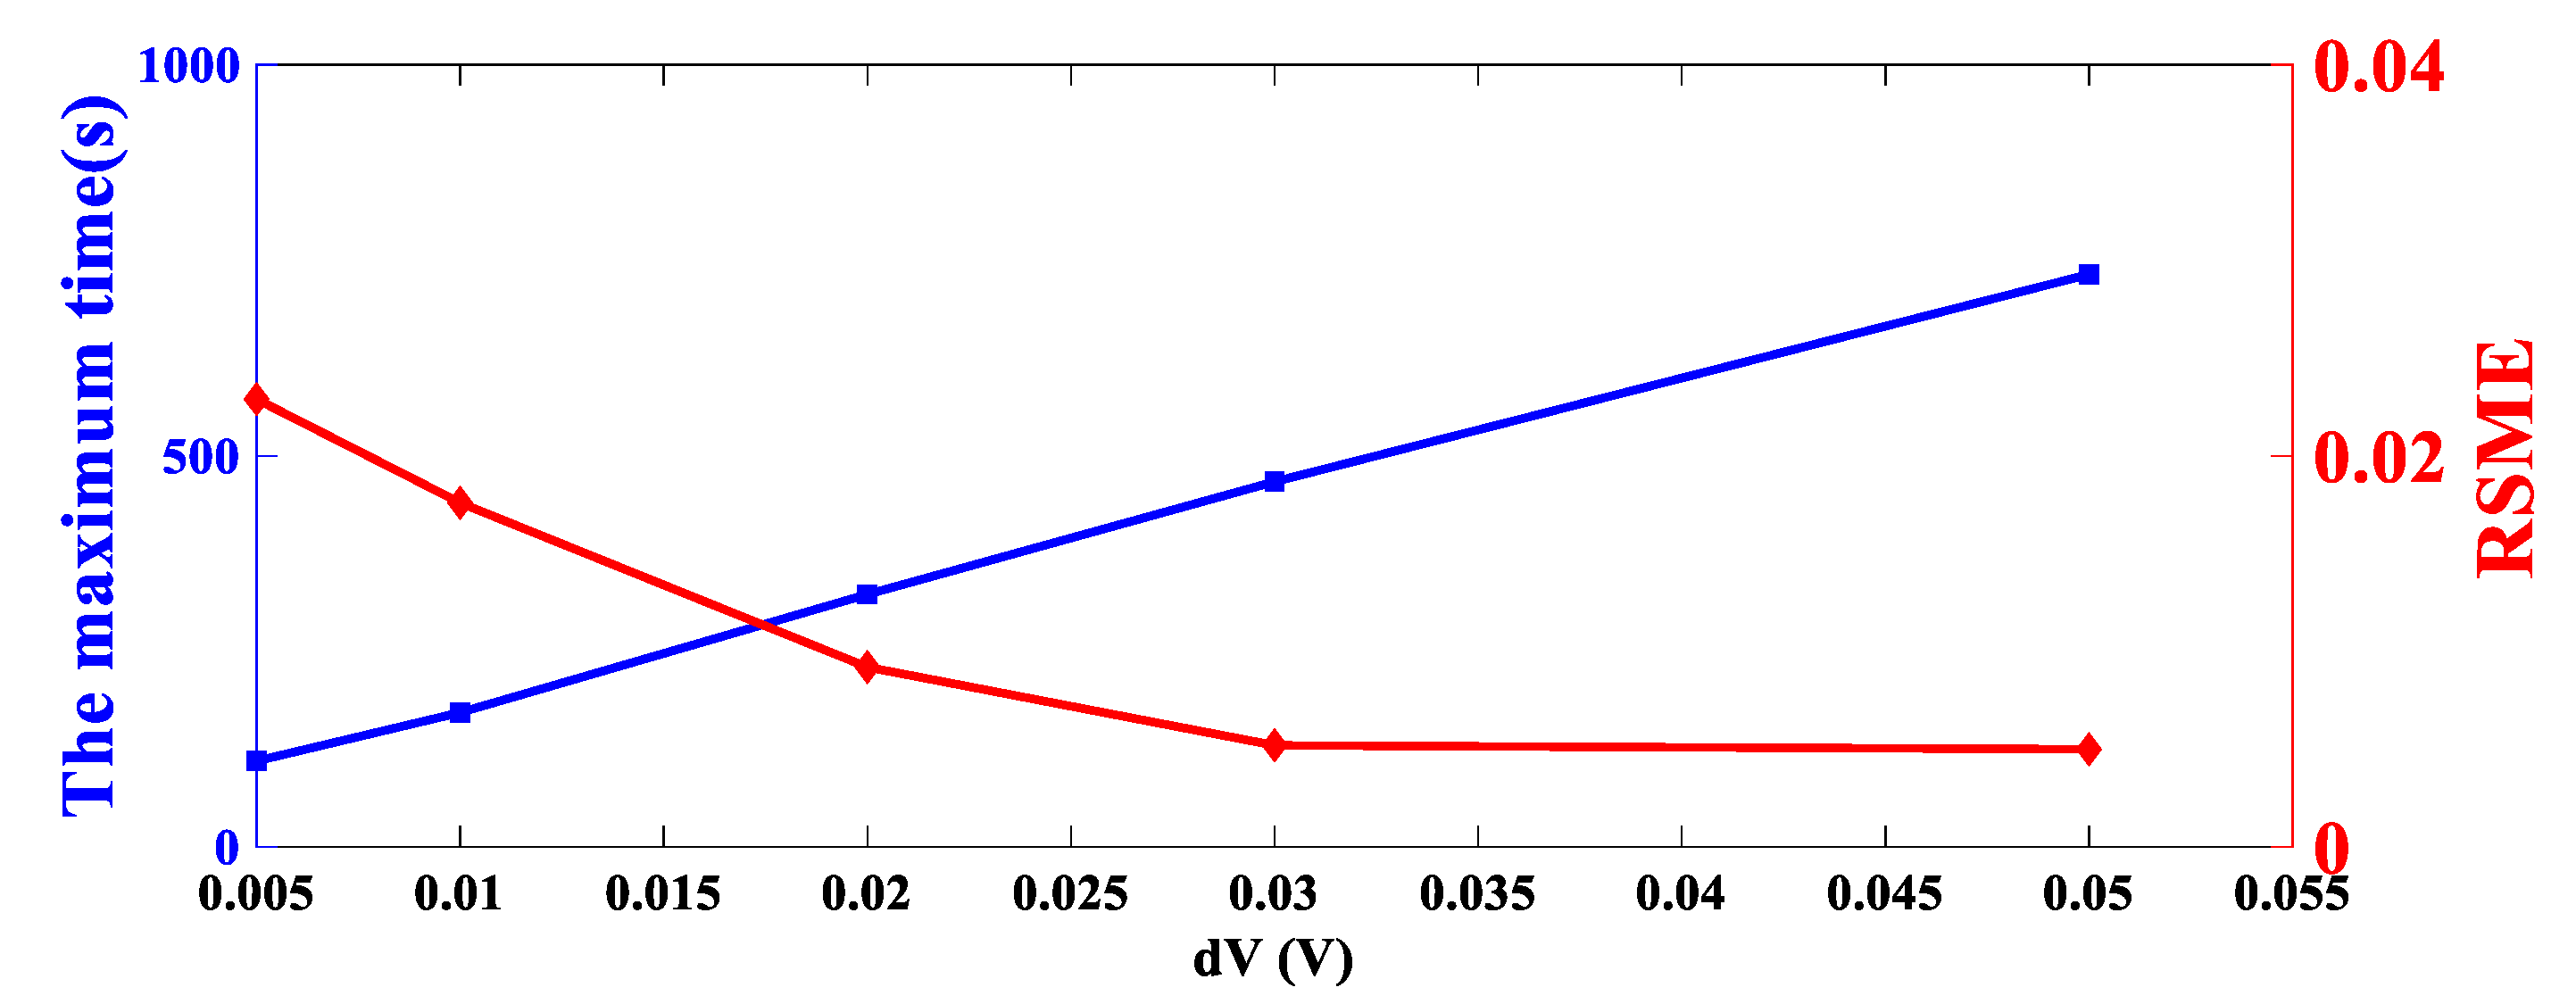
The larger the dV, the better the fitting effect and the more accurate the SoH estimation results. As can be seen from Figure 6, due to the relative amplification of noise, there are many obvious interference points when dV = 0.005 V. With the increase of dV, the noise is reduced relatively and dQ/dV also gets closer to the total capacity Q2 of the current battery. In an extreme case, that is, the value of dV reaches the charging cut-off voltage, dQ/dV is numerically equal to Q2. According to Equation (2), the estimated SoH at this time is the actual SoH. Therefore, as mentioned above, the SoH estimation results become more accurate with increasing dV. However, with the increase of dV, the time required to calculate dQ also increases correspondingly, that is, the estimated efficiency is reduced. Additionally, nonlinear characteristics of the battery state of charge–open circuit voltage (SoC-OCV) curve determines the time taken to calculate dQ during the entire charging process is different. Overall, it is the maximum time to calculate dQ that limits the estimated efficiency. In order to improve the estimation efficiency on the basis of ensuring the accuracy of this method, the root mean square error (RMSE) of the fitting curves with SoC = 0.4 and the maximum time to calculate dQ is obtained by experiment, respectively, when dV = 0.005 V, 0.01 V, 0.02 V, 0.03 V and 0.05 V, as shown in Figure 7.
It can be seen in Figure 7 that the RMSE comes close to 0 gradually with increasing dV. When dV increases to 0.2 V, the declining trend of RSME is obviously slowed down, and there is already no significant difference in the RMSE at dV = 0.03 V and 0.05 V. As for the maximum time, it can be seen from Figure 7 that the maximum time growth trend is linear with increasing dV. Generally, as can be seen in Figure 6, when dV is 0.01 V or less, the noise is relatively amplified and the linearity of dQ and SoH is not satisfactory enough. However, when dV is 0.03 V or more, the maximum required time to calculate dQ is too long. Consequently, dV = 0.02 V is a reasonable option.

5. Results and Discussion

5.1. SoH Estimation Results

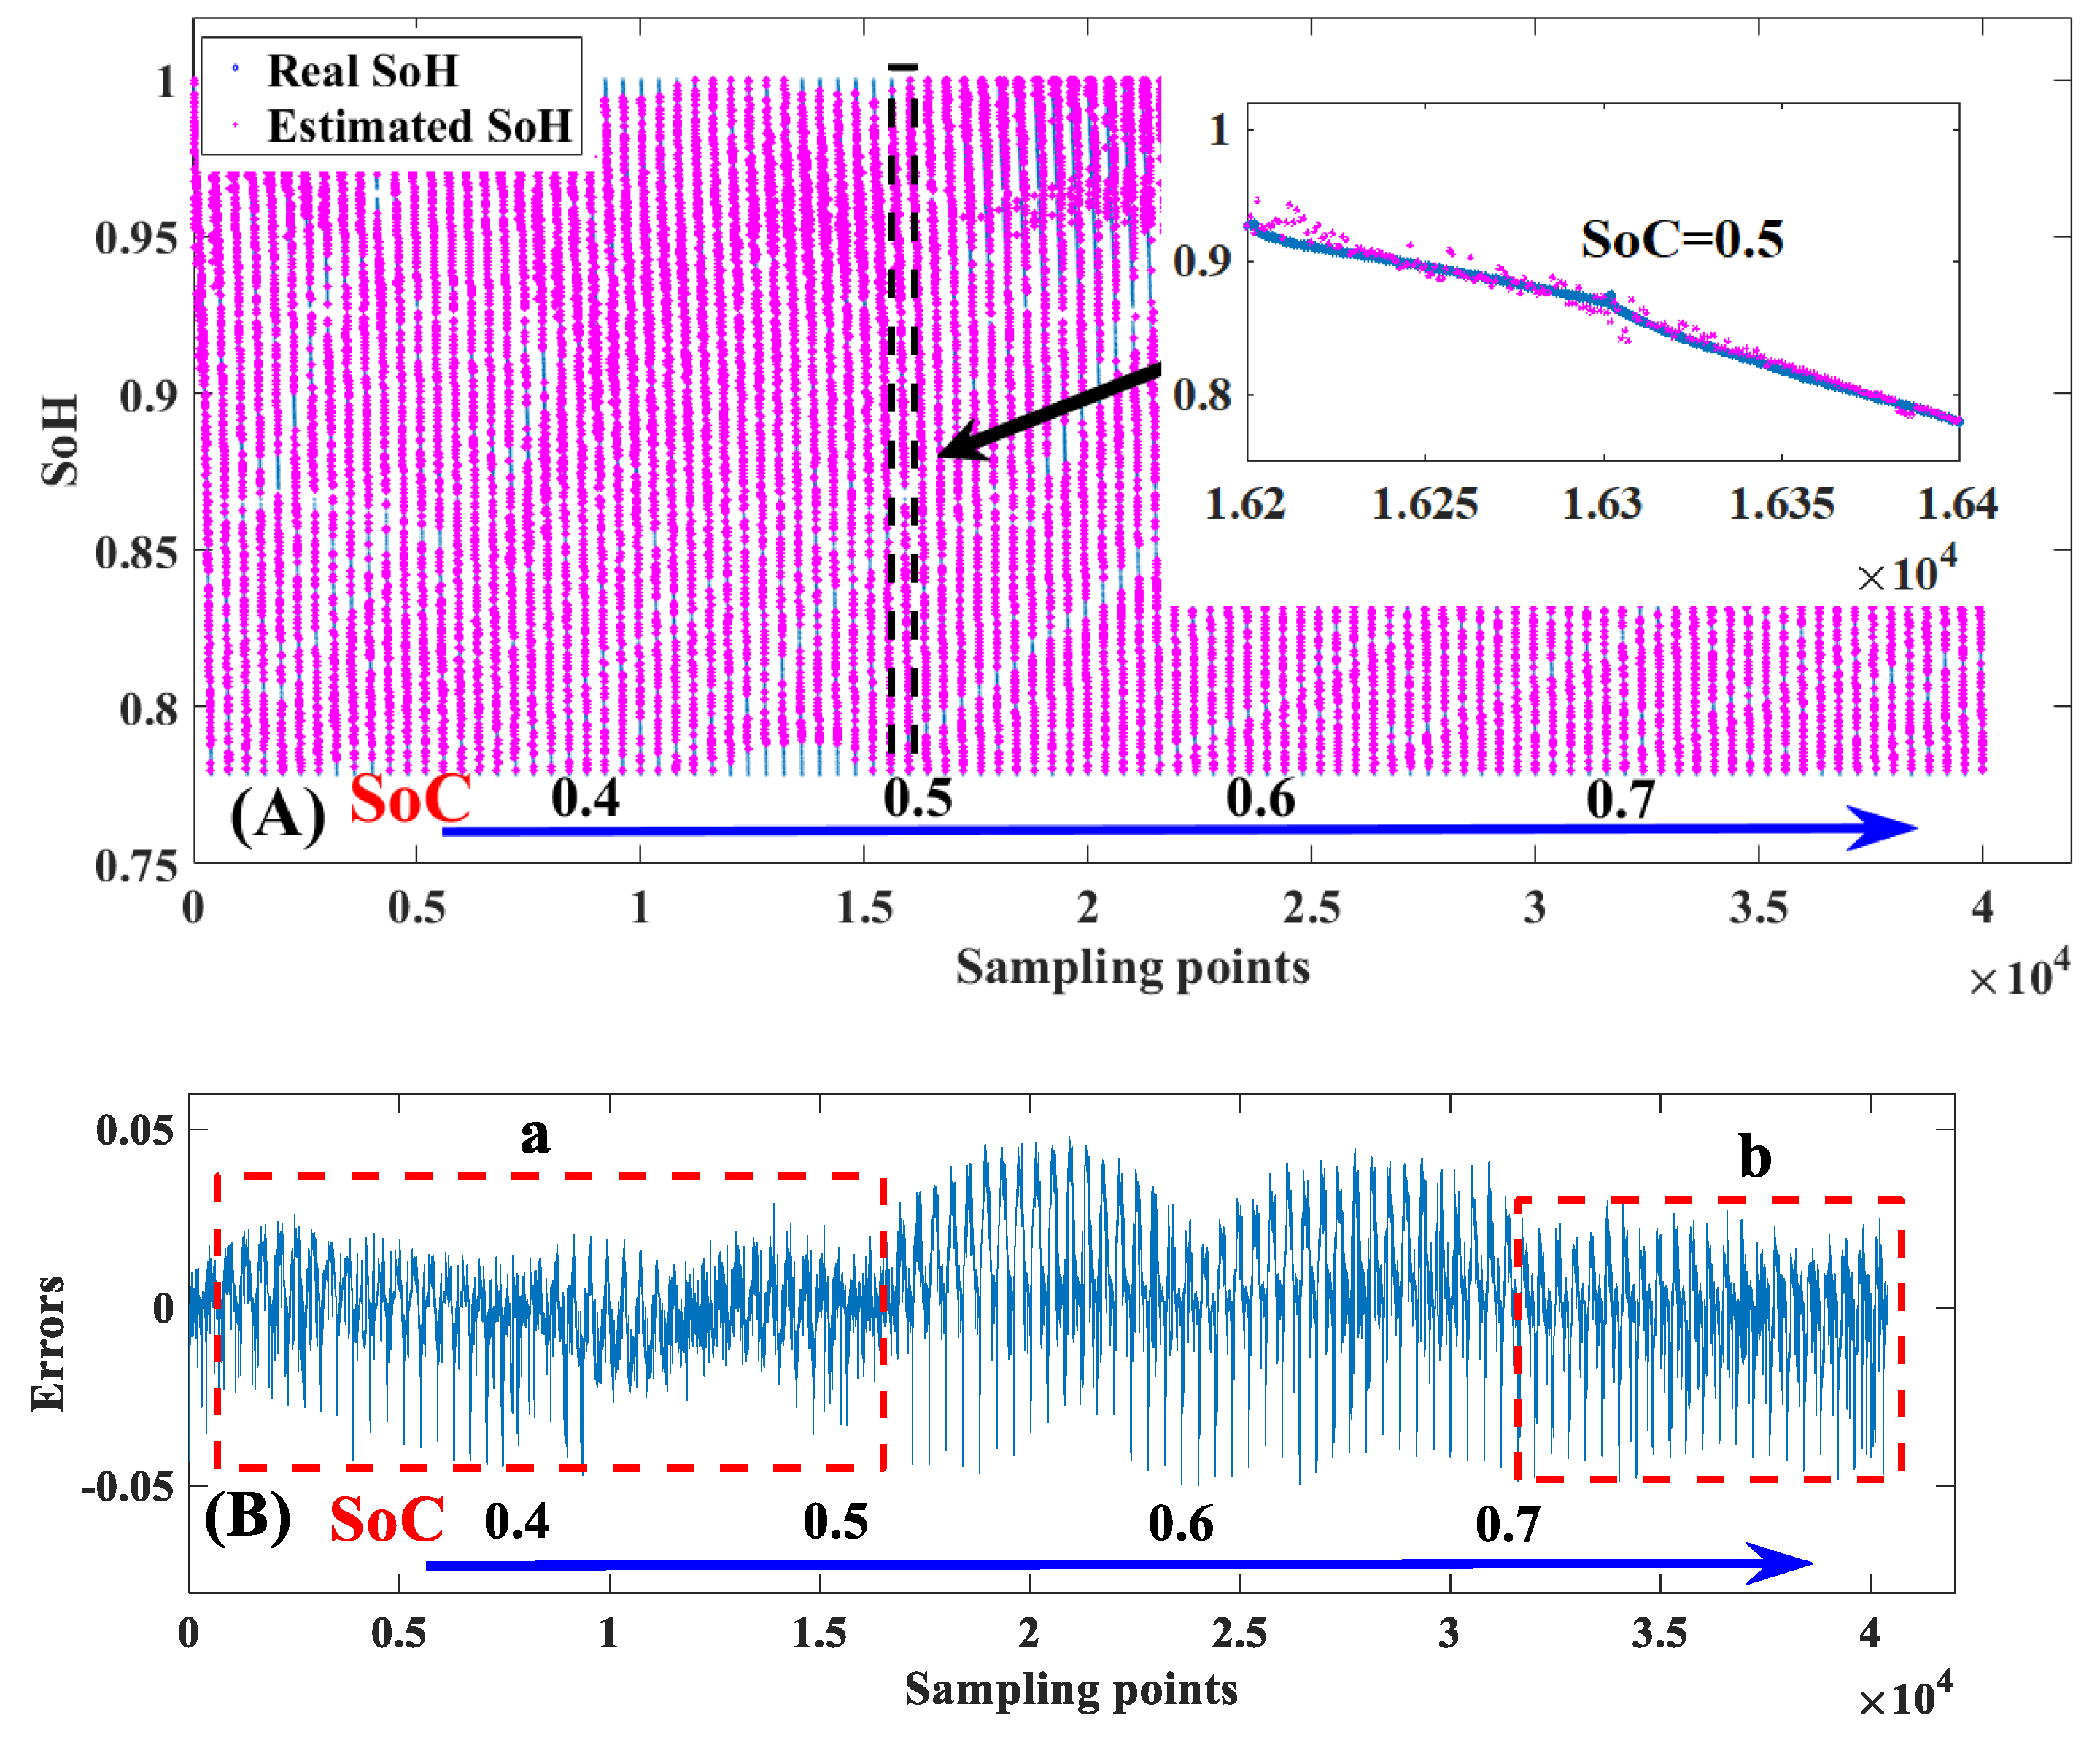
In order to observe the estimation results of the method comprehensively, the SoH estimation effect on the SoC range of 0.3–0.8 is analyzed. The test SoC point is taken every 0.005 interval for every charging process. A total of 40,000 points are selected. Figure 8A,B show the comparison results and estimated error, respectively. It can be seen that the estimated SoH has a satisfactory agreement with the actual SoH.
As mentioned above, a total of 11 fitting curves belonging to different SoC are selected. The more the fitting curves, the more accurate the estimation results. In Figure 8B, because there are more fitting curves in regions a and b, the overall errors of these two regions are smaller than that of other regions. This proves that the error of SoH estimation decreases as the number of fitting curves increases. On the whole, the SoH error estimated by this method is within 5% and the MAE is 1.08%, which has satisfactory accuracy.

5.2. Influence of SoC Estimation Error on SoH Estimation Results

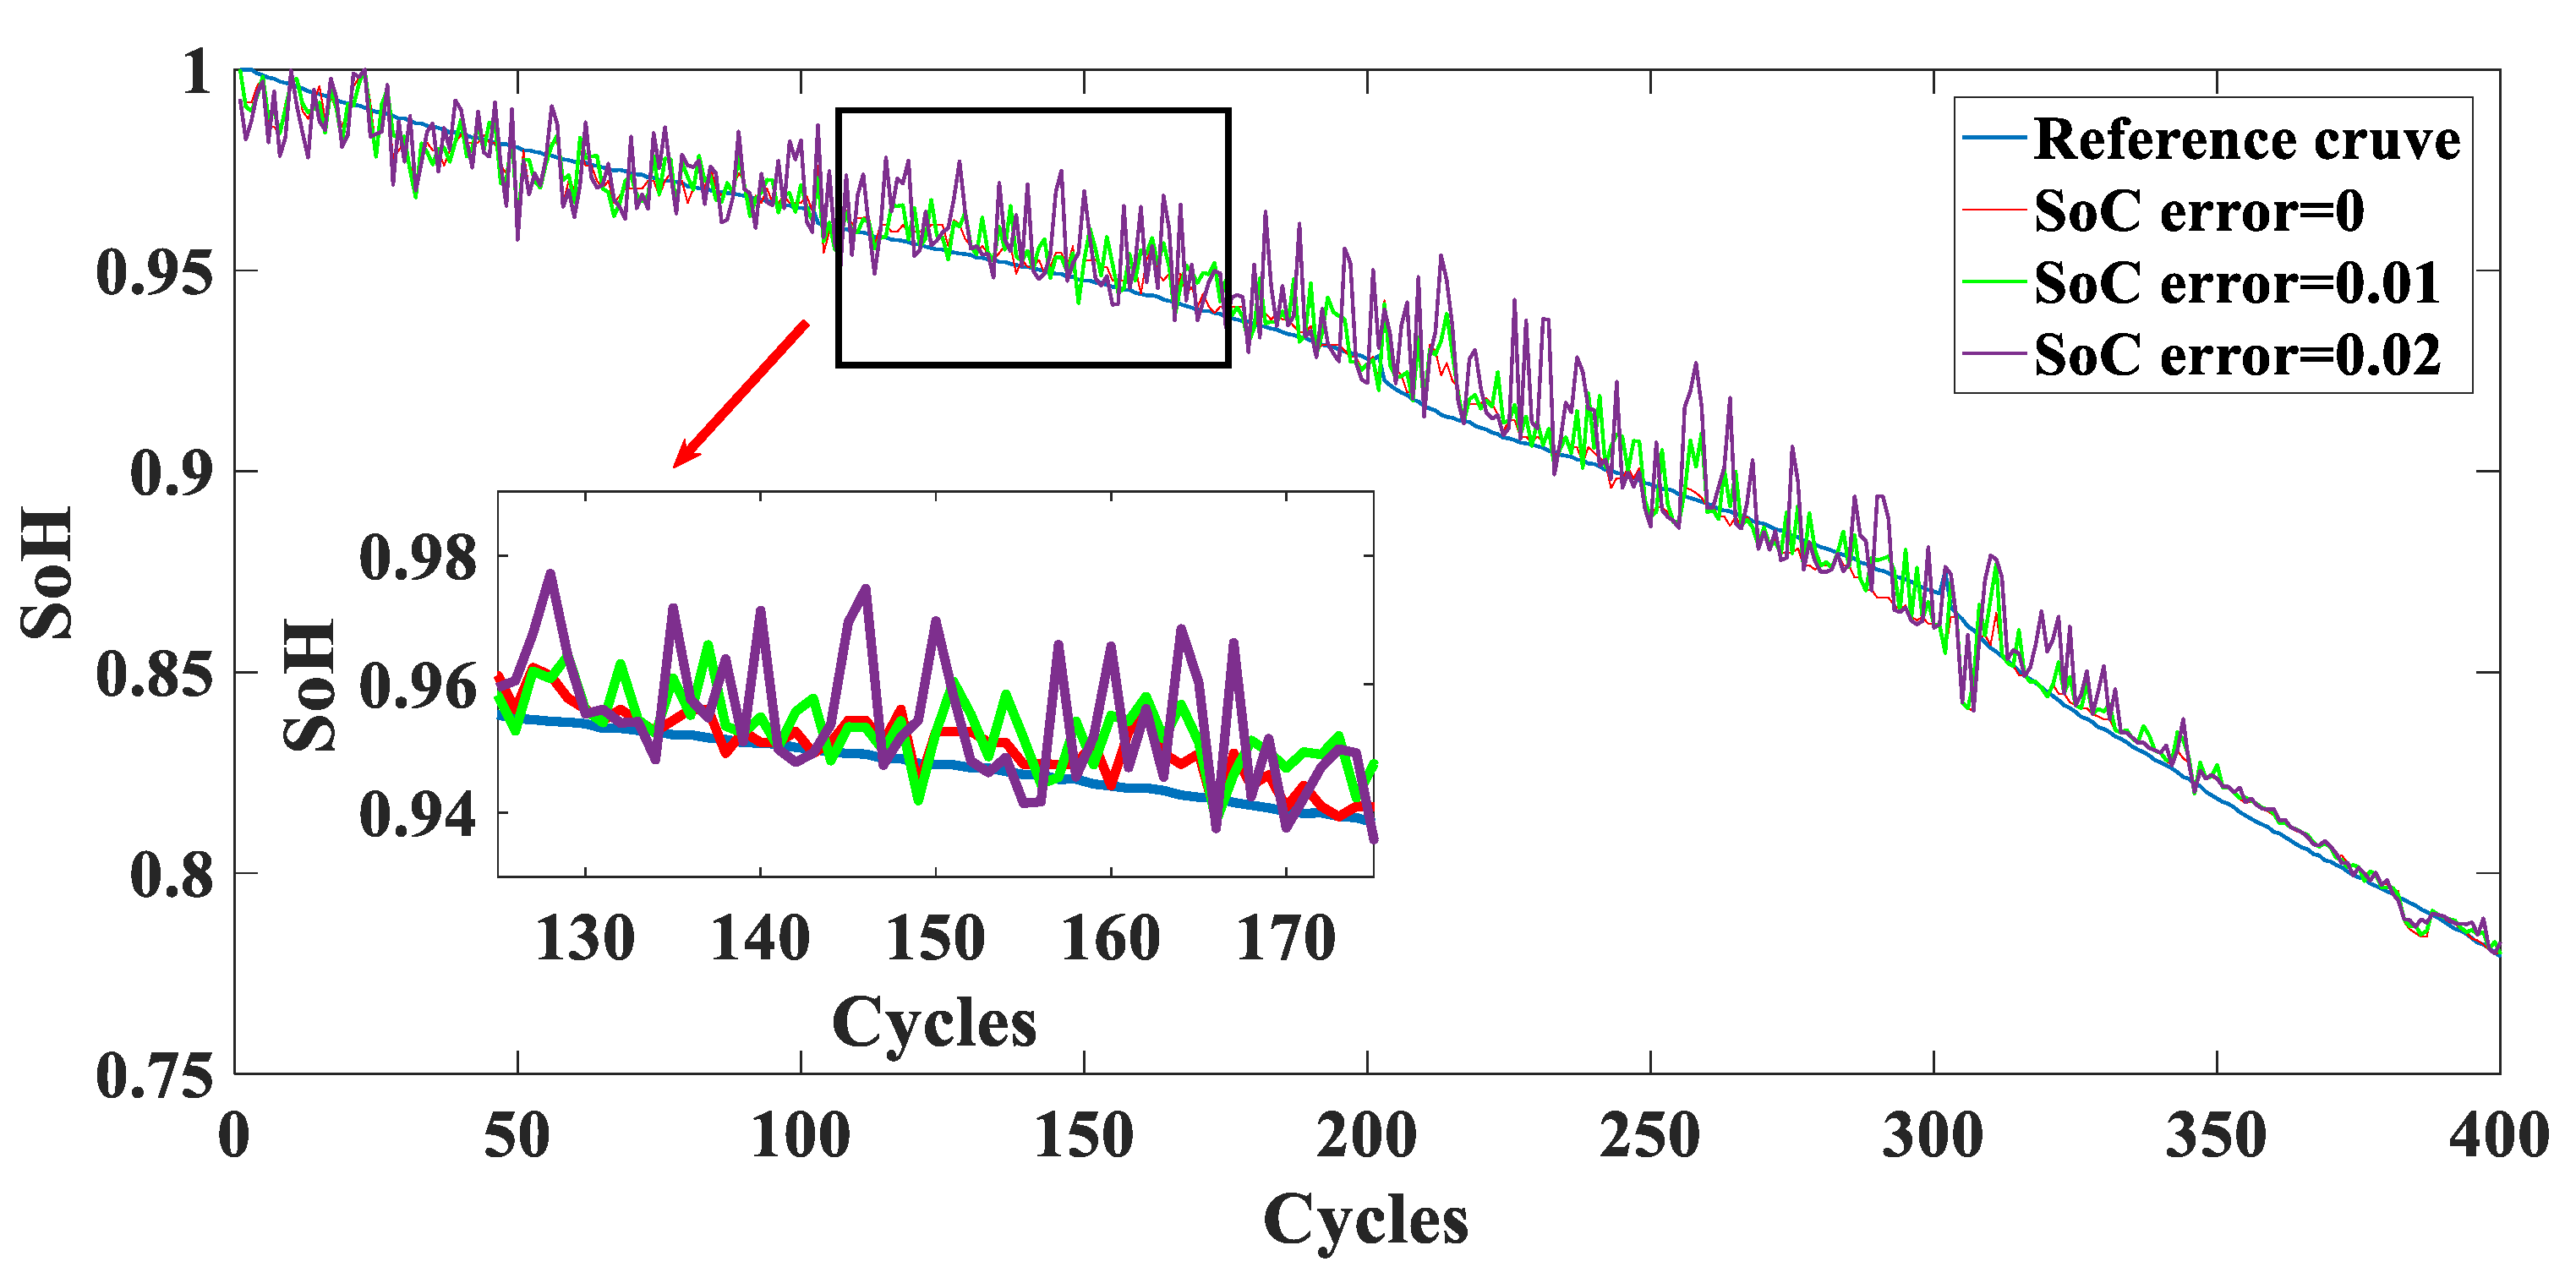
In this method, the sampling points are selected according to SoC. The magnitude of the SoC estimation error directly affects the estimation effect of SoH. Therefore, a comparative experiment is designed under different SOC estimation errors. As can be seen in Figure 9, when the SoC estimation error is within 1%, the SoH estimation results are not much different from the SoC error of 0 and the MAE is only 1.17%. Therefore, when an SoC estimation method can limit the error to 1%, the influence of the SoC estimation error on the SoH estimation is negligible and the SoH estimation effect is satisfactory. In addition, in Figure 9, when the error of the SoC is 2%, the estimation results of the SoH have shown a few obvious fluctuation points and MAE has risen to 1.36%. Combined with Figure 10B, there are a few obvious errors at both ends of the figure. As for the cause of the above phenomenon, it is the degree of difference in the fitting curves of different SoC regions. As can be seen from the analysis in Section 4.1 and Figure 10, in the SoC interval of 0.45–0.75, the difference in the different fitting curves is not large, and the relationship between dQ/dV and SoH under different SoCs is quite similar, that is, the accuracy of the SoC estimation in this interval has relatively inconspicuous influence on SoH estimation, while in the SoC region at both ends there are a few obvious fluctuation points, that is, when the error of the SoC is amplified to 2%, the estimation accuracy of the SoH estimation method has begun to be affected by the SoC error in the region of the SoC from 0.3–0.45. Fortunately, all the commonly used SoC estimation methods limit the SoC error to 1% or less [21,22,23]. Therefore, in this paper, the selection of the SoC estimation methods has not been discussed. In the following work, the impact of different SoC methods on the SoH estimation method will be discussed in detail.

6. Future Discussions

This paper proposes a SoH estimation method based on incremental capacity analysis, which has satisfactory accuracy and estimated efficiency. However, there are still many aspects about the method that can be optimized and improved, including the following two aspects:
(1)
Filtering and denoising. The selection of dV is directly related to the estimated efficiency of the SoH estimation. A smaller dV means a shorter SoH estimation time. However, with the decrease of dV, the noise is relatively amplified. If the influence of noise can be reduced or eliminated, then a smaller dV can be selected, and the estimated efficiency of this method can be further improved. A Kalman filter, or other method, will be considered in future works to eliminate noise to the maximum extent.
(2)
Further research on the SoH estimation of HEVs. In actual operation, due to fuel economy considerations, the energy management strategy of HEVs tends to maintain SoC at 0.5 [24,25,26]. This method has the best estimation effect when the SoC = 0.5 or so, which means only 2–3 fitting curves are needed for HEVs to obtain a very satisfactory SoH estimation effect. Therefore, the next research direction is to apply the SoH estimation method to HEVs.
In addition, due to the long time of battery aging experiments, this paper only verifies the feasibility of the method at 25 °C. In the next stage of work, we will carry out the aging test of battery cells and battery packs at different temperatures. The universality and practicability of the proposed method will be further studied.

7. Conclusions

A fast and efficient online SoH estimation method based on ICA is proposed in this paper. The relationship between dQ/dV and SoH at different SoCs is analyzed and a black box model for SoH estimation is established based on this relationship. In this model, only an arbitrary dQ/dV is required to estimate the corresponding SoH. The influence of different SoC ranges on SoH estimation is analyzed, and the estimated accuracy and efficiency are balanced by choosing the reasonable dV. The maximum time to estimate SoH is less than six minutes and the estimated error is within 5%. Additionally, the mean absolute error (MAE) is 1.08%. Compared with traditional ICA methods, this method removes the dependence on IC peaks, so that most of the dQ/dV in the whole charging process can be used to estimate the SoH, which shows a strong adaptability.

Author Contributions

Conceptualization: S.Q.; data curation: P.G.; formal analysis: S.Q.; methodology: S.Q.; project administration: Y.K.; resources: C.Z. supervision: B.D.; writing—original draft: S.Q.

Funding

The research was funded by the Key Research and Development Program of China (No. 2018YFB0104000), the National Natural Science Foundation of China (Nos. 61527809, U1764258, 61633015) and the Foundation of State Key Laboratory of Automotive Simulation and Control (20181117).

Conflicts of Interest

The authors declare no conflict of interest

References

  1. Gholizadeh, M.; Salmasi, F.R. Estimation of State of Charge, Unknown Nonlinearities, and State of Health of a Lithium-Ion Battery Based on a Comprehensive Unobservable. Model. IEEE Trans. Ind. Electron. 2014, 61, 1335–1344. [Google Scholar] [CrossRef]
  2. Zhu, R.; Duan, B.; Zhang, C.; Gong, S. Accurate lithium-ion battery modeling with inverse repeat binary sequence for electric vehicle applications. Appl. Energy 2019, 251, 113339. [Google Scholar] [CrossRef]
  3. Zhou, Z.; Kang, Y.; Shang, Y.; Cui, N.; Zhang, C.; Duan, B.; Naxin, C. Peak power prediction for series-connected LiNCM battery pack based on representative cells. J. Clean. Prod. 2019, 230, 1061–1073. [Google Scholar] [CrossRef]
  4. Dubarry, M.; Truchot, C.; Liaw, B.Y. Synthesize battery degradation modes via a diagnostic and prognostic model. J. Power Sources 2012, 219, 204–216. [Google Scholar] [CrossRef]
  5. Kang, Y.; Duan, B.; Zhou, Z.; Shang, Y.; Zhang, C. A multi-fault diagnostic method based on an interleaved voltage measurement topology for series connected battery packs. J. Power Sources 2019, 417, 132–144. [Google Scholar] [CrossRef]
  6. Jiang, Y.; Jiang, J.; Zhang, C.; Zhang, W.; Gao, Y.; Guo, Q. Recognition of battery aging variations for LiFePO4 batteries in 2nd use applications combining incremental capacity analysis and statistical approaches. J. Power Sources 2017, 360, 180–188. [Google Scholar] [CrossRef]
  7. Wei, Z.; Zhao, J.; Ji, D.; Tseng, K.J. A multi-timescale estimator for battery state of charge and capacity dual estimation based on an online identified model. Appl. Energy 2017, 204, 1264–1274. [Google Scholar] [CrossRef]
  8. Von Srbik, M.-T.; Marinescu, M.; Martinez-Botas, R.F.; Offer, G.J. A physically meaningful equivalent circuit network model of a lithium-ion battery accounting for local electrochemical and thermal behaviour, variable double layer capacitance and degradation. J. Power Sources 2016, 325, 171–184. [Google Scholar] [CrossRef] [Green Version]
  9. Zou, C.; Manzie, C.; Nešić, D. A Framework for Simplification of PDE-Based Lithium-Ion Battery Models. IEEE Trans. Control Syst. Technol. 2016, 24, 1594–1609. [Google Scholar] [CrossRef]
  10. Yang, D.; Wang, Y.; Pan, R.; Chen, R.; Chen, Z. A Neural Network Based State-of-Health Estimation of Lithium-ion Battery in Electric Vehicles. Energy Procedia 2017, 105, 2059–2064. [Google Scholar] [CrossRef]
  11. Weng, C.; Cui, Y.; Sun, J.; Peng, H. On-board state of health monitoring of lithium-ion batteries using incremental capacity analysis with support vector regression. J. Power Sources 2013, 235, 36–44. [Google Scholar] [CrossRef]
  12. Feng, X.; Li, J.; Ouyang, M.; Lu, L.; Li, J.; He, X. Using probability density function to evaluate the state of health of lithium-ion batteries. J. Power Sources 2013, 232, 209–218. [Google Scholar] [CrossRef]
  13. Yazami, R.; Touzain, P. A reversible graphite-lithium negative electrode for electrochemical generators. J. Power Sources 1983, 9, 365–371. [Google Scholar] [CrossRef]
  14. Yazami, R.; Reynier, Y. Thermodynamics and crystal structure anomalies in lithium-intercalated graphite. J. Power Sources 2006, 153, 312–318. [Google Scholar] [CrossRef]
  15. Weng, C.; Feng, X.; Sun, J.; Peng, H. State-of-health monitoring of lithium-ion battery modules and packs via incremental capacity peak tracking. Appl. Energy 2016, 180, 360–368. [Google Scholar] [CrossRef] [Green Version]
  16. Li, Y.; Abdel-Monema, M.; Gopalakrishnan, R.; Berecibar, M.; Nanini-Maury, E.; Omar, N.; van den Bossche, P.; Van Mierlo, J. A quick on-line state of health estimation method for Li-ion battery with incremental capacity curves processed by Gaussian filter (vol 373, pg 40, 2018). J. Power Sources 2018, 393, 230. [Google Scholar] [CrossRef]
  17. Weng, C.; Sun, J.; Peng, H. A unified open-circuit-voltage model of lithium-ion batteries for state-of-charge estimation and state-of-health monitoring. J. Power Sources 2014, 258, 228–237. [Google Scholar] [CrossRef]
  18. Tang, X.; Zou, C.; Yao, K.; Chen, G.; Liu, B.; He, Z.; Gao, F. A fast estimation algorithm for lithium-ion battery state of health. J. Power Sources 2018, 396, 453–458. [Google Scholar] [CrossRef]
  19. Plattard, T.; Barnet, N.; Assaud, L.; Franger, S.; Duffault, J. Combining a Fatigue Model and an Incremental Capacity Analysis on a Commercial NMC/Graphite Cell under Constant Current Cycling with and without Calendar Aging. Batteries 2019, 5, 36. [Google Scholar] [CrossRef]
  20. Bloom, I.; Jansen, A.N.; Abraham, D.P.; Knuth, J.; Jones, S.A.; Battaglia, V.S.; Henriksen, G.L. Differential voltage analyses of high-power, lithium-ion cells 1. Technique and application. J. Power Sources 2005, 139, 295–303. [Google Scholar] [CrossRef]
  21. Cui, X.; He, Z.; Li, E.; Cheng, A.; Luo, M.; Guo, Y. State-of-charge estimation of power lithium-ion batteries based on an embedded micro control unit using a square root cubature Kalman filter at various ambient temperatures. Int. J. Energy Res. 2019, 43, 3561–3577. [Google Scholar] [CrossRef]
  22. Zhang, H.; Na, W.; Kim, J. State-of-Charge Estimation of the Lithium-Ion Battery Using Neural Network Based on an Improved Thevenin Circuit Model. In Proceedings of the IEEE Transportation Electrification Conference and Expo (ITEC), Long Beach, CA, USA, 13–15 June 2018; pp. 342–346. [Google Scholar]
  23. Gu, P.; Zhou, Z.; Qu, S.; Zhang, C.; Duan, B. Influence Analysis and Optimization of Sampling Frequency on the Accuracy of Model and State-of-Charge Estimation for LiNCM Battery. Energies 2019, 12, 1205. [Google Scholar] [CrossRef]
  24. Wu, J.; Ruan, J.; Zhang, N.; Walker, P.D. An Optimized Real-Time Energy Management Strategy for the Power-Split Hybrid Electric Vehicles. IEEE Trans. Control Syst. Technol. 2019, 27, 1194–1202. [Google Scholar] [CrossRef]
  25. Xu, Q.; Mao, Y.; Zhao, M.; Cui, S. A Hybrid Electric Vehicle Dynamic Optimization Energy Management Strategy Based on a Compound-Structured Permanent-Magnet Motor. Energies 2018, 11, 22129. [Google Scholar] [CrossRef]
  26. Wang, Y.; Wu, Z.; Chen, Y.; Xia, A.; Guo, C.; Tang, Z. Research on energy optimization control strategy of the hybrid electric vehicle based on Pontryagin's minimum principle. Comput. Electr. Eng. 2018, 72, 203–213. [Google Scholar] [CrossRef]
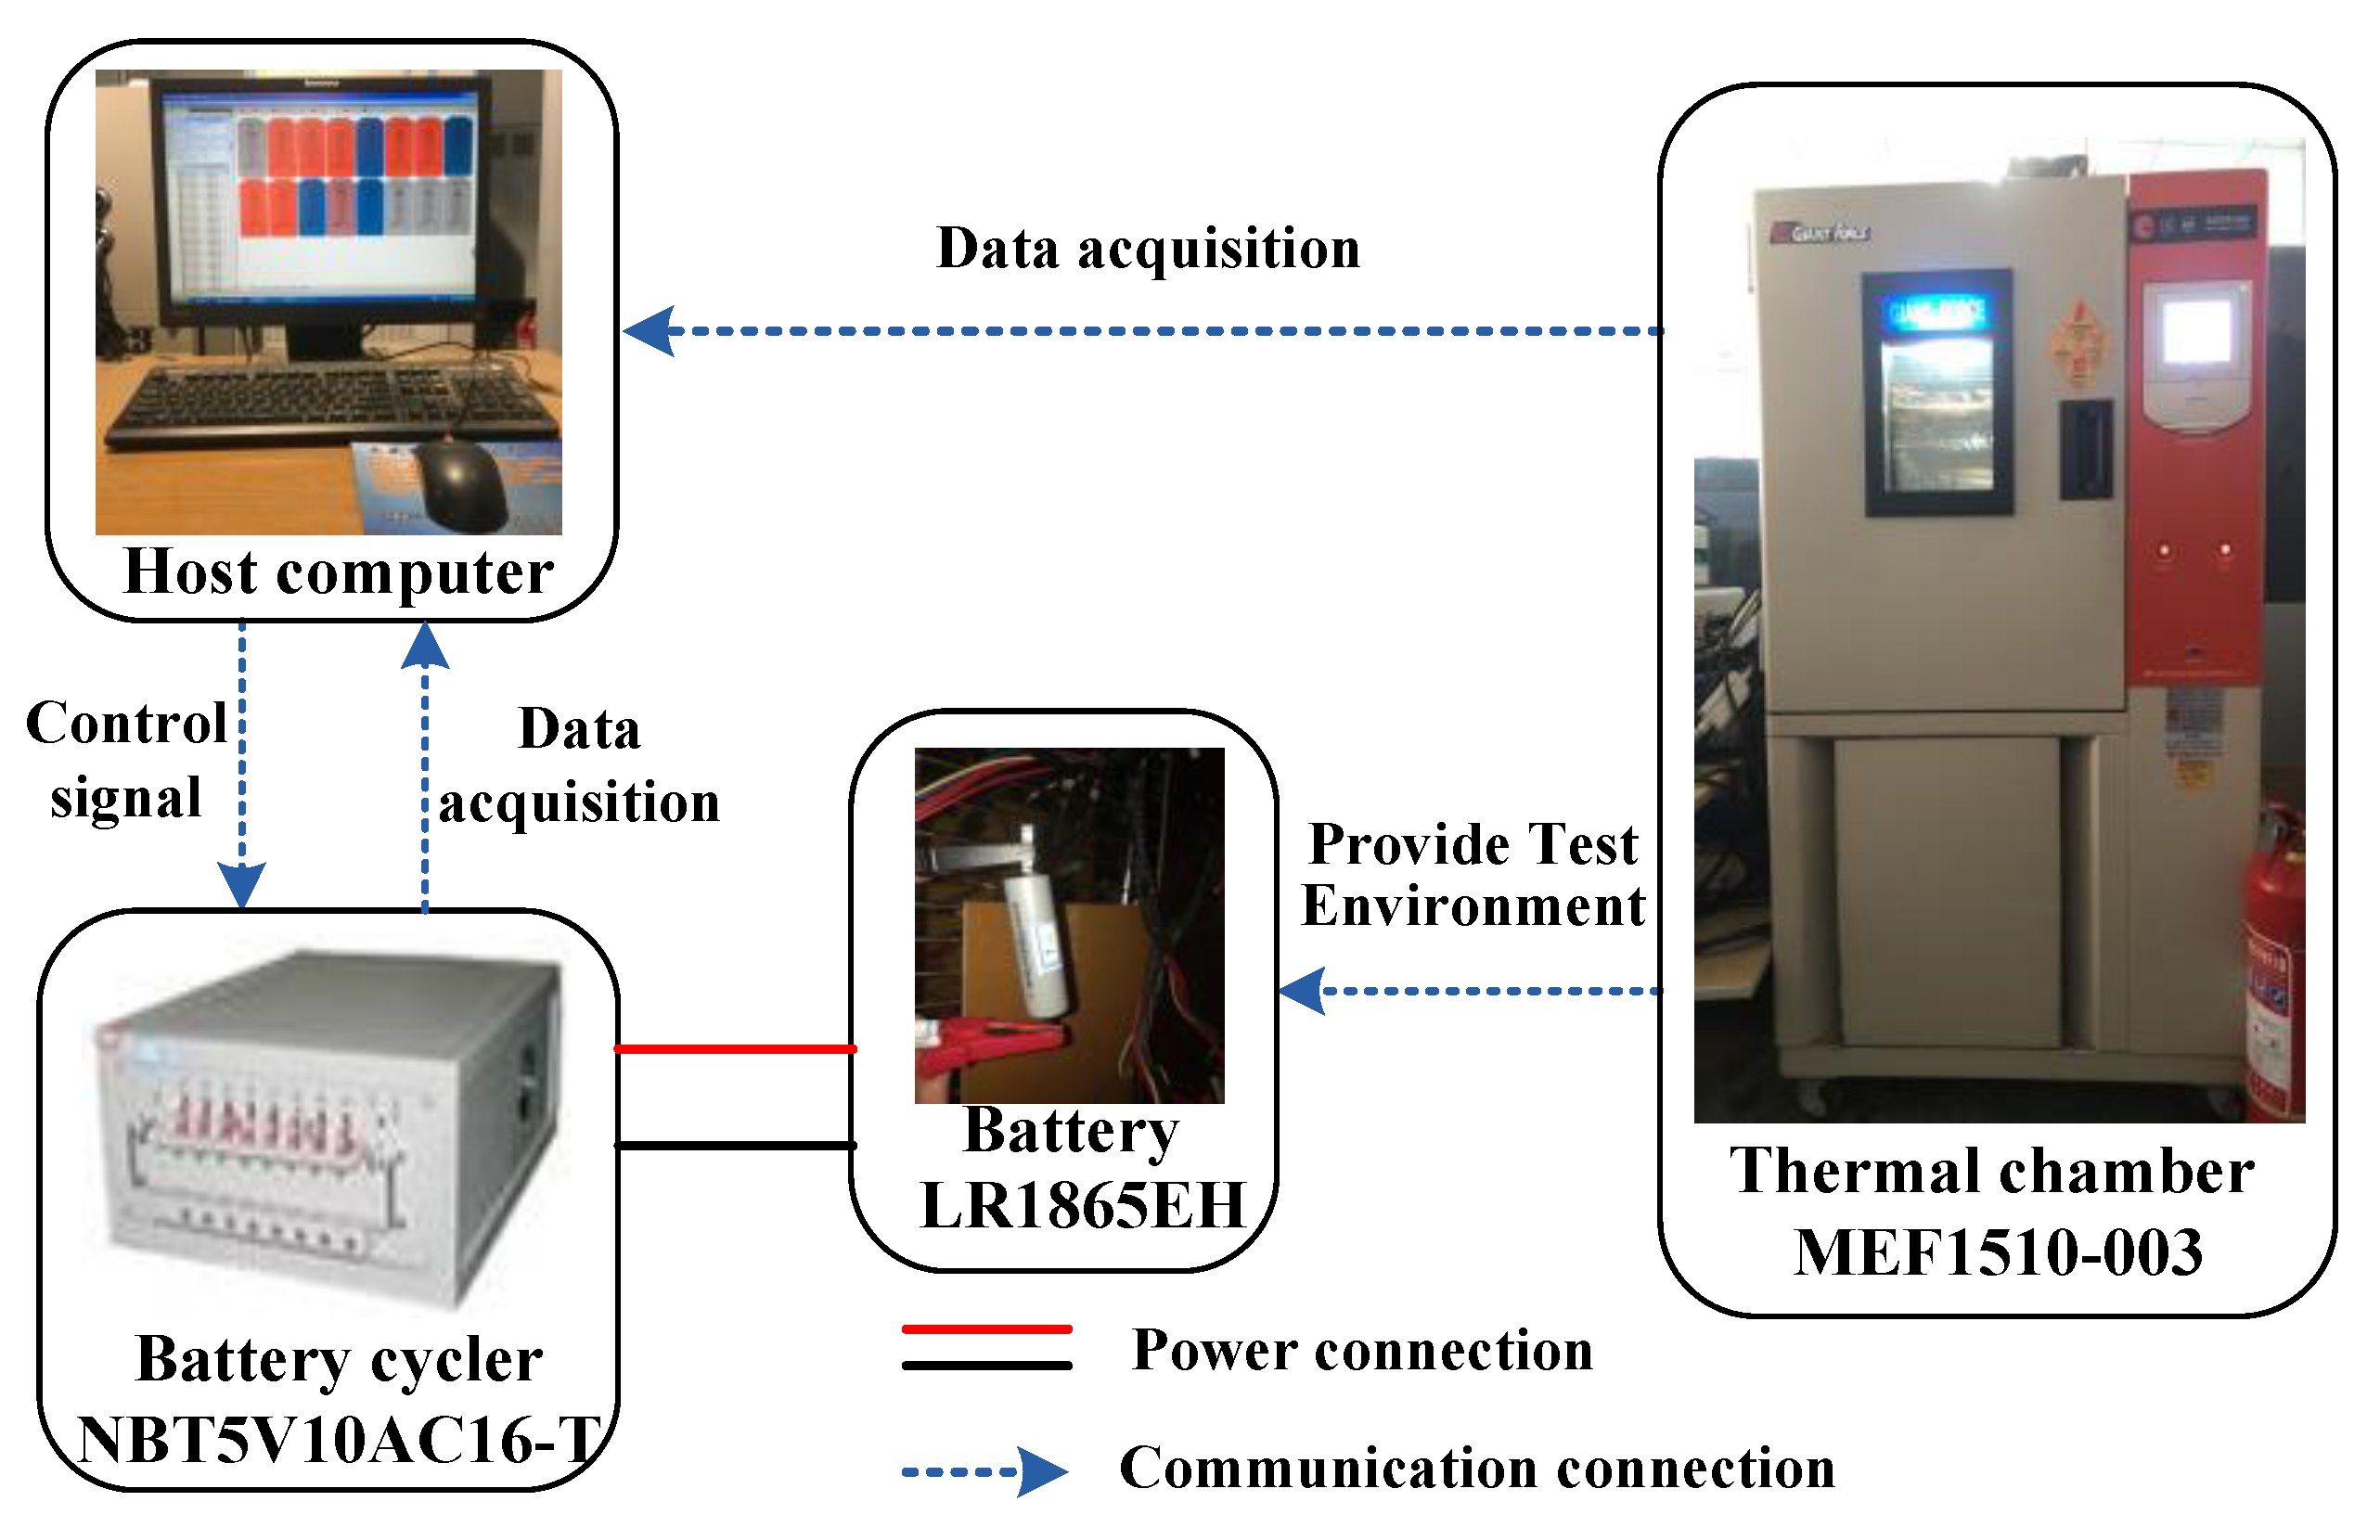
Figure 1. Battery test bench which consists of battery cycler, host computer, lithium-ion battery, and thermal chamber.
Energies 12 03333 g001
Figure 2. SoH of the tested battery plotted as a function of dQ/dV in full cycle for (A) SoC = 0.1, (B) SoC = 0.5, and (C) SoC = 0.9.
Energies 12 03333 g002
Figure 3. The relationship between SoH and dQ/dV at 10 different SoCs (the SoC interval is 0.1 and dV = 0.02 V).
Energies 12 03333 g003
Figure 4. The black box model of SoH estimation (the input is dQ/dV, output is estimated SoH and the black box algorithm relies on fitting curves).
Energies 12 03333 g004
Figure 5. The relationship of SoC, dQ/dV and SoH (the degrees of the 3D fitting surface of the scatter: SoH: 2; SoC: 2).
Energies 12 03333 g005
Figure 6. The relationship between dQ/dV and SoH with dV = 0.005 V.
Energies 12 03333 g006
Figure 7. The relationship of RSME of fitting curve, the maximum time to calculate dQ and dV.
Energies 12 03333 g007
Figure 8. Estimation results of SoH: (A) Estimation results of SoH on SoC from 0.3 to 0.8; (B) errors of SoH on SoC from 0.3 to 0.8.
Energies 12 03333 g008
Figure 9. SoH estimation results under different SoC errors when reference SoC = 0.5.
Energies 12 03333 g009
Figure 10. SoH estimation errors under different SoC errors. (A) SoC error = 0.01; (B) SoC error = 0.02.
Energies 12 03333 g010aEnergies 12 03333 g010b
Table 1. Specifications for the test battery at 25 °C.
ParameterLiFePO4 Battery
Rated capacity1500 mAh
Charging cut-off voltage3.65 V
Discharging cut-off voltage2.0 V
Table 2. R2 of 11 fitting curves (dV = 0.02 V).
SoCR2
0.30.9913
0.350.9875
0.40.9787
0.450.9916
0.50.9931
0.60.9519
0.70.9602
0.730.9553
0.750.9658
0.770.9592
0.80.9718