Abstract
The main aim of this article is to present research findings related to the design of an electric rickshaw for use in Kolkata, India, identifying weaknesses in the current cycle rickshaw, developing a design solution to address problems found, and exploring the possibility of utilising solar power. Through research and testing it was found there were many design issues, concerns with health and safety, comfort, and ergonomics. All problems found were addressed by implementing design upgrades. The testing of the current cycle rickshaw identified the power and energy required to implement an electric drive system, where a 500 W 24 V DC motor and a battery capacity of 220 ampere hours was used in conjunction with a pedal assist system to provide a range of up to 52 km. A conceptual prototype was developed to prove the successful application of a pedal assist system, which was established as a viable option for design. The design has been critically evaluated and the relevant issues discussed.
1. Introduction
1.1. Historical Background
Today, the rickshaw represents over a century of rich Indian culture. Originally brought to the country from China, the rickshaw was a hand-pulled vehicle used by traders for transportation of goods. In 1914, the traders asked the governing body for permission to allow the transportation of people as passengers. The request was granted, and rickshaws became a mode of transport for the elite, although now it is used by people of all classes. Since its introduction in 1880, the rickshaw has advanced and evolved into different categories of vehicle: Hand-pulled, cycled, and motorised. Cycle rickshaws began to appear in India around 1930; as the price of bicycles began to fall, the popularity of cycle rickshaws began to rise, and by 1935 the cycle rickshaw outnumbered its hand-pulled counterpart [1]. The auto rickshaw was introduced in 1957 [2] powered by a 250 cc, 8 horsepower, 2 stroke, single-cylinder petrol engine; today, many auto rickshaws are liquified petroleum gas (LPG) powered. The auto rickshaw’s performance in terms of top speed outclasses both the hand-pulled and cycle rickshaw and is used in a different manner to them. The auto rickshaw is typically used on more open and faster roads, whereas the others are used in narrower and more congested urban environments. It could be argued that the auto rickshaw is not a competitor for the same type of business as the others. All three forms of rickshaw are still in use to this day, compounding their heritage, tradition, and role within the Indian society.
The cycle rickshaw design has not developed a great deal since its introduction and has fallen behind the times in terms of modern-day bicycle design. Bicycles have advanced to a stage where high-grade lightweight materials and efficient electric motors can make the cyclists ride almost effortless, a vast contrast from the laborious task facing the rickshaw drivers. Cycle rickshaws are heavy and uncomfortable and are therefore exhausting for the drivers to cycle; they are ergonomically inept and often found to be in a poor working condition, only adding to the driver’s exertion.
1.2. Population and Environment
India has a population of over 1.2 billion people, and the population growth rate for urban areas over the decade between the last two censuses 2001–2011 was 31.08%, showing that cities in India are becoming increasingly crowded. Kolkata, the capital of the state of West Bengal, has a population of over 14 million (urban area) meaning it has a population density of 24,000 people per square kilometre; the density of population gives an insight into the congestion the cities’ roads and transport networks have to contend with. The residential streets are frequently narrow, crowded with pedestrians, and often have market stalls protruding onto the roadside; this hinders the ability of larger conventional cars and buses to navigate effectively though them; therefore, smaller more manoeuvrable vehicles, such as the rickshaws, manage considerably better [3].
1.3. Driver Background
In a culture of separate classes, cycle rickshaw drivers are regarded poorly, less respected than auto rickshaw drivers. If the drivers were to drive an E-Rickshaw, they would be seen more positively [4]. The deprived and exploited sections of society are not explicitly recognized in policy documents by the government and very little attention has been paid in humanising the livelihood of the rickshaw pullers [2] This gives an alarming understanding of how the rickshaw drivers are seen by the community they serve. It shows that little help or thought is given to them.
Drivers are prone to long-term fatigue injuries and this leads to them becoming unable to work and therefore seen as lazy among members of their community. The drivers’ physical efforts result in injury [5].
1.4. Climate of India
The climate of Kolkata consists of temperatures that can reach as high as 36 °C in April and May, with average monthly temperatures ranging from 19.5 °C in January to 30.4 °C in May [6]. With rainfall of over 300 mm per month from June to September reaching 375 mm in July [6], this gives an understanding of how these extreme conditions will bring many issues for the driver, from poor road conditions to wet clothing becoming uncomfortable and heavy. Ultraviolet radiation can cause many health conditions, from cataracts to skin cancer. The UV index in India can reach above 16 in the monsoon season and is in the high to extreme range (8+) for nine months of the year [7]. Precautions recommended for high range are to wear a hat, sunglasses, sunscreen (SPF 15+), umbrella, and stay indoors from 10:00 to 16:00; the extreme range precautions advise minimum outdoor activity in addition to all the previous precautions [7]. This shows the issues the drivers have to overcome due to weather and the degree of health risks facing the drivers both short and long term.
2. Interview Data
2.1. Driver Interviews
2.1.1. Interview Design
Firstly, interview questions for the drivers were developed, for which different subject areas had to be addressed: The personal and physical circumstances of the driver, the personal opinion of the driver in relation to the rickshaw, and role of the job and rickshaw usage; an interview combining these questions gave the project an insight into the social, medical, and engineering factors that the drivers face by the occupation.
The interviews of drivers consisted of 10 questions, and 25 drivers in total were interviewed. The questions asked were set with the objective to find out the typical daily demand of the rickshaw as a vehicle, the basic profile of the driver, and his needs and wants. It is worth noting that all interview participants were male. Interview aims and limitations can be found in Appendix A.
2.1.2. Rickshaw Usage
Firstly, regarding the rickshaw performance-wise, it was found that the rickshaw was in use for, on average, 11.36 h, although not operated during the full 11.36 h as time would be spent queuing for a passenger. The average daily number of journeys was 28.2, up to a maximum of around 4 km, although a journey of between 1 and 2 km is more typical; therefore, a reasonable approximation of the daily distance could be calculated as 42 km.
The rickshaws are fitted with a bench-style seat and are capable of carrying two adults as well as the driver, although 40% of drivers claimed they would carry two adults and a child—this should be disregarded as it was not typical and was only done rarely.
2.1.3. Driver Profile
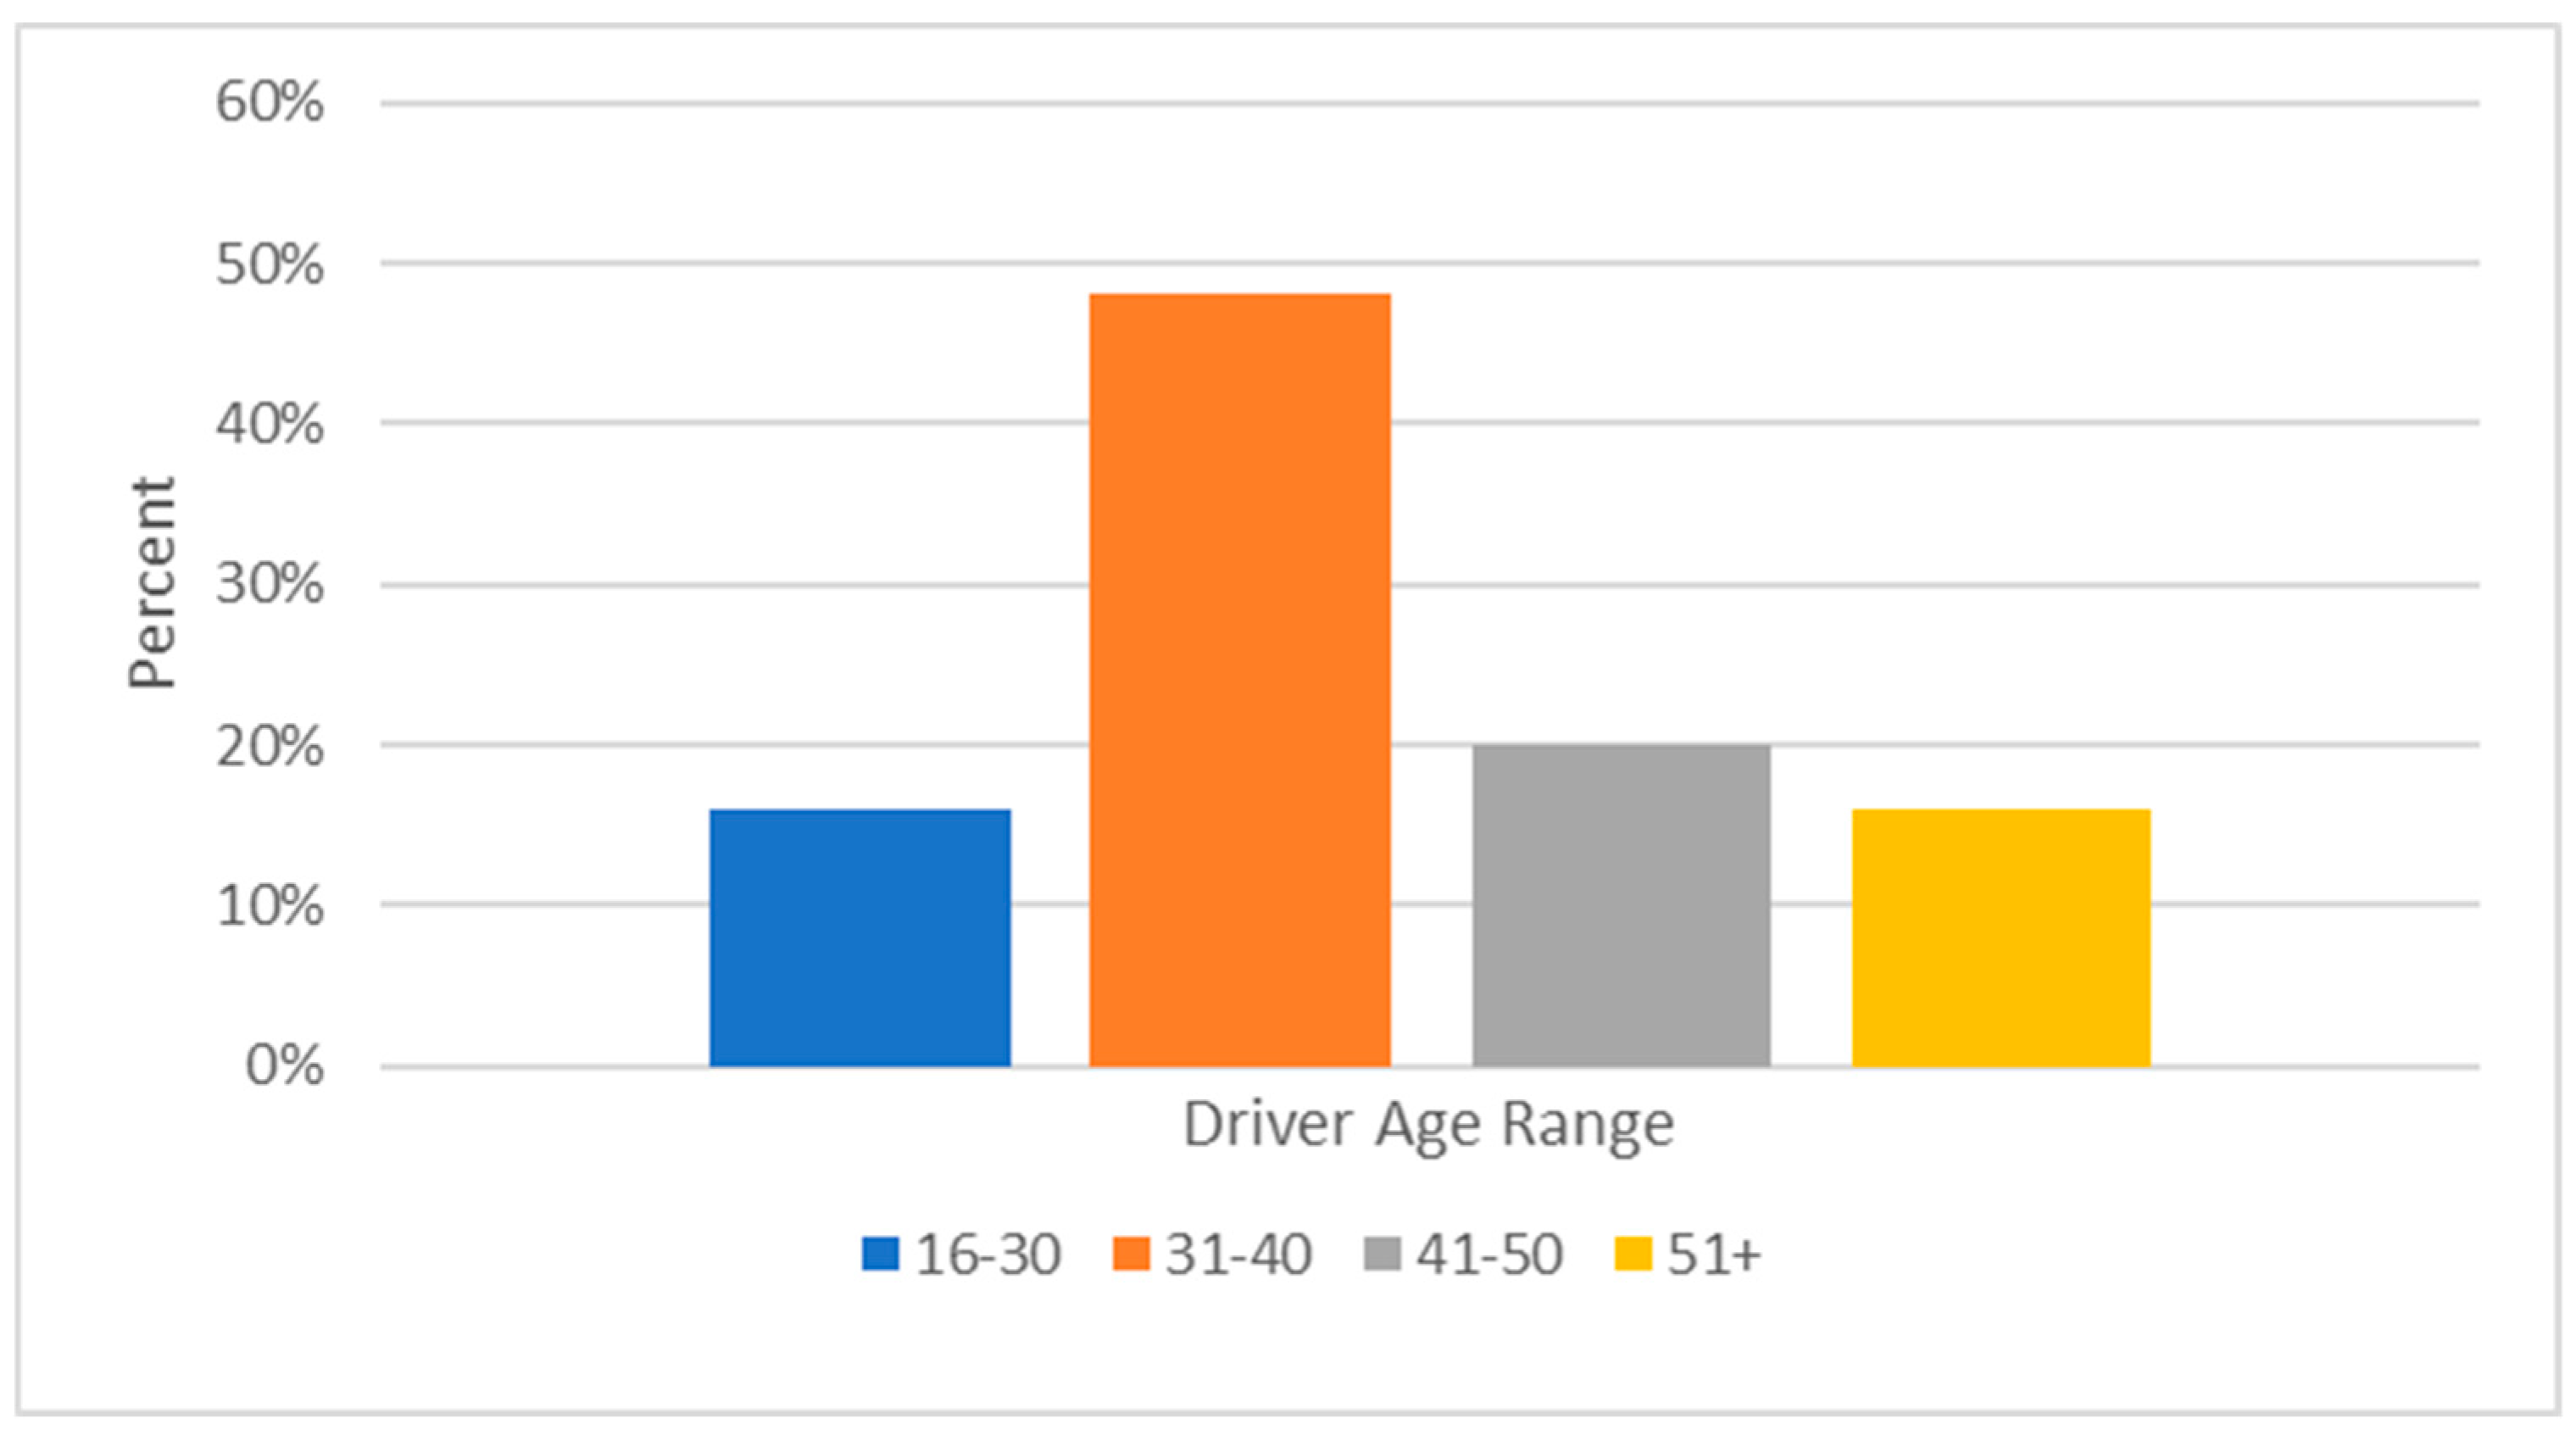
The profile of a typical rickshaw driver was derived by firstly identifying the average age. The answers were to be given in age ranges and it was found that 48% of the driver interviewed were aged between 31–40 years old, as seen in Figure 1. The average driver would work 6.4 days a week and would earn 334 rupees daily.
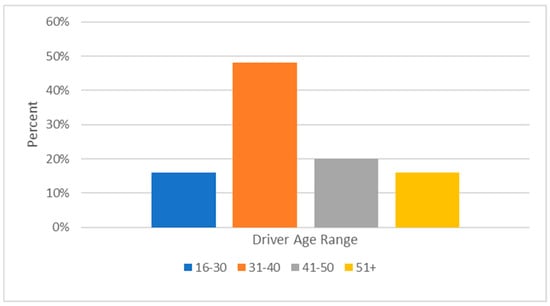
Figure 1.
Driver age range.
2.1.4. Medical Issues
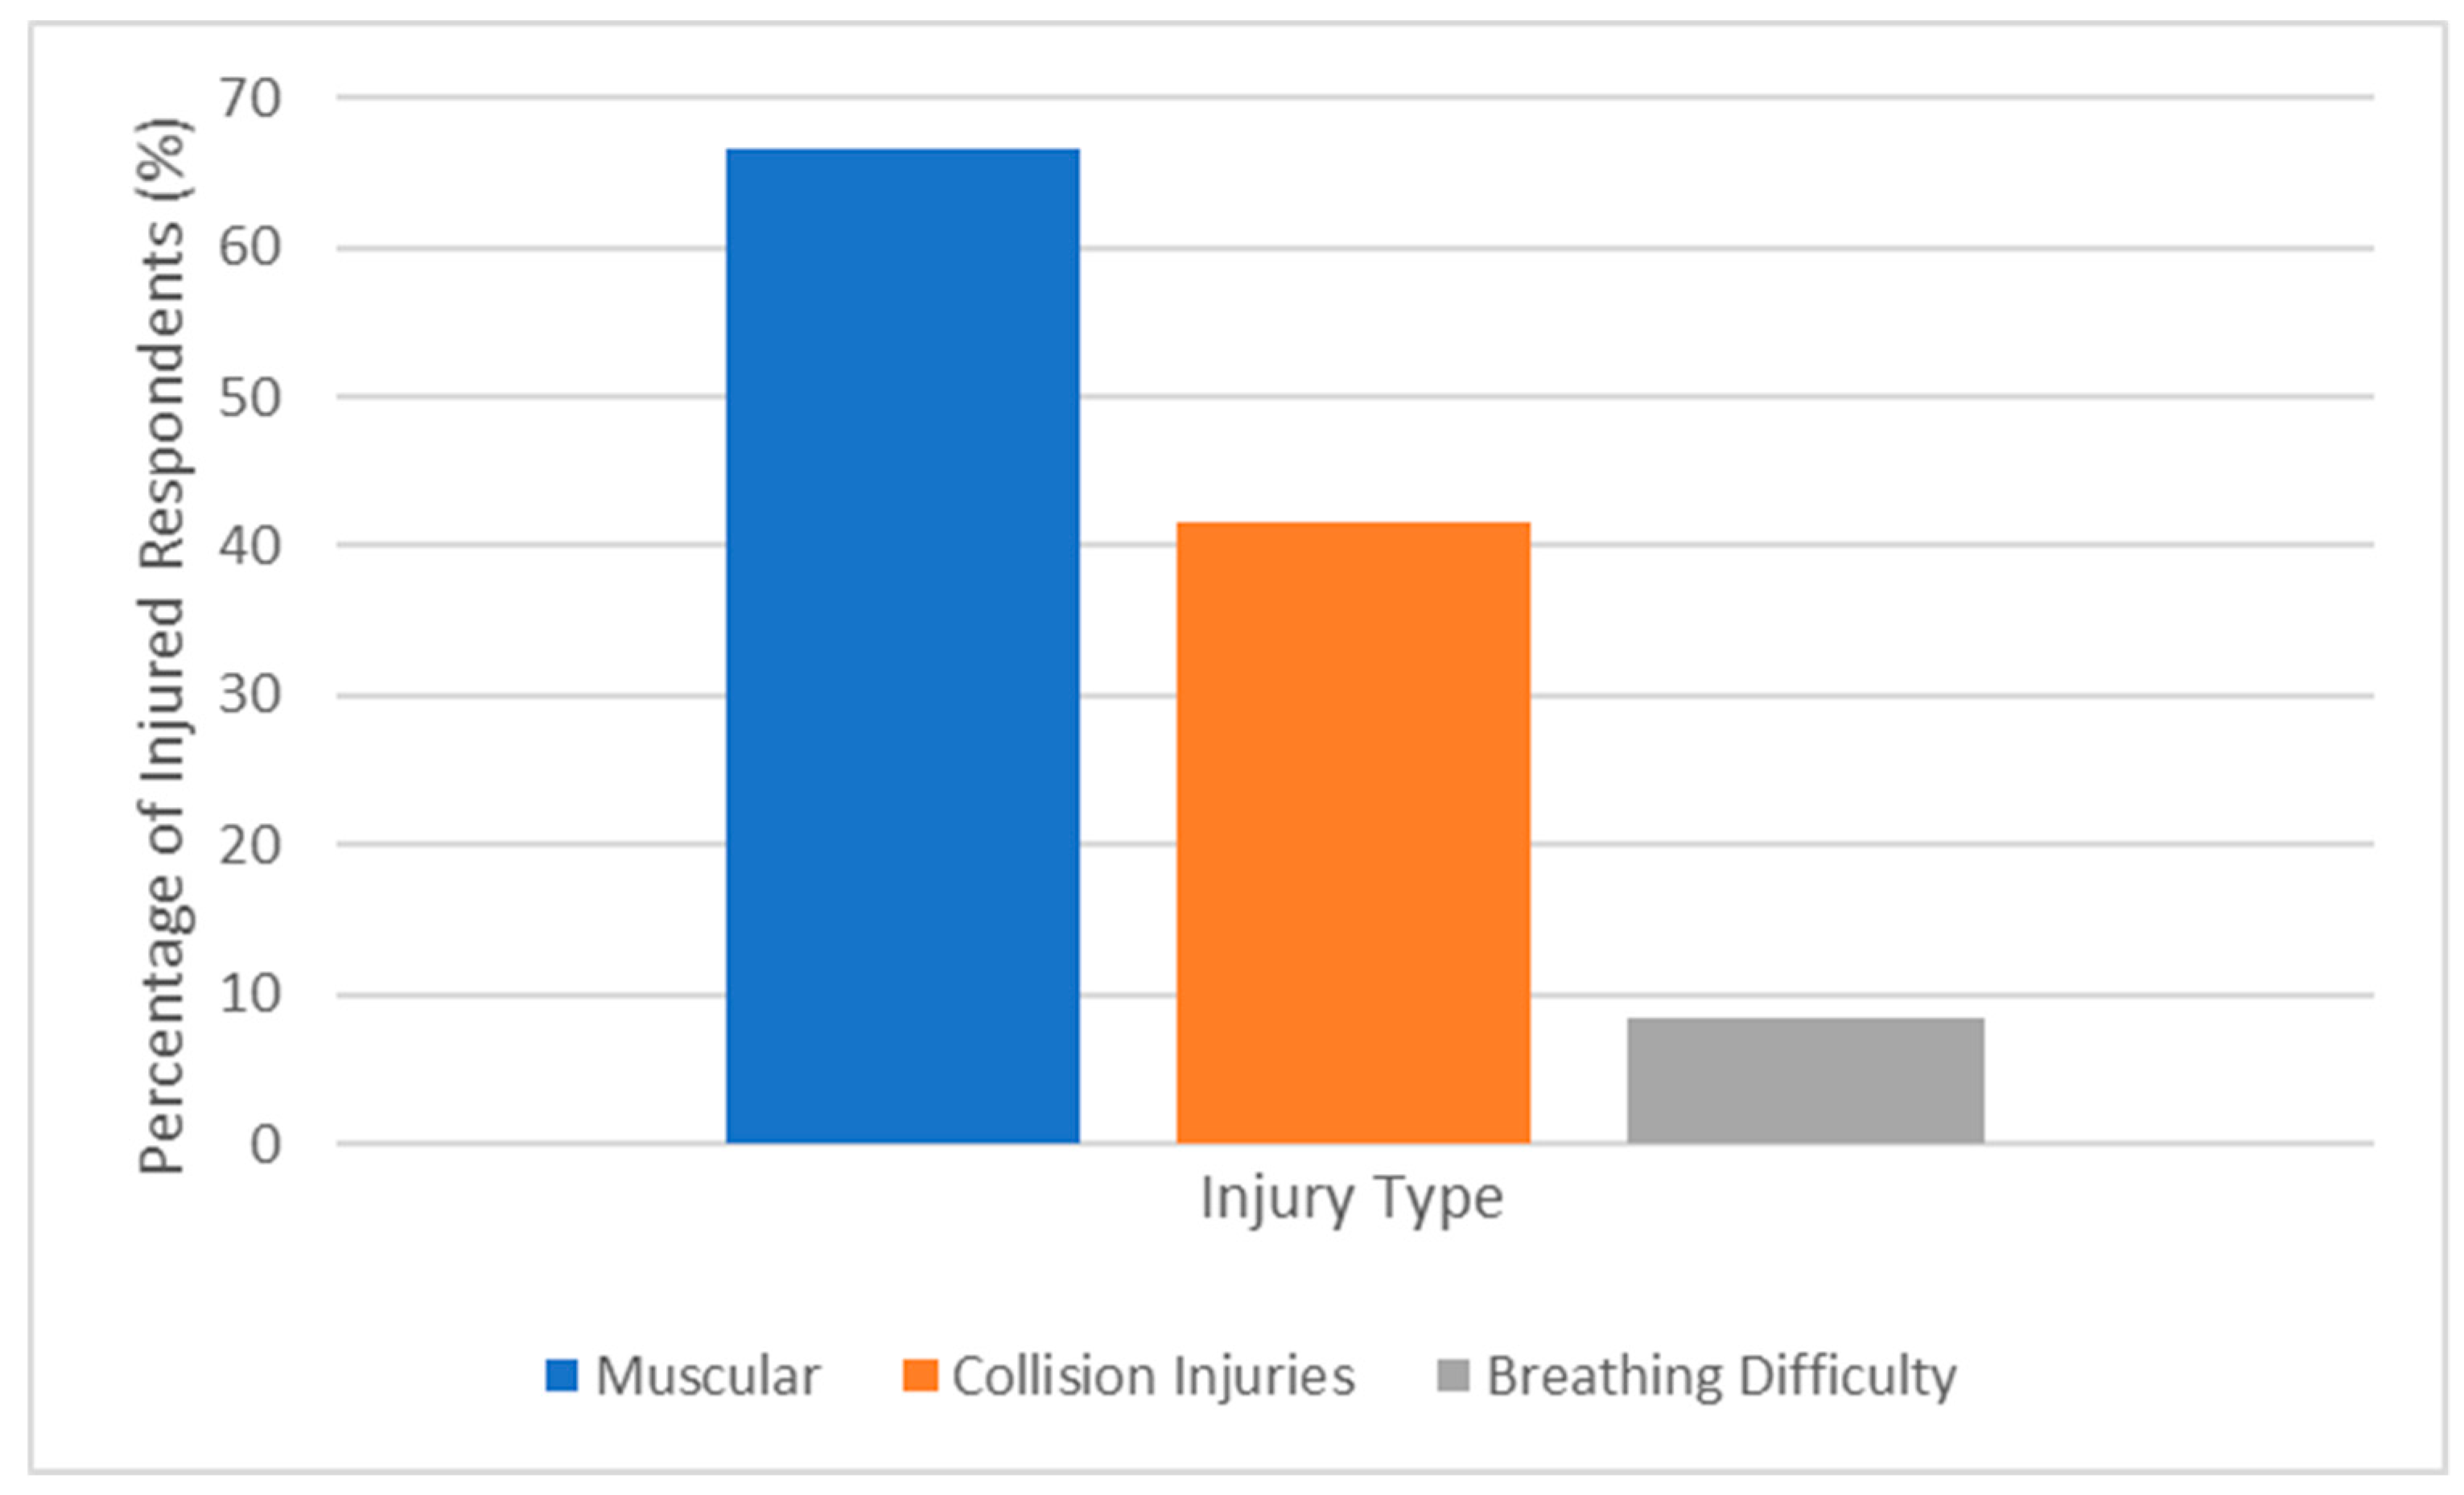
In total, 48% of the drivers reported injury and illness due to their occupation. These ranged from injury from collisions to breathing troubles believed to be linked to the pollution they are breathing in on a daily basis. Of the 48% of drivers reporting injury and illness, two-thirds complained of muscle soreness and aches and pains, typically in the legs and lower back. Further, 42% complained of injuries that occurred from collisions with other vehicles; one driver complained of chest pain and breathing problems (see Figure 2).
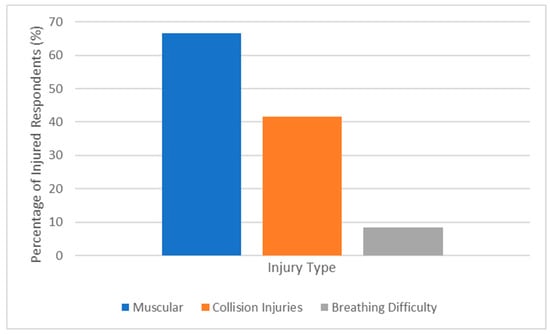
Figure 2.
Driver injury types—percentage of injured respondents.
2.1.5. Driver Opinion
The drivers were asked what they would change about their rickshaw if they could. It was found that 64% wanted the implementation of an electric motor to help them power the vehicle, and when asked if an electric motor would improve their rickshaw and overall occupation, the consensus was unanimous in favour of the implementation of the electric motor. Other improvements wanted by the drivers included better shade from the weather, improved gearing, and better seating.
2.2. Passenger Interviews
2.2.1. Passenger Profile
Firstly, it was important to identify the types of rickshaw users to recognize usage patterns. In total, 60% of people asked used the service daily. It was found that the typical journey was approximately 1.5 km and lasted a duration of 11 minutes. This correlated closely with the information taken from the drivers in Section 2.1.2.
2.2.2. Passenger Opinion
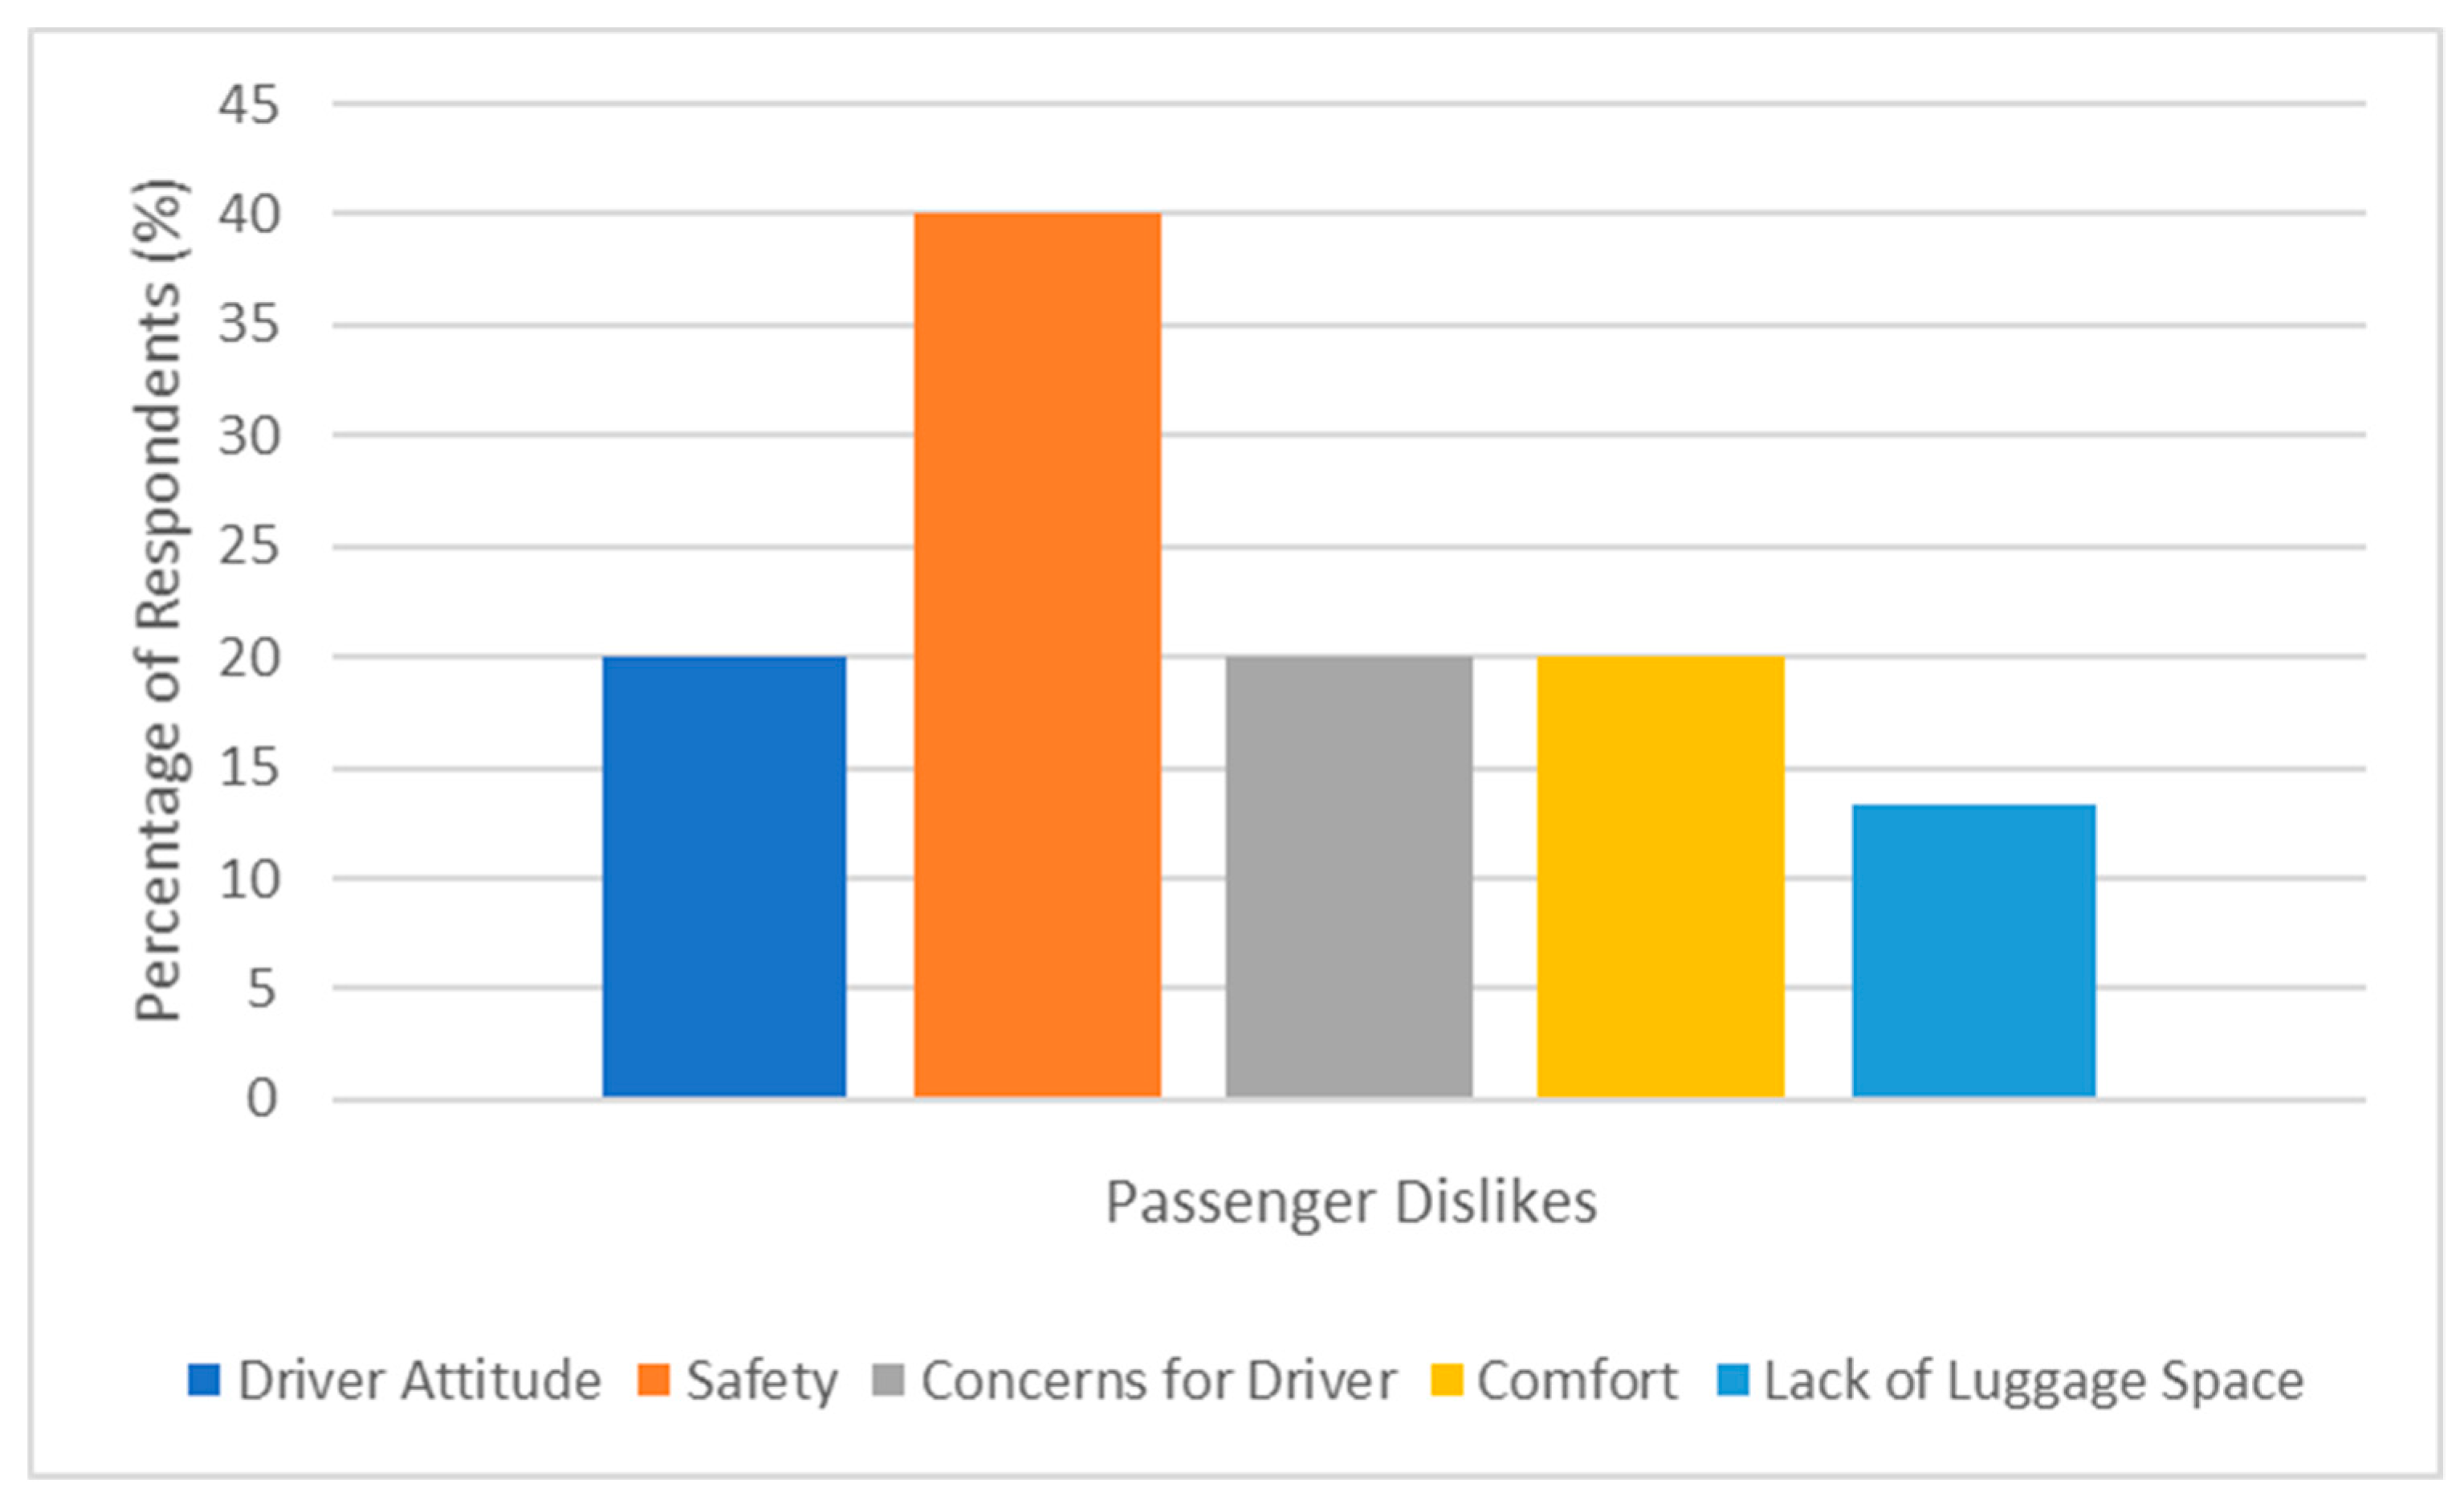
Two-thirds said they like the convenience and availability of the rickshaw, while 20% liked the heritage and tradition associated with the rickshaw, and 13% preferred the service over walking. Negatively, 40% raised safety concerns from design to vehicle condition. Poor comfort was a reason of dislike for 20% of the people asked, while 20% found the service was too hard on the drivers, and they, in turn, felt ashamed while using the service. The attitude and behaviour of drivers was a concern for 20% or the interviewees, while a lack of luggage space was a problem for 13% (see Figure 3). When asked about their overall satisfaction of the service, it was averaged to be 7.3/10.
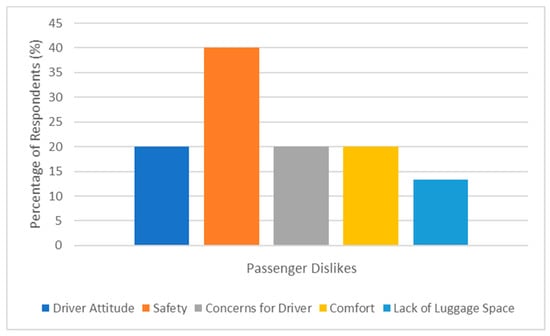
Figure 3.
Passenger dislikes.
Although the level of satisfaction could be deemed as relatively high, the question of what improvements passengers would like to see implemented into the current rickshaw design was put forward. It was found that 60% of people desired better comfort in terms of seating and shade, while 47% thought better standards of safety, namely seat belts, would make an improvement. Further, 20% thought the idea of making rickshaws motorised would increase their satisfaction of the service, and 13% required more luggage space.
The question was put whether access to a USB charging point would be useful in their journeys and would they be willing to pay more for it: 53% claimed it would be a good idea while the rest suggested it would be futile due to too short a journey duration. Of the 53% that thought it would be beneficial, 75% would be willing to pay more for the service.
When asked if they would pay more for the use of an E-rickshaw over the conventional cycle rickshaw, 80% said they would although 25% of them said only if there was an improvement in service.
Combining the data collected from both sets of interviews, the needs and wants of the rickshaw community can be assessed and considered for design. Without this new first-hand data, the design would have solely relied upon and related to older and less focused data.
2.3. Summary of Data
In summary, it was found that the drivers work long hours, almost every day, for an exceptionally low wage, and they are seeking design improvements to lessen the physical burden to help in the prevention of injury. The passengers, although generally satisfied with the service provided, are typically seeking design improvements to alleviate safety concerns, increase comfort and protection from the weather, and to become more practical in terms of luggage space.
3. Performance Testing of the Rickshaw
An important aspect of the research conducted in Kolkata was the testing of current rickshaws by collecting performance and topography data from journeys onboard a standard cycle rickshaw.
In terms of performance, it was important to identify the current typical standard of a rickshaw, mainly maximum speed and average speed, in order to produce a vehicle capable of at least matching these parameters. It is not necessarily important to better these figures as the vehicles are typically found in crowded areas with many pedestrians and other vehicles. Therefore, the lack of space and concerns about safety do not allow the vehicle to be driven at high speed. Methodology of testing can be found in Appendix B.
3.1. Speed Testing Results
The highest maximum speed recorded was 13.54 km/h while the highest average speed was 7.77 km/h. Testing was carried out in different locations, at different times of day, with different drivers, to allow varied parameters, giving the scope to produce the most diverse data, and therefore a higher likelihood of finding the typical performance standards of the current vehicle. It is important that the design is capable of meeting the needs of every journey. Therefore, a figure of 15 km/h maximum speed and an average speed 8.5 km/h will be assumed. This provides a margin of error in the case that the results were not exactly representative of typical journeys.
3.2. Topography Testing Results
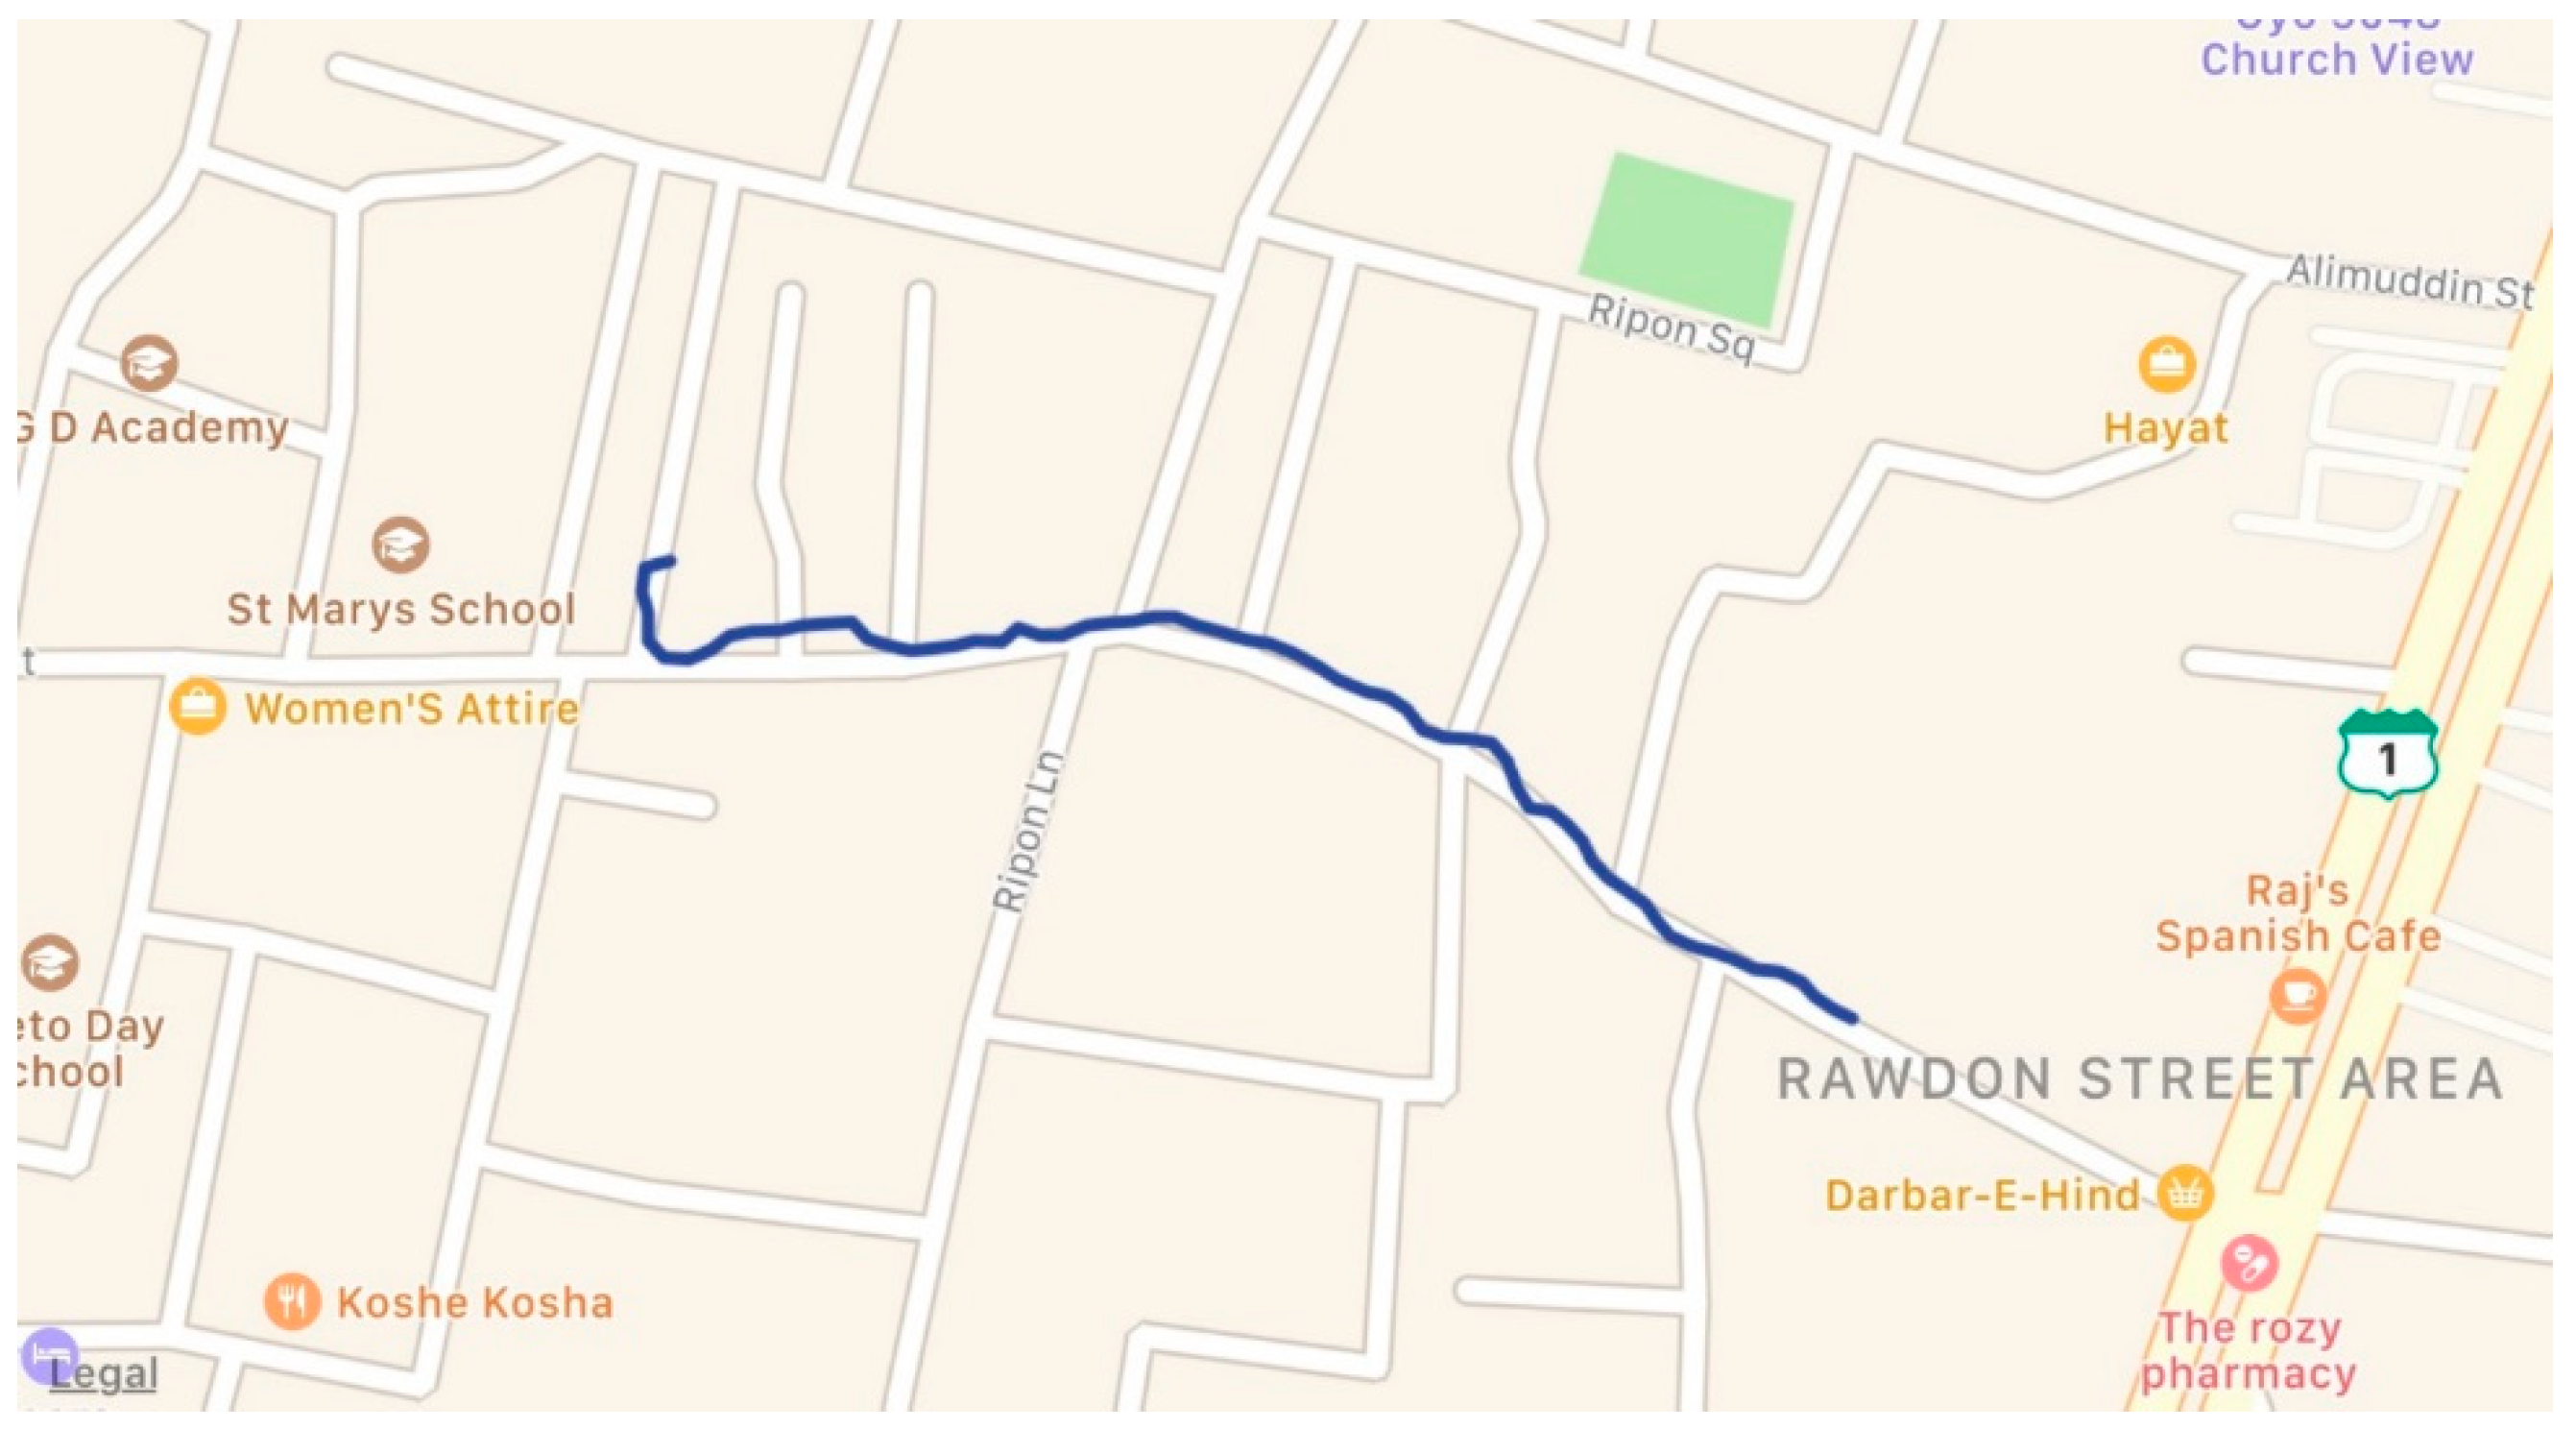
The maximum gradient was found to be 2.06%. This was in the Rawdon Street Area, the journey mapped out as shown in Figure 4. Identifying the top speed and average speed allows the research to get an overview of the basic performance parameters that the vehicle must at least equal.
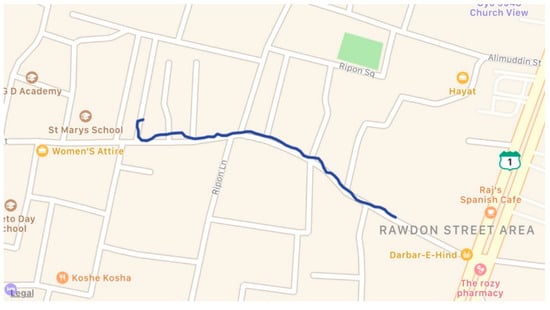
Figure 4.
Journey in Rawdon Street.
3.3. Energy Usage
Further to the data collected, two full journeys were mapped in terms of speed throughout; this allowed the calculation of energy used, from which the typical km per Ah and full expected range could be calculated, using a simulation software produced in Microsoft Excel by Professor T Muneer, of Edinburgh Napier University [8]. It should be noted the term SCx in Table 1 is representative of drag area, the product of frontal area, and drag coefficient.

Table 1.
Simulation data.
3.4. Results
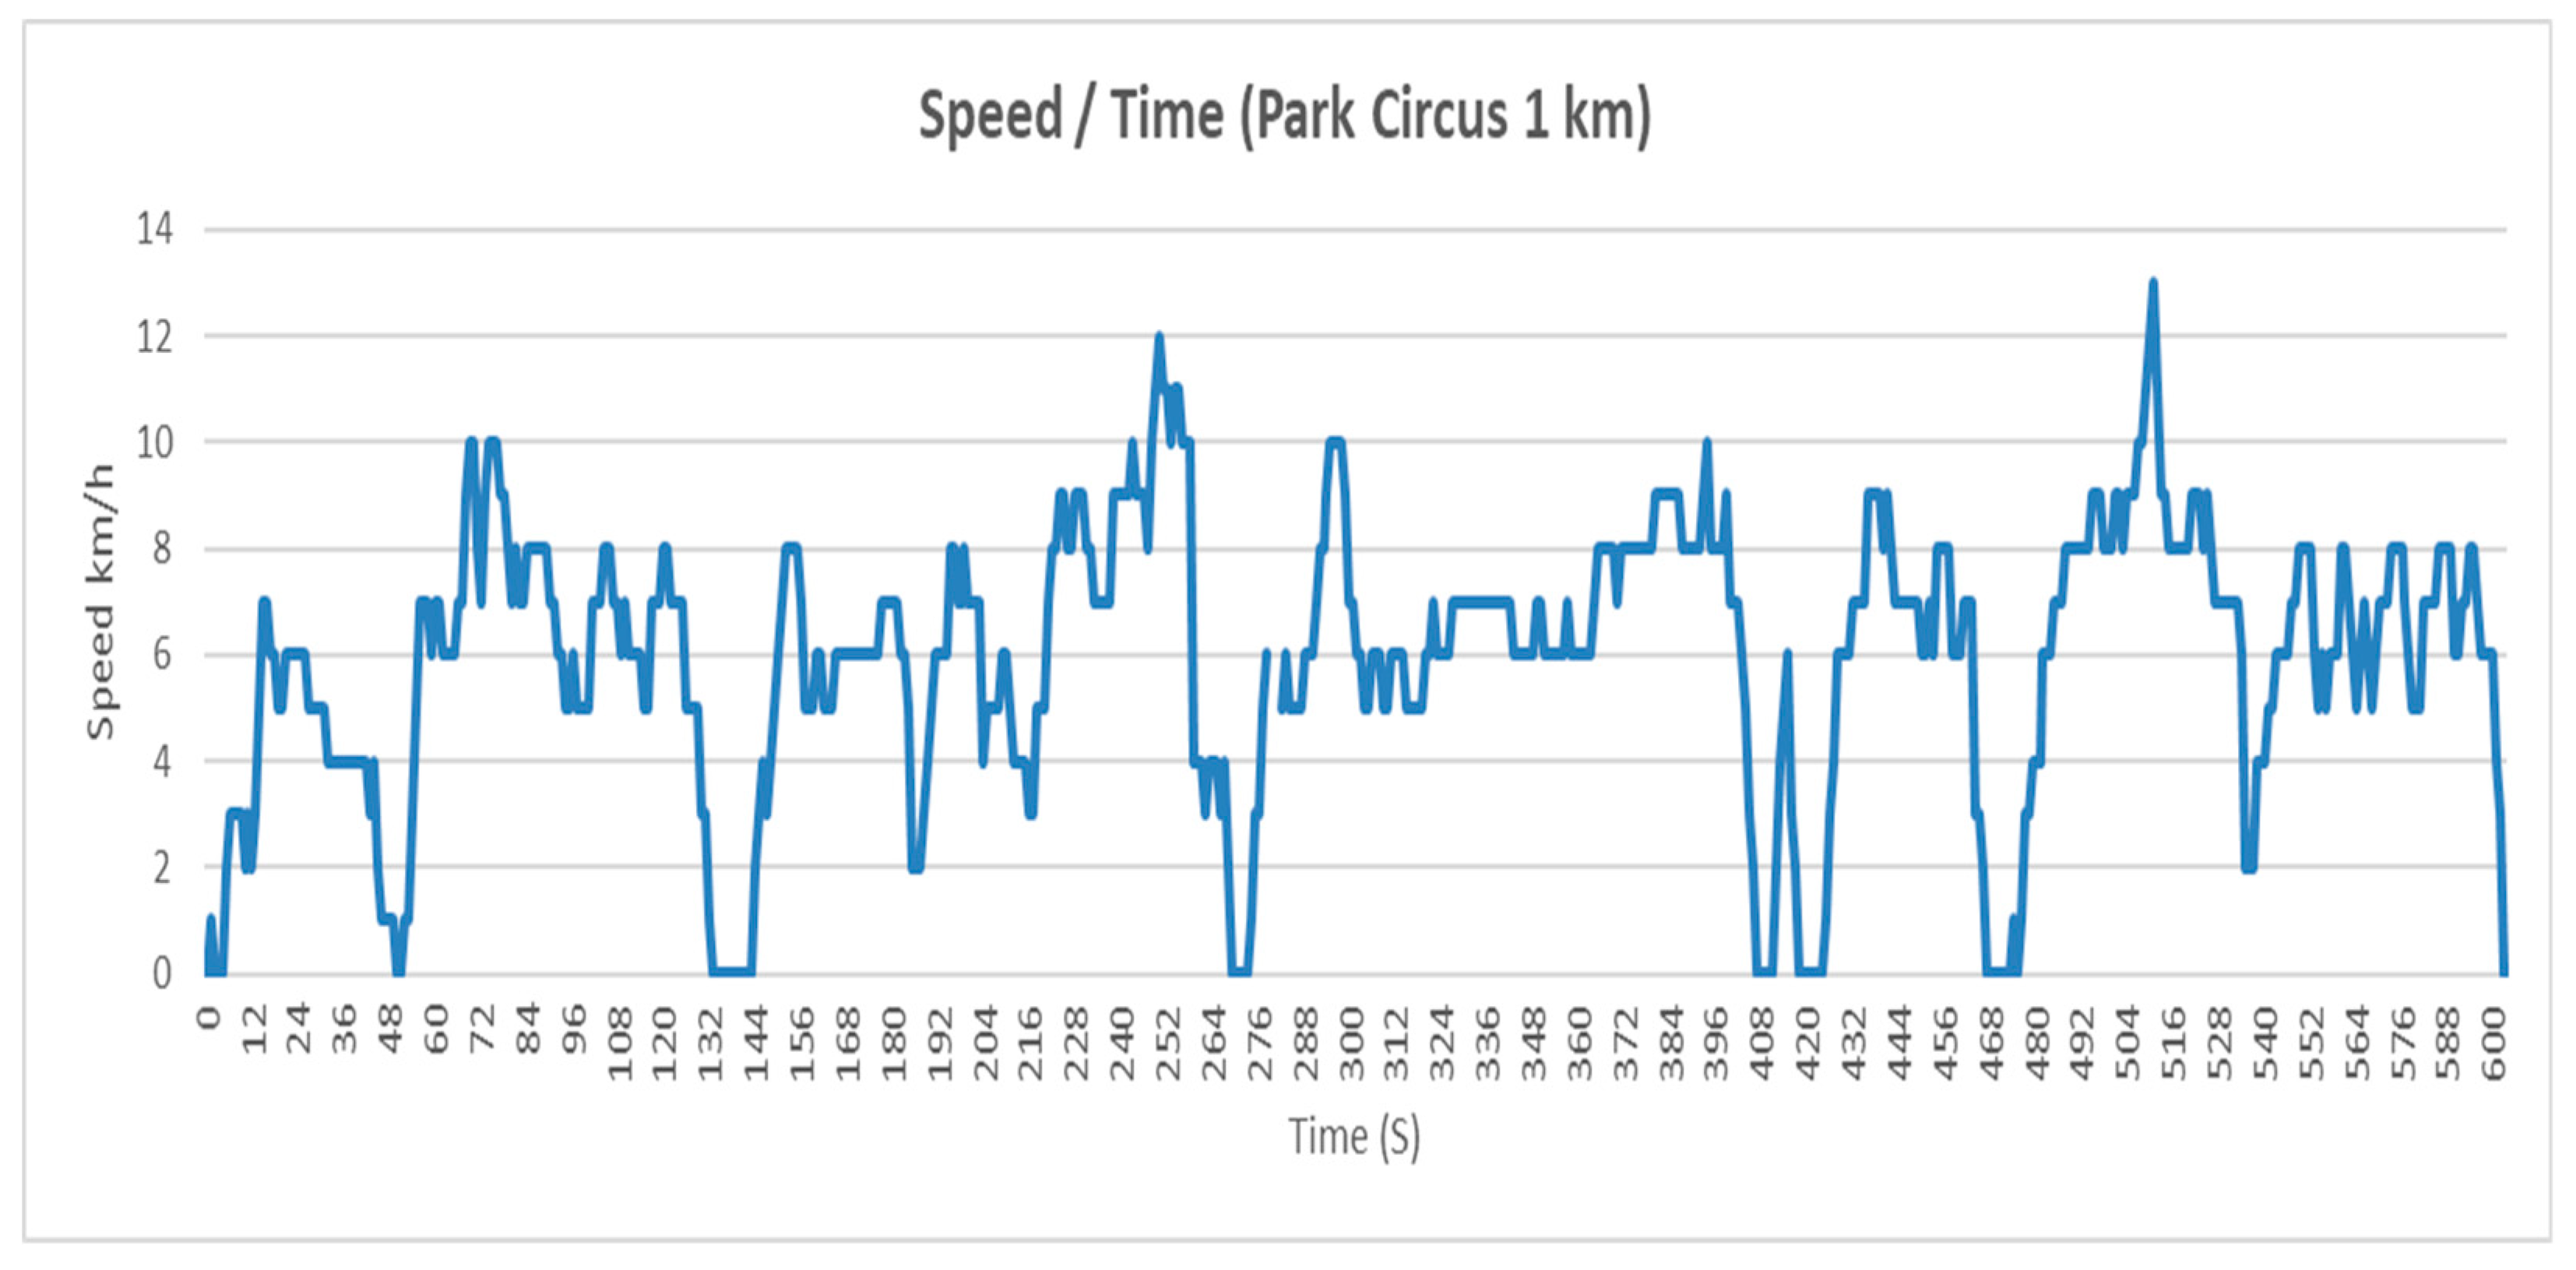
Figure 5 shows the speed/time graph for area 1—Park Circus, from which it can be seen the top speed was 13 km/h. The simulator calculated that the energy used based on the conditions set in Table 1 and Table 2, as 0.052 kWh. Knowing the kWh used in the 1 km journey, an estimation of the full 42 km expected range can be calculated as 2.142 kWh. The average wattage can be calculated as 304.5 W.
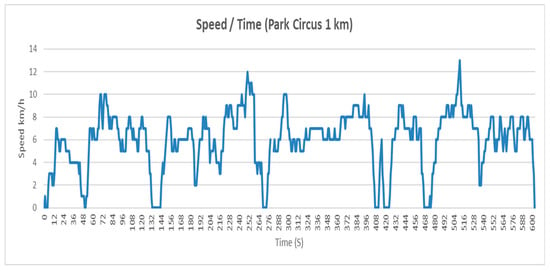
Figure 5.
Park Circus speed/time graph.

Table 2.
Simulation situation inputs.
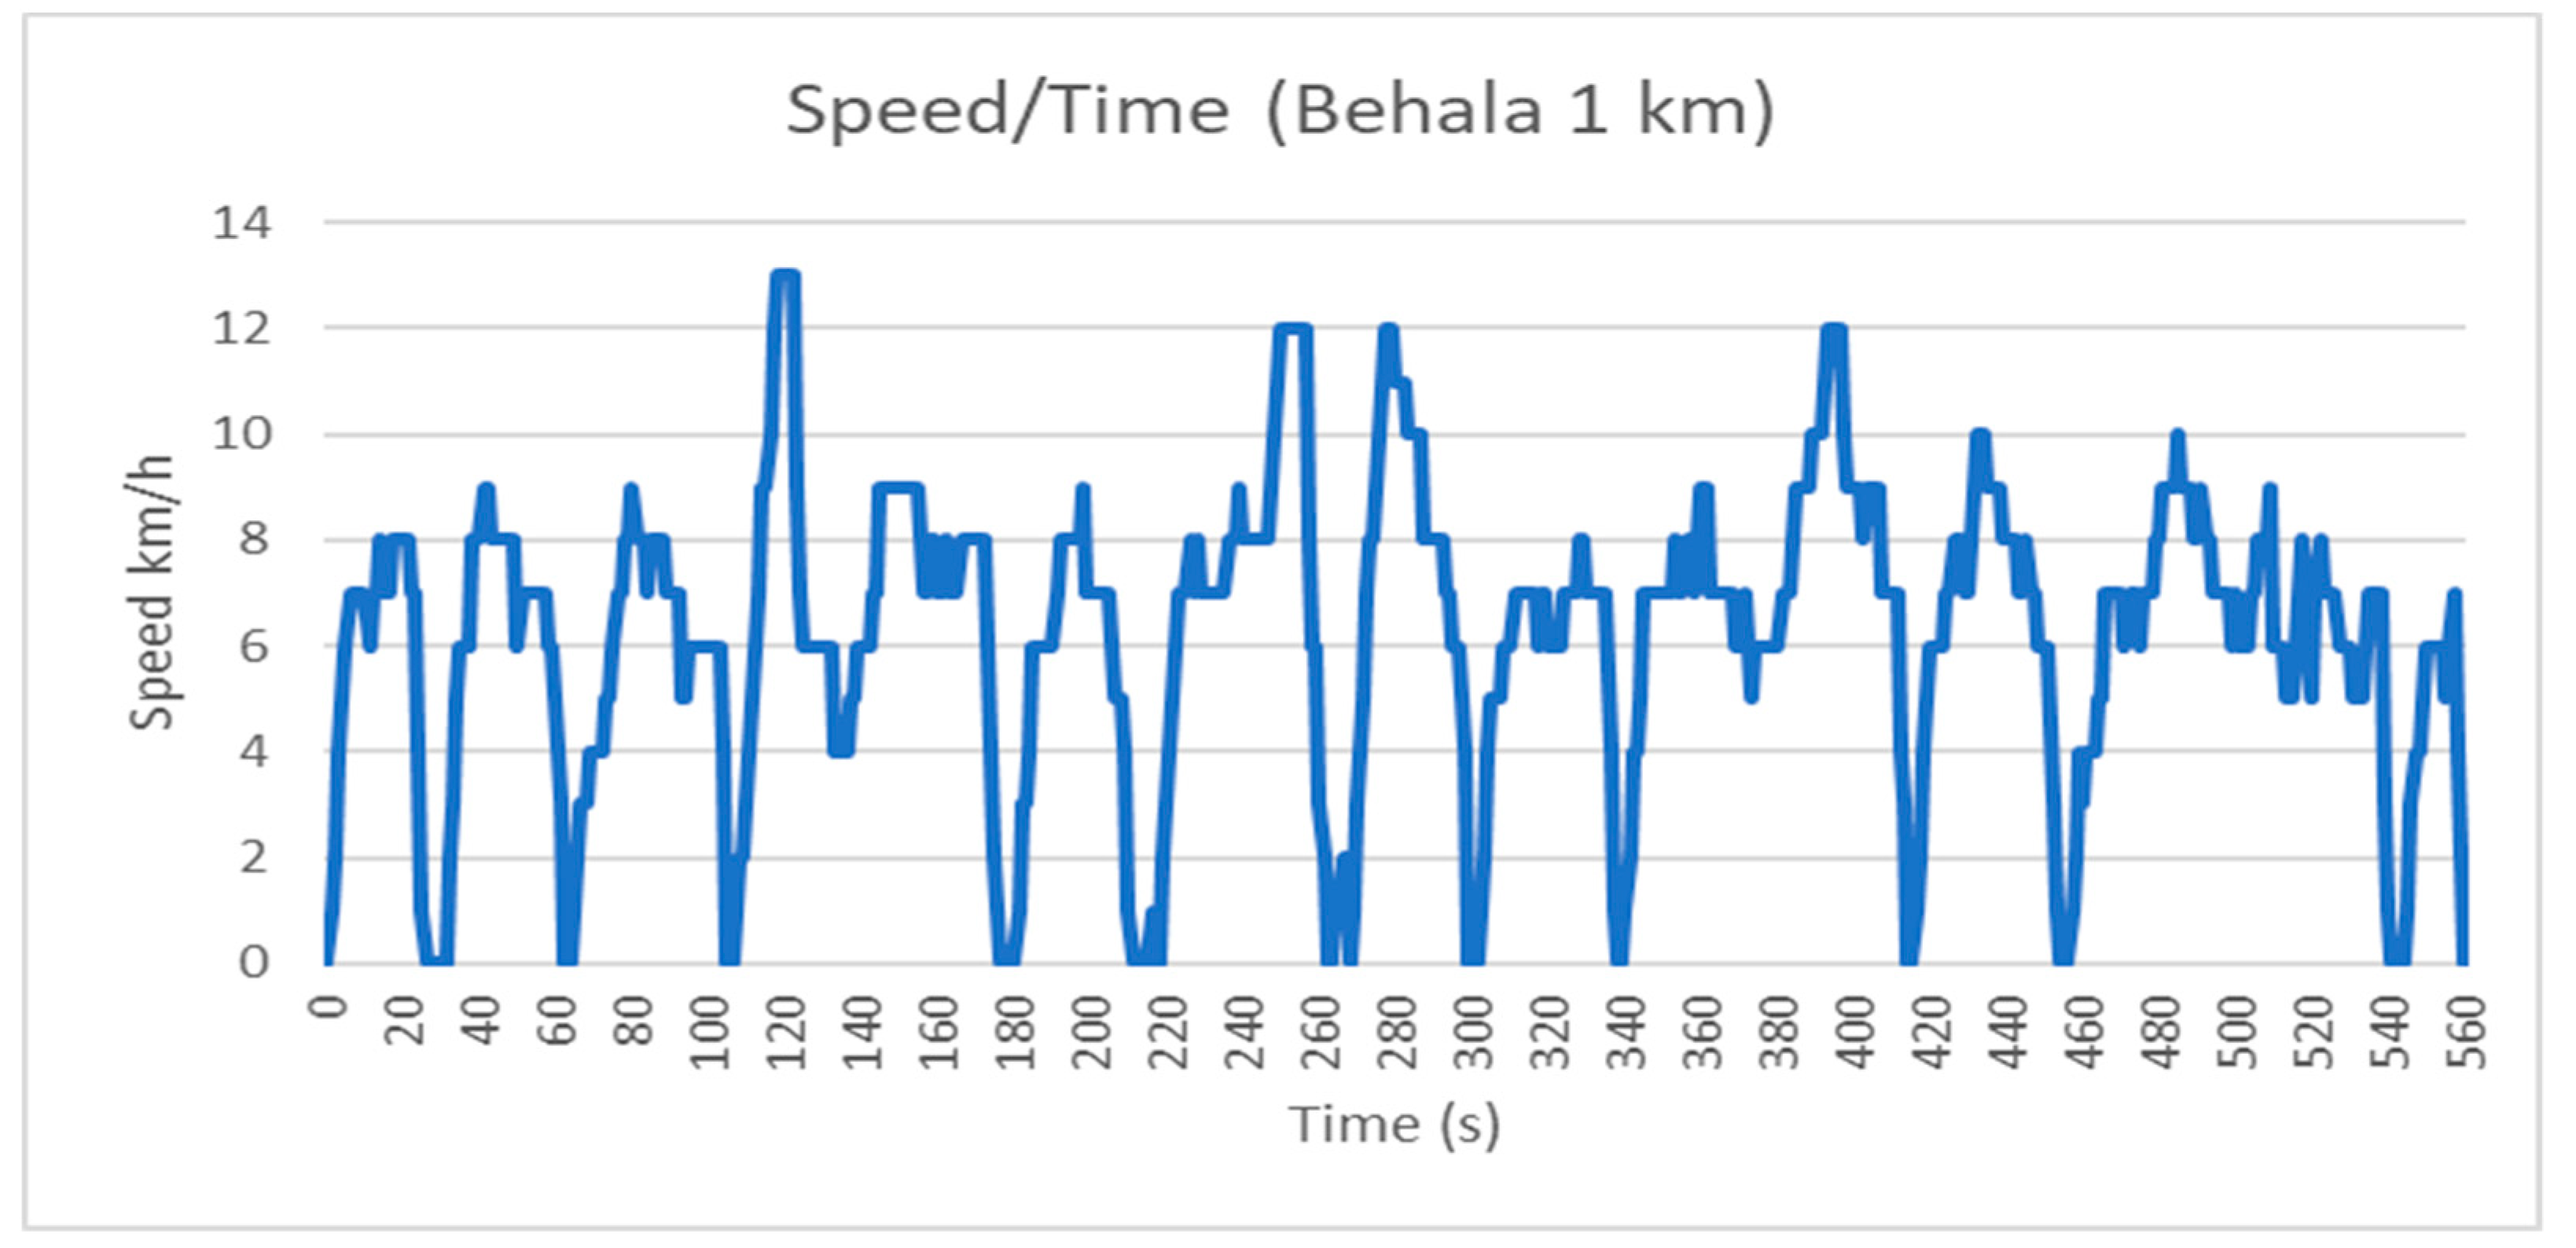
Figure 6 shows the speed/time graph for area 2—Behala, in which the same testing is shown. The results of the testing showed the top speed was 13 km/h. The energy used was 0.06 kWh; therefore, for the 42 km range, a total of 2.52 kWh, with an average wattage of 385.7 W.
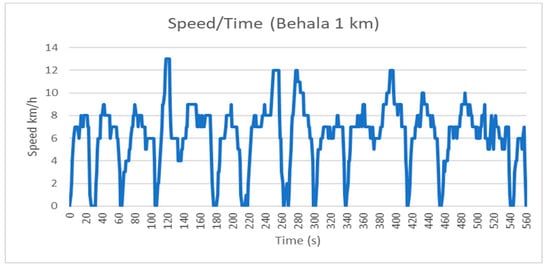
Figure 6.
Behala speed/time graph.
4. Design Brief
To implement an electric motor onto the current cycle rickshaw design and improve upon current design in terms of safety and performance, the design must be environmentally friendly, built using the drivers’ current rickshaw as a base, and sourcing recycled parts where practical. It must meet the daily demands of the rickshaws drivers and reduce the risk of injury by reducing the physical efforts needed to operate it. It must meet the standards of what the customers require in a rickshaw. It must remain within the boundaries of the traditional design aesthetically. A detailed product design specification (PDS) can be found in Appendix C.
5. Design
5.1. Solar
As the vehicle is powered though the use of batteries, they must be charged; since the vehicle is to remain environmentally friendly, the charge must be supplied by a renewable energy source. The source identified as a potential is solar power.
5.1.1. Solar Availability
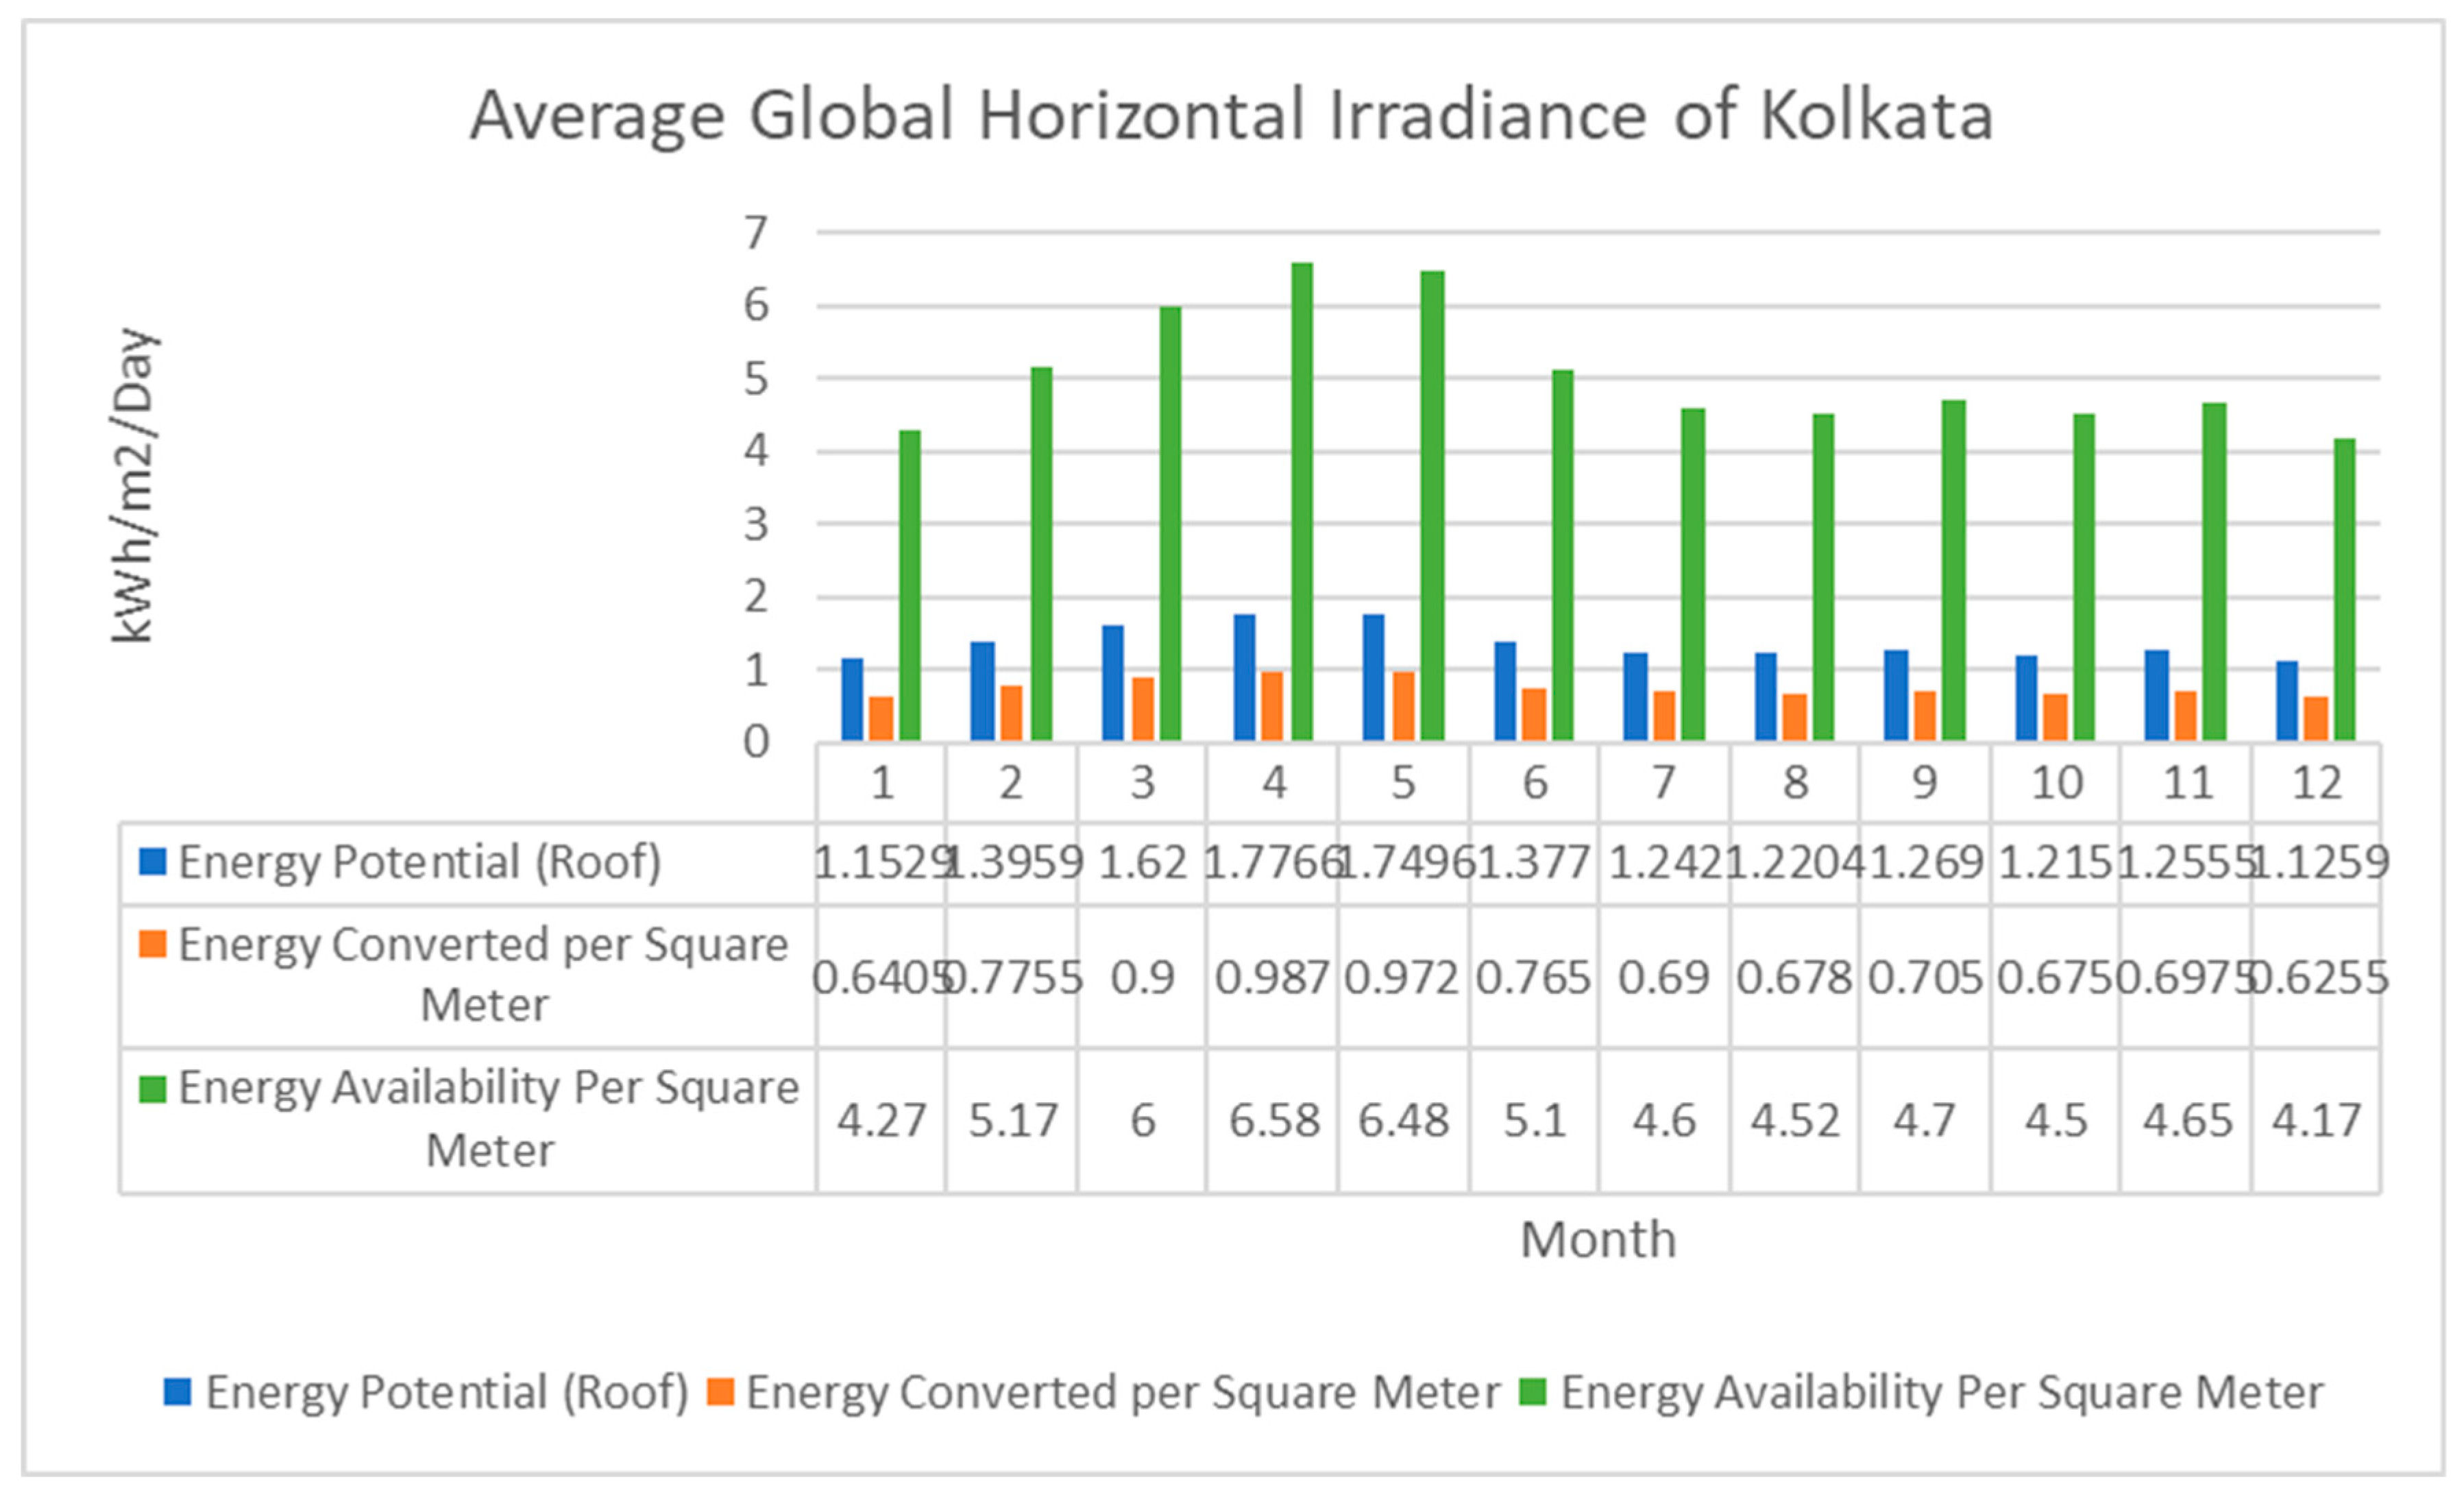
The average global horizontal irradiance of Kolkata is as shown in Figure 7, giving the researcher an indication of the highest and lowest expected solar availability by month. This allows calculation to be carried out to predict if the on-board solar panel will fully charge the vehicle each day [9].
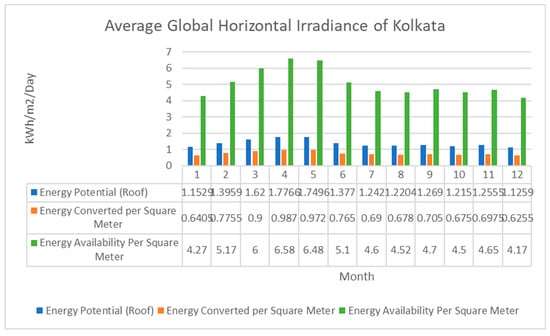
Figure 7.
Average global horizontal irradiance of Kolkata.
5.1.2. Solar Farm
An option would to be have a solar farm outside of the of the built-up area. This would be of large scale and would be capable of supplying the whole community of E-rickshaw drivers with fully recharged batteries every day. The drivers would exchange their flat batteries with the fully charged batteries. This would enable them to power their rickshaw each day. In order to facilitate this, it would have to be fully funded by government or a private company in return for a fee from the drivers. To seek this option, funding must be acquired, but it remains the only feasible method of recharging using solar power as outlined.
5.2. Funding
Other possible ways of funding this could include sponsorship where companies could bid to sponsor a number of rickshaws. In return, the company would be able to place their advertisement on each rickshaw. This could either help fund the solar farm or could help fund cost to the drivers in terms of replacement battery fees. Although speculative, this would be a possible revenue stream that should be explored.
5.3. Electrical Components
5.3.1. Drive Systems
When implementing an electric drive onto a bicycle there are two options, either fully electric powered or pedal assisted.
Fully electric powered (FE) with all power coming from the motor: This method requires no physical human effort, except speed control, using a throttle.
Pedal-assisted power (PA) is where the motor and driver both work together and share the burden of the work.
Each drive system has its advantages and disadvantages when compared to each other. Fully electric powered is the least demanding upon the driver but has a significantly reduced range, as it takes the full load at all times; therefore, to compensate this, an additional battery capacity would be needed at an increased cost. Pedal assist gives the driver electric drive assistance, lowering the physical demand without completely removing it; this keeps an aspect of exercise, therefore retaining associated health benefits.
As seen in Table 3, a drive selection matrix shows the design matrix comparison between each drive type, and through analysis, a pedal-assisted drive system will be used for the design, as it scores higher in the key parameters.

Table 3.
Drive selection matrix.
5.3.2. Assist Sensor
A sensor must be fitted in order to provide the required input of assist from the motor; there are different options to what type of sensor can be used. Most commonly, on pedal-assisted e-bikes, there are two options, a cadence sensor or a torque sensor. Each sensor type has its own merits and limitations; therefore, each must be assessed to find the most suitable component for the rickshaw application [10].
The implementation of a cadence sensor will allow the controller to detect the Revolutions Per Minute (RPM) of the pedal crank, thereby being able to send a signal to the motor to turn on. Assistance levels can be modified through the use of a digital display control computer. This allows the driver to choose a setting to match the requirements of the road condition, or for battery conservation. Cadence sensors require the driver to have pedalled approximately one-half rotation of the crank before the motor is able to detect the human input; therefore, the power is slightly delayed. Cadence sensors are inexpensive, easily installed, and require little maintenance.
5.3.3. Control Unit
A control unit is needed to manage each electrical component; the unit will receive signals from any activated sensor and it will then send the required output signal to whatever component is related to the activated sensor. The control unit will control the speed of the motor, based on the cadence sensor, by restricting/enabling the power provided by the batteries; it will also provide power to any lighting when the drive engages the button or switch to turn them on.
5.3.4. Motor
As the results of testing in Section 3.3 showed a highest average of 385.7 W, the motor must be capable of achieving this output. The results were of average wattage; therefore, a larger motor will be needed to meet the peak power demands. The testing was not sufficient to accurately identify peak power as energy expelled, though acceleration up gradient could not be calculated accurately as the increments of gradient were too large; therefore, an estimated simulation was carried out to show a reasonable indication of the peak power.
A simulation was executed where it was assumed the driver was accelerating up a slope of 2.06% as per the maximum discovered in testing, assuming they would reach a top speed of 13 km/h in 10 s, though testing this was never achieved, thus being an exaggerated scenario. This will give an overestimation of peak power; therefore, the wattage should be an acceptable measure for a motor that can replicate all human power.
The result of the simulation showed a wattage of 468 W; therefore, a 500 W 24 V DC motor is an acceptable choice for the design.
5.3.5. Battery
Arguably, the battery is the most important component of an electric vehicle, it has a huge bearing on the range capabilities. There are many considerations that must be satisfied when choosing a battery option such as, cost, ampere hours, voltage, depth of discharge, cycle life, physical size, and weight.
From testing in Section 3.3 it was discovered that the motor will require a total of between 2.142 kWh and 2.52 kWh. Taking the higher usage, the Ah capacity can be calculated as 105 Ah.
As stated in the PDS (see Appendix C), the main considerations in the design of the e-rickshaw are cost and range; therefore, the chosen battery must reflect that. Firstly, as cost is the major limitation in this design, the cost of a lithium battery system suitable for the design could cost as much as £1500, based on typical retail prices (March 2019). This consequently rules out the possibility of using lithium batteries in the design.
A suitable lead acid battery system would cost around £200 based on typical retail prices (March 2019), which consumes the majority of the budget; therefore, the sourcing of inexpensive refurbished or second-hand units may be the most viable option.
Due to the depth of discharge in lead acid batteries being around 50%, achieving a life cycle of 1000 cycles [11], a system of 4110 Ah units will be installed in a circuit of 2 parallel branches; this will provide the motor with the 24 V needed and a capacity of 210 Ah, assuming a depth of discharge (DOD) of 50% a usable capacity of 110 Ah, which exceeds the targeted range.
5.4. Mechanical Components
5.4.1. Gearing
Commonly in India, the rickshaws are fitted with a singular gear and therefore unable to change torque for different gradients and speeds; this is largely due to cost reduction, lower maintenance, and for simplicity of design. This fits with the PDS brief and therefore should be continued. The pedal sprocket transfers the human power onto the rear shaft via a link chain and a gear attached to the shaft, and the power can be stepped up or stepped down by a multitude of gear sizes. Typically, on a rickshaw the ratio is 1:0.56 and the pedal sprocket of 48 teeth is stepped down to a 27 tooth on the rear shaft [12]; therefore, for every one full pedal cycle, the rear shaft rotates 1.778 times; the rickshaw, neglecting any losses in grips at the wheels, should move 1.778 times the circumference of the rear wheels.
With this ratio, a pedal sprocket cadence of 90 RPM would propel the rickshaw at a speed of 20 km/h, and this is acceptable for the final design; although, this ratio does not suit acceleration, and therefore must be replaced with a ratio that reduces the physical efforts of the driver. A ratio of 1:1 will provide the driver with increased torque allowing the easier rotation of the pedals and will drive at a speed of 11 km/h at a cadence of 90 RPM. It is important to keep the gearing ratio to a reasonably achievable speed; if an electric component fails, then the driver may still be able to cycle manually and either complete his shift or take the rickshaw to a repair centre.
The gearing of the motor will be set to provide the vehicle with a top speed of 15 km/h; since the rated RPM of the motor is 2500, the gearing must step the RPM down to 192, using a gear ratio 1:13 this. In theory, can be achieved.
5.4.2. Free Wheels
The gears on the shaft must be able to work independently of each other; this is done by installing freewheel sprockets. A freewheel sprocket is a type of overrunning clutch, which allows the shaft to turn faster than the gear, meaning the pedals can be stationary while the shaft rotates. If the gears were fixed, the pedals would consequently be powered by the motor, causing a high risk of injury to the driver. Installing a freewheel on each gear will also allow the driver to pedal faster than the motor, in case of low power input or electrical failure.
5.4.3. Wheel Size and Tyre Width
The coefficient of rolling resistance can be reduced by the wheel and tyre choice; as a general rule, the larger the wheel diameter and wider the tyre thickness, the lower the coefficient of rolling resistance will be [13]. In the case of the design, the donor rickshaw wheels will be analysed for dimensions as a slight increase in the coefficient of rolling resistance can increase the energy used considerably. The condition will also be analysed as warped or damaged wheels will also contribute to wasted energy. A comparison of a coefficient of rolling resistances 0.015 and 0.012 for the area of Park Circus was drawn, with total of 42 km (the expected daily range). It was calculated that with a coefficient of rolling resistance of 0.014, it uses 0.004 kWh/km more, 0.168 kWh over 42 km, thus the battery capacity will be depleted by an extra 7 Ah; therefore, it is crucial to have the most efficient wheel and tyre choice available.
5.5. Safety
As highlighted by the research conducted in Kolkata, there were many safety concerns raised by both the drivers and passengers alike. Concerns such as potential injury for impact with other vehicles, uncomfortable seating causing soreness and bruising, and insecure seating allowing the passenger to move around in the seat unwillingly, potentially causing harm. It was also said that the rickshaws can be awkward to embark due to no handle to grip, causing the potential of falling or slipping. Safety concerns need to be addressed.
5.5.1. Seating
Firstly, in relation to the insecure seating, many passengers suggested seat belts; this would be a simple application for a conventional vehicle. However, the rickshaw is used quite differently. In a standard car, the seating is individual and is provided with supplementary seat belts, but this is not the case for the typical rickshaw that incorporates a bench-style seat. This proves to create more complication in design as the seating is designed for one or two people, but in reality, it has to function for multiple purposes, as occasionally drivers will take more than two if there are small children.
This led to the idea of modifying an automotive style seat belt to be capable of adjusting to 1 or 2 or more people. The seat belt will be able to be plugged into two different locations, allowing the adaption to fit one or more passengers. It will also be adjusted as per standard automotive seat belts to securely and comfortably restrict movement of the passenger. The seat belts could be sourced from automotive dismantlers to ensure a lower cost than a new unit.
The seating as a unit can be improved simply by adding thicker or softer padding to the base back and sides. Many of the rickshaws tested, while in Kolkata, were fitted with insufficient or worn-out padding. This led to the ride comfort for the passengers being limited; this was stressed by 20% of the passengers interviewed and also commented on by drivers who were aware of the issue.
5.5.2. Handle
The addition of a handle can be easily incorporated into the curb-side of the frame; this is a simple and inexpensive, yet practical solution for the aid of embarking the rickshaw. The handle will be mild steel tubing bent to shape and welded directly onto the frame.
5.5.3. Collision Prevention
The concern of risk of injury during impact will already be significantly reduced for the passengers with the addition of more padding and a seat belt, but the risk to the drivers still remains. This is a concern that is exemplified by the total of 42% of the injuries reported amongst the drivers interviewed. In an ideal scenario, a protective shell would be constructed to protect the occupants from collisions. Unfortunately, due to financial restrictions, the fix may not be the cure but the prevention. Currently, the drivers signal their intent of direction with their arms; not only is this a danger as other vehicles passing could collide with the driver’s arm causing injury, it also prevents the driver being in full control of the rickshaw, by impeding their ability to steer correctly. The addition of indicators would allow the driver to keep both hands on the handlebars at all time while being able to alert the other road users of their intended direction of travel. The indicators will be comprised of a small cluster of LEDs; this will make their battery usage negligible.
Although this solution will not have any effect on injury prevention when there has been a collision, in theory it should lower the risk of a collision taking place.
In addition to the implementation of indicators, reflective strips will improve visibility of the presence of the rickshaw in low light, thus reducing the risk of collision further [14].
5.5.4. Shade Design
The climate of Kolkata is that of extreme high temperatures and heavy rainfall. Data from 1901–2000 shows that the average monthly rainfall for July can reach 339.8 mm [7]. Heat stress can cause many unwanted bodily reactions ranging from sweating to the failure of control mechanisms [15]; as this can become a serious threat to health, shading must provide protection from the heat.
The UV radiation over India is exceptionally high. The UV index can reach as high as 16. This is exceptionally hazardous to the health of anyone exposed to this for any prolonged length of time [7]. Ultraviolet radiation is damaging to the skin and over exposure can lead to skin cancers. This causes a major risk to rickshaw drivers as they work an average of 11.36 h per day. Currently, the driver has no shade and the design only caters for the passengers; therefore, a shade must be installed that caters for all occupants. The shade must improve defence against UV rays, form shelter from the heat and heavy rainfall, but it must not add excessive weight, cost, or drag.
Table 4 shows the design matrix of the range of materials explored.

Table 4.
Shade material selection matrix.
Tarpaulin will be used in the design as it provides the best performance in the key areas scoring better than aluminium, which although performs better in many areas, it simply costs too much to be used.
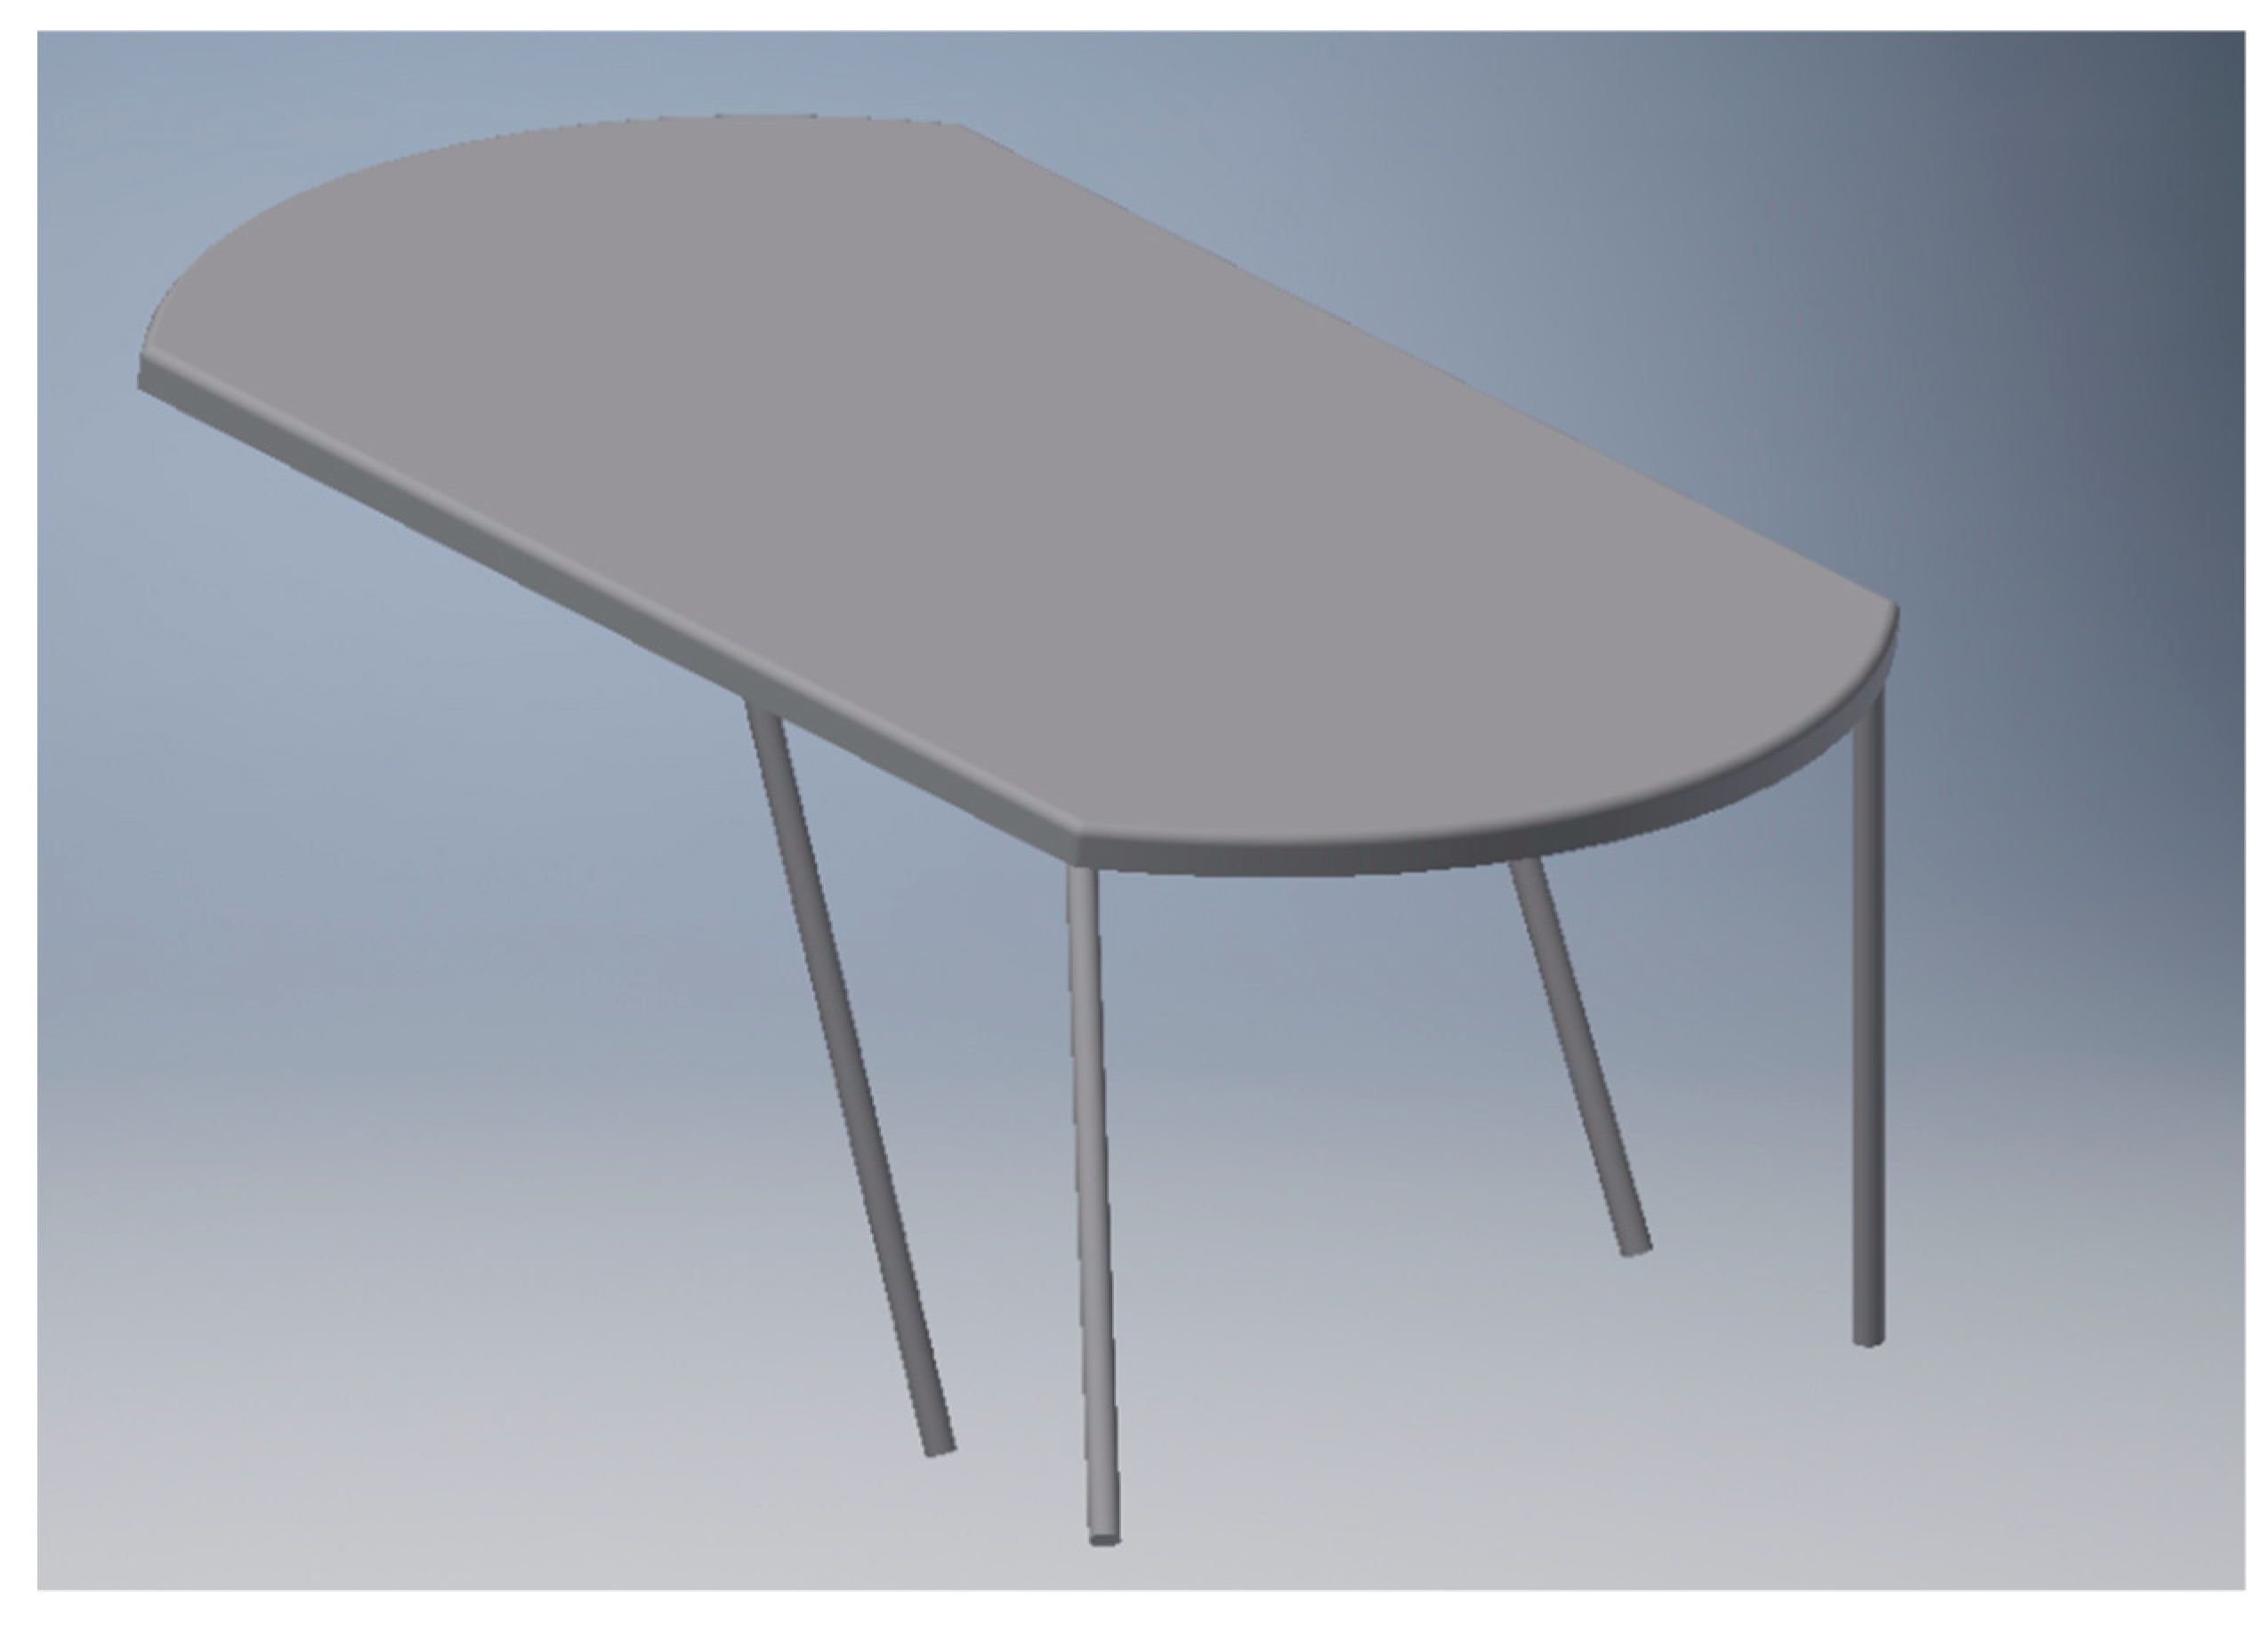
As each donor rickshaw will have different frame designs, a standard roof design will be fabricated to fit through the use of tubing; an example of an outcome of the shade is shown in Figure 8.
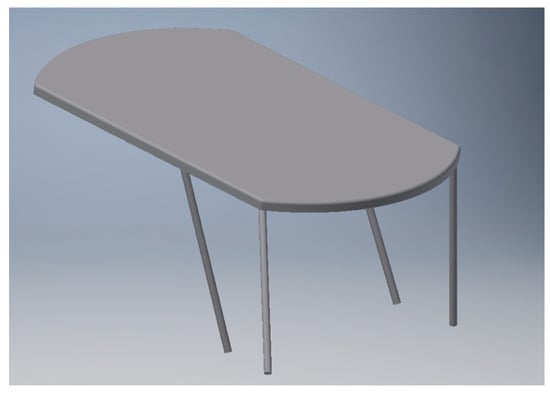
Figure 8.
Example of roof panel fabrication.
This would conform to all the parameters set as the fabric is very low cost and the shade fully covers all occupants protecting them from extreme weather conditions. The rear of the shade would feature a zip or series of fasteners to allow a side and rear section to be attached. This gives protection from rain whilst up, and reduces the drag whilst down, allowing the driver to choose and employ a setup quickly to cater for the needs of the conditions.
5.6. Servicing
5.6.1. Battery Compartment Design
As the batteries must be removed to be charged and replaced, it is vital that they are easily accessible; therefore, strategic location of the battery units must be considered. There is a large unused space under the passenger seating and this would be an ideal location to house the batteries as it can be easily closed off for safety and it is also located close to the motor and driven shaft, therefore the cabling will also be enclosed and will be shorter, consequently reducing costs. The batteries would be accessible from a hinged door at the rear of the vehicle, which will be laid out to maintain an even weight balance. This will ensure the weight is supported evenly throughout the vehicle to ensure that components are not subject to uneven wear. It will also maintain handling of the vehicle through cornering.
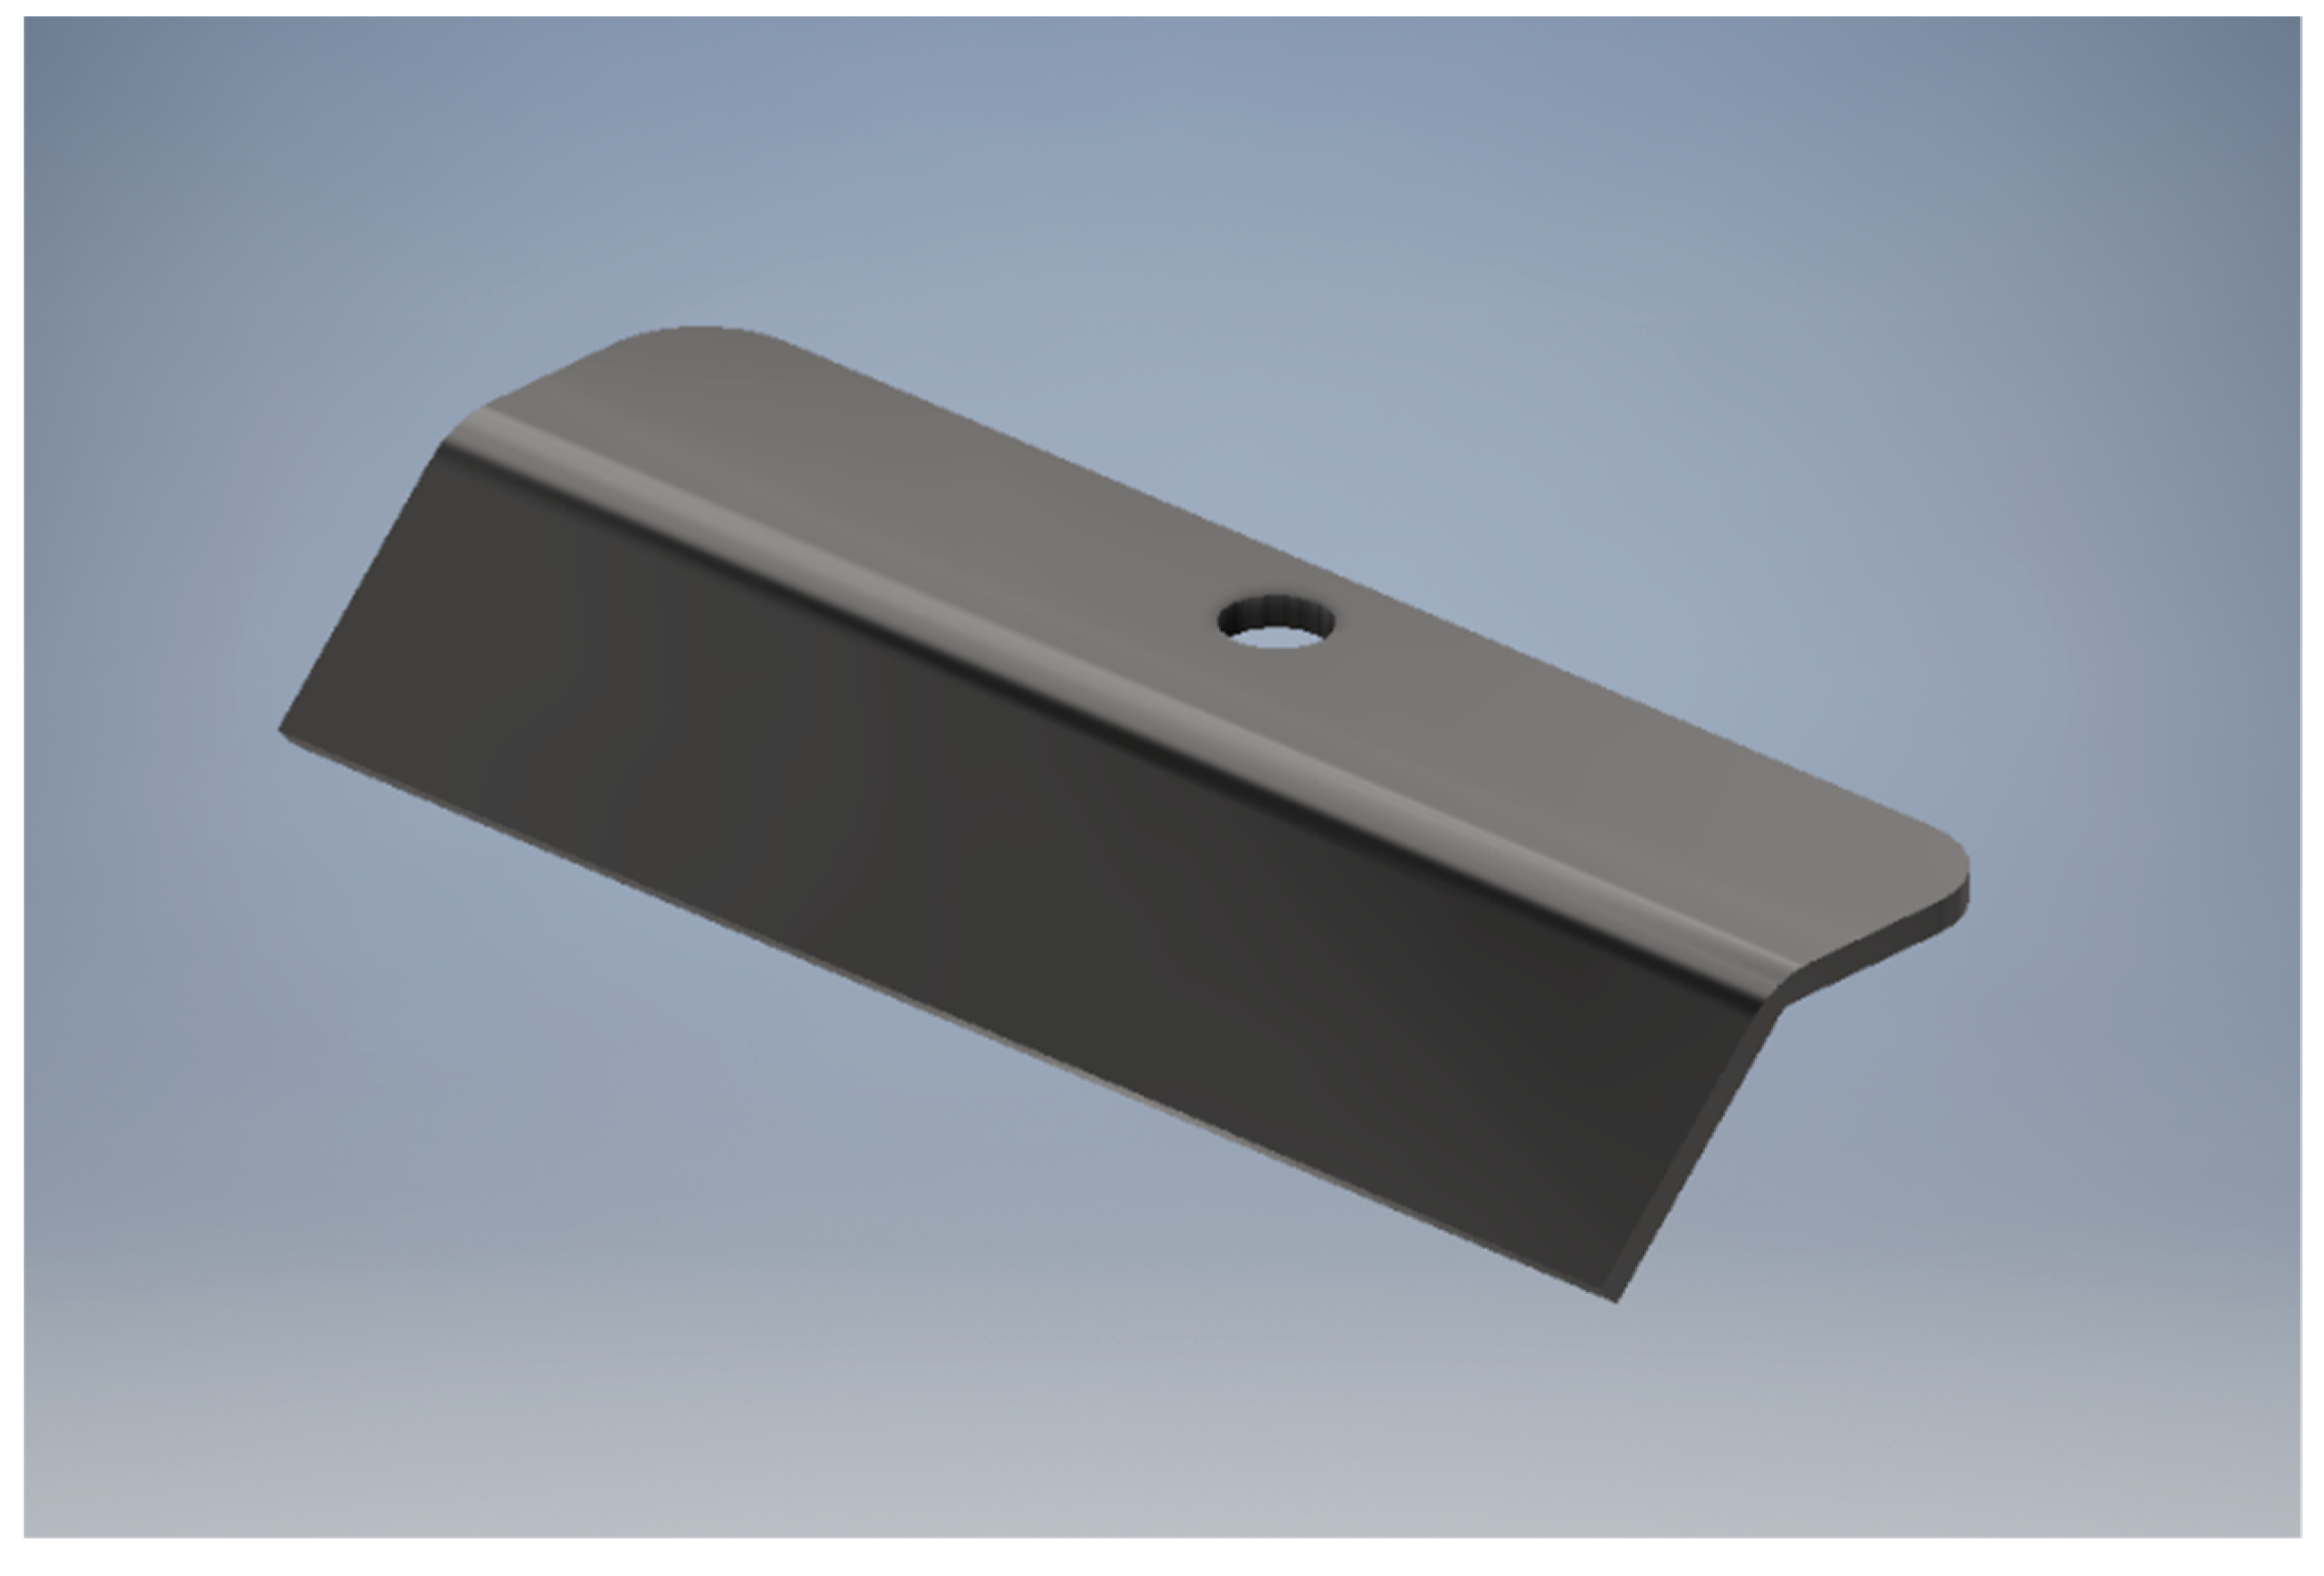
The batteries will be secured to the base of the rickshaw by a bracket (as seen in Figure 9) which will be connected by a threaded rod and nut to the base of the rickshaw battery compartment. This will allow quick release of each battery allowing a more efficient changeover of batteries, it will also prohibit movement of the batteries while in operation.
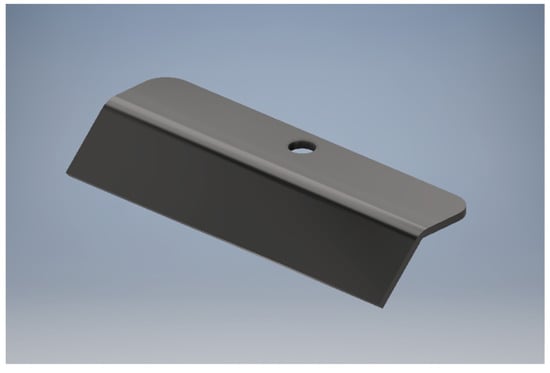
Figure 9.
Bracket to secure battery.
5.6.2. Storage
A luggage area was requested by 13% of the passengers asked. As space inside the cabin of the rickshaw is limited, a rear storage box will be installed on the rear exterior frame of the cabin. The storage box will be fabricated from a mild steel frame welded to the rickshaw frame and will be enclosed with plywood with a hinged door for access. A standard storage compartment will be fabricated to fit each individual rickshaw
5.7. Expected Cost
Table 5 shows an indication of expected pricing and target cost for each component, totalling £235, but this would have to be verified through contacting wholesalers and manufacturing factories to obtain exact costing. Labour costs must be considered, therefore using the average wage of 239,465 rupees (£2750) for a mechanic in India, the hourly rate based on a 40-h working week can be considered as being approximately £1.32. The fabrication and modifications to the rickshaw are basic and should require no longer than 25 h; therefore, there is an expected labour cost of £33. Machinery such as welding equipment and lathes will be required; as these will be used to produce thousands of rickshaws, the cost per unit will be negligible and therefore overlooked at this stage of costing. A reasonable approximation of cost would total £268.

Table 5.
Design specification and costing.
6. Proof of Concept Prototype
A prototype was developed to have a working model of the drive system. The prototype was not built to resemble a rickshaw or to carry the same weight as what would be expected, it was purely to test the electrical and mechanical components and their configuration within the design.
6.1. Development and Fabrication
The prototype was developed using the frame of a mountain bike; this would provide the base to be built upon. The donor bike had a wheel diameter of 24 inches.
The bike was stripped down to the frame, front wheel, front brake, and pedal and pedal gears, of which the 24-tooth gear would be used. As the rear wheel would be replaced by two wheels, a shaft had to be designed to facilitate this; a 19 mm mild steel metal rod was fabricated to suit.
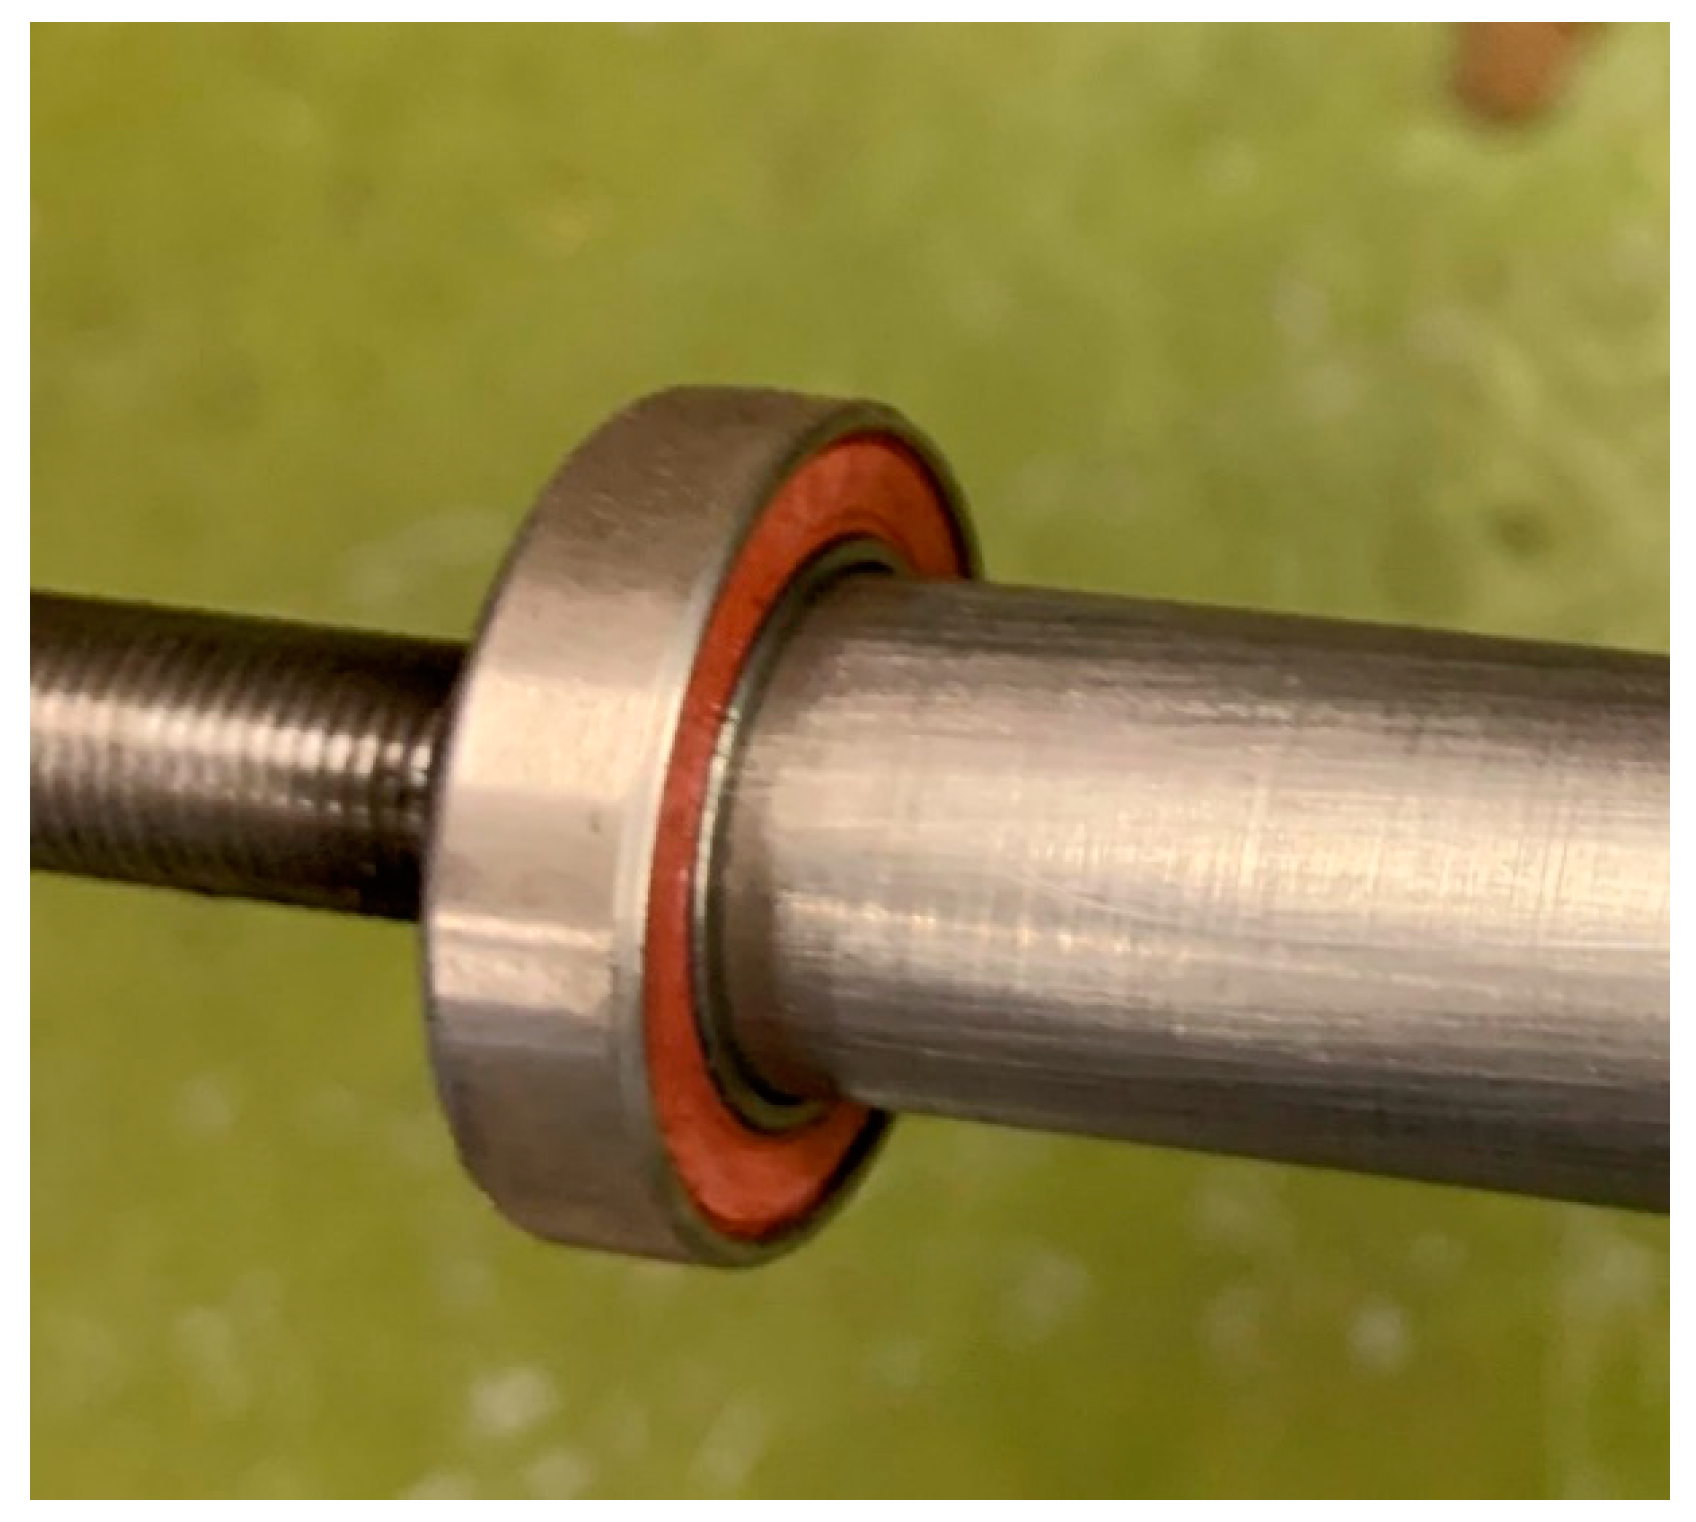
It was vital the shaft could house bearings to separate the shaft from the frame; a length of stainless steel of a 32 mm outside diameter and inside diameter of 28 mm was chosen and this allowed the selection of bearings. Four bearings of 17 mm inside diameter and 28 outside diameter were purchased; this required the shaft to be lathed to enable the bearing to have a press fit onto the shaft as seen in Figure 10. Gearing was to be attached within the central portion of the shaft. The precise measurements were mapped out and the bearing positions could be identified.
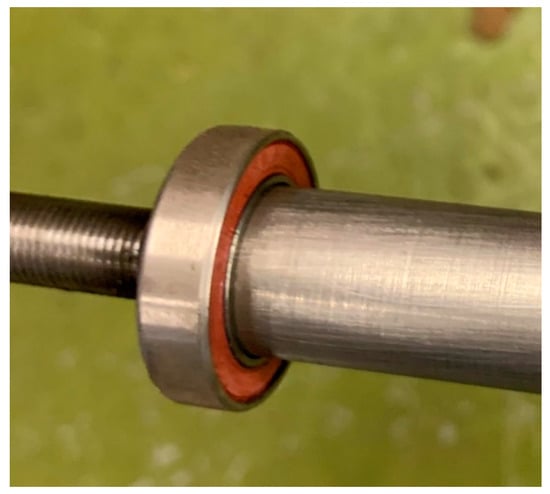
Figure 10.
Bearing press fitted onto shaft.
The gearing was set for a ratio of 1:0.75 for the human input and 1:1.29 for the motor. This would give the driver a relatively undemanding start from 0 km/h and would provide a speed or 15 km/h at a cadence of 90 rpm (unassisted), which is regarded as ideal for prolonged cycling [16].
The 18 tooth gears bought came in the form of a freewheel assembly. This allows each drive method to work independently providing safety to the driver.
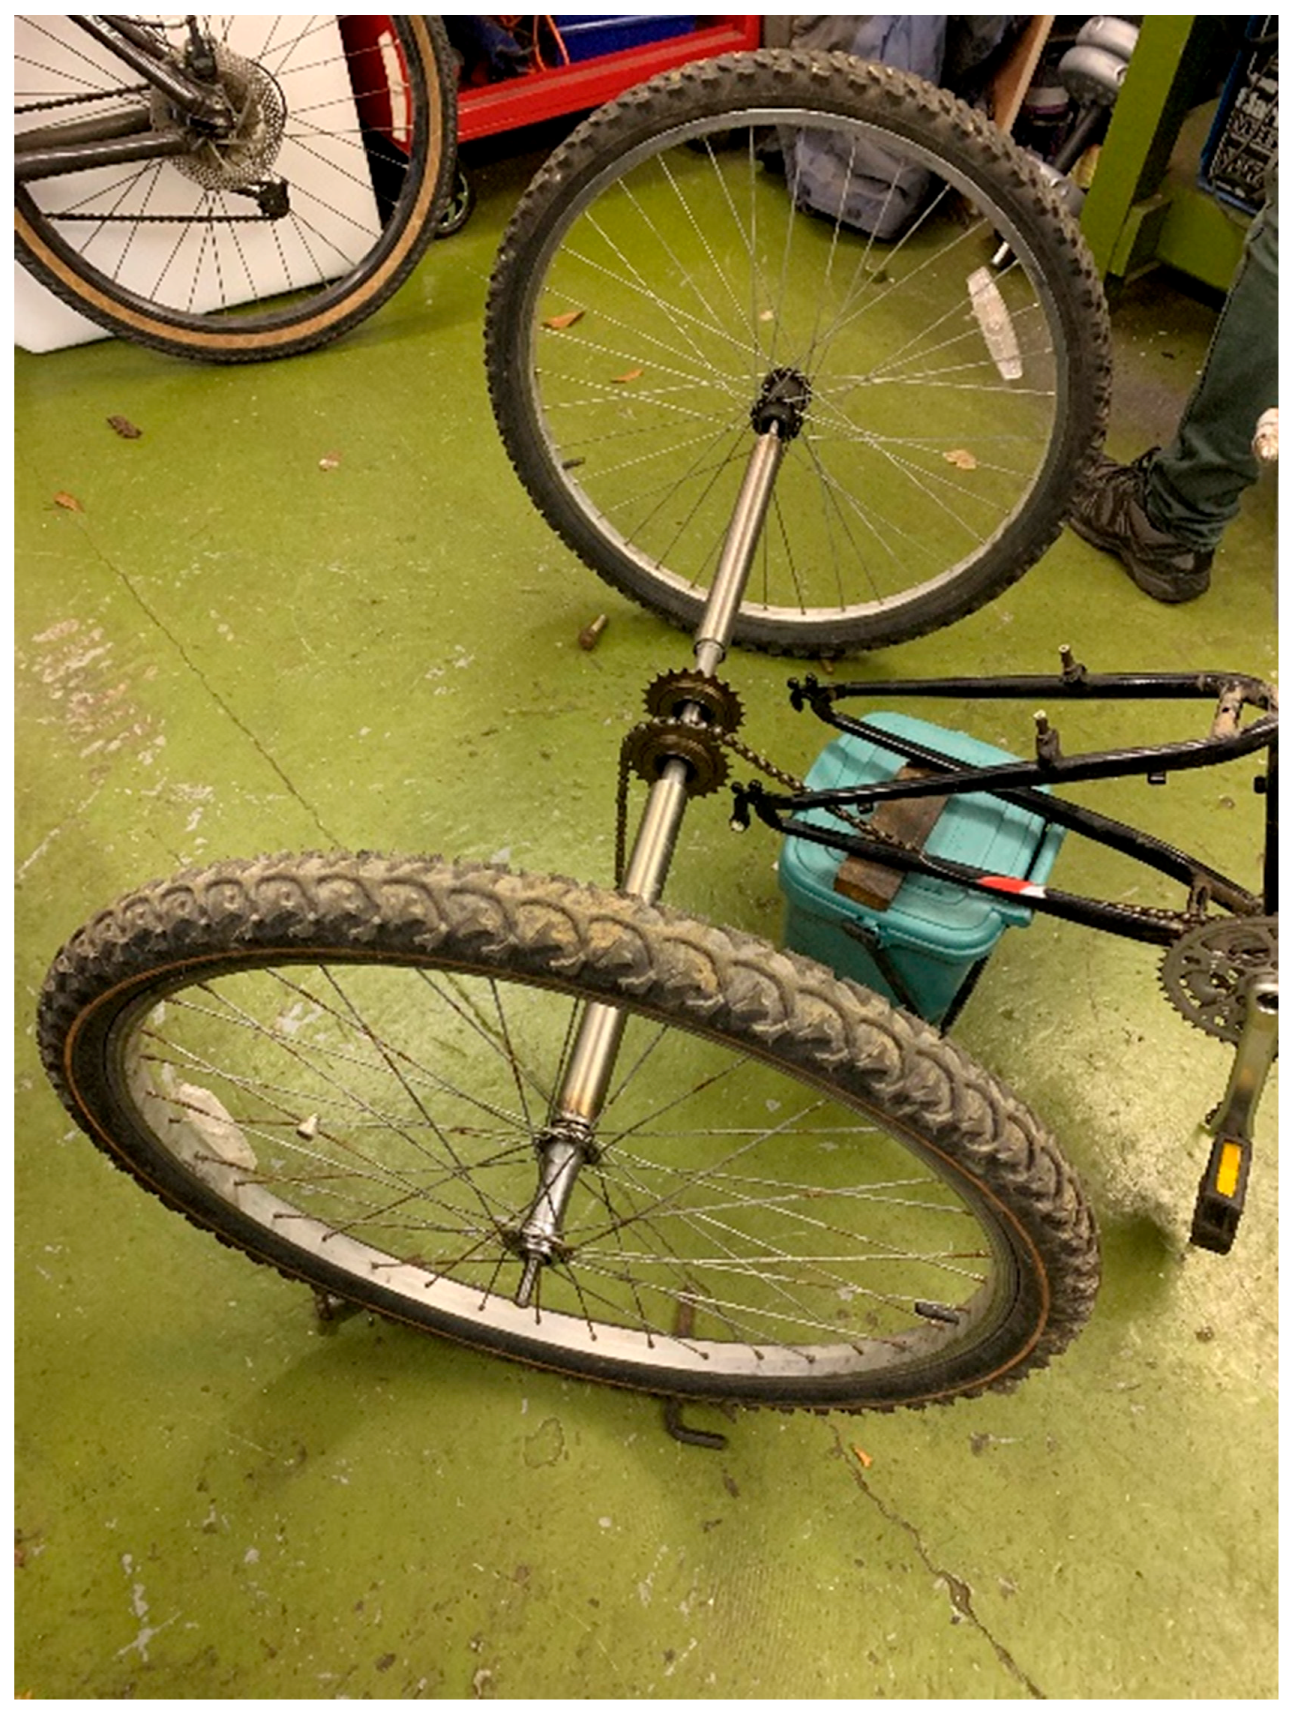
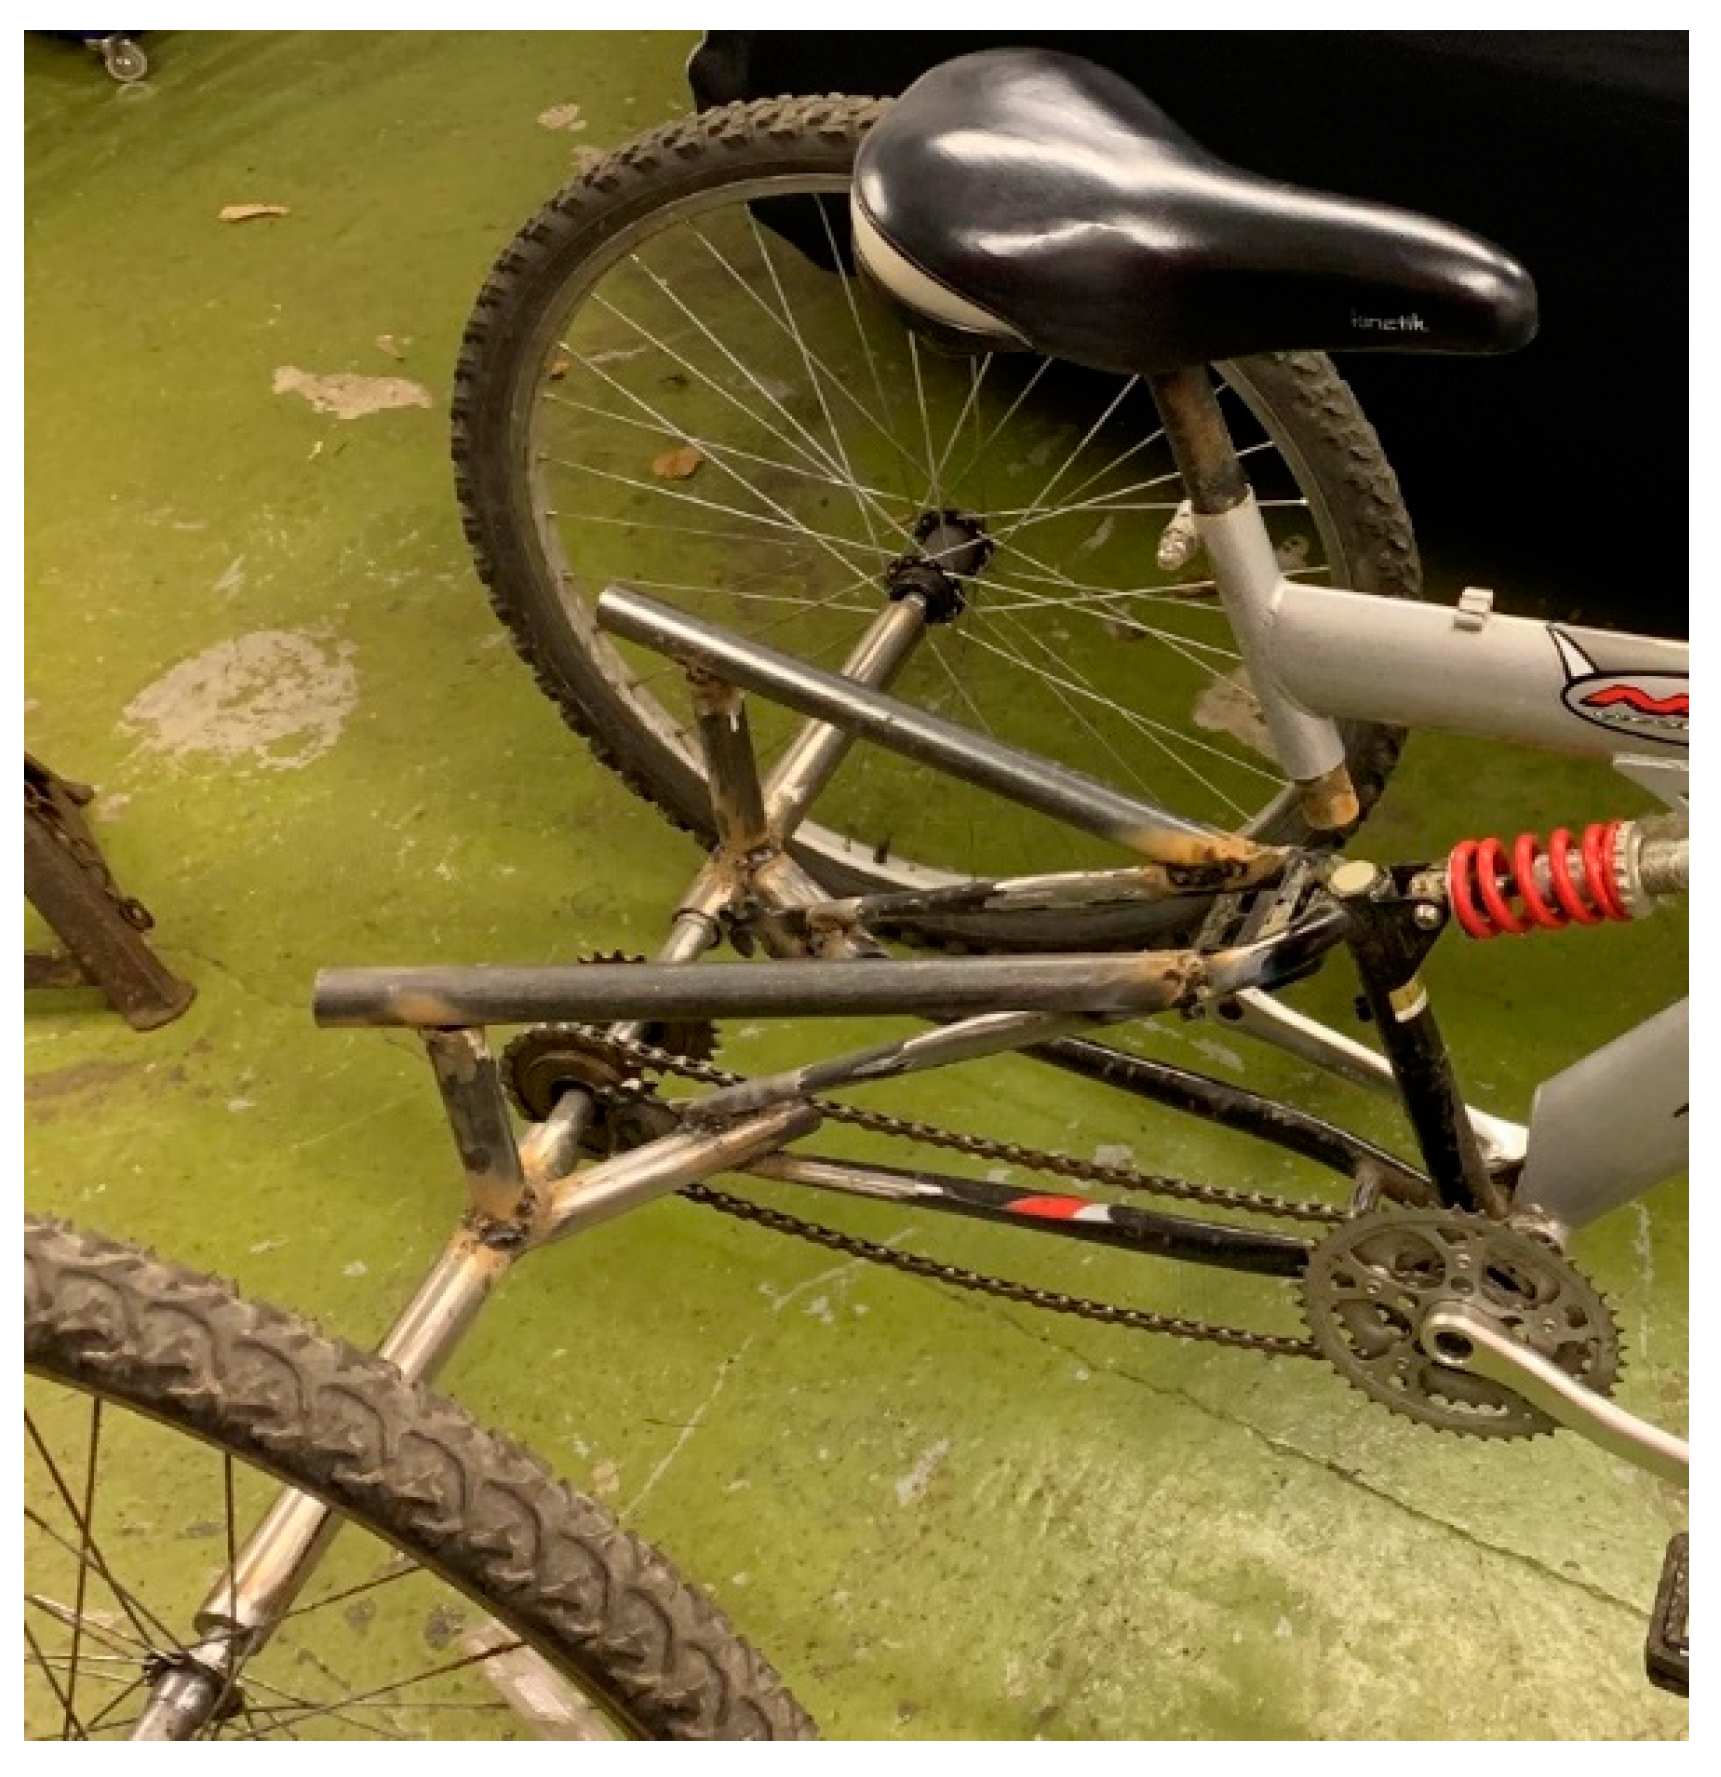
Having assembled the shaft (see Figure 11), a frame could be developed to attach the shaft to the front portion of the bike; using mild steel tubing of 26 mm outside diameter and 20 m inside diameter, the frame was metal inert gas (MIG) welded to the axle, and a platform section of frame was developed (see Figure 12) in order to locate the motor, batteries, and control unit.
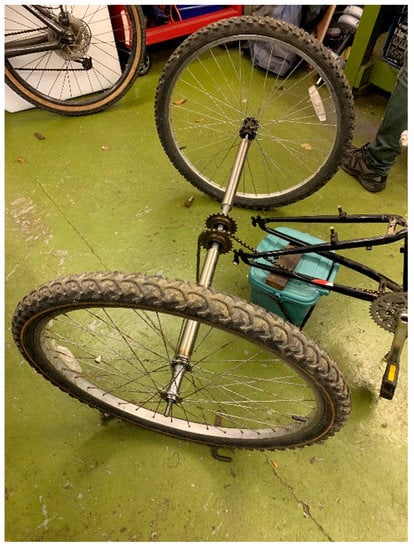
Figure 11.
Rear shaft and axle assembly.
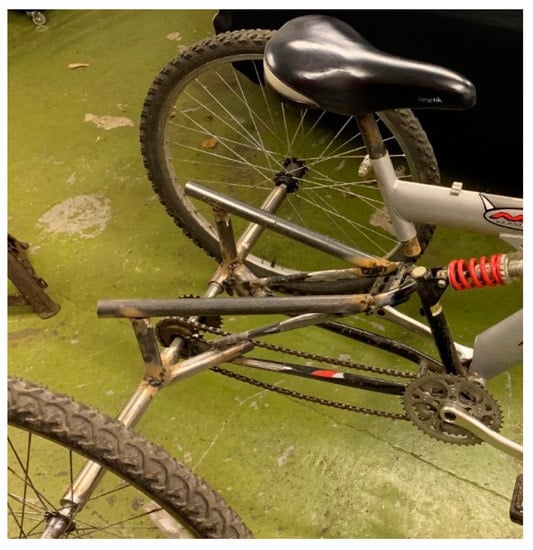
Figure 12.
Platform frame assembly.
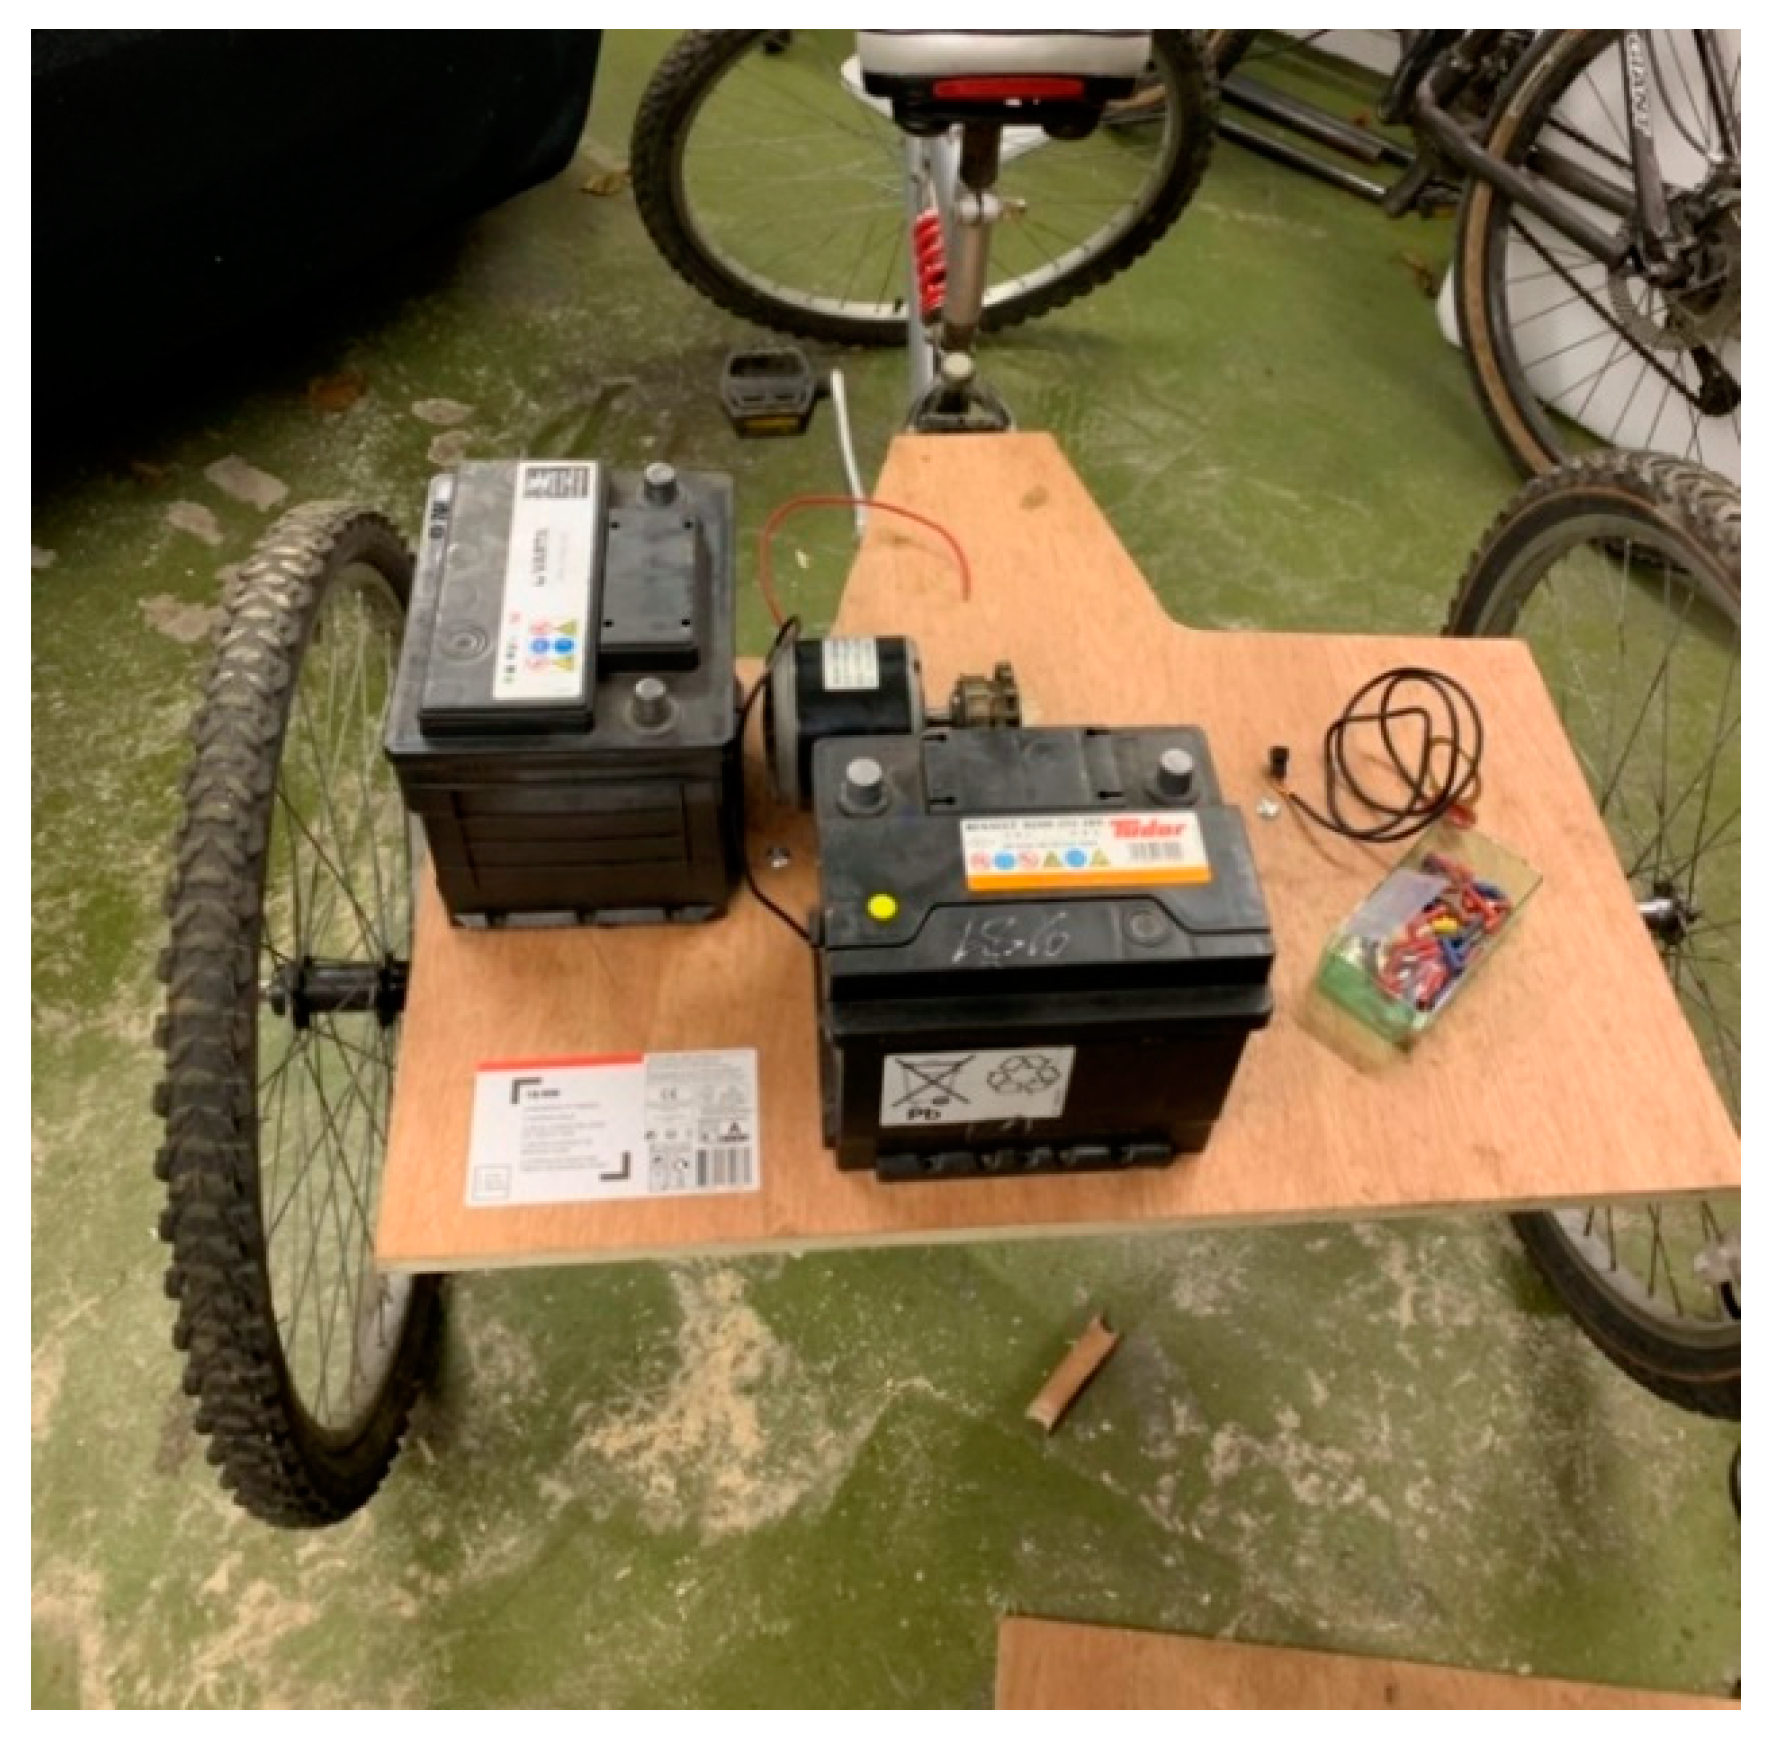
Having the platform section of frame, an 18 mm sheet of plywood could be cut to size and be attached to provide a base for the electrical components (see Figure 13).
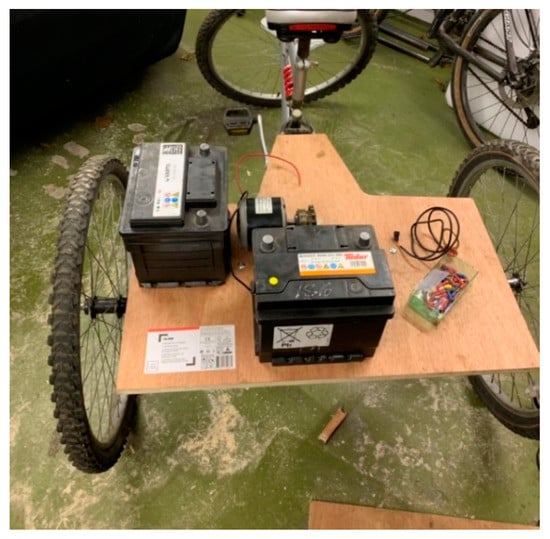
Figure 13.
Platform housing electrical components.
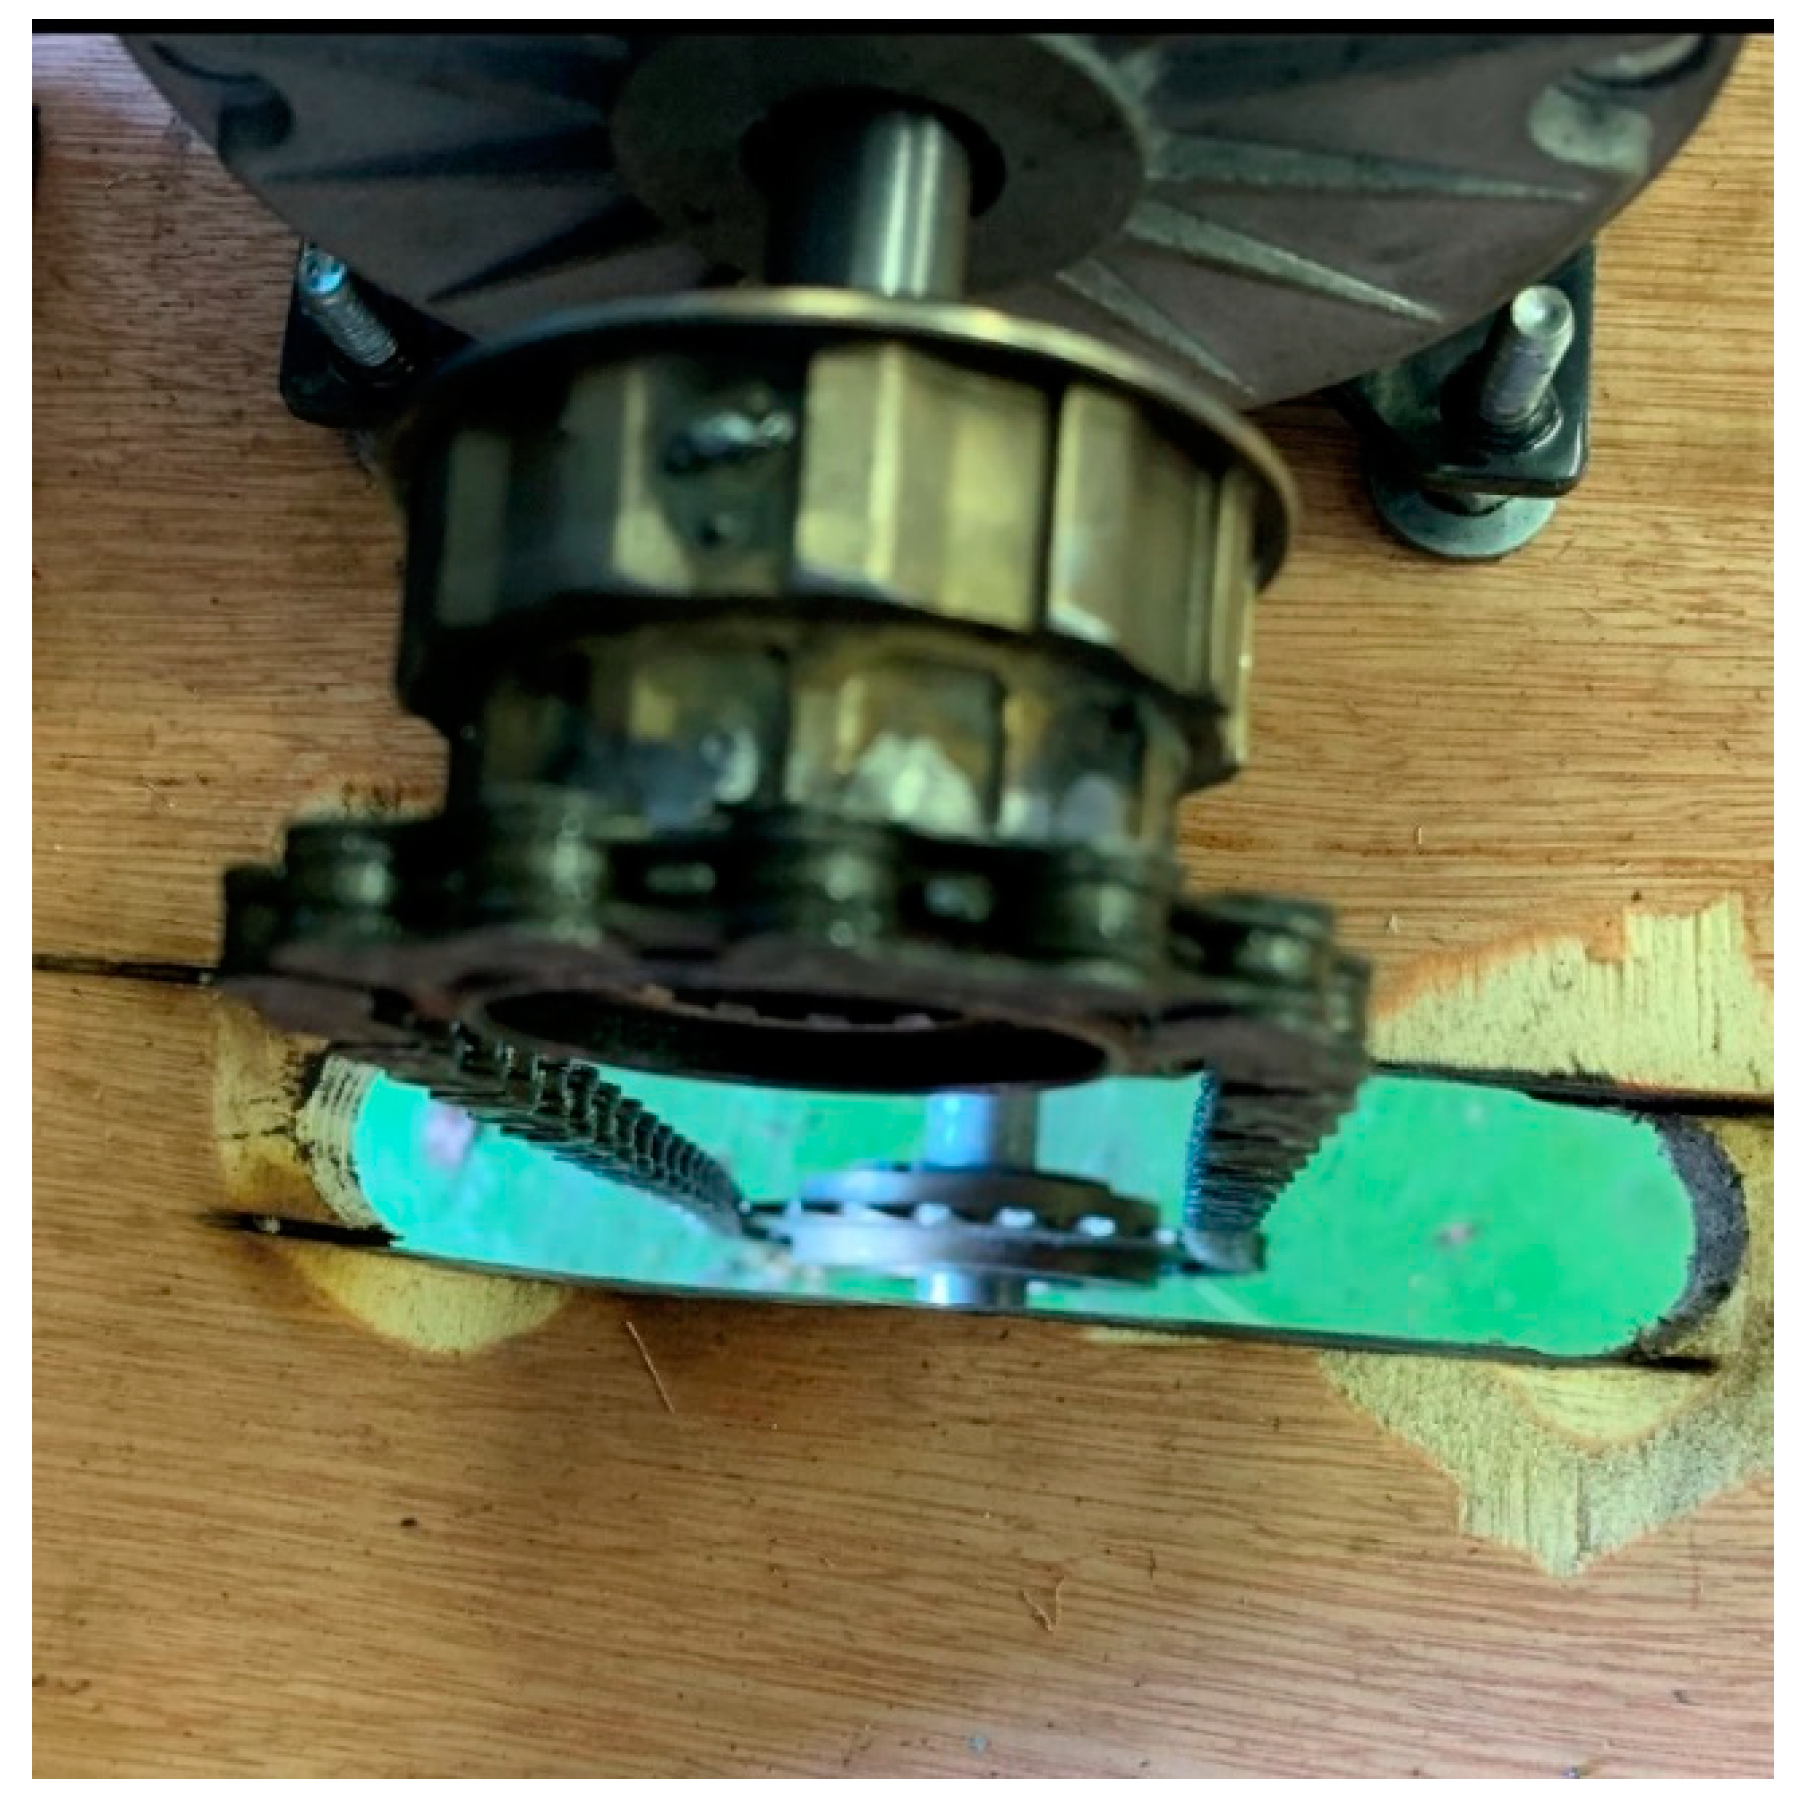
The electrical components to be installed were 1 × 24 V DC motor, 2 × 12 V 45 AH lead acid batteries (used but fully charged), 1 × 24v control unit, one cadence sensor, and one three-phase bridge rectifier. A slot directly above the motor driven gear was cut providing a space facilitating the link chain from gear to motor (see Figure 14); the motor was then secured in place, and the use of spacers allowed the tension of the chain to be set.
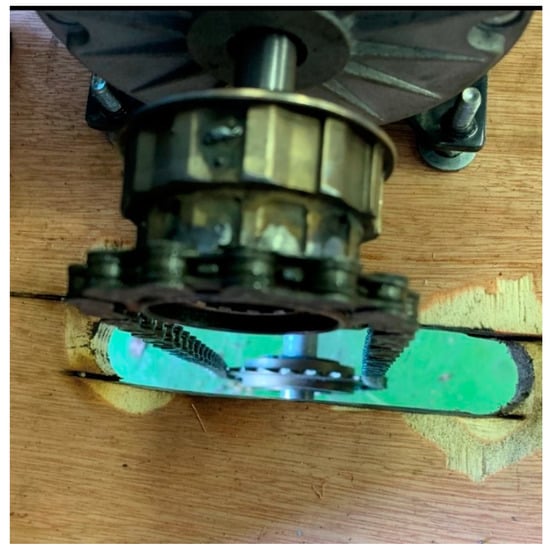
Figure 14.
Slot for chain to motor.
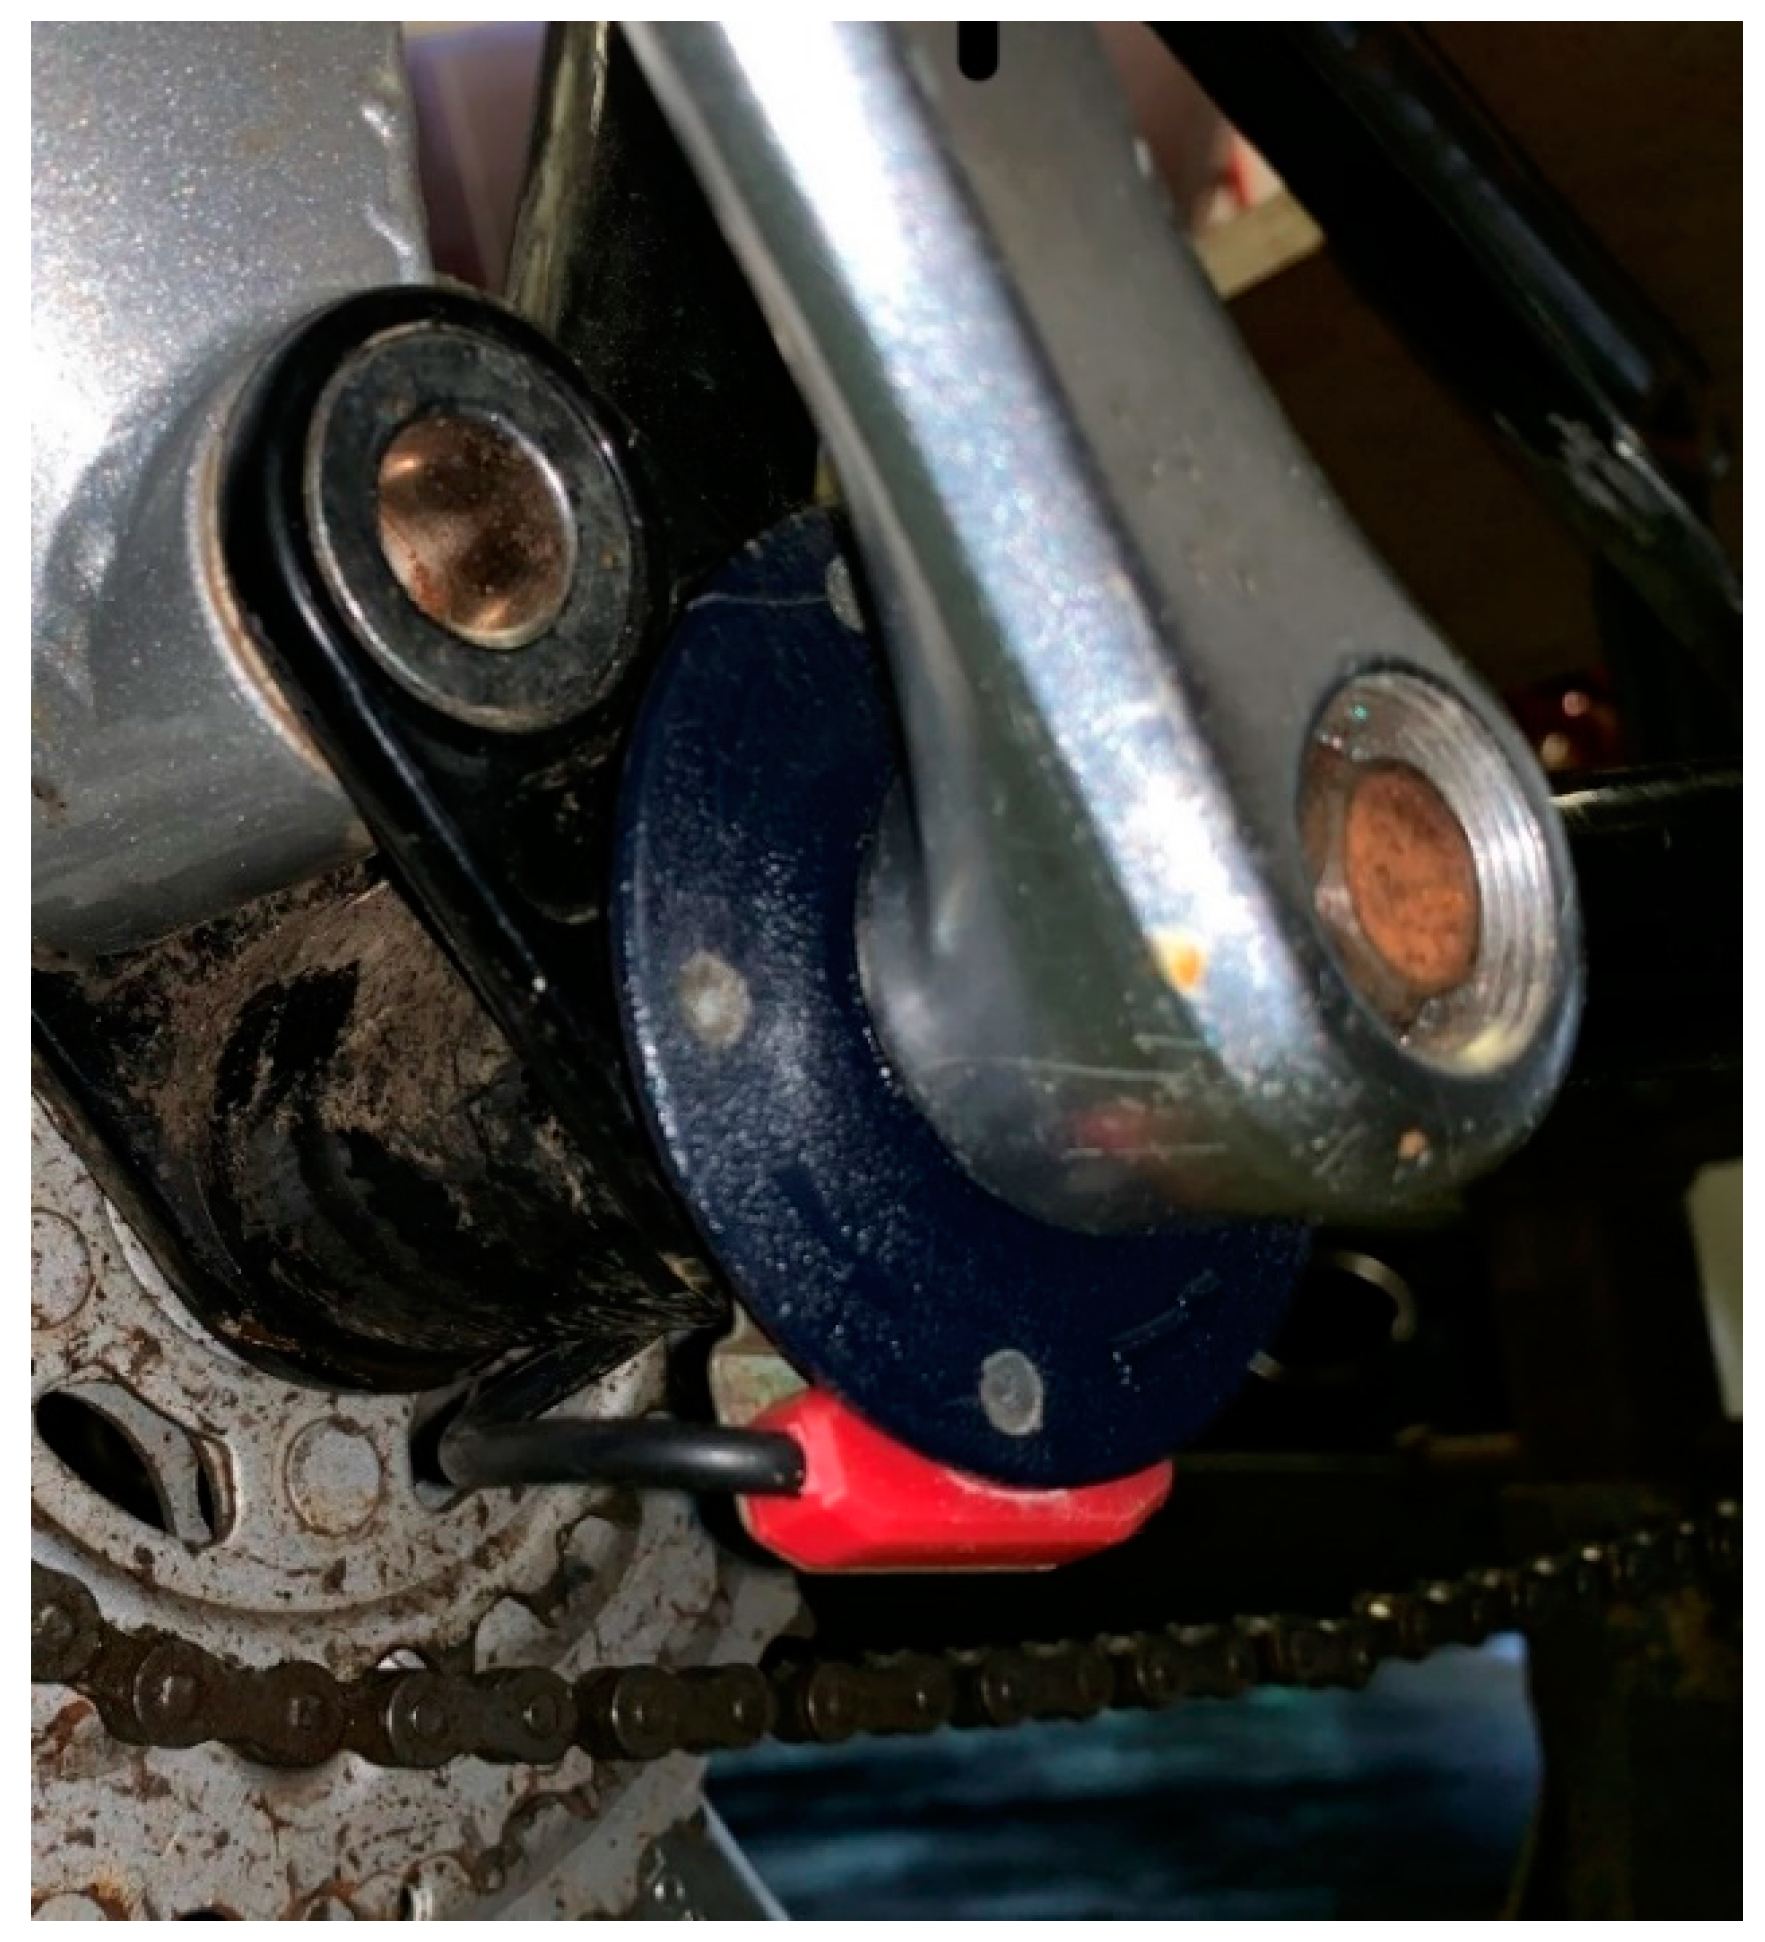
The cadence sensor was fitted on the non-geared side of the pedal sprocket (see Figure 15), the cable was cable tied for safety, and ran back to the platform. The control unit was secured by cable ties to the plywood and the batteries were secured using screws. The batteries were connected in series and to the control unit to provide the 24 V needed to run the motor; the cadence sensor was then connected. Finally, to connect the motor to the control unit, a three-phase bridge rectifier was used to convert the three-phase signal from the control unit to the single-phase DC motor.
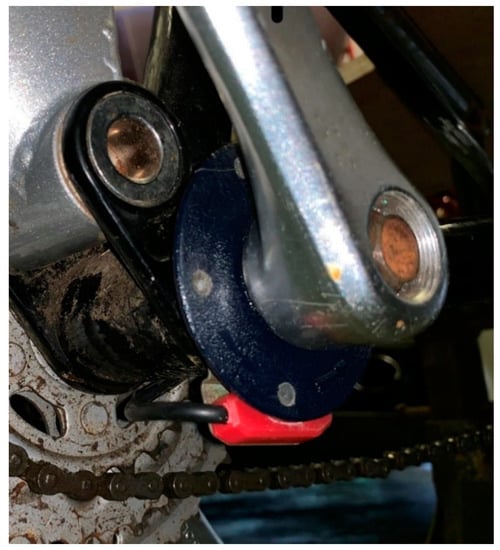
Figure 15.
Cadence sensor assembly.
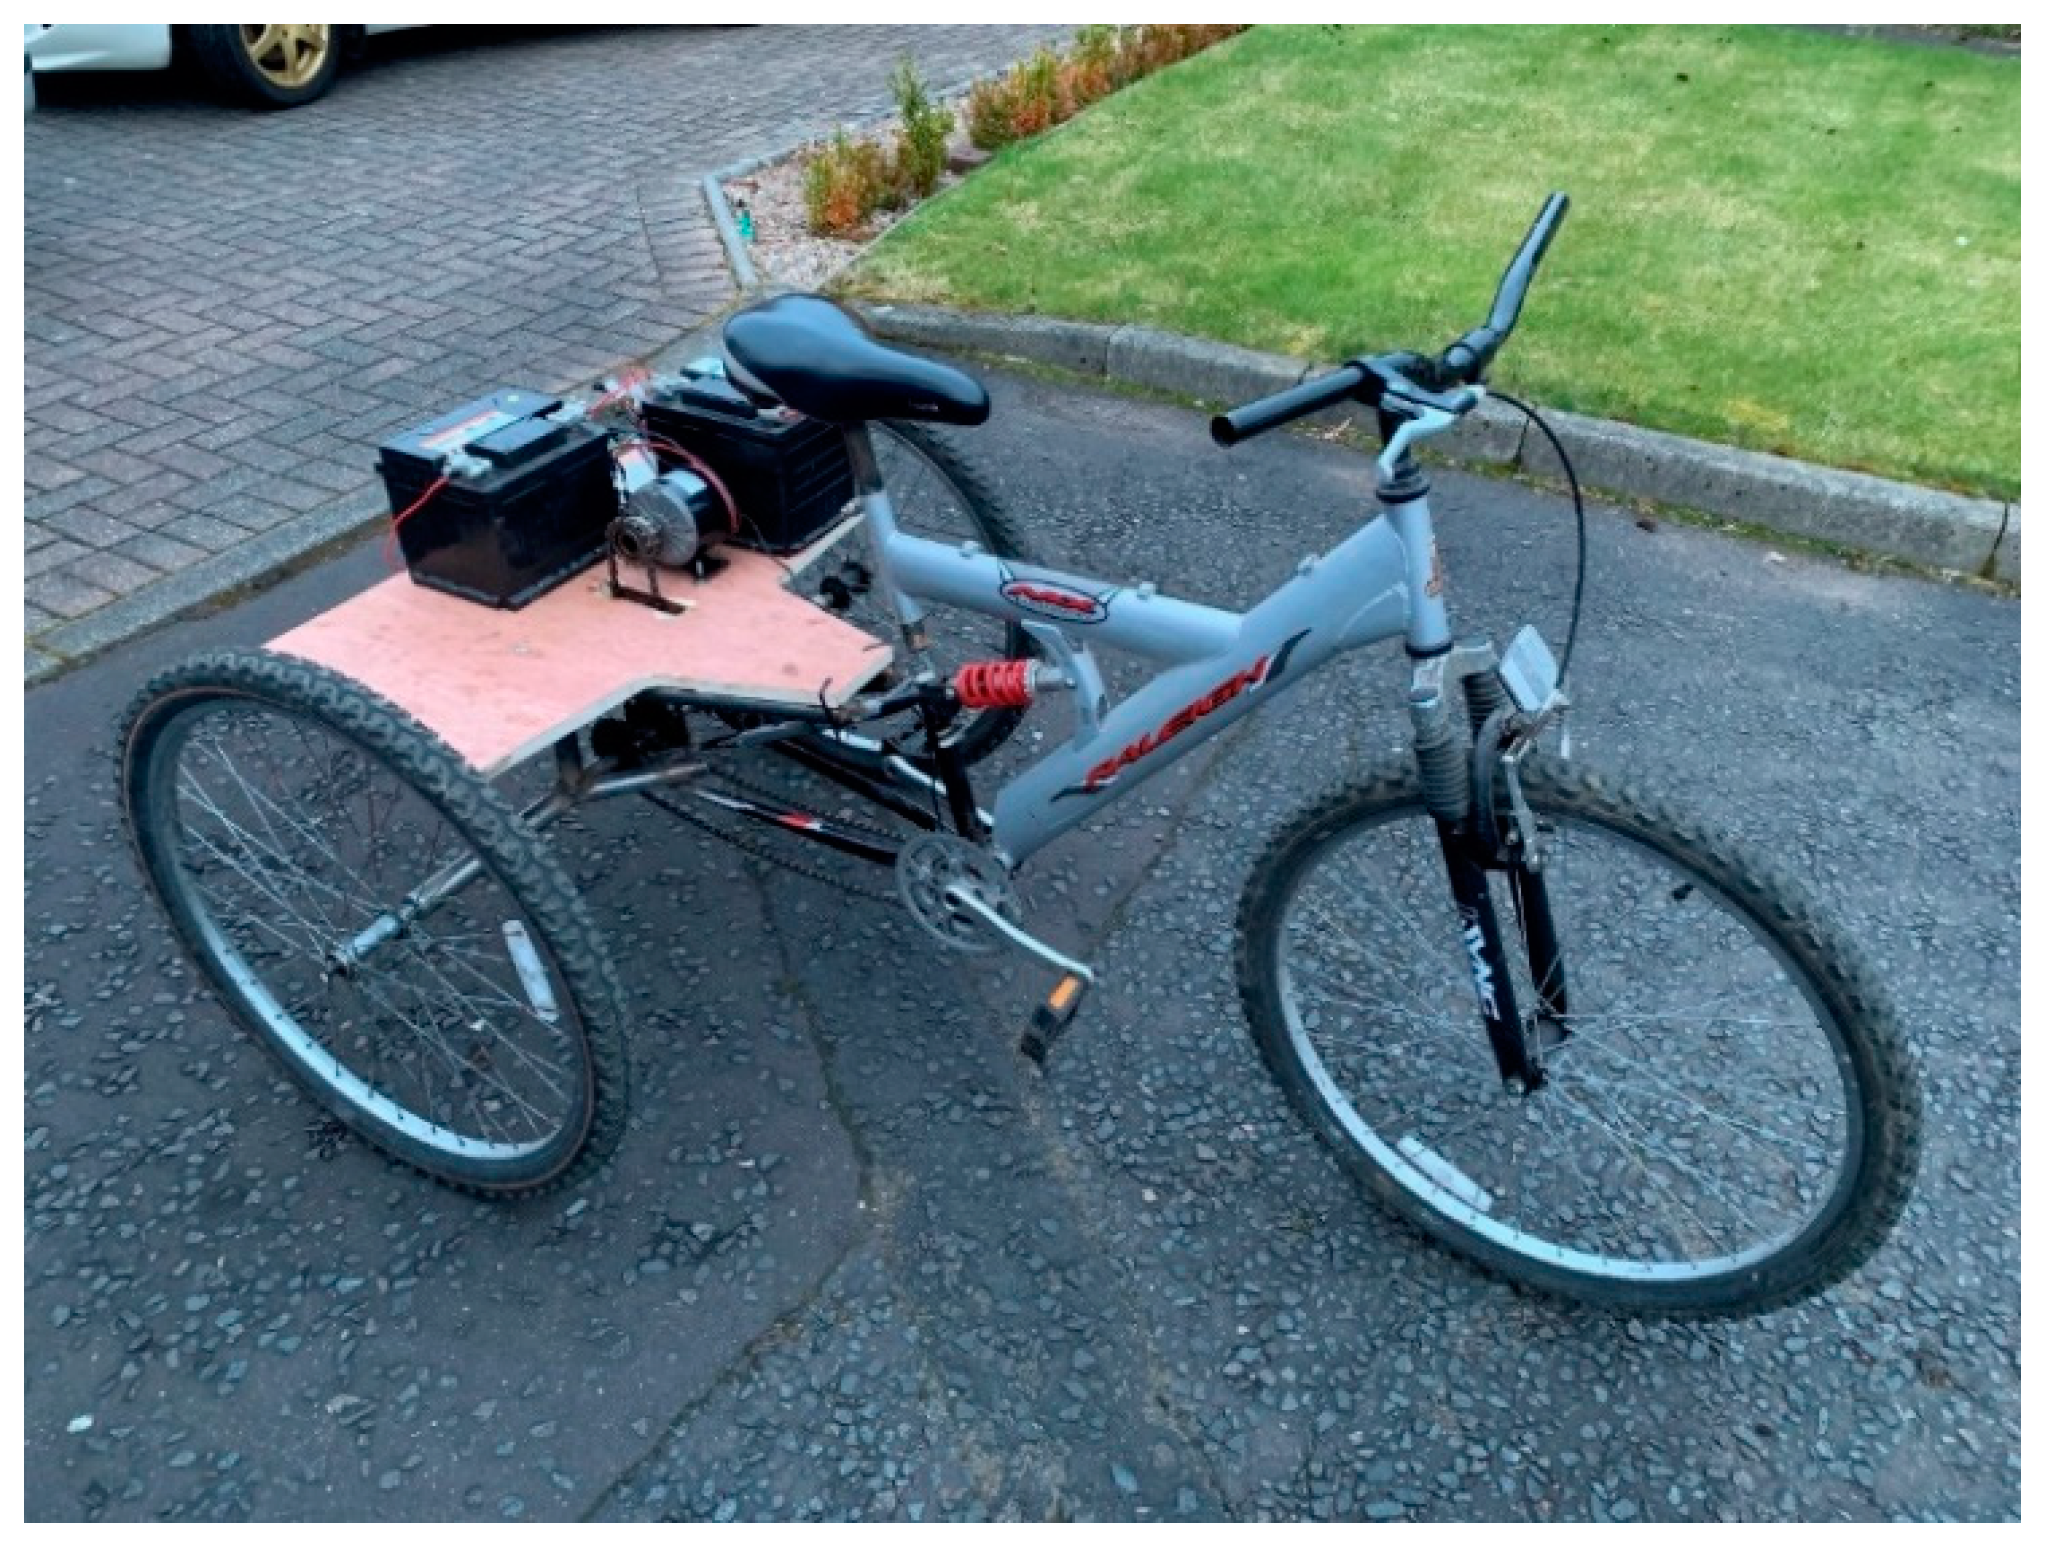
The finished prototype is shown in Figure 16.
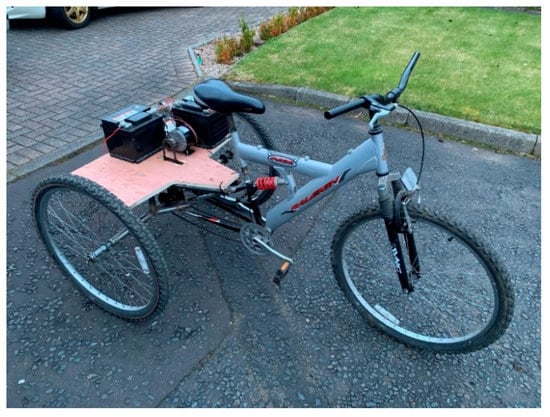
Figure 16.
Finished prototype.
6.2. Testing
Placing the prototype’s rear axle on stands took all weight off the wheels and let the tester record the activation of the motor and to prove the concept. The pedal sprocket was turned by hand while the motor and pedal position were monitored visually by camera recording; this was tested in the same styles as the road testing where low, moderate, and high cadences were tested three times each. It was found that the motor would activate after one half rotation of the pedal; this, in theory, would give the driver assistance after a total of 0.42 m, therefore alleviating all effort from then through acceleration to desired speed.
Through calculation it was discovered that the motor would benefit from a higher gear ratio. Currently, the prototype has a ratio of 1:1.29; a ratio of 1:14 will give the prototype a theoretical top speed of 15 km/h, which is the desired minimum top speed set in in the PDS see Appendix C.
6.3. Limitations
The testing of the motor activation was not accurate as no angular measurement was taken and was visually inspected only. The testing was for indicative purposes to prove the concept. The vehicle did not replicate a rickshaw exactly, therefore although this method of testing is acceptable at this stage, more-developed prototypes will be more accurately tested in the future.
7. Evaluation
7.1. Kolkata Research and Testing
The results of the research and testing in Kolkata were successful to a degree; the research proved invaluable as it was a direct first-hand source that gave the project a focused viewpoint directly identifying issues to be developed in design; the testing of the rickshaws proved to provide semi-accurate results and the inaccuracies came from the poor gradient analysis of the application used. This would have been improved by using a more precise tool for measuring altitudes. If funding allows it, this would be used in future testing.
7.2. Design
The design of the E-rickshaw, although not ground-breaking in terms of technology, meets the demand of the PDS. Therefore, the design can be classed as a success, and can be further advanced in development in order to get to a working prototype stage.
7.3. Proof of Concept Prototype
The gearing was also configured insufficiently and this resulted in inconclusive road testing. The concept was still proven as the electrical components responded as expected, therefore setting a foundation for further development. Therefore, as a proof of concept, it was a relatively successful tool for analysis.
8. Conclusions
As a whole, the project was a success and proved that improvements to the design could make a rickshaw less labour-intensive to drive, safer, and more comfortable without compromising on the environmentally friendly quality that cycle rickshaws possess, while remaining relatively inexpensive. Although the rickshaw would be inexpensive to construct, the feasibly of the solar aspect has not been explored and must be carried out before the project can be classed as a total success. If the solar aspect is not feasible, the project would not meet the criteria set in the PDS as a solar-sourced electric vehicle, although the vehicle could be charged by other means.
9. Recommendations
As it has been concluded that the project has potential to be a success, it would be recommended that further development of a working rickshaw could be prototyped and tested, ideally in location. This would get the project to a point where funding could be sought, as funding is the key to the objectives of this project being able to become applied.
Author Contributions
Conceptualization, T.M. and C.C.; methodology, T.M. and C.C.; software, T.M.; validation, T.M. and C.C.; formal analysis, C.C.; investigation, C.C.; resources, C.C. and B.F.; data curation, C.C.; writing—original draft preparation, C.C.; writing—review and editing, C.C. and T.M.; visualization, C.C.; supervision, T.M.; project administration, C.C., T.M. and B.F.; funding acquisition, C.C. and B.F.
Funding
This research received no external funding.
Conflicts of Interest
The authors declare no conflict of interest.
Appendix A
Interviews:
● Interview methodology
The conduction of the interviews was assisted by The Neotia University, Kolkata; as the researcher was not able to communicate in the local language, Bengali, students acted as interpreters. The students asked the drivers the set questions and relayed the answers to the researcher in English. The interviews took place in various localities of the city.
● Driver Profile
Questions relating to social aspects were configured to determine a brief profile of the drivers of Kolkata, India. It was decided that age must be acquired as an indication of premature retirement due to injury; combining age with the questions of how many hours and days worked, a comparison between the two could be established to investigate if there was a correlation between age and work pattern. Knowing the working hours of the drivers, the question of expected daily income could give an insight into the financial position of the drivers, and it could be used to evaluate their ability to fund improvements to their rickshaws.
● Passenger Profile
Local residents who used rickshaw services were interviewed in order to identify the usage patterns, overall satisfaction, needs, and wants from a customer’s point of view. A total of 15 people were interviewed, with each being asked eight questions.
● Limitations
The limitations of the interview process include: The small quantity of interviewees asked, possibly exaggerating abnormalities; relying on the honesty of the interviewees especially where the questions were relatively personal and intrusive; the language barrier may have given the opportunity for miscommunication and misunderstanding to arise; the questions could contain confirmation bias leading unconsciously to answers the researcher was hoping for.
Appendix B
Testing
● Speed Testing Methodology
Data from journeys at different locations around the city were taken in order to ensure a more balanced scope of topography and speeds was achieved. The drivers were chosen at random and were of differing ages and physiques; this gives the results the greatest chance for variation in order to find as true an average as possible. The areas where journeys were tested were Ripon Street, Behala, Park Circus, South City, and College Street. The data were collected using the mobile GPRS application ‘Elevation tracker’ recorded on an iPhone 6. The application provided: Distance travelled, maximum gradient, average gradient, maximum speed, average speed, and also mapped out the journey.
● Topography Testing Methodology
The topography was also mapped using the same mobile application, ‘Elevation Tracker’. It is vital to the power requirement calculation that the highest max gradient is identified. In testing, it was impossible to test the topography of all roads in Kolkata used by the rickshaws due to time and monetary constraints, but varied journeys in various locations gave a good representative sample.
● Energy Usage Methodology
In order to collect the data, two journeys of 1 km were undertaken on two separate rickshaws with two different drivers in two different locations (Park Circus and Behala). This gave the opportunity for the data to show a variation of results. Each rickshaw driver was chosen at random and asked to drive 1 km, and this was measured using the mobile app, ‘Gradient Tracker’. The speed was recorded using another mobile application ‘Speedometer’ on a sperate device; using the application ‘Screen Recording’, a video of the speeds would be created for the entirety of the journey. Using Windows Media Player, the video was paused and skipped in one second increments; at each second of the video, the speed shown was inputted into the Excel simulation. The simulation programme provided the average speed, distance travelled, duration, and energy used; further to this, it was used to create a speed/time graph to show the acceleration of the rickshaw. The simulator was set to replicate the conditions of the journey by imputing the relevant values as shown in Table 1 and Table 2.
Appendix C
Product Design Specification (PDS)
Performance:
- It must be able to reach a speed of at least 15 km/h.
- It must have a range of at least 42 km
- It must be able to carry 2 passengers and a driver
Aesthetics
- The rickshaw should be aesthetically pleasing and fit within the heritage.
Ergonomics:
- It must be comfortable to pedal.
- It must be designed to reduce risk of injury.
- All moving parts must be contained safely.
- It must be easy to embark and disembark for the passengers.
Environment:
- The rickshaw must protect the occupants from the weather where necessary.
- It must be able to operate efficiently in the climate.
- It must be charged using solar power.
Quantity and Manufacture
- It must be able to be manufactured in a mass quantity inexpensively.
- It must be able to be manufactured without the need for specialised machinery or tooling requiring high level workers.
Market constraints:
- It must merit the higher cost and price to compete with the cycle rickshaw market.
Competition:
- It must be able to be priced significantly cheaper than the £1100 Toto E-rickshaw [17] to avoid competition with this particular comparable vehicle.
Quality and consistency:
- It must be reliable and durable.
- It must require low maintenance
- Each vehicle should have identical performance when built.
Materials:
- All materials used must be capable of withstanding corrosion from the climate.
- The materials should be able to last the expected lifespan of the rickshaw or be able to be replaced inexpensively.
- The rickshaw should last over 20 years with maintenance and component replacements.
Vehicle constraints
- The total vehicle weight must not exceed 150 kg.
Battery requirements
- Must have a recharge time of less than 24 h.
- Must not exceed total weight of 40 kg.
- Must have be a usable 110 Ah of charge.
- Batteries must be easily accessible and removable.
Standards:
- It must adhere to all rules and regulations for the location at which it is situated.
Target product cost
- The product must cost less than £350.
Patents
- No patents relating to the E-rickshaw have been found in the Indian directory.
References
- Chandran, N.; Brahmachari, S.K. Technology, knowledge and markets: connecting the dots—Electric rickshaw in India as a case study. J. Frugal Innov. 2015, 1, 2–10. [Google Scholar] [CrossRef]
- Khan, J.H.; Hassan, T. Socio-economic profile of cycle rickshaw. Eur. Sci. J. 2010, 8, 320. [Google Scholar]
- Registrar General & Census Commissioner. Census of India 2011; Registrar General & Census Commissioner: New Delhi, India, 2011. [Google Scholar]
- Goswami, D. Understanding the Socio-Economic Condition of Rickshaw Pullers: After Arrival of E-Rickshaw; University of Delhi: New Delhi, India, 2017. [Google Scholar]
- Ranjan, C.; Akhtar, S.J.; Tiwari, A.K.; Choubey, N.K.; Kumar, R.; Rajwar, L.; Kumar, N.; Kumar, R. Desing and fabrication of tri rickshaw with solar charging station. Int. J. Mech. Eng. Technol. 2017, 8, 358–366. [Google Scholar]
- Attri, S.D.; Tyagi, A. Climate Profile of India; India Meteorological Department Ministry of Earth Sciences: New Delhi, India, 2010.
- Bhattacharya, R.; Pal, S.; Bhoumick, A.; Barman, P. Annual variability and distribution of ultraviolet inder over India using temis data. Int. J. Eng. Sci. Technol. 2012, 4, 77–83. [Google Scholar]
- Muneer, T.; Kolhe, M.L.; Doyle, A. Electric Vehicles Prospects and Challenges, 1st ed.; Elsevier: Edinburgh, Scotland, 2017. [Google Scholar]
- Solar Energy Centre, MNRE, Indian Metrological Department. Typical Climatic Data for Selected Radiation Stations; Solar Energy Centre: New Dehli, India, 2008.
- Van Ditten, M. Torque Sensing for E-Bike Applications; Delft University of Technology: Delft, The Netherlands, 2011. [Google Scholar]
- Albright, G.; Edie, J.; Al-Halla, S. Comparison of Lead Acid to Lithium-ion in Stationary Storage Applications; All Cell Technologies LLC: Chicago, IL, USA, 2012. [Google Scholar]
- Hickman, M.R. A Study on Power Assists for Bicycle Rickshaws in India, including Fabrication of Test Apparatus; Massachusetts Institute of Technology: Cambridge, MA, USA, 2011. [Google Scholar]
- Steyn, W.; Warnich, J. Comparison of tyre rolling resistance for different mountain bike tyre diameters and surface conditions. S. Afr. J. Res. Sport Phys. Educ. Recreat. 2014, 36, 179–193. [Google Scholar]
- European Cyclists Federation. Requirements on Lighting (Light Intensity) and Reflectors of Bicycles; ANEC: Brussels, Belgium, 2012. [Google Scholar]
- Health and Safety Executive. Heat Stress in the Workplace; Health and Safety Executive: London, UK, 2013. [Google Scholar]
- Abbiss, C.; Peiffer, J.; Laursen, P. Optimal cadence selection during cycling. Int. Sportmed. J. 2009, 10, 1–15. [Google Scholar]
- IndiaMart. 2019. toto-e-rickshaw-16669287130. Available online: https://www.indiamart.com/proddetail/toto-e-rickshaw-16669287130.html (accessed on 2 February 2019).
© 2019 by the authors. Licensee MDPI, Basel, Switzerland. This article is an open access article distributed under the terms and conditions of the Creative Commons Attribution (CC BY) license (http://creativecommons.org/licenses/by/4.0/).

