1. Introduction
According to the U.S. Energy Information Administration (EIA), the world energy consumption will increase by 28% between 2015 and 2040 [
1]. In 2017, 70% of the energy demand growth came from fossil-fuels, which subsequently led to the rise of carbon dioxide (CO
2) emission by 1.4% [
2]. Such a rise of CO2 emission is a persistent global warming concern. Naturally, renewable distributed generation (DG) gained popularity as it can support the increasing energy demands in the future while reducing CO
2 emission. The growth of renewable DGs can be seen through the initiatives taken by both China and Japan, who had aimed for a total photovoltaic (PV) installed capacity of 100 GW and 28 GW by 2020, respectively [
3,
4]. Some countries such as Denmark even aimed for a 100% renewable energy generation in 2050 [
5]. As such, paradigm shifts from the centralized fossil fuel generation to distributed renewable energy generations are expected. These transitions will eventually lead to higher complexities in the current power system network operation.
Conventionally, when a fault occurs in a distribution network, the relay will isolate the fault together with downstream loads from the grid. This will lead to supply interruptions to the downstream loads. Even if there were a downstream DG, it would have to cease its operation within 2 s in accordance with IEEE 1547-2003 [
6]. At this moment, since the generations of renewable energy DGs only occupy a relatively small amount of the total generation capacity, the impacts of renewable DG disconnection are negligible. However, with the rapid growth of renewable DGs, the installed capacity will hit a substantial level, and any indiscriminate disconnection of renewable DGs may induce grid parameter variations that can lead to serious events such as a wide-scale blackout [
7]. For example, it was shown in [
8] that the severity of a voltage sag will increase as more renewable DGs are disconnected during a disturbance. Hence, the revision to the existing grid codes and standard are required by considering the renewable DG penetration level, in particular with regard to its response to grid disturbances.
As a result, the concept of a low voltage ride through (LVRT) emerges as an alternative solution to prevent renewable DGs from disconnecting during a disturbance. During a fault-induced low voltage condition, instead of ceasing the DGs and interrupting the downstream loads due to the conventional protection intervention, an island can be formed so that the DGs remains energized to power the downstream loads. Once the disturbance is cleared, the DGs and loads will be reconnected to the main grid. Such a process is known as an autonomous self-healing microgrid, where a high reliability and high power quality can be achieved during the process. In fact, the system configuration for an intentional island, which is also referred to as a microgrid, is presented in IEEE 1547-2018 [
9].
In order to achieve an autonomous self-healing microgrid, one of the main challenges is the design of a cost-efficient microgrid protection scheme that can isolate faults from both ends of the supply. Generally, renewable DGs are integrated at the distribution network where overcurrent protection is commonly used by utilities to achieve cost saving. However, many researchers reported that such traditional overcurrent protection is no longer suitable for use for microgrid protection, especially for inverter-based DGs (IBDGs) such as solar photovoltaic (PV) and wind turbine [
10,
11,
12]. The main reason for this is because the fault current magnitude contributed by IBDG is limited by the inverter control and may therefore not be sufficient to be picked up by the overcurrent relays. According to [
13,
14,
15], the fault current responses from IBDG are generally limited to around 1 to 2 p.u. only. In fact, the fault currents for most of the commercial PV generators are only up to 120% of the rated current, as mentioned in [
16]. From IEEE 1547.6-2011, the inverter fault current contribution is typically limited by the resident controls to 125% or less of the rated current [
17]. As such, the traditional overcurrent protection, requiring a high fault current for detection, may not be effective when dealing with IBDG. Therefore, there is an urge to resolve this issue, as microgrid protection based on a directional overcurrent relay (DOCR) is still the most cost-effective way to achieve an autonomous self-healing microgrid considering the large amount of line sections and the short length of each line sections in a distribution network.
In light of the above concerns, a novel fault current control with RCI, also known as an RCI control for microgrid protection based on a directional overcurrent relay (DOCR), is proposed in this paper to achieve a decentralized control, autonomous self-healing microgrid. The fundamental working principle of the proposed RCI control is to inject the correct fault current vector, albeit with a limited magnitude that is able to be detected by the DOCR. The paper is organized so that the various RCI controls available in the literatures are first presented. The performances of all these controls in delivering an efficient microgrid protection based on a directional overcurrent relay will then be evaluated using a simple test network, where it will be shown that these RCI controls faced difficulties in delivering an effective microgrid protection based on DOCR. As such, a novel RCI that is compliant with the latest grid code requirement will be subsequently proposed and tested. In addition, the effectiveness of the proposed RCI control is also tested using the IEEE 16 bus test system with a set of random parameters such as variations in the IBDG location, fault location, load capacity and load power factor. Moreover, the reliability of the proposed RCI control under changing weather conditions is also verified.
2. Fault Current Analysis for Synchronous DG and IBDG
This autonomous self-healing microgrid protection based on the overcurrent principle will rely heavily on the fault current contribution from DG. Therefore, it is important to identify the differences in the fault current contribution between synchronous DG and IBDG.
Figure 1a,b show the schematic diagrams for the fault current analysis on synchronous DG and IBDG, respectively. Z1, Z2 and Z3 represent the line impedances, while F1, F2, F3 and F4 represent the faults that occur at different locations.
The fault current characteristic for a synchronous generator is well-known and can be represented by using the below equation:
where
is the fault current generated by DG for the fault at
(
n = 1,2,3…).
The fault current is several times higher than the rated current, and it is highest when the fault occurs nearest to the synchronous generator, which is denoted as F1. For more distant fault locations, the fault current is reduced due to the line impedances. The fault current characteristic of the synchronous generator is straightforward, in a decaying trend as the fault location moves further away.
In contrast, the fault current magnitude from IBDG had been widely reported to be near to its rated current and is also a lot more complicated since it is dependent on the RCI controls. From [
18], it was presented that there are a large number of possible RCI controls/fault current controls. However, these vastly different fault current controls had been widely reported to result in difficulties for the microgrid protection based on DOCR, as the need for the IBDG-generated fault current to be picked up by the DOCR is not the priority in an inverter design. Besides that, the constantly evolving grid codes also provided opportunities for new control methods to be implemented as long as they are compliant with the grid code requirements [
19,
20]. Examples of several obtained possible fault current characteristics with RCI are shown below [
21,
22,
23,
24]:
Thus, these various types of fault current controls that comply with the latest grid code requirements and their ability to deliver a sufficient fault current for microgrid protection based on DOCR have to be further explored.
3. Reactive Current Injection (RCI) Controls
Following the wide scale development of IBDG, new grid code requirements had emerged to ensure the smooth integration of IBDG into the power distribution network. One of these grid code requirements that will significantly impact the protection operation is the behavior of IBDG during a fault, commonly referred to as low voltage ride through (LVRT) and reactive current injection (RCI) requirements. LVRT requires IBDG to stay connected during a fault for a certain duration. Simultaneously, RCI takes place to minimize the voltage drop and to ensure a fast voltage recovery after a fault [
25]. These latest grid code requirements will be considered for the microgrid protection, especially the fault current controls involved in fulfilling the RCI requirement. The RCI requirement during a fault are presented in
Figure 2, according to German grid codes [
19].
The reactive current is injected based on the voltage level detected at the terminal of the PV generator where
represents the reactive current and
represents the nominal current. When the voltage level lies in the deadband (±10%) region, a reactive current injection is not needed. If the voltage level rises more than 10%, the IBDG needs to consume a reactive current. In contrast, when the voltage level drops more than 10%, the IBDG needs to inject a reactive current depending on the droop (k) setting. For a voltage drop of more than 50%, the reactive current injection required is at least 100% of the rated current. Alternatively, the RCI requirement can be represented by using following equation:
where the
y-axis is represented by the reactive current,
, while the
x-axis is represented by the IBDG terminal voltage,
, and the droop,
≥ 2 p.u.
It can be seen that most of the grid codes only state the requirement for the reactive current injection, whereas the requirements and limitations for the active current are not defined [
23]. Therefore, this provides flexibility for the implementation of different controls as long as it satisfies the grid code requirements. However, with unlimited possibilities of these controls techniques, the fault current generated by some or all of the controls may not be able to satisfy the minimum setting current in DOCR relays. As such, it is essential to investigate the suitable RCI control that can be used in conjunction with DOCR. It must be noted that the fault currents detected by DOCR are a combination of active and reactive currents, which can be represented using the below equation:
where
represents the fault current,
is the active current and
is the reactive current.
Generally, the various presently available RCI controls are listed below [
21,
22,
23,
24]:
Variable Active Current Control
Constant Active Current Control
Constant Active Power Control
where
is the maximum current limit that prevents the inverter from overcurrent damage,
is the active current ratio,
is the nominal current and
is the active power ratio.
4. Test Network and Simulation Setup
A test network for the microgrid protection based on DOCR was developed in DIgSILENT Power Factory, as illustrated in
Figure 3. The test network consists of a 33/11 kV 47 MVA transformer, three identical lines (Line 1, 2 and 3), and three loads (Load 1, 2 and 3). An IBDG, which is represented by a PV generator rated at 4.5 MVA and operates at a unity power factor, is connected at Terminal 4 through an 11/0.4 kV 5 MVA transformer. The maximum fault current of the PV generator has been limited to 1.2 times its rated current, in accordance with [
16]. Moreover, the selection of the droop,
has been chosen as 2 for this simulation purpose.
The working principle of the proposed microgrid protection schemes is non-conventional. In the existing microgrid that had widely been proposed [
26,
27,
28], their boundaries have to be predetermined and are firmly fixed. In contrast, the autonomous self-healing microgrid proposed here will deliver a flexible boundary microgrid system, where a high emphasis is placed on minimal interruptions to the customers. From
Figure 3, R1, R3 and R5 represent the existing DOCR that operate in response to a fault current from the grid. Meanwhile, R2, R4 and R6 are the additional main and backup DOCR that are required at the end of every line sections in order to react to the fault current from the PV generator. With this configuration, only the faulted line section will be isolated. The microgrid can remain energized in islanded mode, and the fault clearing process will not cause a supply interruption to any of the connected loads. For instance, when a fault occurs at Line 1, R1 and R2 will operate to isolate the fault. Subsequent to the fault clearing process, Load 1 will be energized by the grid, while the PV generator will supply electricity for both Load 2 and Load 3.
In order to realize a functional microgrid, the PV generator capacity is assumed to be greater than or equal to the total load capacity. In this case, Loads 1, 2 and 3 are all set to 1.5 MVA with a 0.85 power factor, as suggested in [
29]. Meanwhile, the pickup current settings (
) for relays R2, R4 and R6 are set to 100% of the PV-rated current and 90°–30° relay characteristic angles (RCAs) are chosen to be used in the reverse direction DOCR. It must be noted that only the additional relays (R2, R4 and R6) that respond to the fault current from the PV generator are tested in this paper. The existing relays (R1, R3 and R5) are assumed to be well-coordinated as per the conventional single source radial grid and will therefore not be discussed in this paper. Besides that, a higher impedance fault is out of scope in this research, as the voltage sag it caused is above 0.9 p.u. and will fall inside the RCI deadband region of
Figure 2.
5. Performance Evaluation for the Presently Available RCI Controls
In this section, several existing RCI controls listed above will first be analyzed to evaluate its performance in achieving an efficient microgrid protection based on DOCR.
5.1. Case Study Using Variable Active Current Control
In order to evaluate the performance of the various RCI controls toward microgrid protection based on DOCR, case studies considering three-phase faults were introduced at the midway of Line 1 with fault resistances of 0, 0.5 and 1 Ω, respectively. The amount of fault current detected at each of the reverse direction relays (R2, R4 and R6) will be shown in detail, especially the active and reactive fault currents involved.
The first case study starts by using the variable active current control.
Figure 4 shows the fault current measured by relays R2, R4 and R6 at different fault resistances, where
represents the relay pickup current setting,
represents the active fault current from the PV generator,
represents the reactive fault current from the PV generator,
represents the reactive fault current from the grid and
represents the fault current. In addition, the fault currents, specifically active current (
) and reactive current (
) consumed by the loads (Loads 3 and 2) for different fault resistances, are depicted in
Figure 5.
From
Figure 4a, it can be seen that at a 0 Ω fault resistance, the PV generator injects a reactive fault current (
) up to its limit (120%), so as to fulfill the RCI requirement. It can be seen that the amount of fault current detected from the relay R6 up to the main relay R2 remains the same. This is because at a low fault resistance, Load 3 and Load 2 do not consume any fault current (active or reactive current), which is also shown in
Figure 5. The entire fault current will flow toward the fault location. In this case, the fault current detected by the main relay R2 and backup relays (R4 and R6) is greater than the pickup current (
) setting, which will allow the main relay (R2) to be triggered first, followed by the backup relays (R4 and R6) in case the main relay (R2) malfunctions.
As the fault resistance is increased to 0.5 Ω, the fault current detected at R6 is lower than the pickup current (
). This is due to the fact that the fault current produced by the PV generator diminishes in accordance to Equation (7), which was defined in the PV inverter control. Furthermore, as the fault current passes through Load 2 and Load 3, certain portions of the fault current (both active and reactive currents) are consumed. From
Figure 4 and
Figure 5, it can be seen that when the fault current flows from R6 to R4, approximately 45 A of
and 28 A of
are consumed by Load 3. The same situation happens when the fault current flows from R4 to R2, where some of the fault current is consumed by Load 2. Consequently, the fault currents detected by the main relay R2 and backup relays (R4 and R6) are lower than the relay pickup current (
) and are unable to activate the DOCR.
Meanwhile, at a 1 Ω fault resistance, the fault current detected at R6 is higher when compared to the previous fault current simulated at 0.5 Ω. However, it is still below the pickup current () threshold, which is insufficient to trigger the relay operation. Besides that, it can be observed that the injected reactive fault currents () from the PV generator detected by R6 at a 1 Ω fault resistance are lower than the reactive fault currents () detected by R6 at a 0.5 Ω fault resistance. The reason for this is because at a higher fault resistance, the voltage drop is smaller, which will reduce the reactive fault current () injected, in accordance with Equation (5). In addition, the load will consume more fault current at a higher fault resistance. This will result in a higher depletion of the fault current when it reaches the main relay R2, which will thus be insufficient for triggering the DOCR operation. Referring to the fault current detected by the main relay R2 at a 1 Ω fault resistance, it can be seen that the fault current is entirely dependent on its active fault current (). This is due to the inadequate reactive fault current () after being consumed by the loads. A small portion of the reactive fault current even comes from the grid labeled as to compensate for the negative part of .
5.2. Case Study Using Constant Active Current Control
The same case study is repeated by using a constant active current control. In this case study, the active current ratio (
) is defined as 1 to produce an optimum active current. The fault currents measured by the relays R2, R4 and R6 at different fault resistances are shown in
Figure 6. It must be noted that the amount of fault current consumed by the loads remains the same as that depicted previously in
Figure 5 because the voltage at the load terminal remains the same.
As can be seen in
Figure 6, at a 0 Ω fault resistance, the PV generator produces a maximum fault current, consisting of a reactive current only, as mentioned in the previous case study. The loads do not consume any fault current, and therefore the fault current is sufficient for triggering the main relay R2 and also the backup relays (R4 and R6). On the other hand, at 0.5 Ω and 1 Ω fault resistances, the fault current measured by the relay R6 is greater than the pickup current (
) threshold. However, the fault current seen by the relays R2 and R4 are below the threshold, due to a certain portion of the fault current being consumed by Load 3 and Load 2, which will result in a failure in triggering the relay. It can be also observed that for this control, the active fault currents (
) measured at R6 are the same for both 0.5 Ω and 1 Ω fault resistances.
5.3. Case Study Using Maximum Current Control
Next, for the case study using the maximum current control, the fault current detected by the relays R2, R4 and R6 at fault resistances of 0 Ω, 0.5 Ω and 1 Ω are shown in
Figure 7a–c, respectively. It can be seen that at a 0 Ω fault resistance, the fault current expressed a similar behavior as in the previous case study. With a maximum current control, the fault current injected from the PV generator is at its highest limit, which is 120% of the rated current as detected in R6 regardless of the fault resistance values. For all the fault resistances, only fault currents detected at R6 are above the pickup current (
) threshold. However, the fault currents decrease substantially when reaching R4 and R2, which will cause a failure in triggering the overcurrent protection for 0.5 Ω and 1 Ω fault resistances.
5.4. Case Study Using Constant Active Power Control
For the following case study using a constant active power control, the fault current measured by the relays R2, R4 and R6 at different fault resistances are shown in
Figure 8. In this case study, the active power ratio (
) had been chosen as 1 to maximize the injected active fault current (
). It can be seen that the fault current behavior is quite similar with the previous case study using the maximum current control. The difference is that at a 1 Ω fault resistance, the active fault current (
) detected at R6 is slightly lower, so as to maintain the constant active power. Due to this reason, the fault currents are also slightly lower. Referring to the fault current detected by the main relay R2 and backup relay R4 for both 0.5 Ω and 1 Ω fault resistances, it can be seen that the fault currents are too low after being consumed by the loads (Load 3 and 2), which will cause a failure in triggering the overcurrent relays.
It is worth noting that all of the analyses performed in the above case studies faced the common problem of an inadequate fault current to satisfy the minimum current for the DOCR operation. Although several other literatures had briefly presented the drawbacks of overcurrent protection when used for IBDG [
10,
11,
12], they had not presented the exact reasons. Instead, this section presented the basis of analysis and argument for the reasons. In order to circumvent this problem, a new RCI control will be proposed in the following section.
6. Proposed New RCI Control for Microgrid Protection Based on DOCR
From the previous section, it was shown that all of the existing RCI controls are unable to generate a sufficient fault current for the DOCR operation. Therefore, a new RCI control is proposed here for consideration in achieving an efficient microgrid protection based on DOCR. This proposed control is known as the maximum reactive current control and can be expressed using Equation (11) below:
where
is the maximum current limit that prevents the inverter from overcurrent damage, and
is the nominal current. The working principle of this proposed RCI control aims to trigger the main reverse direction relay by satisfying both the magnitude and directional elements. In order to satisfy the directional element, the current from the PV must flow upwards through the main reverse direction relay. Since most general load consumes a higher amount of real power and lower amount of reactive power, a higher chance of ensuring an upward current flow can be achieved by setting the PV generator to increase its reactive current injection, so that whatever reactive current is left after the load consumption can be injected upwards through the main reverse direction relay, denoted as
in
Figure 9. Naturally, a 100% reactive power injection (maximum reactive current) from the PV inverter presents the best-case scenario for this purpose.
However, the upwards current flow from the PV generator (
) alone is unable to satisfy the magnitude requirements of the DOCR. Fortunately, the proposed maximum reactive current control will prove to be helpful in this scenario. Referring to
Figure 9, by solely injecting the reactive current from the downstream PV generator, the load will be deprived from receiving its much-needed active current from the downstream PV generator. Instead, the active current will now have to be supplied by the grid (
) through the main relay. The combination of both the reactive current (
) from the reverse direction (PV generator) and active current (
) from the forward direction (grid) will now satisfy the magnitude requirement of the DOCR.
8. Sensitivity Analysis Using IEEE 16 Bus Test System with Random Function
In order to further examine the performances of the proposed maximum reactive current control in achieving an efficient microgrid protection based on DOCR, a random function had been developed to formulate 20 scenarios. These scenarios will be tested in the IEEE 16 bus test system [
30], as shown in
Figure 12. The random function comprises of variables such as the PV location, fault location, load capacity and load power factor. The random function is initiated according to the following steps:
A 5MVA PV generator is first randomly chosen to locate among the available buses from B1 to B16.
Then, the possible fault locations will be randomly selected based on the PV generator location. For instance, the PV generator located at B7 will have two possible fault locations, which are between B4–B6 and B6–B7.
Next, for all of the loads (L4–L16), the load capacities are determined between 0 and 1 MVA using the random function: rand [0–1 MVA]. Note that the maximum demand (MD) for each of the loads is constrained to 1 MVA.
Similarly, the load power factors (PFs) are selected using the random function: PF = rand [0.85–1]
The results of the 20 scenarios generated by the random functions are shown in the
Appendix A. In general, the proposed maximum reactive current control generated a sufficient fault current for detection by all the corresponding relays, where the fault currents detected by the corresponding relays at each of the fault locations are above the pickup current setting (
= 126 A), regardless of the fault resistance values. Taking scenario 1 as an example, the location of the PV generator had been randomly chosen to be located at Feeder 2, busbar B11. The fault location that was randomly chosen is located at B8–B9. In this case, the corresponding main relay will be R4. From scenario 1 shown in the
Appendix A, it can be seen that at a 0 Ω fault resistance, the fault current detected by R4 is 150 A, which is higher than the pickup current setting of 126 A. Similarly, the fault currents of 132 A and 131 A are detected by R4 for 1 Ω and 1.5 Ω fault resistances, respectively. In summary, all 3 cases of different fault resistances allow the main reverse direction relay R4 to successfully isolate the fault in Scenario 1. In addition, it can be observed that the fault current seen by relay R4 was reduced significantly from 150 A to 131 A when the fault resistance was varied from 0 Ω to 1.5 Ω. This is because of the current consumed by the constant impedance load, where the current consumed by the load increases with an increasing voltage, leading to a lower fault current seen by relay R4. Thus, it is also shown here that the proposed RCI control for microgrid protection is effective even though some of the fault current is consumed by the load. By comparing all of the scenarios presented in the
Appendix A, it can be observed that scenario 17 presents the best-case scenario, as the detected fault current is the highest. From the comparison, it can be concluded that a lower load capacity and higher load power factor contributed to a higher fault current magnitude for detection by the corresponding main reverse direction relay.
Meanwhile, for the directional element of the relay, the results for scenario 1 show that the angle difference between the operating current and polarizing voltage, when the fault resistance is varied from 0 Ω to 1.5 Ω, fall between 30.55° and 50.88°, which is inside the operating zone of the 90°–30° relay characteristic angle (−60° to +120°). It can be seen that when the fault resistance is 0 Ω, the angle (θ) difference detected by the relay is the lowest. This is because at a 0 Ω fault resistance, the fault current detected is mainly dominated by the reactive fault current from the PV generator, while the active fault current is negligible. As the fault resistance value increases to 1 Ω and 1.5 Ω, the angle (θ) detected by the relay increases as the active fault current contribution from the grid increases. Besides that, it can be observed that scenario 17 shows the least angle difference when the fault resistance is varied from 0 Ω to 1.5 Ω, which is only from 30.55° to 31.23°. This is because the active fault current contribution from the grid is insignificant due to the minimal load capacity of L7. In addition, it can be seen that the case scenarios with a higher load capacity and lower load power factor yield a higher angle difference.
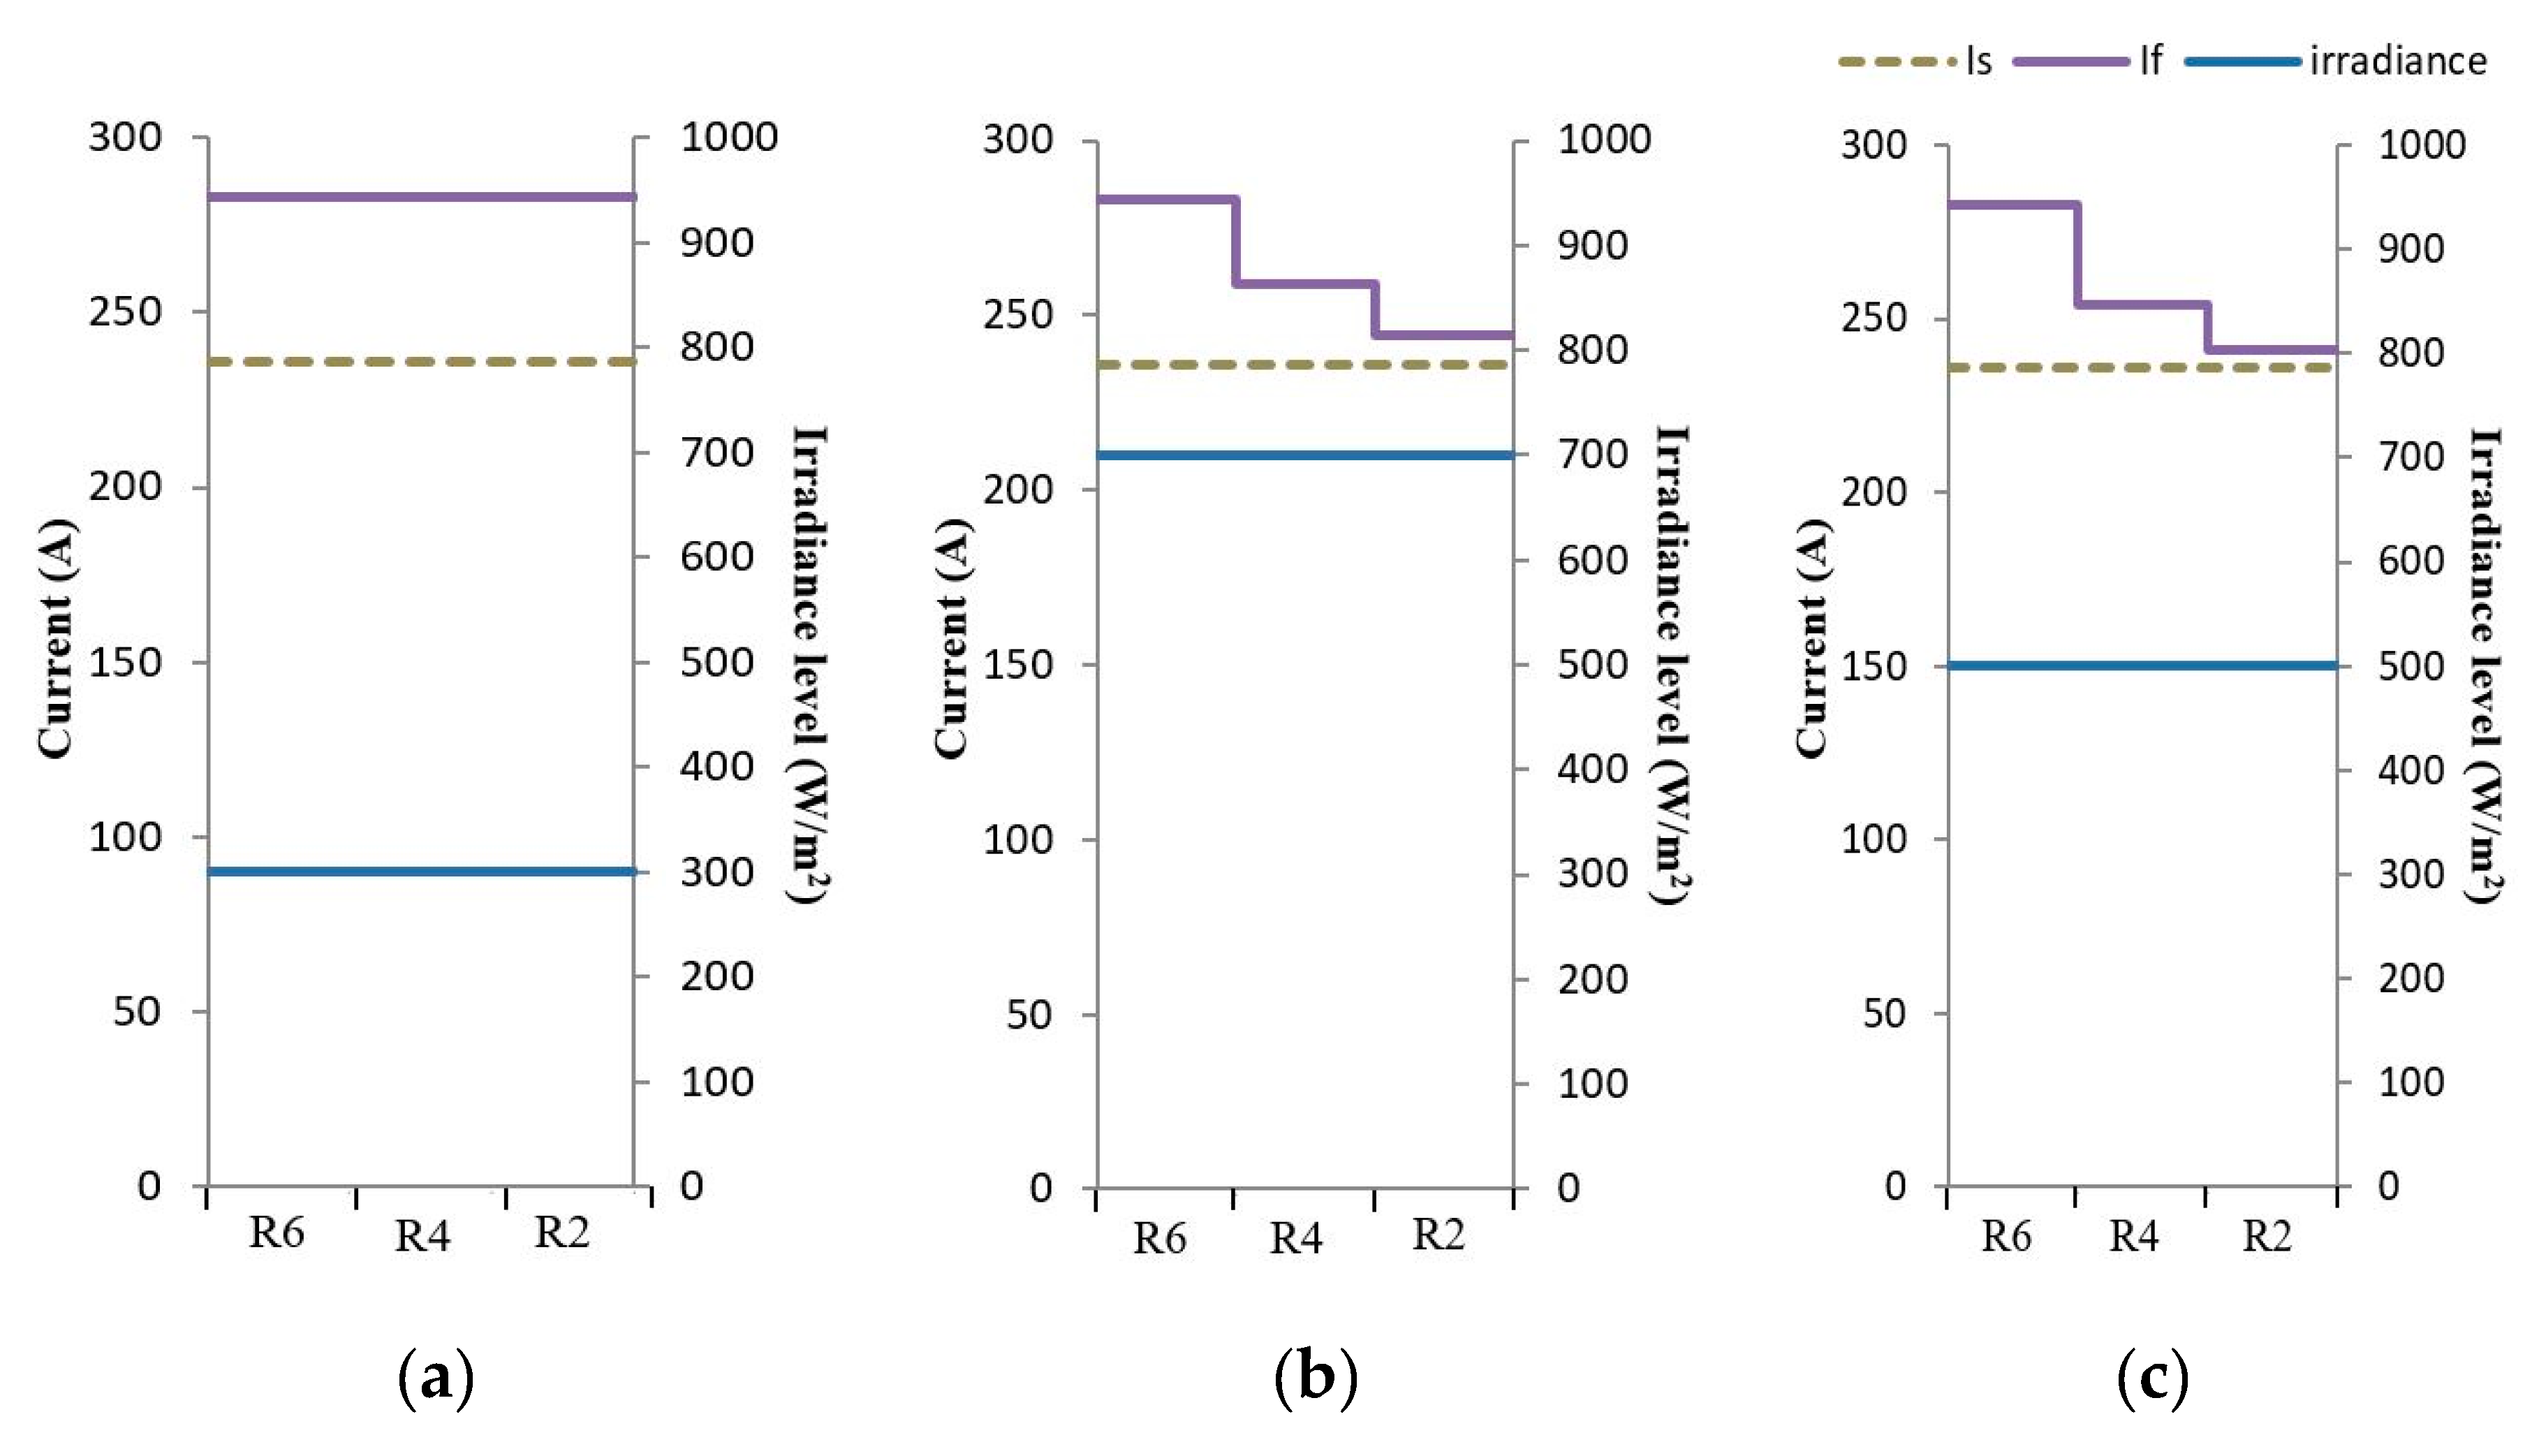
9. Performance Evaluation under Changing Weather Conditions
It is a well-known fact that the powers injected from IBDG are of an intermittent nature due to the varying weather conditions that affect the solar irradiance and wind speed [
31]. The intermittency of such IBDG may have a considerable impact on the reliability and performance of the proposed microgrid protection system [
32]. As such, it is essential to investigate the reliability and performance of the proposed RCI control toward microgrid protection based on DOCR under varying weather conditions.
This can be achieved by repeating the case study that had been conducted in
Section 5, by varying the solar irradiance level. As shown in
Figure 13, a solar irradiance of 300, 700 and 500 (W/m
2) had been applied at different fault resistances of 0 Ω, 0.5 Ω and 1 Ω, respectively. Contrary to the reported concerns in [
30], it can be observed that the fault current levels are not affected and instead remain above the pickup current threshold throughout the case study when the solar irradiance level is changed. This is because the change of the solar irradiance level will only affect the real power (active current) but not the reactive power (reactive current) [
33]. Since the proposed RCI control only injects a reactive fault current, the change of weather condition will therefore not affect its performance.


