Article

Optimal Thermal Insulation Thicknesses of External Walls Based on Economic and Ecological Heating Cost

Faculty of Mathematics, Computer Science and Econometrics, University of Zielona Góra, ul. Licealna 9, 65-417 Zielona Góra, Poland
Energies 2019, 12(18), 3415; https://doi.org/10.3390/en12183415
Submission received: 14 August 2019 / Revised: 29 August 2019 / Accepted: 2 September 2019 / Published: 4 September 2019
(This article belongs to the Section G: Energy and Buildings)

Abstract

:
The present study introduces the concept of ecological cost of heating modeled on the economic cost of heating. A method of determining these costs is also proposed. This method allows for an analytical description of the ecological as well as economic net present value of a thermal insulation investment. Consequently, it is possible to determine the optimal values for ecological reasons of the heat transfer coefficient of the building external wall and the thickness of thermal insulation. The present study uses life-cycle assessment (LCA) analysis to determine the environmental impact of thermal insulation materials used to insulate the external vertical wall and to determine the environmental impact of thermal energy production in the energy phase of the building’s life cycle. Various variants characteristic of Polish conditions were studied. Different types of construction materials of the wall, types of heat sources, thermal insulation materials and climate zones occurring in Poland were considered. For all analysed variants, the obtained thermal insulation thickness, optimum for ecological reasons, was much larger than the optimum for economic reasons. Even at the thickness of thermal insulation optimum for economic reasons, the investment was profitable for ecological reasons, i.e., a reduction in environmental load was obtained as a result of the thermal insulation investment. On the basis of the conducted study, it can be concluded that it is preferable to use thermal insulation thicknesses larger than required by current regulations and larger than optimum for economic reasons. The ecological benefits of thermal insulation investments are then significantly greater, with not much smaller economic benefits.

1. Introduction

It is very important to study the possibilities of reducing buildings’ energy demand [1,2,3,4]. One of the methods to reduce the consumption of thermal energy in a building is the thermal insulation of external walls. Thermal insulation investments are evaluated in terms of economic benefits. They can and should also be assessed in ecological terms. In the literature on the subject, it is possible to find a lot of articles that develop methods for assessing thermal insulation in economic terms. They are usually based on information on the so-called degree-days of the heating period. Using them, it is possible to determine the optimal thickness of thermal insulation for economic reasons, i.e., the one at which the highest net present value (NPV) of investment is obtained (see, for example [5,6,7,8]).
Unfortunately, buildings and the construction sector are responsible for about 45% of global CO2 emissions [9]. Therefore, the methods to reduce the environmental impact of buildings should be explored. The present study introduces ecological heating cost on the model of economic heating cost (introduced in the paper [10]) and proposes a method for their determination. It allows for an analytical description of the ecological as well as economic net present value of a thermal insulation investment. Consequently, the optimal thickness of thermal insulation can be determined for both economic and ecological reasons. Using the introduced method, various cases characteristic for Polish conditions were examined. Various variants were taken into account: structural material of the wall, type of heat source and thermal insulation material. Various climate zones occurring in Poland were also taken into account.
The present study was divided into the following sections. The second section describes the economic assessment method and introduces the ecological assessment method for a thermal insulation investment. Among others, the indicator of ecological heating cost was defined, which allows determining the optimum for ecological reasons values of the heat transfer coefficient of the building external wall and the thickness of thermal insulation. The third section presents the results of research for various variants of thermal insulation investment, using the methods from Section 2. The fourth section discusses the results obtained, in particular in the context of the profitability of the investment for economic and ecological reasons. Finally, the conclusions of the research were presented.

2. Materials and Methods

The thermal insulation of the building’s vertical external walls can be treated as an investment that is expected to bring economic benefits. It is also possible to evaluate such an investment in an analogous way using the life cycle assessment (LCA) for ecological reasons.

2.1. Economic Assessment of a Thermal Insulation Investment

For the assessment of a thermal insulation investment for economic reasons, the net present value NPV of the investment may be used, in relation to 1 m2 of the wall area, described by the equation [7]:
NPV = −(Km·d + Kw) + SN·G0·(U0U) [PLN/m2]
where:
  • Km—cost of 1 m3 of thermal insulation material [PLN/m3], (4.3 PLN ≈ 1 EUR),
  • Kw—cost of making thermal insulation of 1 m2 of the building wall area [PLN/m2],
  • d—thickness of a thermal insulation layer [m],
  • S N = j = 1 N ( 1 + s ) j ( 1 + r ) j —cumulative discounting factor,
  • N—number of years of using thermal insulation,
  • r—real annual interest rate,
  • s—real annual increase (in percent) of heating cost,
  • G0—annual economic cost of heating, related to 1 m2 of the area of the external wall in question [(PLN·K)/(W·y)],
  • U0—heat transfer coefficient of the wall without a thermal insulation layer [W/(m2K)],
  • U—heat transfer coefficient of the wall with a thermal insulation layer [W/(m2K)].
The first component of Equation (1) is related to the economic costs of investment, and the second to economic profits.
The dependence between d and U is described by the equation:
d = λ · 1 / U 1 / U 0   [ m ]
where:
  • λ—thermal conductivity of the thermal insulation material [W/(m·K)],
  • others—as described earlier.
The key is to estimate the annual economic cost of heating (G0). Using the dependency
G0 (U0Un) p = Kc·(DUoDUnpu [PLN/y]
in the work [10] the following was proposed:
G 0 = D U o D U n U 0 U n · p u p · K c [ ( PLN · K ) / ( W · y ) ]
where:
  • Un—0.23 [W/(m2K)] since 2017 required value (maximum allowed value) of the heat transfer coefficient of the wall with a thermal insulation layer (according to [11]),
  • DU—annual energy demand for heating per 1 m2 of usable floor area of the building, with the heat transfer coefficient U [kWh/(m2y)], (DUo at U0 and DUn at Un, respectively),
  • pu—usable area of the building [m2],
  • p—area of external vertical walls [m2],
  • Kc—cost of generating heat for a particular heat source and fuel [PLN/(kWh)],
  • others—as described earlier.
It should be noted that on the basis of regulation [11] (and based on Equation (2)), the thickness of thermal insulation should be at least:
dn = λ·(1/Un − 1/U0) [m].
The NPV indicator (see Equation (1)) as a function of the variable U is a strictly concave function bounded from above. Therefore, knowing the heating cost (G0) it is possible to determine on the basis this equation for which value of the U coefficient NPV reaches the maximum value. Let us denote it by Uopt (see [7]):
U o p t = λ · K m G 0 · S N   [ W / ( m 2 K ) ] .
More precisely, Uopt is the value for which the partial derivative of the NPV function relative to the variable U is equal to 0. Consequently, the optimal thickness of thermal insulation for economic reasons (see Equation (2)) corresponding to Uopt is:
d o p t = λ · 1 / U o p t 1 / U 0   [ m ] .
Moreover, the energy demand for heating (DUopt) of a building with the heat transfer coefficient Uopt (obtained from Equation (6)) and at the annual heating cost Go (determined from Equation (4)) can be determined as follows:
DUopt = DUoG0·(U0Uopt)·(p/pu)/Kc [kWh/(m2y)].

2.2. Ecological Assessment of a Thermal Insulation Investment

This section proposes a new method for evaluating a thermal insulation investment for ecological reasons. In particular novelty is the formula for the ecological heating costs GE and formulas in which GE occurs. This method is modelled on the method in Section 2.1. The so-called ecological heating cost, determined using LCA analysis, was implemented.
To evaluate the thermal insulation investment for ecological reasons, ecological net present value of the investment NPVE is proposed (see [12]):
NPVE = − Kl·d + N·GE·(U0U) [Pt/m2]
where:
  • Kl—result of LCA analysis for 1 m3 of thermal insulation material [Pt/m3],
  • GE—annual ecological heating cost, related to 1 m2 of the area of the external wall in question [(Pt·K)/(W·y)],
  • others—as described earlier.
The first component of Equation (9) is related to the ecological costs of investment, and the second to ecological profits.
As with economic analysis, it is crucial to estimate the annual ecological heating cost (GE). These types of cost must meet the condition:
GE (U0Un) p = Ke·(DUoDUn) pu [Pt/y].
Let us note that on the right side of equality we have the difference: the annual environmental load resulting from heating, with a heat transfer coefficient Uo (for building external wall without thermal insulation) and the annual environmental load resulting from heating, with a heat transfer coefficient Un:
DUo·pu·KeDUn·pu·Ke [Pt/y].
The condition (10) gives:
G E = D U o D U n U 0 U n · p u p · K e   [ ( Pt · K ) / ( W · y ) ]
where:
  • Ke—LCA analysis result of obtaining 1kWh of thermal energy for a particular heat source and fuel [Pt/(kWh)],
  • others—as described earlier.
The proposed approach allows for obtaining analytical dependence of NPVE on U, similar to NPV. The ecological net present value NPVE treated as a function of the U variable is also a strictly concave function bounded from above. As in the case of NPV, it is possible to determine its maximum value due to U, let us denote it by UEopt:
U E o p t = λ · K l G E · N   [ W / ( m 2 K ) ]
More precisely, UEopt is the value for which the partial derivative of the NPVE function relative to the variable U is equal to 0. As a consequence, the optimum thermal insulation thickness for ecological reasons (from Equation (2)) is:
d E o p t = λ · 1 / U E o p t 1 / U 0   [ m ] .
Moreover, the DUEopt energy demand for heating of a building, with the UEopt heat transfer coefficient (determined from Equation (13)) and the annual ecological heating cost GE (determined from Equation (12)) can be determined from the equation:
DUEopt = DUoGE·(U0UEopt)·(p/pu)/Kc [kWh/(m2y)].

3. Results

This section presents the results of study performed using the methods described in Section 2. The study took into account different variants specific to Polish conditions.

3.1. Data Accepted for the Analysis

An exemplary single-family, two-story residential building (with usable attic) and a partial basement, intended for a family of 4–6 people, with usable area of pu = 140.20 m2, surface of external vertical walls p = 206.61 m2 and volume of 376.14 m3 was accepted for the analysis [10]. Depending on the type of heat source, the value of heat generation efficiency was assumed: hard coal boiler—82%; condensing gas boiler—94%; electricity boiler—99%; heat pump—350% (seasonal coefficient of performance (SCOP) = 3.5).
The most important data for the examined variants regarding the wall construction materials, thermal insulation materials and heat sources are presented in Table 1.
Poland is divided into five climate zones, marked from I to V (see [13]). Due to large differences in heat energy demand depending on the zone, the study took into account the location of the building in zones I, III and V. Due to the location of meteorological stations, the following were selected for analysis: for zone I (the warmest)—the city of Szczecin; for zone III (medium)—the city of Kielce; and for zone V (the coldest)—the city of Suwałki.
To calculate the amount of energy demand for heating DU (in accordance with [13]), the CERTO program [14] was used, developed by the Lower Silesian Energy and Environment Agency to perform energy certification of buildings. Table 2 shows the determined demand for a building without thermal insulation DUo (with different Uo values depending on the wall construction material) and with thermal insulation DUn (with Un = 0.23 [W/(m2K)]). The results are given depending on the climate zone in which the building is located.
It can be noticed that there are significant differences in the energy demand of the same building, but located in different zones in Poland. In zone V, this demand is greater than in zone I by about 1/3. Considering buildings without thermal insulation, located in the same zone, but differing in the construction material of the wall and, as a consequence, the value of Uo, the demand in the case of lime and sand blocks (LSB) is more than twice as high as in the case of cellular concrete (CC).
The expected lifetime of the thermal insulation, N, was assumed to be 25 years, and interest rates r = 5% and s = 2%. In the subject literature there are also longer utility periods of considered thermal insulation materials assumed.

3.2. Life-Cycle Assessment (LCA) Analysis

Life-cycle assessment (LCA) methodology has been standardized based on the ISO 14040 and the ISO 14044 standards [15,16]. LCA analysis consists of four main stages: Goal and scope definition; Life-cycle inventory; Life-cycle impact sssessment; Interpretation. It can be used, among others, in issues related to energy and construction.
The present study uses LCA to determine the environmental impact of building insulation materials used to insulate the external vertical wall. The product system includes the phase of production of thermal insulation materials along with the phase of obtaining raw materials and energy for their production and the phase of use (the so-called energy phase). This phase is related to the thermal conductivity of individual materials, which affects the building’s energy demand. Different thicknesses of the thermal insulation layer were considered in the study, therefore 1 m3 of material was adopted as the functional unit for thermal insulation materials. LCA was also used to determine the environmental impact of thermal energy production in the building use phase. The production of 1 kWh of thermal energy was adopted as a functional unit.
SimaPro 7.1 [17] was used to perform the LCA analysis. This program has a database relating to average conditions in Europe, which is particularly important in terms of its use in Poland. The present study uses the Ecoindicator 99 procedure. This procedure allows for the unambiguous assignment of eleven impact categories to three categories of damage and thus allows assessing the impact on: human health, environmental quality and consumption of natural resources. It also enables weighing and presentation of the final LCA result in the so-called ecopoints Pt (the value of 1 Pt represents 103 annual environmental load of one inhabitant of Europe).
Table 3 summarizes the results of the LCA analysis for thermal insulation materials and heat sources in the building under consideration.

3.3. Economic Analysis

This subsection uses the method described in Section 2.1. and data from Section 3.1. First, the annual economic heating cost (G0) was determined using Equation (4) for the considered variants. The G0 value depends on the building parameters without thermal insulation, the climate zone and the heat source used (see Table 4). The heat source and associated Kc have the greatest impact on G0 (see Table 1).
For known Go cost, it is possible to determine from the Equation (6) the economically optimum value of the heat transfer coefficient (Uopt). The results are presented in Table 5. For most variants, Uopt smaller than Un, with the lowest Uopt values obtained (marked with bold) for variant electricity boiler-polystyrene (EB-EPS) (the highest cost of heat generation Kc and the lowest cost of thermal insulation material Km). In some cases, e.g., for variants coal boiler-polyurethane (CB-PUR) and heat pump-polyurethane (HP-PUR) we have at the same time a low cost of heat generation Kc (CB and HP) and a relatively expensive thermal insulation material Km (PUR) (see Table 1). As a consequence, Uopt greater than Un in all climate zones was obtained for these variants. As expected, it was observed that the colder the climate zone, the lower the Uopt value (see Table 5).
On the basis of the determined Uopt it is possible to calculate the optimum thickness of the thermal insulation for economic reasons dopt (from Equation (7)) and the demand DUopt (from Equation (8)). Table 6 gives the calculated thermal insulation thicknesses. As noticed, the thickness variation is very large, as are the heat transfer coefficients. It depends significantly on all four factors being taken into account. The energy demand for heating obtained from Equation (6) (with Uopt coefficient) was also determined for comparison using the CERTO program. The error in estimation of DUopt from Equation (6) in relation to the results obtained in the CERTO program did not exceed ±0.5%.

3.4. Ecological Analysis

This section presents the results of the ecological analysis carried out using the method introduced in Section 2.2. Initially, the annual ecological cost of heating (GE) was determined from Equation (12). As in the case of G0, the GE value depends on the heat source and climate zone used as well as on the building parameters without thermal insulation (see Table 7). The heat source and associated Ke have the greatest impact on GE (see Table 3).
For known cost GE, it is possible to determine the optimum for the ecological reasons value of the heat transfer coefficient (UEopt) (from Equation (13)). The results are presented in Table 8. It should be noted that UEopt was smaller than Uopt and much smaller than Un for all cases.
For determined UEopt, it is possible to define optimum for ecological reasons thermal insulation thicknesses (dEopt) (from Equation (14)) and demand DUEopt (from Equation (15)). Table 9 gives the calculated thermal insulation thicknesses. For the same variants, insulation thicknesses optimal for ecological reasons are much greater than the optimum for economic reasons. In some cases, they are even more than 0.5 m (e.g., variants EB-EPS, EB-MW).

4. Discussion

There are several aspects to consider when analysing the results from the previous section. During economic analysis, it turned out that for some variants the optimal thickness of thermal insulation does not guarantee obtaining the required value of the heat transfer coefficient (Uopt > Un = 0.23 W/(m2K) was obtained). This can happen when the cost of heat generation is low (heat sources CB and HP) and at the same time the cost of the insulation material is high (PUR). It should also be noted that the type of wall construction material practically has no effect on the Uopt coefficient obtained (see Table 5). Of course, the optimum thickness of thermal insulation dopt depends significantly on the structural material of the wall through the Uo coefficient (see Equation (7)).
However, taking into account the results of the ecological analysis, UEopt < Un = 0.23 W/(m2K) was obtained in each studied variant. For some variants, thermal insulation thickness optimum for ecological reasons (even approx. 0.5–1 m) is impossible for technical reasons.
Due to the above observations, it was decided to check more closely what the relationship between NPV, NPVE and U values are. Table 10 gives the NPV values (see Equation (1)) obtained for U = Un. It should be noted that negative values (CC-CB or CC-HP) were obtained for some variants (marked with bold). The highest values were obtained for the LSB-EB variant. In this variant, the LSB wall has the worst (largest) Uo coefficient before thermal insulation. However, heating with the use of EB heat source is characterized by the highest cost value Kc among the considered heat sources.
The NPVE values (see Equation (9)) for U = Un are given in Table 11. It should be emphasized that positive values were obtained for all variants. As in the case of NPV, the structural material of the wall and the heat source used have the greatest impact on the NPVE value. Again, definitely the highest values were obtained for the LSB-EB variant (marked with bold), because the LSB wall has the worst Uo coefficient. Moreover, heating with the use of EB heat source is characterized by the highest value of Ke cost from all considered heat sources. The type of thermal insulation material has the least impact on the NPVE value.
Next, NPV and NPVE values were determined for U = Uopt. Of course, NPV (Uopt) > NPV (Un) was obtained for each variant. Similarly to U = Un, positive NPVE values were obtained for all U = Uopt. It should also be noted that with Uopt < Un, NPVE (Uopt) > NPVE (Un) was obtained and vice versa. The biggest difference, for all structural materials of the wall and climate zones, between NPVE (Uopt) and NPVE (Un) was obtained for variant EB-EPS. For this variant, the lowest Uopt values were found (see Table 5).
Finally, NPV and NPVE values were determined for U = UEopt. In the case of NPV, the value significantly depends on all the parameters taken into account. For example, for variant CC-CGB-PUR, NPV (UEopt) < 0 was obtained, and for variant CC-CGB-EPS NPV (UEopt) > 0 was obtained in each climate zone. In the case of NPVE, already with U = Un for each variant NPVE (Un) > 0, therefore also NPVE (UEopt) > 0.
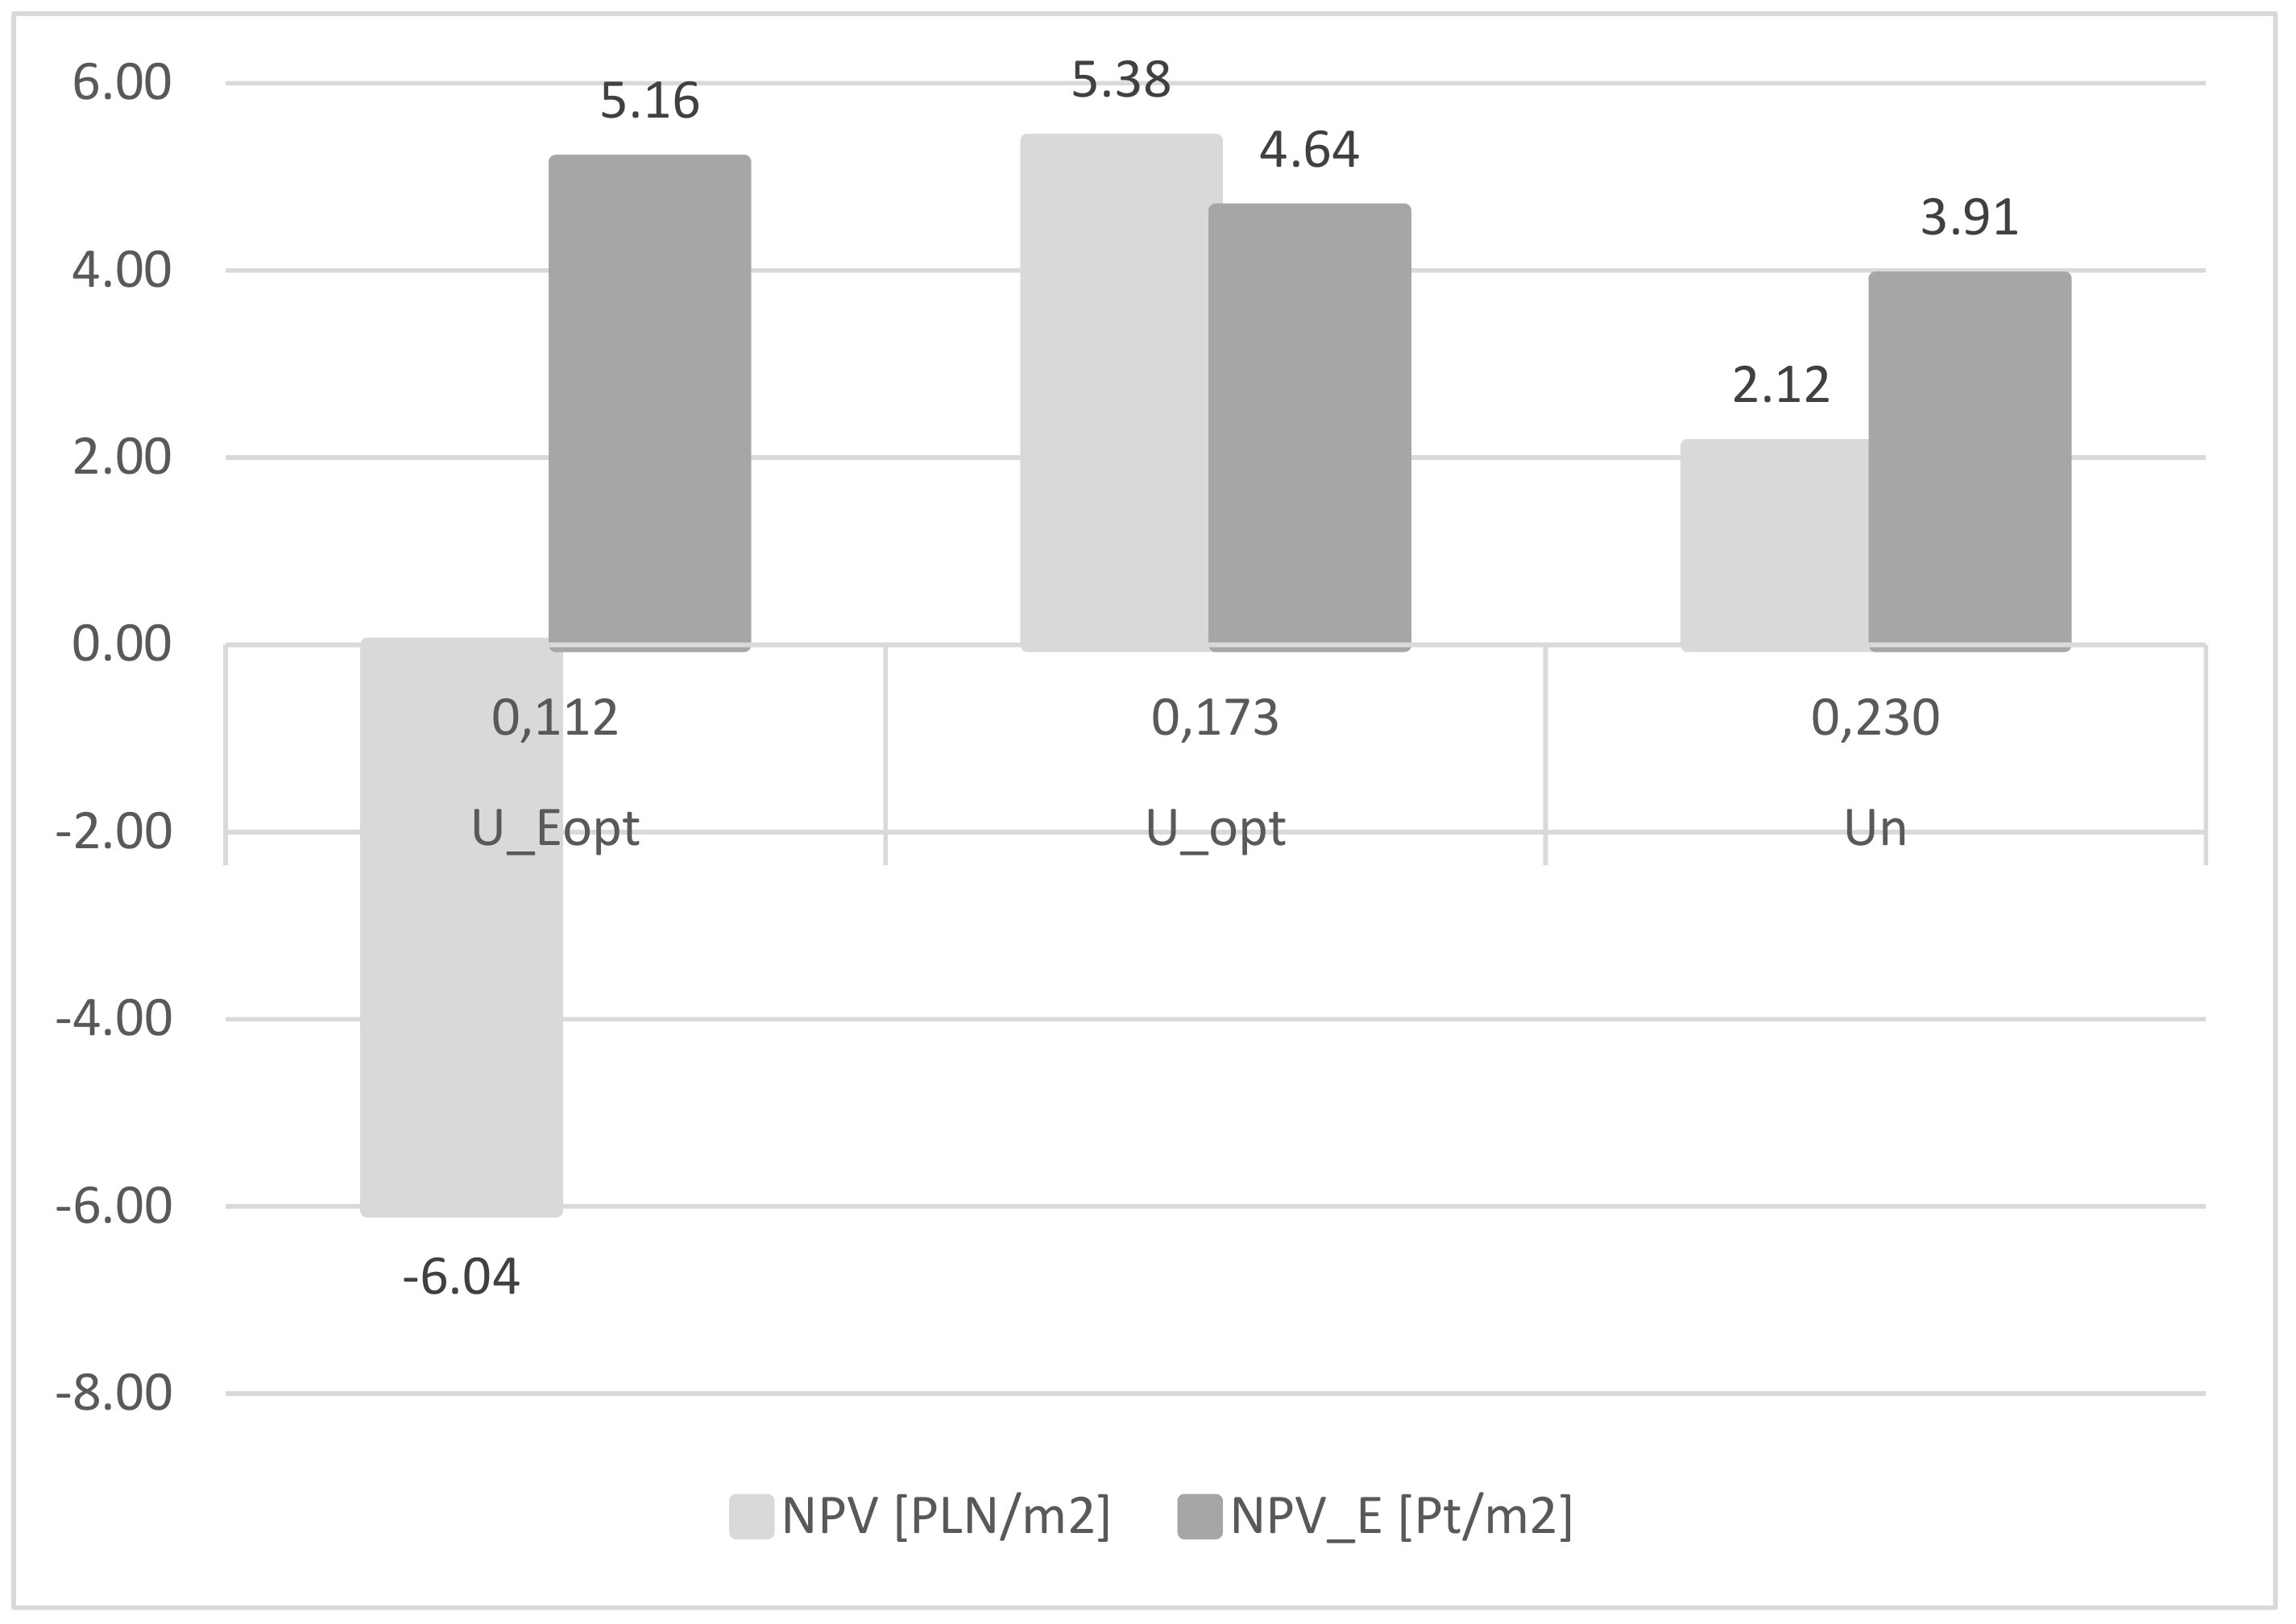
For four selected variants, the NPV and NPVE dependence on U graphs are presented. Figure 1 shows the results for the CC-CGB-MW (Uo = 0.430 W/(m2K)) and climate zone I. It should be noted that in this variant NPV < 0 was obtained for U = UEopt. However, the difference between NPVE (Uopt) and NPVE (UEopt) is small.
Figure 2 shows the results for the ceramic hollow blocks (CHB)-CGB-MW variant (Uo = 1.154 W/(m2K)) and climate zone III. It should be noted that in this variant NPV > 0 was obtained for U = UEopt. Both the difference (in percent) between NPVE (Uopt) and NPVE (UEopt) as well as between NPV (Uopt) and NPV (UEopt) is not great.
The Figure 3 shows the results for variant LSB-CGB-MW (Uo = 1.514 W/(m2K)) and climate zone III. In this case, the situation is similar to the previous option, with the percentage differences being even smaller.
The Figure 4 is for the variant CC-CB-PUR and climate zone III, in which Uopt > Un was obtained. It should be noted that in this variant NPV < 0 was obtained even for U = Uopt.
To sum up, it can be stated that it is profitable to use larger thermal insulation thicknesses than optimum for economic reasons. Greater environmental benefits are achieved, with a slight decrease in economic benefits.

5. Conclusions

The present study proposes a method of determining ecological heating cost, similar to the previously introduced economic heating cost. Thanks to this, it is possible to analytically describe the economic and ecological net present value of the thermal insulation investment and determine the optimal thickness of the thermal insulation for both economic and ecological reasons. For all studied variants, in all climate zones occurring in Poland, the optimal thickness of thermal insulation for ecological reasons was obtained much greater than for economic reasons. For each case, already at the thickness of thermal insulation optimal for economic reasons, the investment was profitable for environmental reasons (NPVE > 0), i.e., a reduction in environmental load was obtained as a result of the thermal insulation investment.
In the subject literature there are also longer utility periods of considered thermal insulation materials assumed. With N greater than 25 years, the investment is more profitable. For each variant, a higher value of optimal thickness of thermal insulation is obtained, both for economic and ecological reasons. It is similar with NPV and NPVE.
On the basis of the conducted study, it can be noticed that it is preferable to use higher thermal insulation thicknesses than optimum for economic reasons. Higher ecological benefits from thermal insulation investment are then obtained, with not much reduction of economic benefits. According to the regulation [11], from 2021 stringent requirements for thermal insulation will apply in Poland. Since this year, the heat transfer coefficient of the external vertical wall cannot be greater than Un = 0.20 [W/(m2K)]. In the light of the carried out research, this is most justified for ecological reasons. The research has shown that specific recommendations for optimal heat transfer coefficient and the thickness of the thermal insulation depends very significantly on conditions such as: type of construction material of the wall, type of heat source, type of thermal insulation material and climate zone in which the building is located.

Funding

This research received no external funding.

Conflicts of Interest

The author declares no conflict of interest.

References

  1. Domínguez, S.; Sendra, J.J.; León, A.L.; Esquivias, P.M. Towards energy demand reduction in social housing buildings: Envelope system optimization strategies. Energies 2012, 5, 2263–2287. [Google Scholar] [CrossRef]
  2. Lilley, S.; Davidson, G.; Alwan, Z. External wall insulation (EWI): Engaging Social tenants in energy efficiency retrofitting in the North East of England. Buildings 2017, 7, 102. [Google Scholar] [CrossRef]
  3. Boostani, H.; Hancer, P. A Model for external walls selection in hot and humid climates. Sustainability 2019, 11, 100. [Google Scholar] [CrossRef]
  4. Zhao, L.; Liu, Z.; Mbachu, J. Energy management through cost forecasting for residential buildings in new zealand. Energies 2019, 12, 2888. [Google Scholar] [CrossRef]
  5. Hasan, A. Optimizing insulation thickness for buildings using life cycle cost. Appl. Energy 1999, 63, 115–124. [Google Scholar] [CrossRef]
  6. Çomaklı, K.; Yüksel, B. Optimum insulation thickness of external walls for energy saving. Appl. Therm. Eng. 2003, 23, 473–479. [Google Scholar] [CrossRef]
  7. Dylewski, R.; Adamczyk, J. Economic and environmental benefits of thermal insulation of building external walls. Building Environ. 2011, 46, 2615–2623. [Google Scholar] [CrossRef]
  8. Kaynakli, O. A review of the economical and optimum thermal insulation thickness for building applications. Renew. Sustain. Energy Rev. 2012, 16, 415–425. [Google Scholar] [CrossRef]
  9. Syngros, G.; Balaras, C.B.; Koubogiannis, D.G. Embodied CO2 Emissions in Building Construction Materials of Hellenic Dwellings. In Proceedings of the International Conference on Sustainable Synergies from Buildings to the Urban Scale (SBE16), Thessaloniki, Greece, 16–19 October 2016; pp. 500–508. [Google Scholar]
  10. Dylewski, R.; Adamczyk, J. Study on ecological cost-effectiveness for the thermal insulation of building external vertical walls in Poland. J. Clean. Prod. 2016, 133, 467–478. [Google Scholar] [CrossRef]
  11. Rozporządzenie Ministra Transportu. Budownictwa i Gospodarki Morskiej z dnia 5 lipca 2013 r. zmieniające rozporządzenie: W sprawie warunków technicznych, jakim powinny odpowiadać budynki i ich usytuowanie; Min. Transportu, Budownictwa i Gospodarki Morskiej: Warsaw, Poland, 2013.
  12. Dylewski, R. Ekonomiczne i ekologiczne koszty ogrzewania oraz optymalna grubość termoizolacji. Systemy wspomagania w inżynierii produkcji. 2017, 6, 68–83. [Google Scholar]
  13. PN-EN 12831 Instalacje ogrzewcze w budynkach—Metoda obliczania projektowego obciążenia cieplnego; Rettig Heating Sp: Warsaw, Poland, 2006.
  14. OPIS: CERTO 14Program do certyfikacji energetycznej budynków—Świadectwo. Available online: http://cieplej.pl/index_daes.php5?dzial=3&kat=14 (accessed on 10 July 2019).
  15. ISO EN 14040:2006—Environmental Management—Life Cycle Assessment—Principles and Framework; ISO: Geneva, Switzerland, 2006.
  16. ISO EN 14044:2006—Environmental Management—Life cycle Assessment—Requirements and Guidelines; ISO: Geneva, Switzerland, 2006.
  17. Sustainability Software for Fact-Based Decisions. Available online: www.pre.nl/simapro (accessed on 15 June 2019).
Figure 1. NPV and NPVE values depending on U for variant CC-CGB-MW and climate zone I.
Energies 12 03415 g001
Figure 2. NPV and NPVE values depending on U for variant CHB-CGB-MW and climate zone III.
Energies 12 03415 g002
Figure 3. NPV and NPVE values depending on U for variant LSB-CGB-MW and climate zone III.
Energies 12 03415 g003
Figure 4. NPV and NPVE values depending on U for variant CC-CB-PUR and climate zone III.
Energies 12 03415 g004
Table 1. Data for construction materials of walls, thermal insulation materials and heat sources.
Type of Construction MaterialCellular concrete 500 kg/m3 (CC)Ceramic hollow blocks MAX (CHB)Lime and sand blocks SILKA E (LSB)
Thickness of Wall [m]0.360.290.24
Heat Transfer Coefficient Uo [W/(m2K)]0.4301.1541.514
Thermal Insulation MaterialPolystyrene EPS (EPS)Mineral wool (MW)Polyurethane PUR (PUR)
λ [W/(m·K)]0.0400.0390.028
Km [PLN/m3]143.00272.00713.00
Kw [PLN/m2]35.0040.0045.00
Heat SourceCoal boiler (CB)Condensing gas boiler (CGB)Electricity boiler (EB)Heat pump (HP)
Kc [PLN/(kWh)]0.1440.2450.5560.157
Table 2. Energy demand for heating the building.
Climate ZoneDUo [kWh/(m2y)]DUn [kWh/(m2y)]
Type of Construction Material
CCCHBLSB
I—warmest (Szczecin)101.93185.09227.6080.10
III—medium (Kielce)115.50207.70253.8691.21
V—coldest (Suwałki)137.99239.03289.55110.91
Table 3. The results of life-cycle assessment (LCA) analysis for thermal insulation materials and heat sources.
Thermal Insulation MaterialPolystyrene EPS (EPS)Mineral wool (MW)Polyurethane PUR (PUR)
Kl [Pt/m3]4.2058.10816.062
Heat SourceCoal boiler (CB)Condensing gas boiler (CGB)Electricity boiler (EB)Heat pump (HP)
Ke [Pt/(kWh)]0.01930.01230.04850.0137
Table 4. Annual economic heating cost Go [(PLN·K)/(W·y)].
Type of Construction MaterialClimate ZoneHeat Source
CBCGBEBHP
CCI—warmest10.6718.1541.1811.63
III—medium11.8720.1945.8212.94
V—coldest13.2322.5151.0814.42
CHBI—warmest11.1018.8942.8712.11
III—medium12.3220.9647.5713.43
V—coldest13.5523.0552.3114.77
LSBI—warmest11.2219.1043.3412.24
III—medium12.3821.0647.7913.50
V—coldest13.5923.1352.4914.82
Table 5. Heat transfer coefficient Uopt values [W/(m2K)].
Heat SourceCBCGBEBHP
Thermal Insulation MaterialThermal Insulation MaterialThermal Insulation MaterialThermal Insulation Material
Constr. Mater.Clim. ZoneEPSMWPUREPSMWPUREPSMWPUREPSMWPUR
CCI0.1750.2380.3270.1340.1830.2510.0890.1210.1660.1680.2280.313
III0.1660.2260.3100.1270.1730.2380.0840.1150.1580.1590.2160.297
V0.1570.2140.2930.1200.1640.2250.0800.1090.1490.1500.2050.281
CHBI0.1710.2330.3200.1310.1790.2460.0870.1190.1630.1640.2240.307
III0.1630.2220.3040.1250.1700.2330.0830.1130.1550.1560.2120.291
V0.1550.2110.2900.1190.1620.2220.0790.1080.1480.1490.2020.278
LSBI0.1710.2320.3190.1310.1780.2440.0870.1180.1620.1630.2220.305
III0.1620.2210.3030.1240.1700.2330.0830.1130.1540.1560.2120.291
V0.1550.2110.2890.1190.1620.2220.0790.1070.1470.1480.2020.277
Table 6. Thermal insulation thickness dopt [m] optimum for economic reasons.
Heat SourceCBCGBEBHP
Thermal Insulation MaterialThermal Insulation MaterialThermal Insulation MaterialThermal Insulation Material
Constr. Mater.Clim. ZoneEPSMWPUREPSMWPUREPSMWPUREPSMWPUR
CCI0.1360.0730.0210.2050.1220.0460.3560.2320.1040.1450.0800.024
III0.1480.0820.0250.2220.1350.0530.3830.2480.1120.1590.0900.029
V0.1620.0920.0300.2400.1470.0590.4070.2670.1230.1740.1000.035
CHBI0.1990.1340.0630.2710.1840.0900.4250.2940.1480.2090.1400.067
III0.2110.1420.0680.2850.1960.0960.4470.3110.1560.2220.1500.072
V0.2230.1510.0720.3010.2070.1020.4720.3270.1650.2340.1590.076
LSBI0.2070.1420.0690.2790.1930.0960.4330.3050.1540.2190.1500.073
III0.2200.1510.0740.2960.2040.1020.4560.3190.1630.2300.1580.078
V0.2320.1590.0780.3100.2150.1080.4800.3390.1720.2440.1670.083
Table 7. Annual ecological heating cost GE [(Pt·K)/(W·y)].
Constr. MaterClimate ZoneHeat Source
CBCGBEBHP
CCI—warmest1.430.913.591.01
III—medium1.591.014.001.13
V—coldest1.771.134.461.26
CHBI—warmest1.490.953.741.06
III—medium1.651.054.151.17
V—coldest1.821.164.561.29
LSBI—warmest1.500.963.781.07
III—medium1.661.064.171.18
V—coldest1.821.164.581.29
Table 8. Heat transfer coefficient UEopt values [W/(m2K)].
Heat SourceCBCGBEBHP
Thermal Insulation MaterialThermal Insulation MaterialThermal Insulation MaterialThermal Insulation Material
Constr. Mater.Clim. ZoneEPSMWPUREPSMWPUREPSMWPUREPSMWPUR
CCI0.0690.0940.1120.0860.1180.1410.0430.0590.0710.0810.1120.133
III0.0650.0890.1060.0810.1120.1330.0410.0560.0670.0770.1060.126
V0.0620.0840.1010.0770.1060.1260.0390.0530.0640.0730.1000.120
CHBI0.0670.0920.1100.0840.1150.1380.0420.0580.0690.0800.1090.131
III0.0640.0880.1040.0800.1100.1310.0400.0550.0660.0760.1040.124
V0.0610.0830.1000.0760.1050.1250.0380.0530.0630.0720.0990.118
LSBI0.0670.0920.1090.0840.1150.1370.0420.0580.0690.0790.1090.130
III0.0640.0870.1040.0800.1090.1300.0400.0550.0660.0760.1040.124
V0.0610.0830.0990.0760.1040.1240.0380.0530.0630.0720.0990.118
Table 9. Thermal insulation thicknesses dEopt [m] optimum for ecological reasons.
Heat SourceCBCGBEBHP
Thermal Insulation MaterialThermal Insulation MaterialThermal Insulation MaterialThermal Insulation Material
Constr. Mater.Clim. ZoneEPSMWPUREPSMWPUREPSMWPUREPSMWPUR
CCI0.4870.3240.1850.3720.2400.1330.8370.5700.3290.4010.2580.145
III0.5220.3480.1990.4010.2580.1450.8830.6060.3530.4260.2770.157
V0.5520.3740.2120.4260.2770.1570.9330.6450.3720.4550.2990.168
CHBI0.5620.3900.2300.4420.3050.1790.9180.6390.3820.4650.3240.189
III0.5900.4090.2450.4650.3210.1890.9650.6750.4000.4920.3410.202
V0.6210.4360.2560.4920.3380.2001.0180.7020.4200.5210.3600.213
LSBI0.5710.3980.2380.4500.3130.1860.9260.6470.3870.4800.3320.197
III0.5990.4230.2510.4740.3320.1970.9740.6830.4060.5000.3490.207
V0.6290.4440.2640.5000.3490.2071.0260.7100.4260.5290.3680.219
Table 10. NPV values [PLN/m2] for U = Un.
Heat SourceCBCGBEBHP
Thermal Insulation MaterialThermal Insulation MaterialThermal Insulation MaterialThermal Insulation Material
Constr. Mater.Clim. ZoneEPSMWPUREPSMWPUREPSMWPUREPSMWPUR
CCI−9.19−24.10−48.2517.032.12−22.0397.7882.8758.72−5.82−20.73−44.88
III−4.98−19.89−44.0424.209.29−14.86114.0599.1474.99−1.22−16.13−40.28
V−0.20−15.11−39.2632.3317.42−6.73132.50117.5993.443.99−10.92−35.07
CHBI124.94102.8365.66251.06228.95191.78639.42617.31580.14141.17119.0681.89
III144.64122.5385.36284.57262.46225.29715.47693.36656.19162.65140.54103.37
V164.55142.44105.27318.46296.35259.18792.38770.27733.10184.36162.25125.08
LSBI196.61173.46134.19373.80350.65311.38919.40896.25856.98219.41196.26156.99
III222.55199.40160.13417.94394.79355.521019.59996.44957.17247.70224.55185.28
V249.94226.79187.52464.54441.39402.121125.331102.181062.91277.56254.41215.14
Table 11. NPVE values [Pt/m2] for U = Un.
Heat SourceCBCGBEBHP
Thermal Insulation MaterialThermal Insulation MaterialThermal Insulation MaterialThermal Insulation Material
Constr. Mater.Clim. ZoneEPSMWPUREPSMWPUREPSMWPUREPSMWPUR
CCI6.816.516.234.213.913.6417.6217.3217.054.734.434.16
III7.617.317.044.734.434.1519.6419.3419.075.305.004.73
V8.538.237.955.315.014.7421.9421.6421.375.955.655.38
CHBI33.7933.2732.8221.3220.8020.3585.8085.2884.8323.8123.2922.83
III37.5637.0436.5823.7223.2022.7595.2694.7494.2926.4825.9625.51
V41.3640.8540.3926.1525.6325.18104.83104.31103.8629.1828.6628.21
LSBI47.6847.1346.6430.1629.6129.12120.74120.19119.7133.6533.1032.62
III52.6452.0951.6033.3232.7732.29133.21132.66132.1737.1736.6236.13
V57.8757.3256.8436.6636.1135.62146.36145.81145.3340.8940.3439.85

