Abstract
Interior permanent magnet synchronous motors (IPMSMs) have been widely used in a variety of applications. The IPMSM will generate vibration as well as functioning like other traditional motors, which will affect the performance and the durability of the motor itself. The modal and vibration characteristics of the IPMSM and an optimization design to reduce vibration are researched in this paper. The formulas of electromagnetic force are deduced and analyzed, and a finite element model is established. The model is used for modal calculation, and the low order natural frequency is obtained. Then, the modal test is carried out by the hammering method, and the resonance frequency is found by analyzing the results. Eventually, the electromagnetic vibration is analyzed by taking the electromagnetic force as the load condition, the vibration displacement waveform is obtained, and the correctness of the dynamic calculation is verified by vibration tests. In addition, an eccentric tooth edge design is proposed to weaken the dominant radial electromagnetic force and the vibration displacement is compared with the designed prototype. This design method, which could help to reduce the vibration and noise of the IPMSM, has great potential in future applications.
1. Introduction
Permanent magnet synchronous motors (PMSMs) receive intensive attention due to their inherent merits, such as excellent efficiency, high torque density and superior controllability. In addition, the structure of the PMSM is diverse due to the particularity of its rotor. Based on these advantages, the PMSM has successively replaced various traditional motors and been applied in different industrial applications. At present, the production of the PMSM requires intelligent and lightweight materials, thus the aluminum alloy casing or the thin-walled casing has been gradually adopted, which makes it necessary to carry out modal analysis and a vibration calculation of the motor. Some applications have higher requirements for the vibration and noise of motors, such as electric vehicles, precision instruments, aerospace and servo industries [1]. Electromagnetic vibration is generated by the interaction of the electromagnetic force in the motor between the stator and the casing. Finding the relationship between the characteristic frequencies of vibration and the natural frequencies of the motor can make the motor lightweight and avoid resonance [2,3].
Recently, many scholars at home and abroad have performed thorough studies that consider modal analysis and vibration characteristics of the motor. The authors conducted modal analysis for different types of motors [4,5,6,7,8]. A PMSM for electric vehicles was researched to analyze the relationship between the acoustic spectrum frequency and the natural frequency [4]. A linear motor was taken as an example to calculate the first six natural frequencies of the motor by a finite element analysis [5]. Induction motors were researched in [6,7,8]. The authors calculated the natural frequencies of the motors and their parts in [6,7] and modal analysis of a stator with a complex shape in the induction motor was carried out in [8]. In addition, the influence of various parts of a motor on the natural frequency of the whole motor was studied in [9,10,11,12]. References [9,10] primarily analyzed the natural frequencies of the stator and the stator with casing, and the influence of end caps on the natural frequencies of the stator was considered [10]. Modal analysis of the stator core was conducted in [11,12], and [11] focused on the stator in PMSM with concentrated winding, and the stator structure of the PMSM for electric vehicles was researched in [12]. This study considered the impacts of the windings and winding ends on the natural frequency of the stator core, and the correctness of the finite element calculation results was verified by modal test. The natural frequencies of the inner rotor and the outer rotor of the permanent magnet motor were carried out respectively by the finite element calculation and test [13,14]. The vibration characteristics of the PMSM were studied in [15,16]. Reference [15] researched the vibration and noise characteristics of the coaxial magnetic gear by the electromagnetic forces, and [16] noted that when the order and frequency of the electromagnetic force and the natural frequency of the motor are accordant will lead to motor resonance. The methodologies to reduce vibration were studied in [17,18,19] and [20]. Reference [17] proposed a vibration suppression method for a planar motor on the basis of modal force constraint. In view of the structural characteristics of PMSM, many researchers have begun to study the method to suppress vibration and noise by changing the stator and rotor structure of PMSM. Considering that electromagnetic vibration is mainly caused by the radial electromagnetic force of the stator teeth, most people consider slotting the stator teeth to suppress vibration. References [18] and [19] all proposed to suppress vibration by slotting the stator teeth, and the influence of the groove shape, groove depth and notch width on the electromagnetic force of the motor is analyzed and compared, but does not indicate the influence of the slot on the performance of the motor. The vibration of the prototype motor in [18] is reduced by 40.7% after optimization. Reference [20] proposed the method that using new rotor tooth with slot on each side to reduce the vibration of a switched reluctance motor. The vibration of the slotted motor is reduced 8.8% compared to the normal motor. The groove type on the stator teeth is rectangular in [18,19], and [20] presented a new type of rotor tooth with a slot on each side. The optimized design in this paper is eccentric tooth edge design, the top arc was offset some distance along the radial direction, and the vibration displacement after optimization is reduced by 47% compared to before optimization. The output torque and output torque fluctuation of the motor before and after optimization were also compared in this paper.
This paper presents a 3 KW PMSM as the research object. The distribution of the motor electromagnetic force and orders of the electromagnetic force waves are calculated by finite element software and the Maxwell tensor formula. The characteristic frequency, which has a greater impact on vibration can be found by spectrum analysis. Then the 3D finite element model is established, the natural frequencies of the stator and the motor are calculated, and the modal tests are completed. The time-varying electromagnetic force is applied as an excitation force on the 3D model to calculate the vibration displacement, and spectrum analysis has been accomplished, so that the characteristic frequency of the vibration displacement can be found. The correctness of the finite element results is verified by vibration tests. Finally, the eccentric tooth edge design is proposed to weaken the dominant radial electromagnetic force and further reduce vibration noise.
2. Basic Parameters of the Motor and Laboratory Testing Platform
2.1. Basic Parameters of the Motor and Magnetic Field Calculation Model
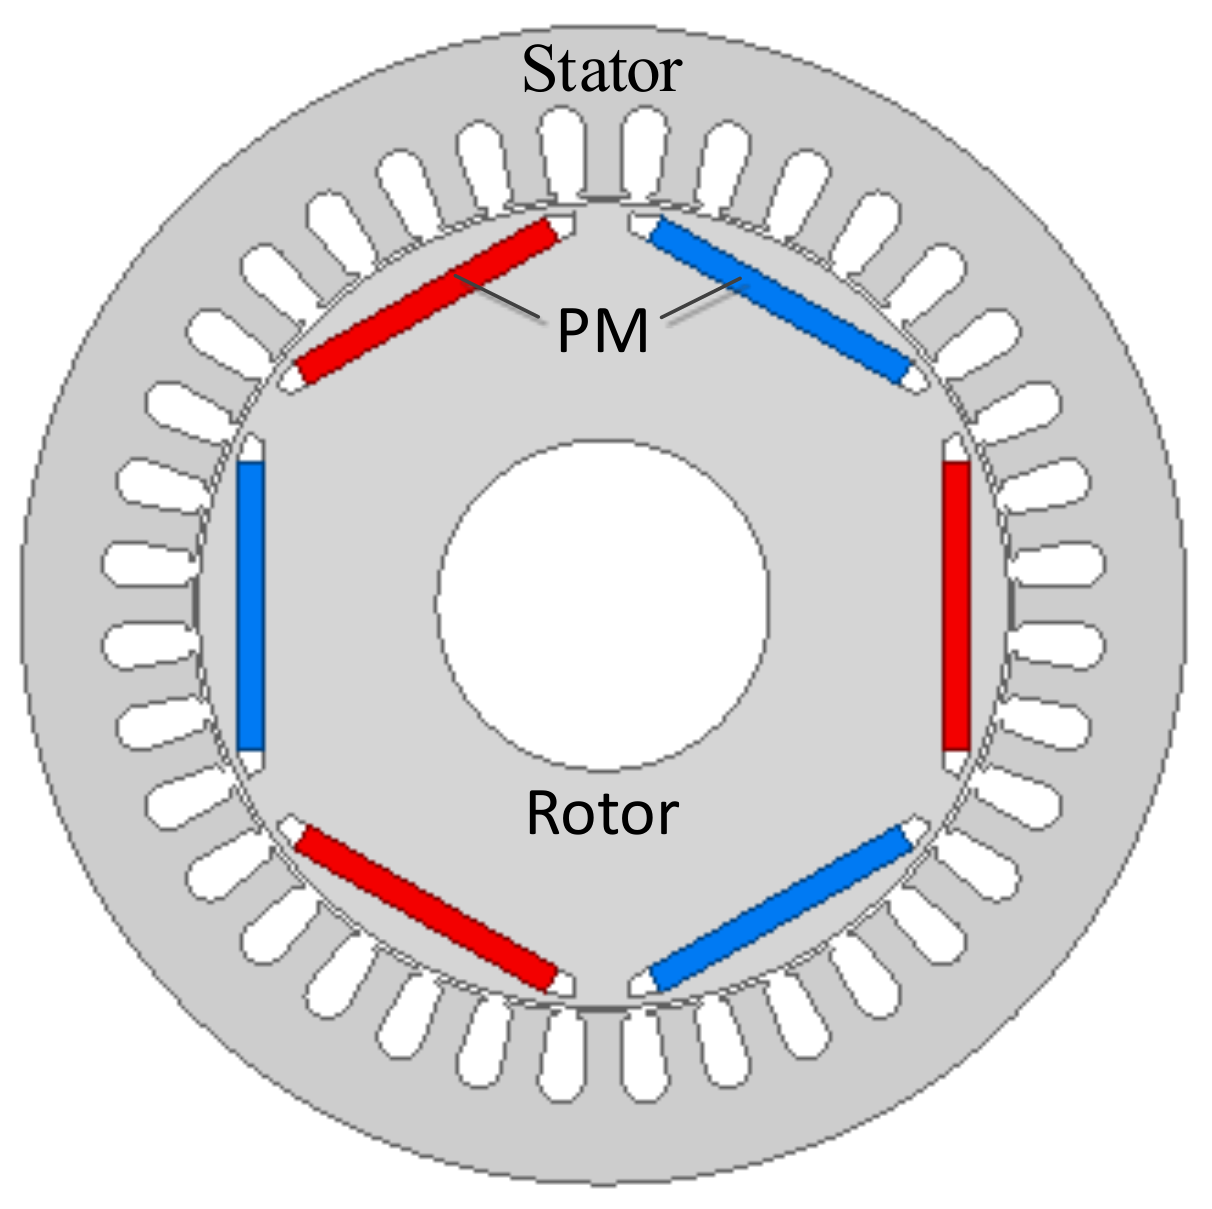
The primary data of the prototype motor is listed in Table 1 and the 2D transient electromagnetic field model is shown in Figure 1.

Table 1.
The parameters of the prototype motor.
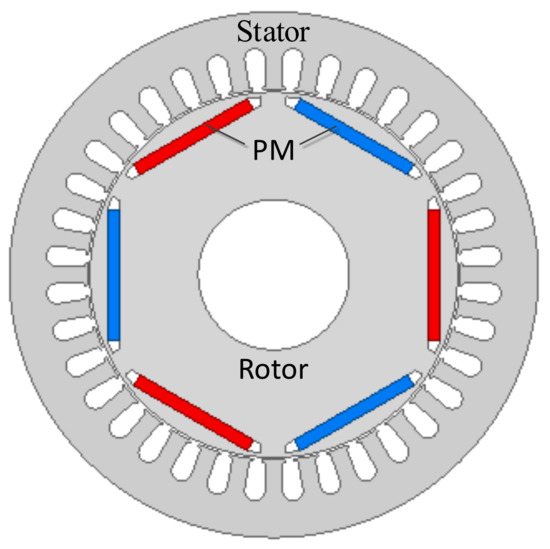
Figure 1.
Calculation model of the prototype motor.
2.2. Laboratory Testing Platform
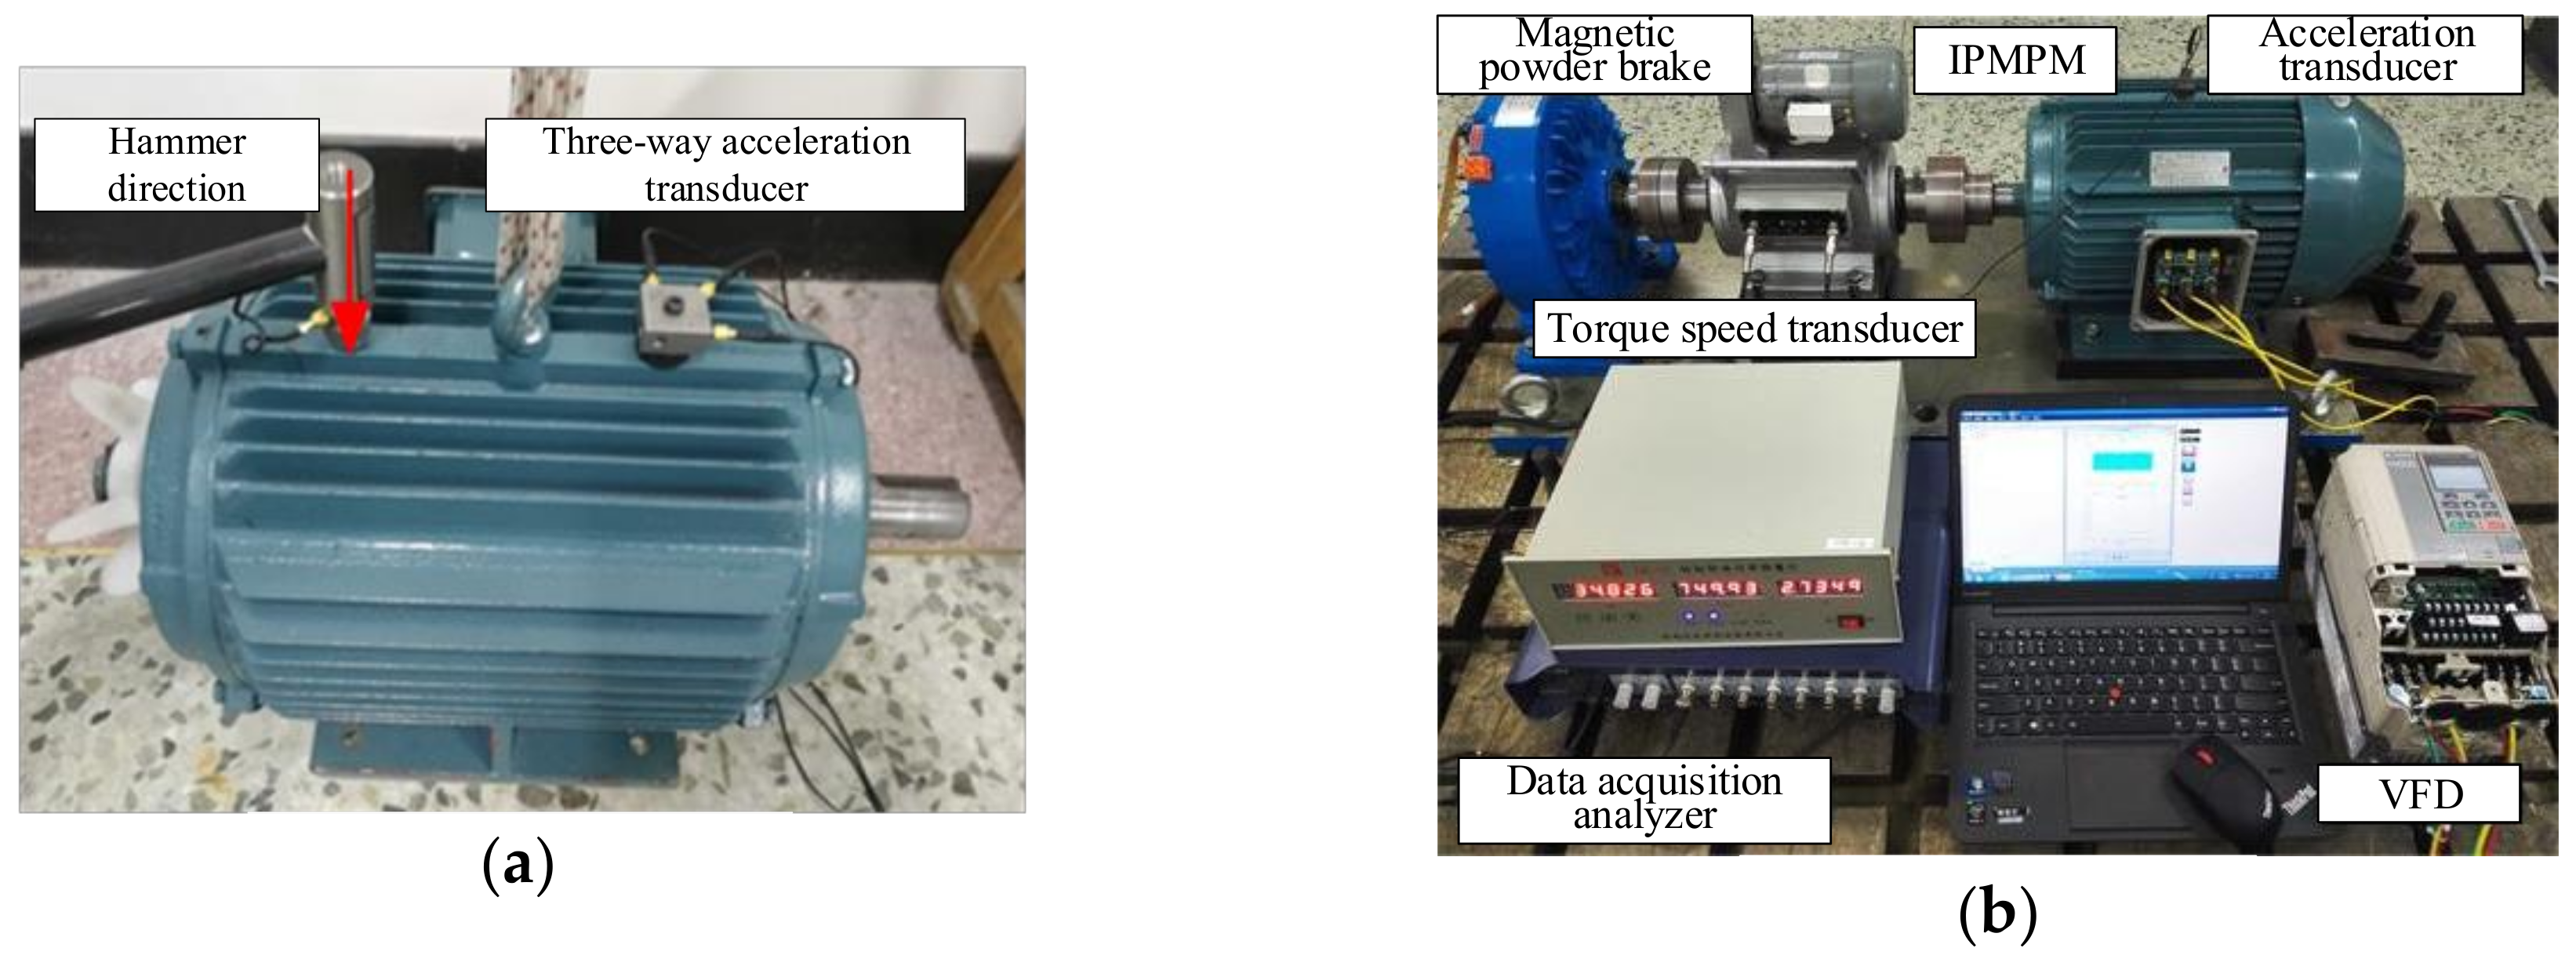
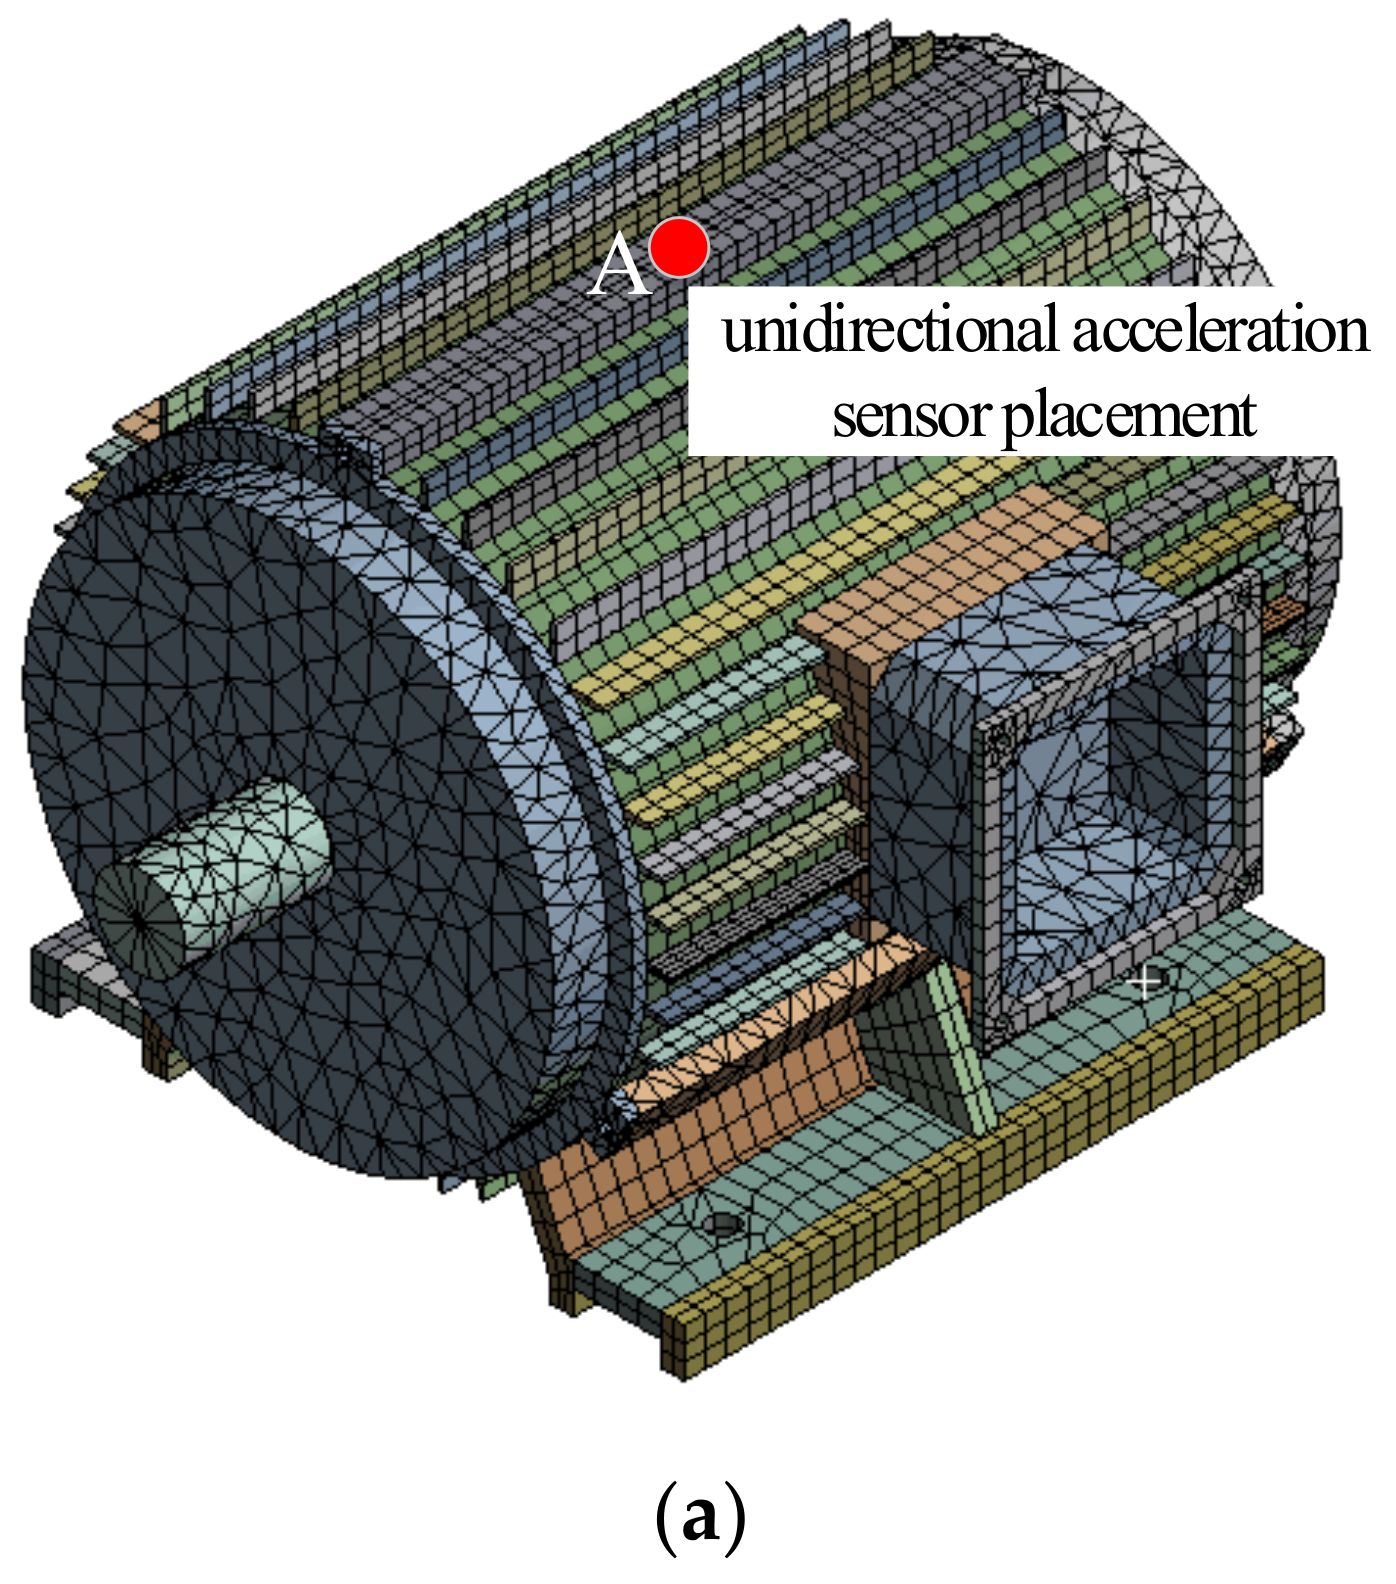
Modal and vibration tests of the PMSM are carried out in this paper. The low order natural frequencies and the vibration displacement amplitudes of the motor are measured respectively. The AVANT MI-7008 dynamic data acquisition analyzer is used for data analysis and processing in modal and vibration tests, and the maximum sampling frequency is 192 kHz. A three-direction acceleration sensor is applied to the modal test, and the sensitivity in X, Y, and Z direction is 104.18 mV/g, 100.98 mV/g and 98.34 mV/g, respectively. A unidirectional acceleration sensor is applied to the vibration test and its sensitivity is 100 mV/g. The modal test platform is shown in Figure 2a. The motor is suspended to measure the free mode of the motor, due to the human factors, the intensity and hammering direction are random, and we used multiple measurements to reduce the experimental error. A magnetic powder brake is used as the load and connected to the motor by a torque-speed transducer in the vibration test. The sensor is placed on the top of the casing to obtain the waveforms of the vibration displacement, and the vibration test platform is set up as shown in Figure 2b.

Figure 2.
The laboratory test platform. (a) Modal test; (b) Vibration test.
3. Analysis and Calculation of Electromagnetic Force
3.1. Basic Theories of Electromagnetic Force
The air gap synthetic magnetic motive force (MMF) of the motor can be obtained as follows:
where p is the number of pole-pairs, υ is the order of stator harmonics, and μ is the order of rotor harmonics. The first term on the right side of the equation is the synthetic MMF of the pth wave, that is, the fundamental MMF. The second term is the MMF of the stator winding, and the third term is the MMF of PM.
fp (θ, t) is the fundamental MMF of the synthetic magnetic field, which changes with space and time. It can be written after expansion as:
where Fp is the amplitude of the synthetic MMF, ω1 is the angular frequency of the synthetic MMF, and φ0 is the initial phase angle of the synthetic MMF.
The equation of air gap permeability can be expressed as:
where Λ0 is the constant amplitude part of air gap permeability, Λk is the amplitude of the kth harmonic permeability, and Z1 is the number of stator slots.
Ignoring the influence of the saturation, the transient value of the air gap magnetic flux density can be expressed as follows:
If other harmonic magnetic fields are ignored, the expression of transient fundamental magnetic flux density can be calculated by (2) and (4):
where B1 is the amplitude of air gap magnetic flux density.
According to the Maxwell tensor method, the radial electromagnetic force acting per unit of area on the stator teeth is:
where Bn is the radial air gap magnetic flux density, Bt is the tangential air gap magnetic flux density, which is neglected in the calculation, and μ0 is air permeability.
At this time, the expression of the electromagnetic force generated by the fundamental magnetic field can be calculated by (5) and (6):
where p0 is the constant part of the radial force and p1 is the variable part of the radial force.
It can be observed from the variable part of the electromagnetic force that the harmonic amplitude of the double frequency should be maximum without considering the constant part of radial force, so it has the greatest impact on motor vibration. According to the data of the prototype motor, the frequency which has the greatest influence on motor vibration characteristics is 75 Hz.
q is the number of slots per pole and per phase of the three-phase stator winding, assuming that the order of the MMF harmonics of the stator winding is υ, the pole-pair harmonic generated by stator winding can be expressed as:
The pole-pair harmonic generated by the PM on rotor can be expressed as:
The interaction of the magnetic field is generated by the three-phase winding of the stator and the PM under load. Assuming that the order of the radial force wave under load is r, the order of the force wave can be given by the following equations:
It can be observed from (10) and (11) that the orders of the electromagnetic force wave of the integer slot motor can only be zero or the integral multiple of the number of poles. The number of poles of the prototype motor is 6 in this paper, low orders of the electromagnetic force wave are 0th and 6th, and the others are integer multiples of six. The orders of the radial electromagnetic force wave of the prototype motor are given in Table 2.
Table 2.
Order of radial electromagnetic force wave of prototype motor.
3.2. Electromagnetic Force by FEM Calculation
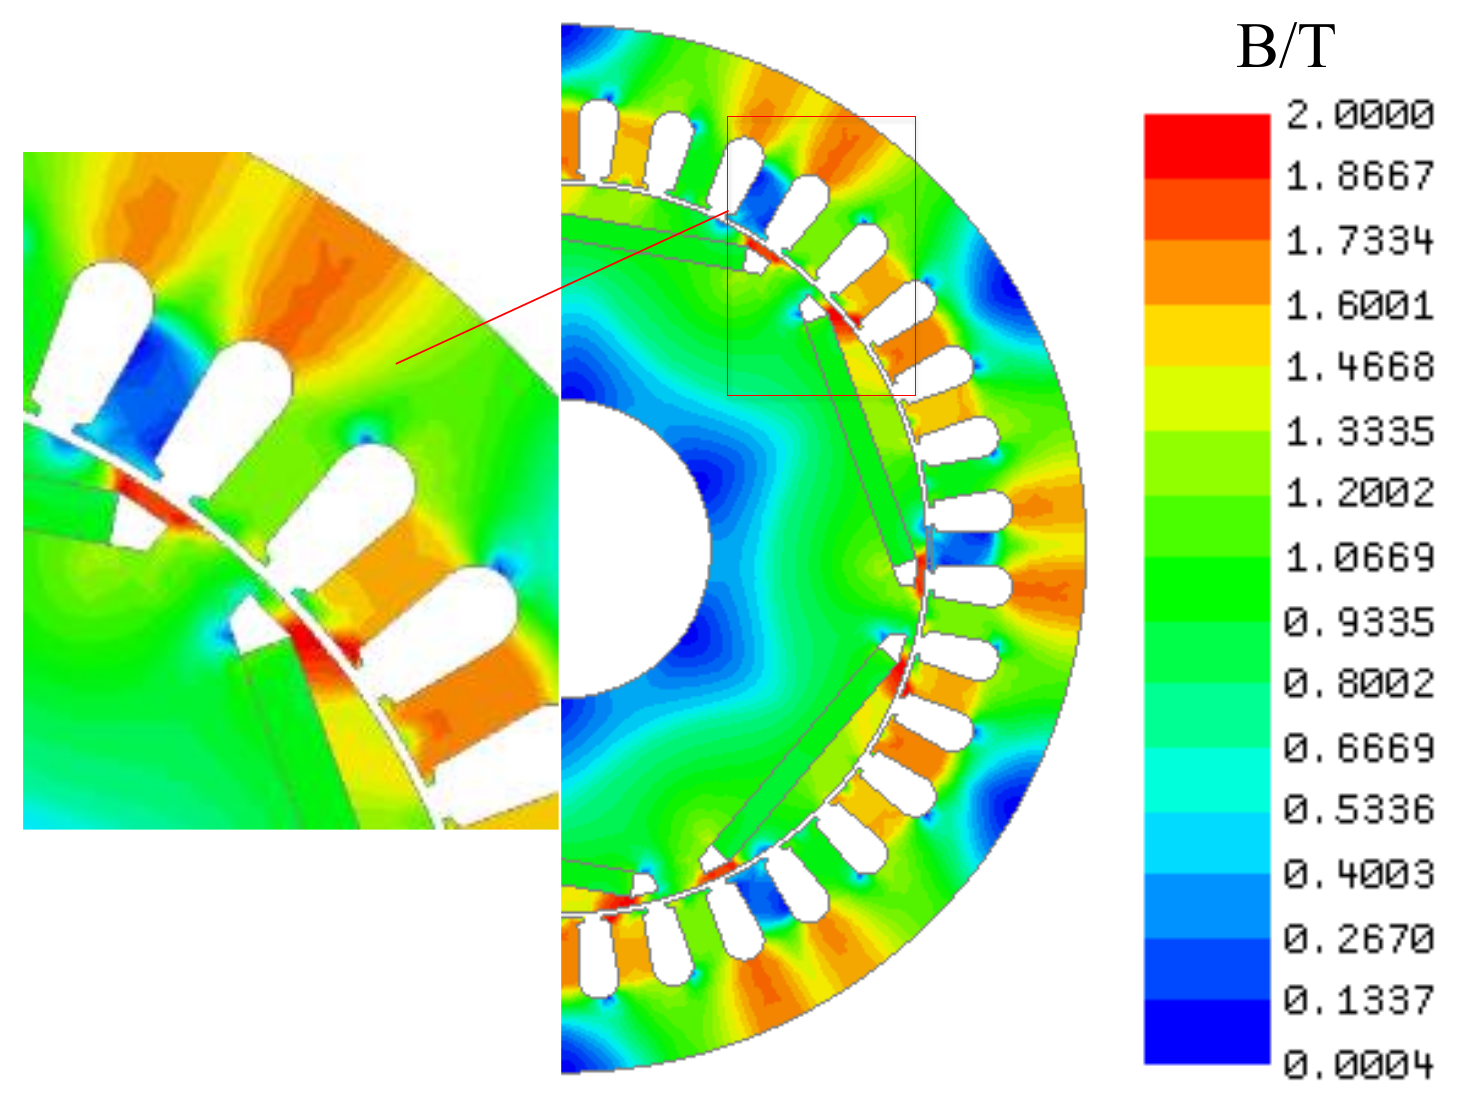
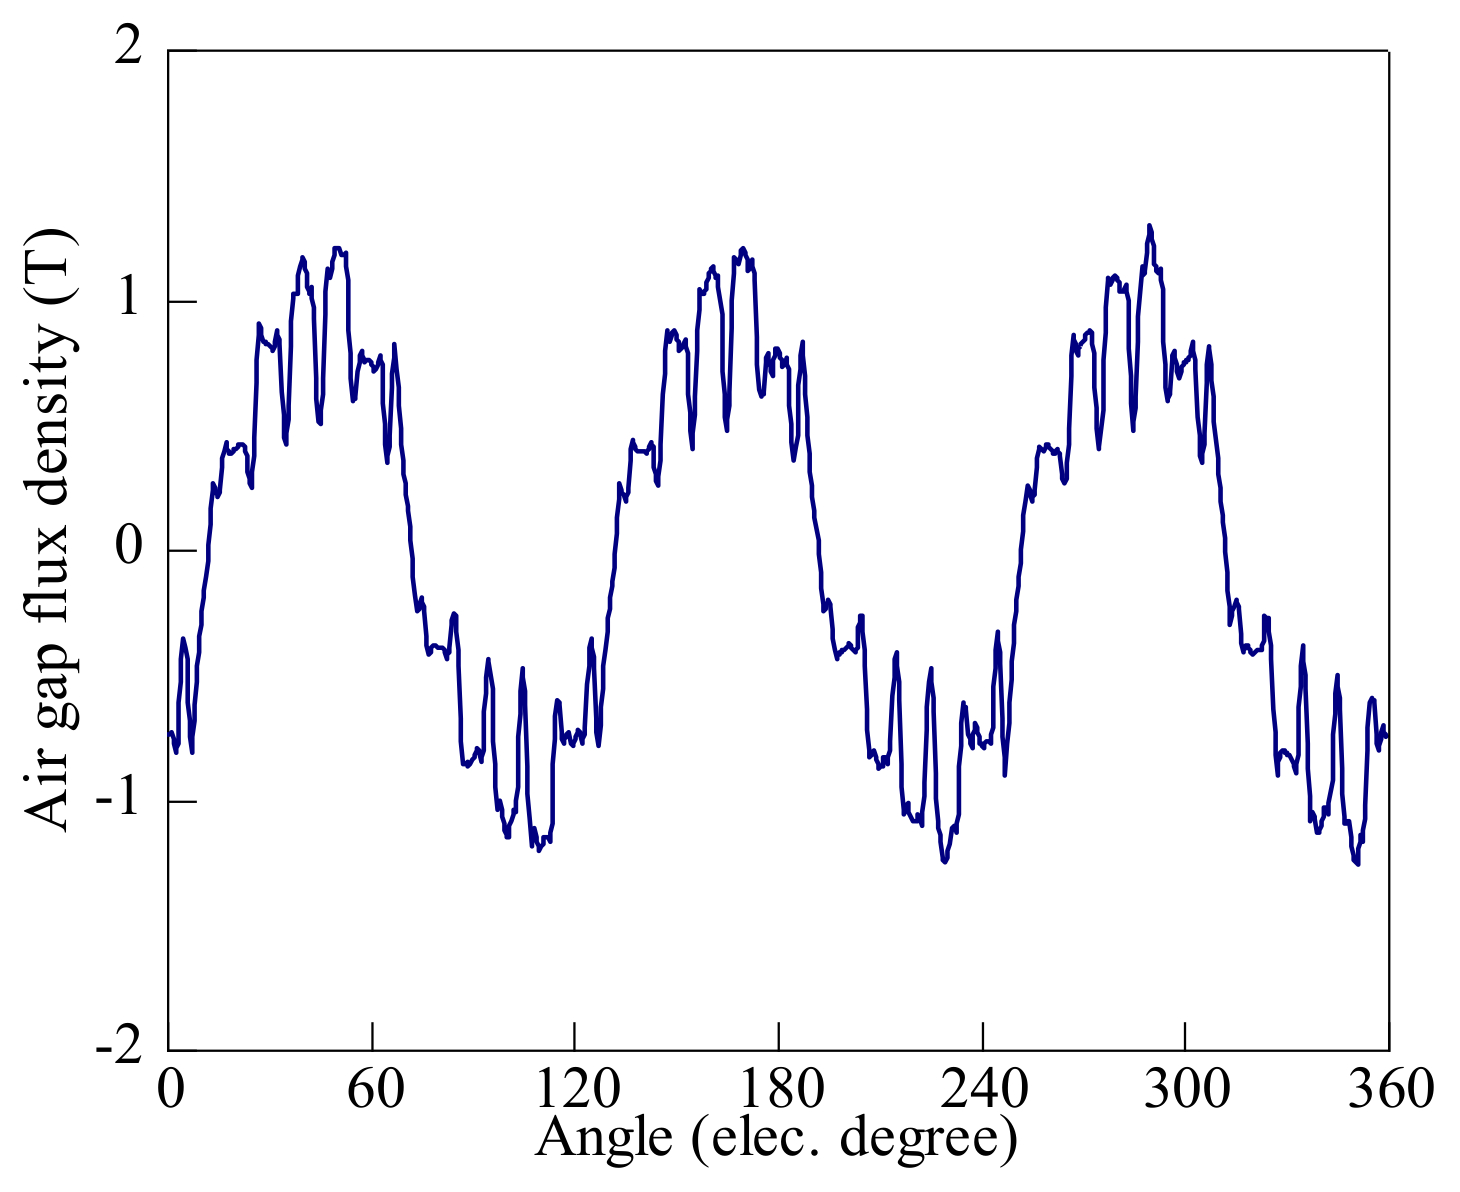
According to the primary data of the prototype motor given in Table 1, a 2D finite element calculation model is established. A current source is applied and the control mode of id = 0 is adopted in this paper because the radial electromagnetic force during the start-up process is not taken into account in calculation. The distribution of flux-density under rated-load condition is shown in Figure 3, and it can be observed that the flux density is larger near the magnetic bridge and the stator yoke. The radial air gap magnetic flux density of the motor under rated-load condition is shown in Figure 4.

Figure 3.
Distribution of flux-density under rated-load condition (t = 0.08 s).
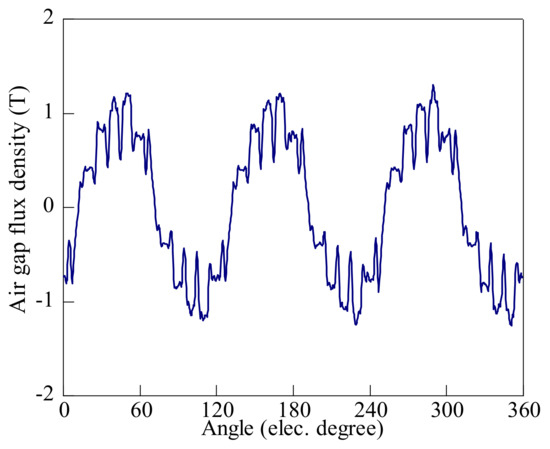
Figure 4.
Radial air gap flux density under rated-load condition.
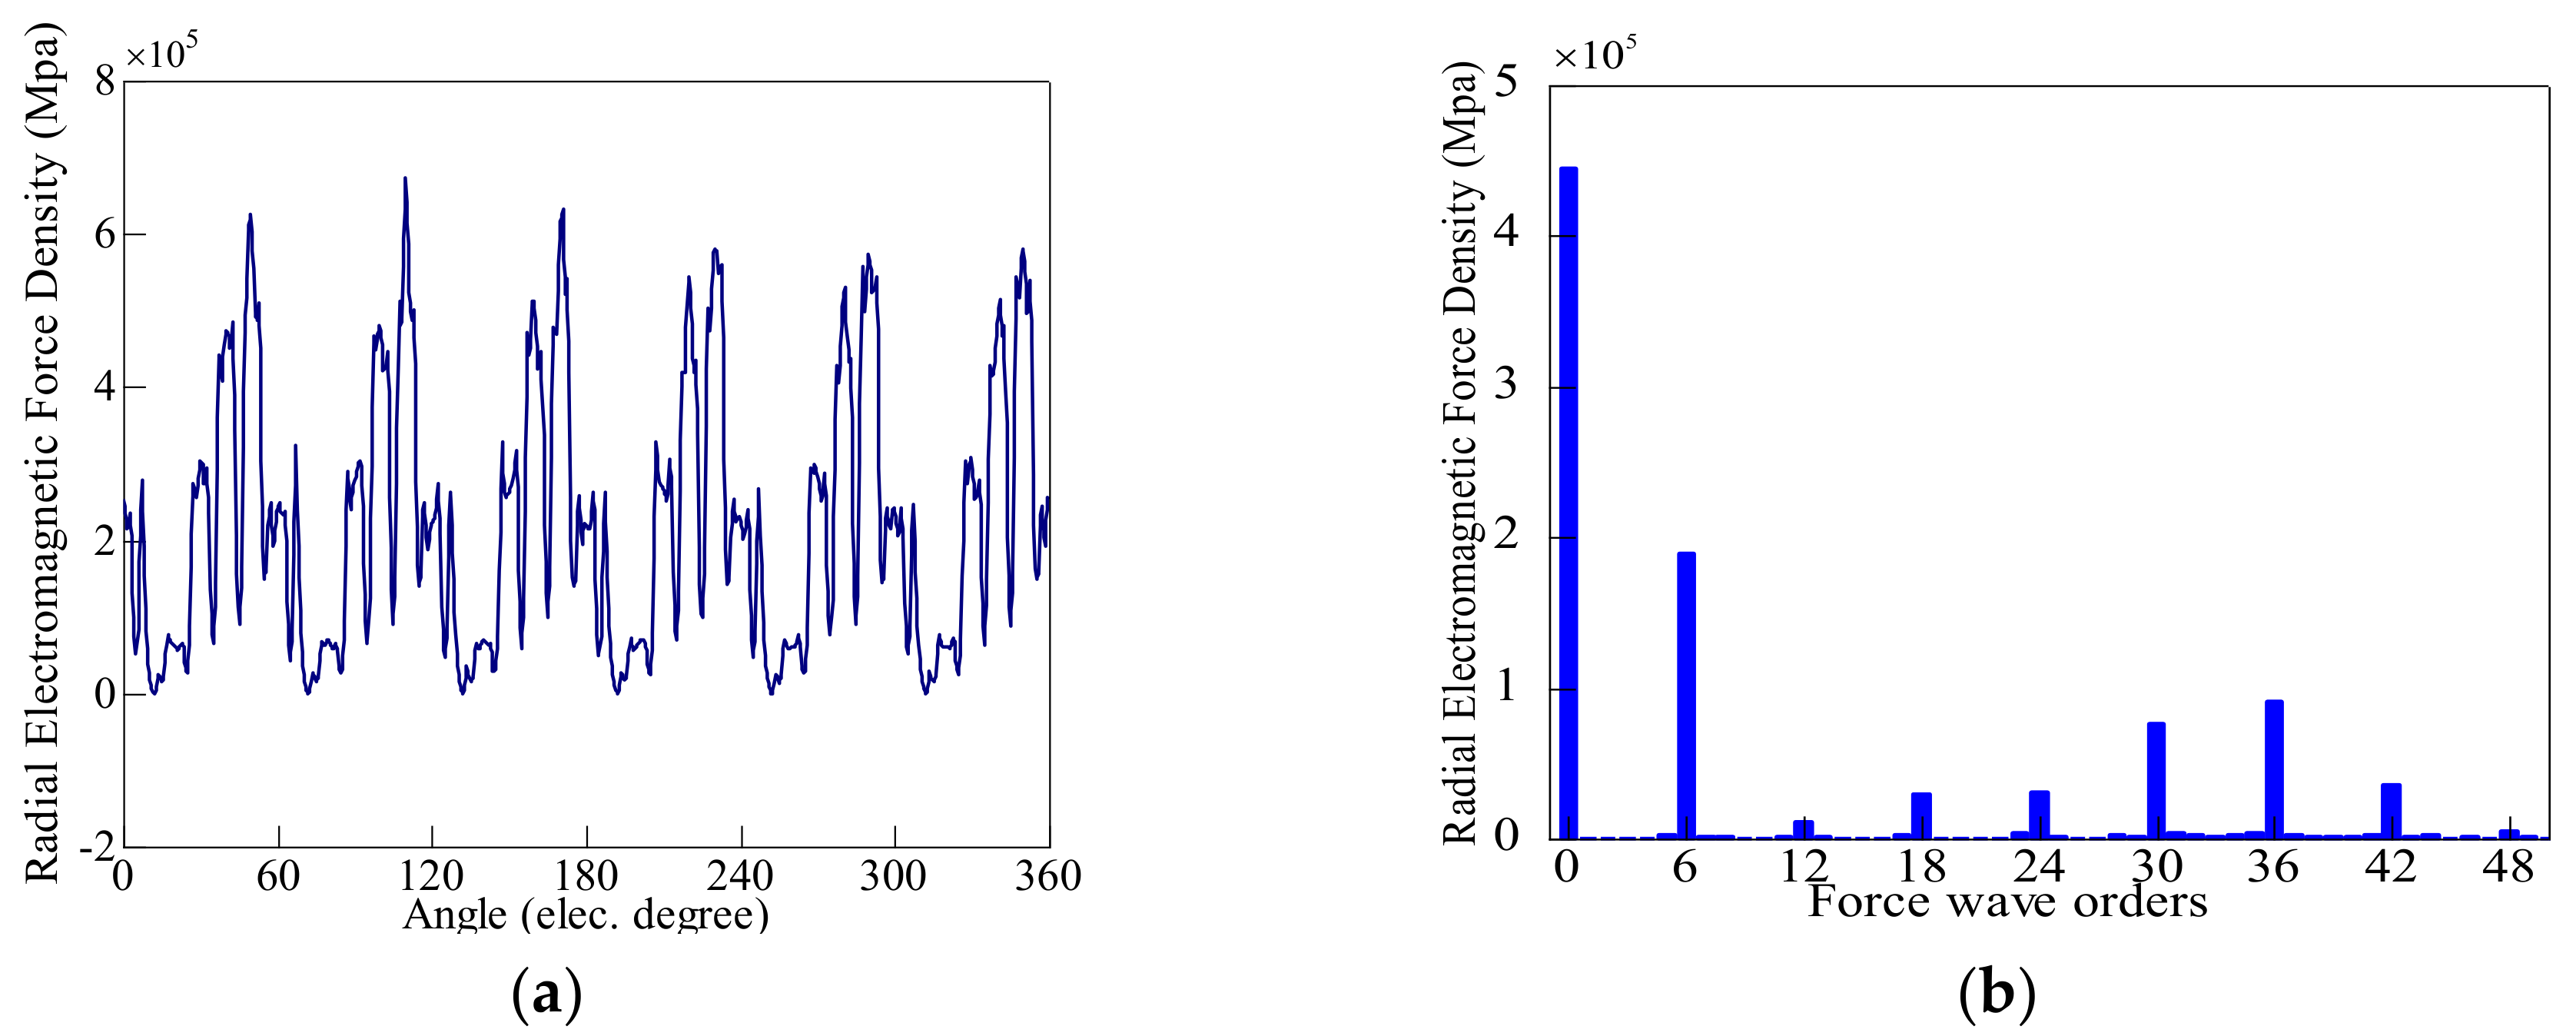
The waveform and harmonic analysis of the spatial electromagnetic force density are shown in Figure 5. It can be observed that the low-order electromagnetic force waves are 0th and 6th, and the others are integer multiples of six, which is consistent with the theoretical calculations.

Figure 5.
Waveform and harmonic analysis of spatial electromagnetic force density; (a) Spatial electromagnetic force density; (b) Spectrum analysis.
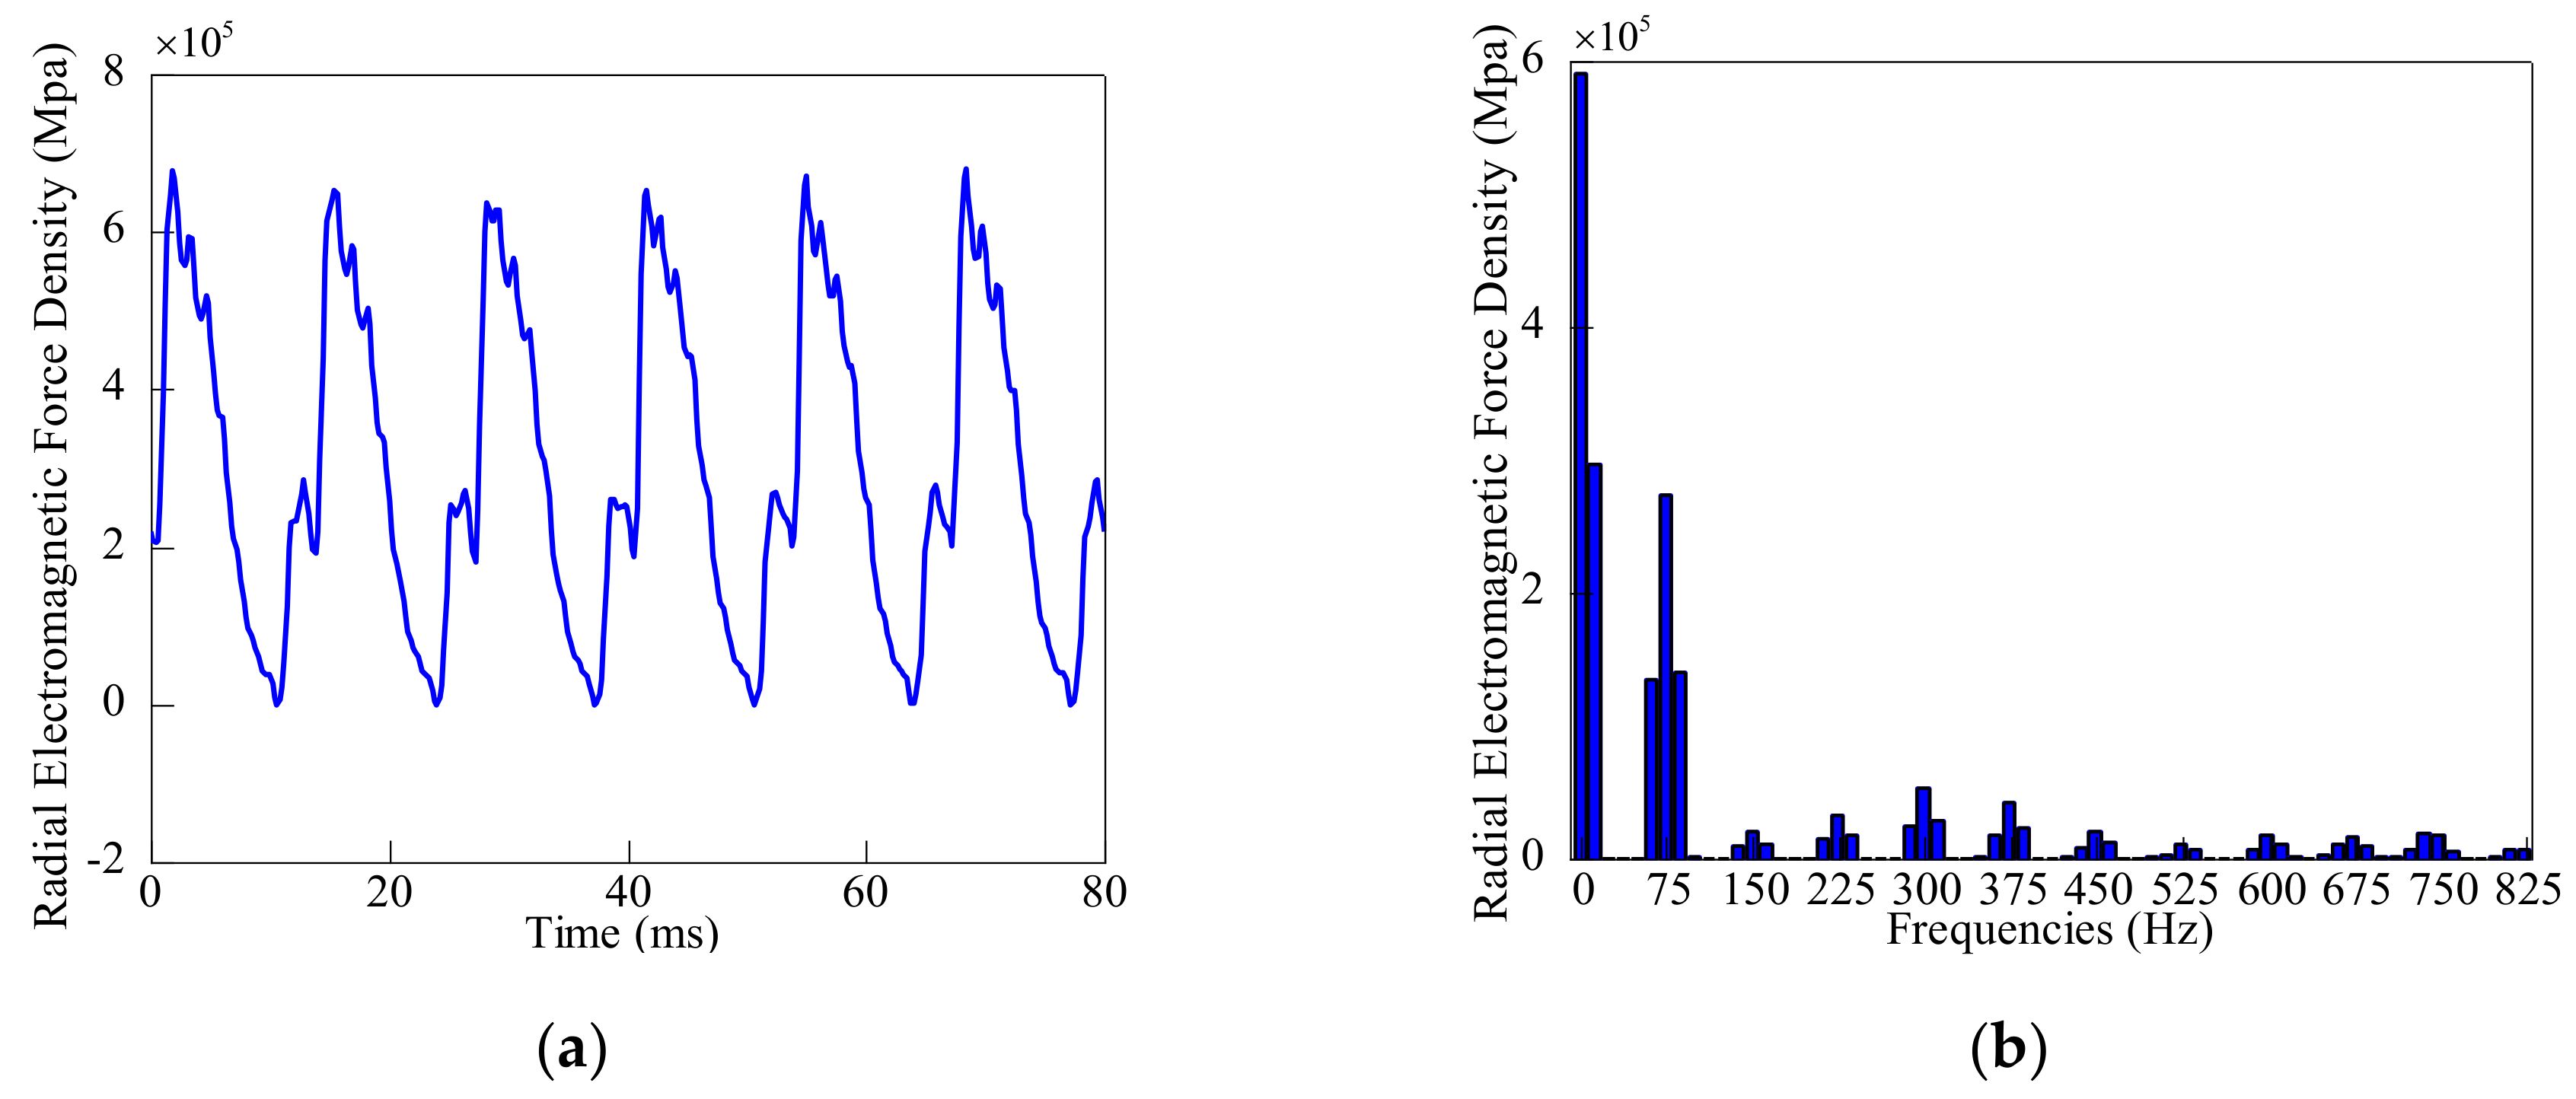
Figure 6 shows the waveform and spectrum analysis of the time-varying electromagnetic force density. From the spectrum analysis result, it can be seen that the frequency which has the greatest influence on vibration is 75 Hz, which is double power frequency. The other frequencies are integer multiples of power frequency, which is consistent with the previous theoretical calculation results. The DC component in the spectrum analysis results is 0 Hz, which has little effect on motor vibration, and the amplitudes of the electromagnetic force density after 825 Hz are relatively small, so these two factors are not considered in this paper.

Figure 6.
Waveform and spectrum analysis of time-varying electromagnetic force density. (a) Time-varying radial electromagnetic force density; (b) Spectrum analysis.
4. Modal and Vibration Analysis
4.1. Motor Modal Analysis
The finite element calculations and tests of the free mode of the prototype motor are implemented in this section. The modal of the stator and the motor are calculated separately in the finite element simulation. Equivalent of the model is a key issue in the modal analysis. The shape of the actual end windings is complicated, and it is difficult to generate finite element meshes with good quality. Reasonable equivalent of inner and end windings is needed. In this paper, complex stator end windings are equivalent to hollow cylinders with the same volume as shown in Figure 7b. Density of the end windings is estimated by the proportions of coils, insulation materials and air. Ignoring some structures, such as chamfers and threads, which have less influence on the stiffness of the motor, the stator core and casing are modeled by an interference fit treatment. The 3D finite element model of the motor is shown in Figure 7a, and the material parameters of the prototype motor are listed in Table 3.
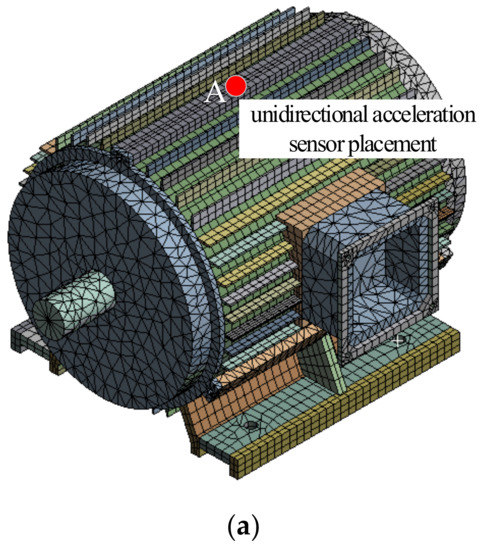
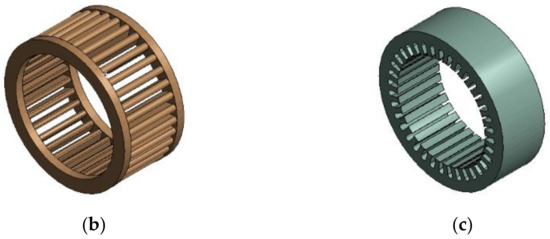
Figure 7.
3D finite element model of the motor and stator. (a) 3D finite element mesh of motor; (b) Equivalent winding; (c) Stator core.
Table 3.
Material parameters of every part of the motor.
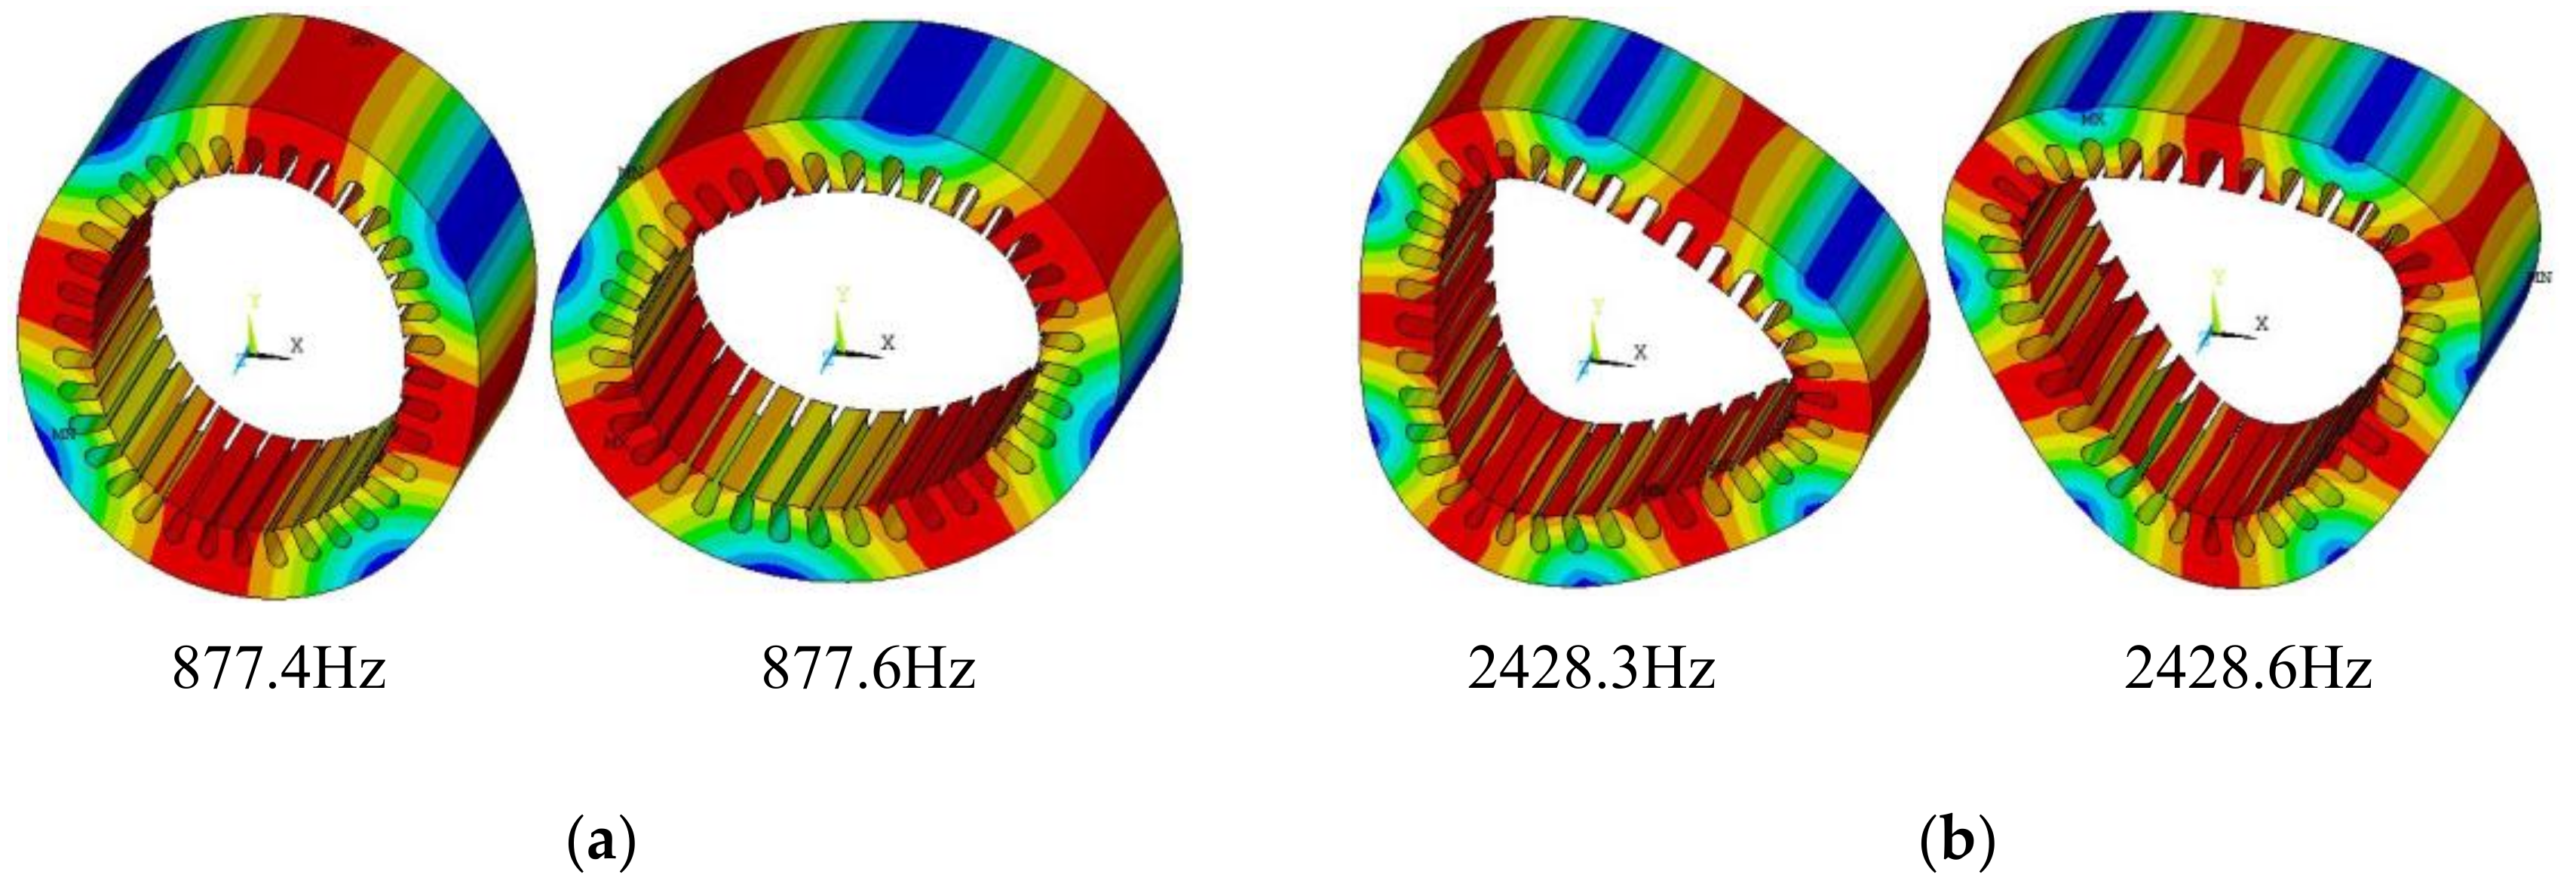
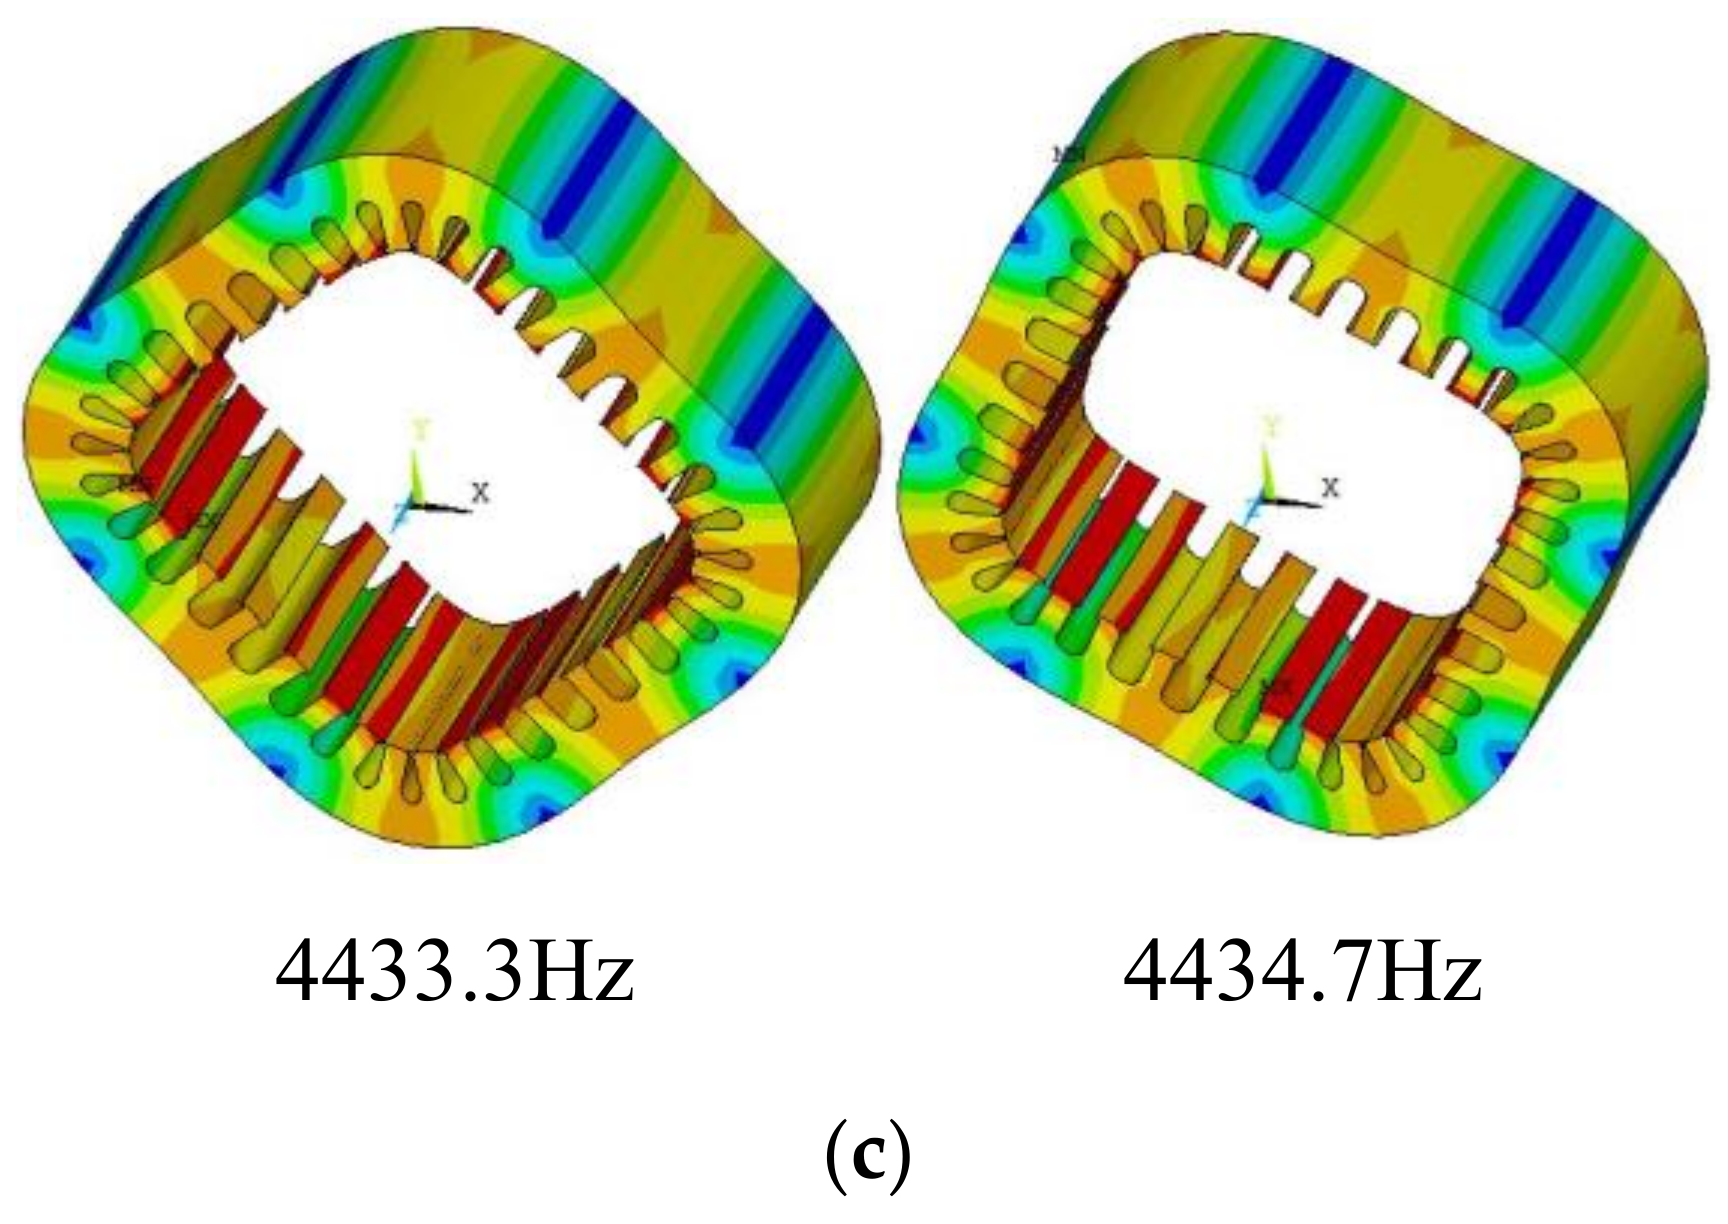
The natural frequencies of the stator core are calculated based on the 3D structural model and the results are given in Table 4. Due to the existence of tooth symmetric mode and tooth antisymmetrical mode of the motor stator, there are two frequencies of the mode. The orders of the radial modal shape of each step of the stator core are obtained by FEM calculation, as shown in Figure 8.
Table 4.
Natural frequencies of the stator.

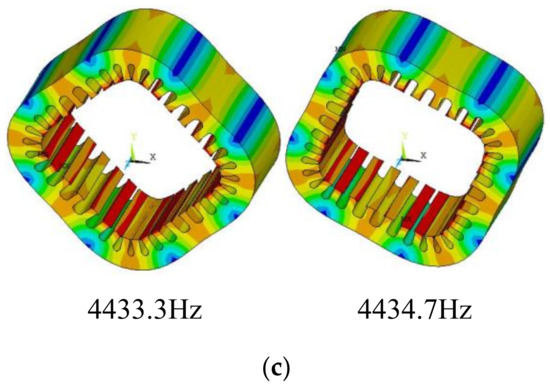
Figure 8.
Radial modal shapes of stator. (a) The second modal shape; (b) The third modal shape; (c) The fourth modal shape.
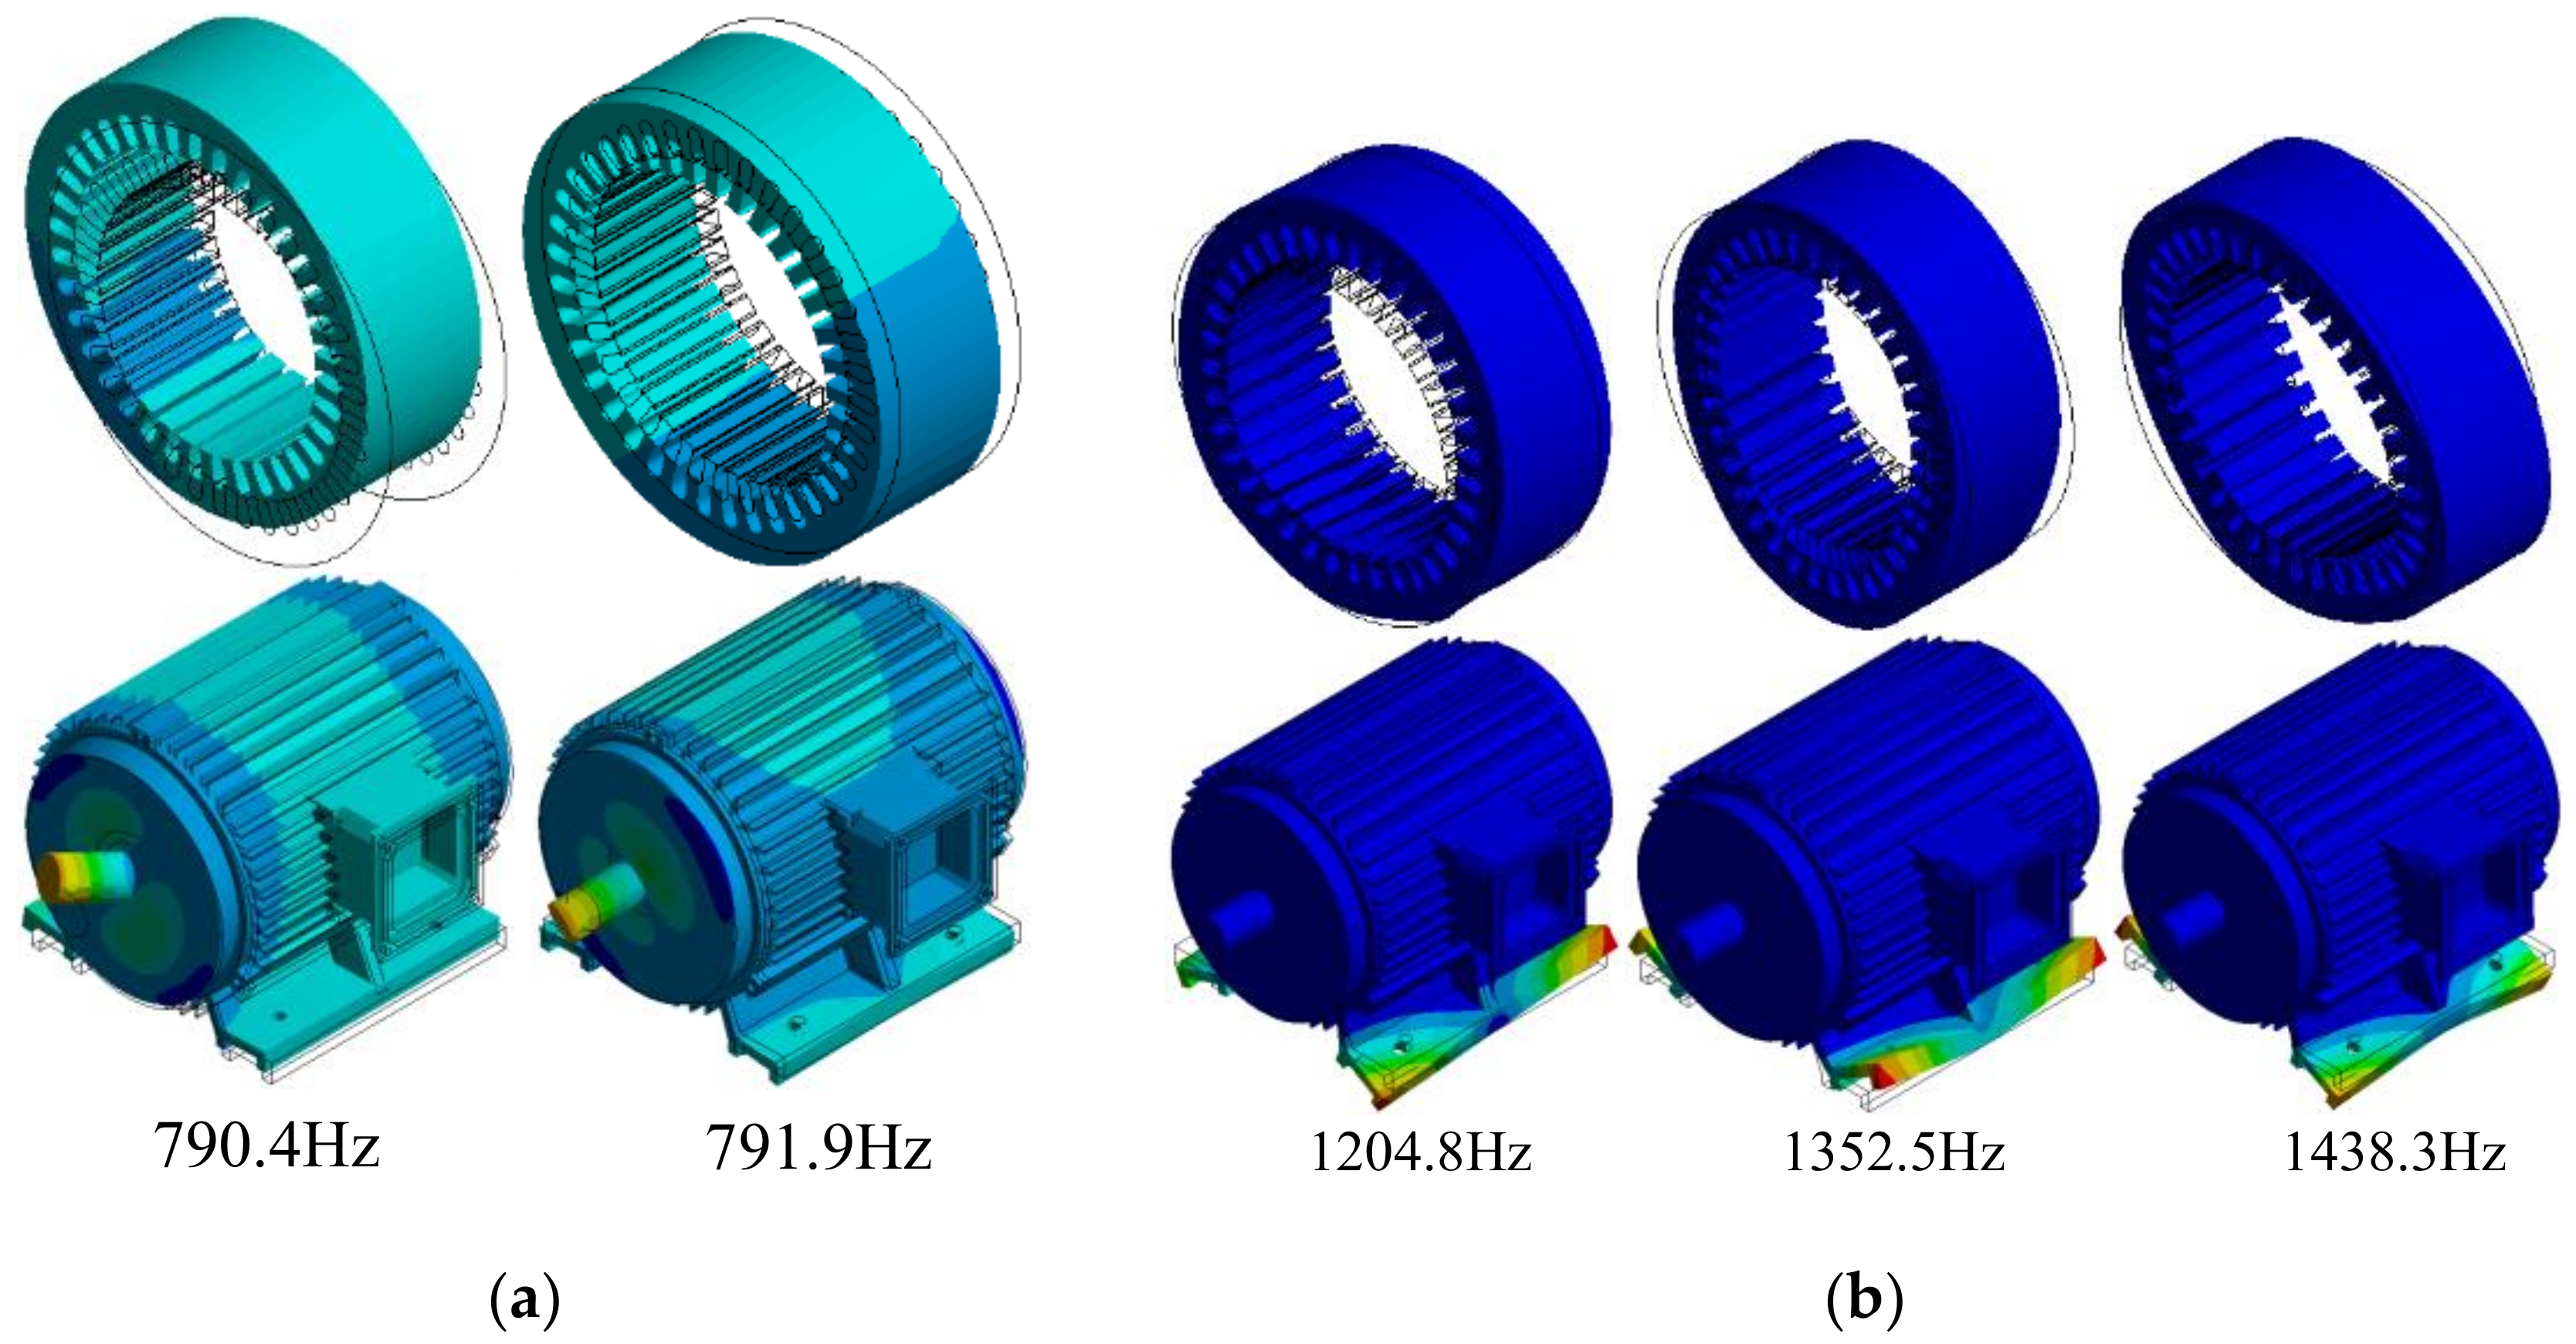
The modal of the whole motor is also analyzed and calculated in this section. As the frequencies of the high-order modes are hard to be measured in the test, only the low-order modes are considered in the calculation process of the natural frequency. The first and second modal shapes of the whole motor and the stator are shown in Figure 9. From Figure 9a, the first natural frequencies of the motor are 790.8 Hz and 791.9 Hz. The main deformation occurs in the shaft, and no deformation can be found on the casing or the stator in the radial direction. From Figure 9b, the second natural frequencies are mainly from 1200 Hz to 2000 Hz. The main deformation occurs in the base, and a small deformation can be observed in the stator core in the axial and radial directions at 1204.8 Hz, 1352.5 Hz and 1438.3 Hz. In Figure 9c, the second radial natural frequencies of the motor are 1907.5 Hz and 1977.4 Hz. The stator core is in the second radial modal shape. Significant deformation occurs in the casing in the radial direction and small deformation can be found in the end cap. It can be found that the natural frequencies of the whole motor are higher than the natural frequencies of the stator core for the same modal shape. The number of natural frequencies of the whole motor is also greater than the number of natural frequencies of the stator core for the second modal shape.
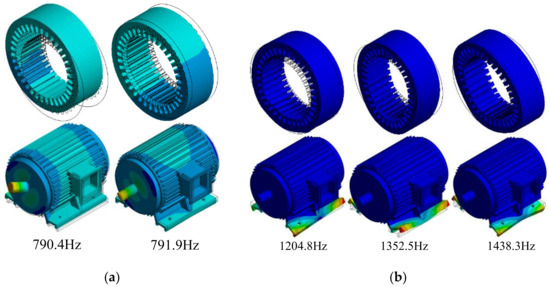
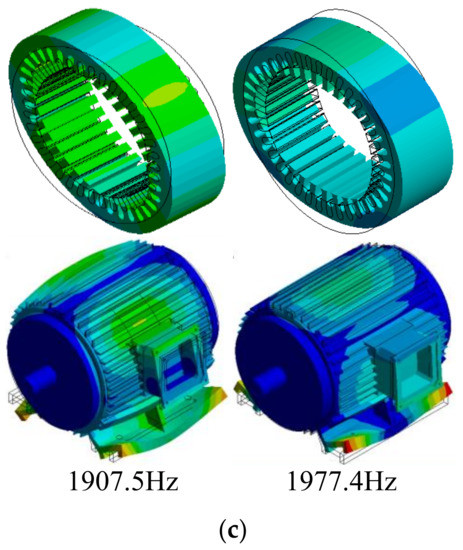
Figure 9.
Modal shapes of the stator and the whole motor. (a) The first modal shape; (b) The second modal shape; (c) The second radial modal shape.
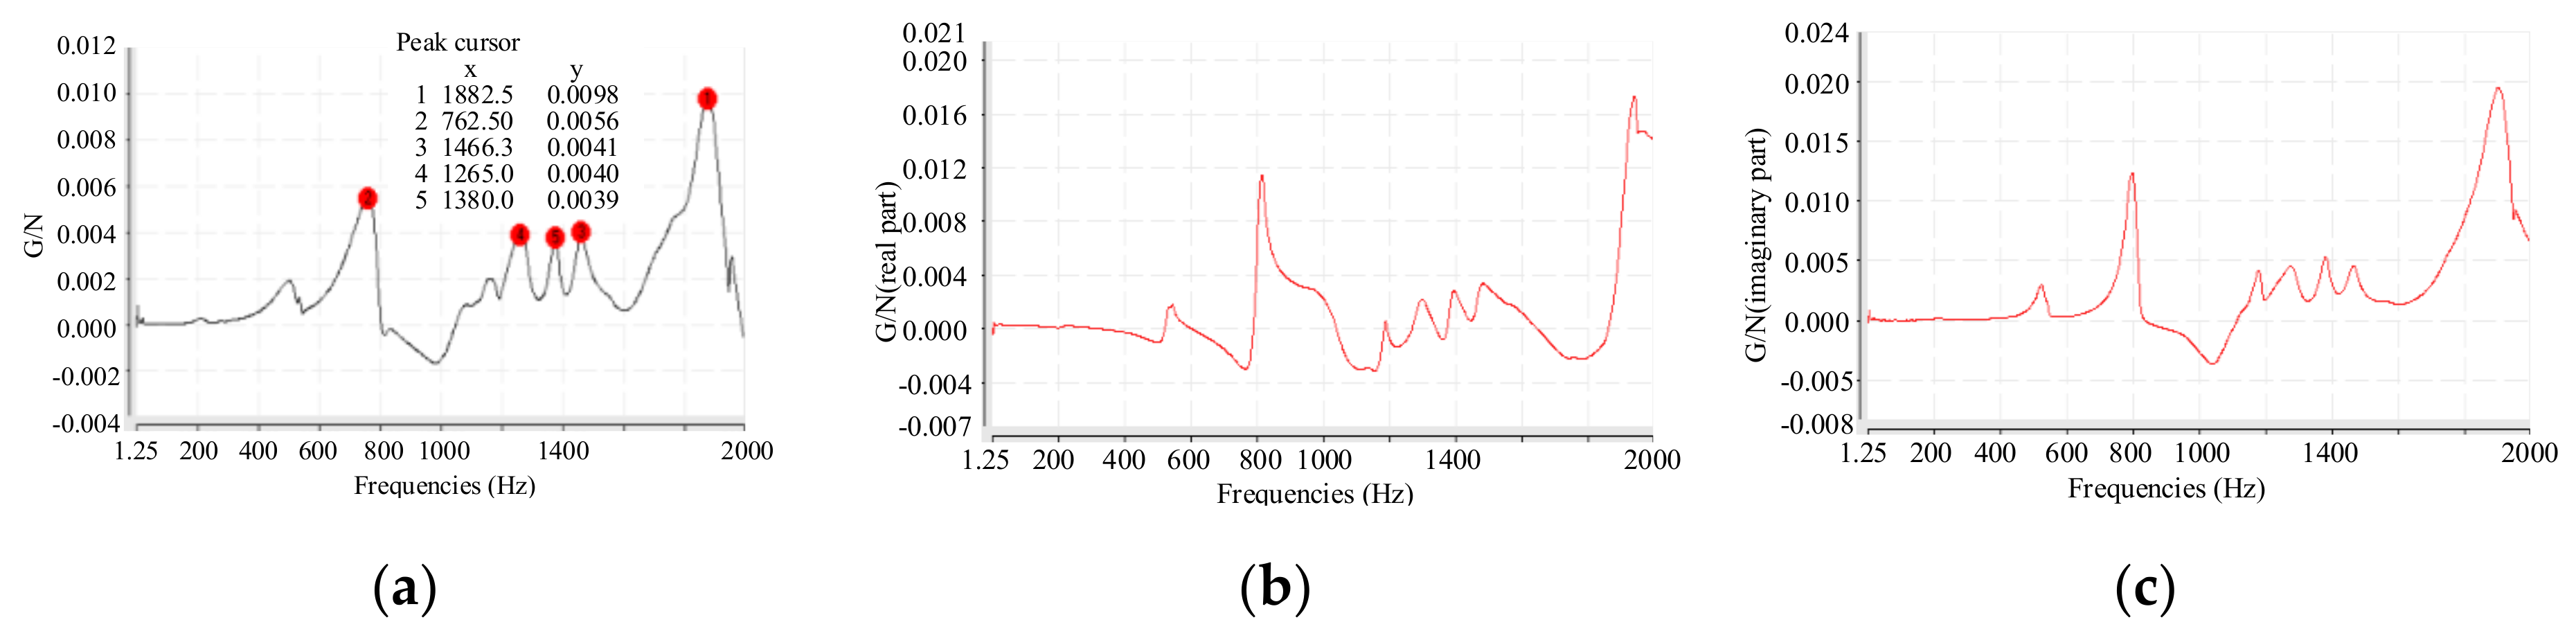
The modal test has been designed (see Figure 10) to identify the correctness of the finite element calculation results. From Figure 10a, it can be seen that the natural frequencies of the motor are 762.5 Hz, 1265 Hz, 1380 Hz, 1466.3 Hz and 1882.5 Hz. Compared with the amplitudes at 762.5 Hz and 1882.6 Hz, the amplitudes at 1265 Hz, 1380 Hz and 1466.3 Hz are relatively small. The test results are in good agreement with the finite element calculation results, the error is between 1% and 5%. The natural frequencies of the second radial modal shape of the whole motor are much larger than the stator. The rigidity of the motor structure is greatly improved due to the addition of the casing, end cap, winding and rotor. These additions cause a slight increase on the natural frequencies, and the number of natural frequencies also increases. The natural frequency of the motor is much larger than the characteristic frequency of the electromagnetic force, so it will not lead to motor resonance. The simulated and test results of the motor modes have been shown in Table 5.
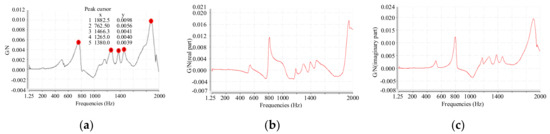
Figure 10.
Frequency-response waveforms of whole motor. (a) Frequency-response amplitude waveform; (b) Frequency-response amplitude waveform (real part); (c) Frequency-response amplitude waveform (imaginary part).
Table 5.
Comparison of simulated results and test results of motor modes.
4.2. Motor Vibration Test
The vibration displacement of the prototype motor is simulated and measured in this section. The electromagnetic force under the rated-load condition is applied to the tooth surface of the stator as the load in the finite element calculation of the motor vibration displacement. The starting process of the motor is not considered in this paper, and the vibration displacement is extracted when the motor is operating stably under the rated-load condition.
The radial vibration displacement is also measured, and the frequency spectrum of the vibration displacement is obtained by the spectrum analysis. The waveforms of the test and simulation results of the radial vibration displacement are shown in Figure 11. Since the starting process of the motor is a complicated process, this section only focuses on the vibration results under the steady-state condition. The motor operates smoothly when it runs after 300 ms. It can be observed that the amplitude of the measured vibration displacement is slightly larger than the amplitude of the simulated vibration displacement. This is because there are various factors that effect on the vibration of the motor including electromagnetic vibration, mechanical vibration and rotor vibration in the actual measurement process, but only electromagnetic vibration is considered in the simulation process.
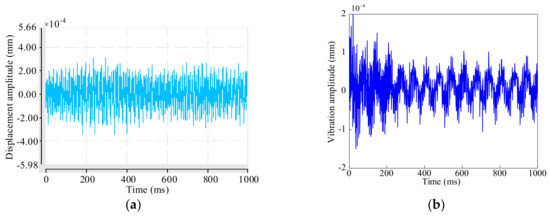
Figure 11.
Comparison of radial vibration displacement waveforms. (a) Measured vibration displacement waveform; (b) Simulated vibration displacement waveform.
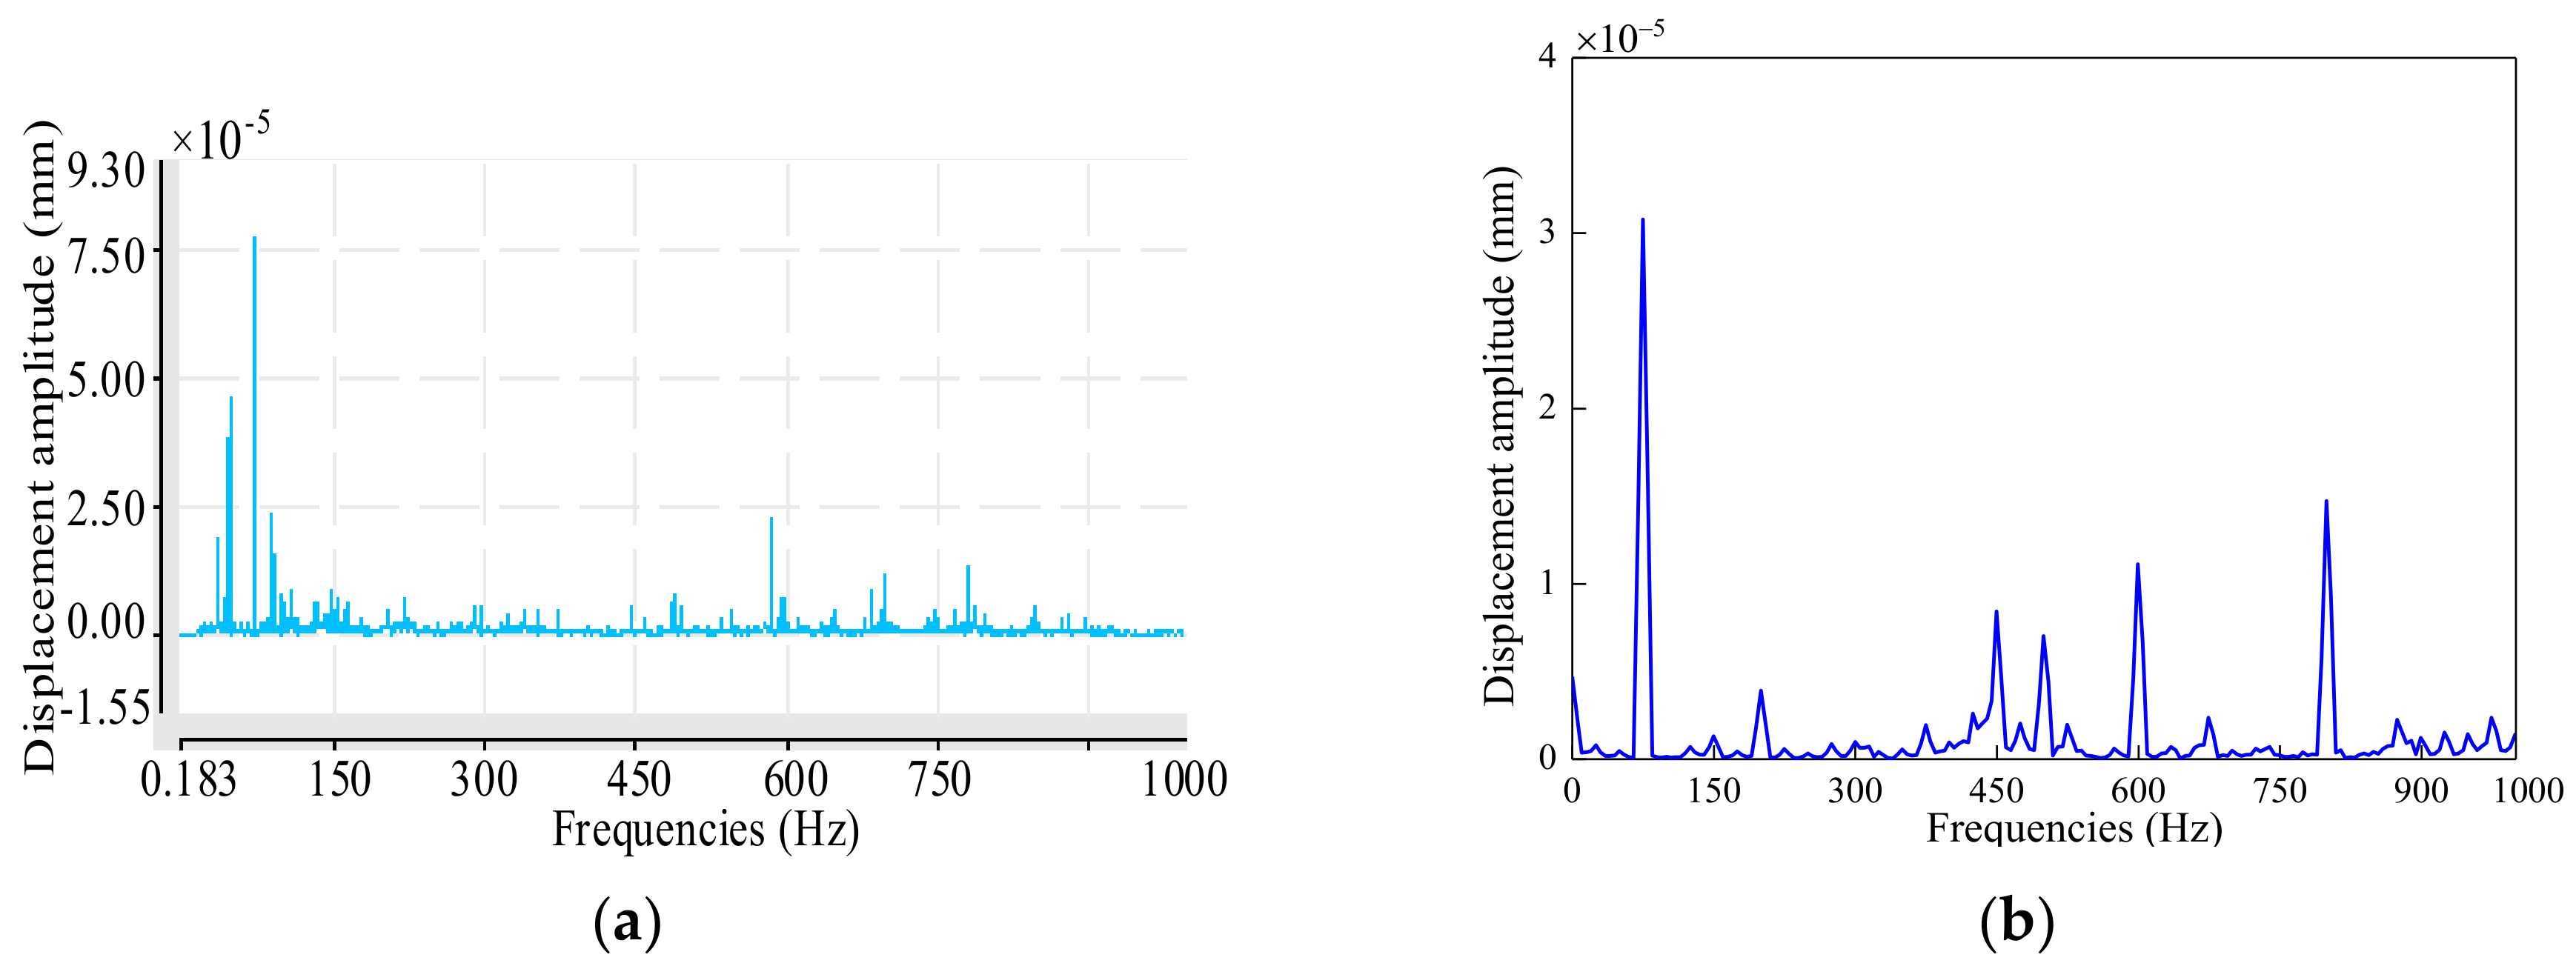
The frequency spectrum of the vibration characteristics in the time domain is shown in Figure 12. From this, it can be seen that the strongest influence on the vibration displacement is 75 Hz, which is the characteristic frequency of the electromagnetic force. The amplitudes of vibration displacement at 600 Hz and 800 Hz are small because there are small electromagnetic force waves that exist around both 600 Hz and 800 Hz. However, 600 Hz and 800 Hz are far away from the natural frequency of the second radial vibration shape, and therefore will only lead to a little radial vibration.
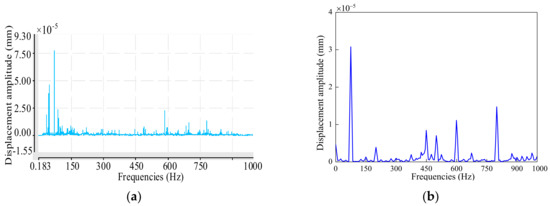
Figure 12.
Comparison of frequency spectrum of vibration displacement. (a) Measured vibration spectrum; (b) Simulated vibration spectrum.
4.3. Optimized Design and Research of Vibration
In order to reduce the vibration and the noise of the motor, the eccentric tooth edge design is proposed in this section.
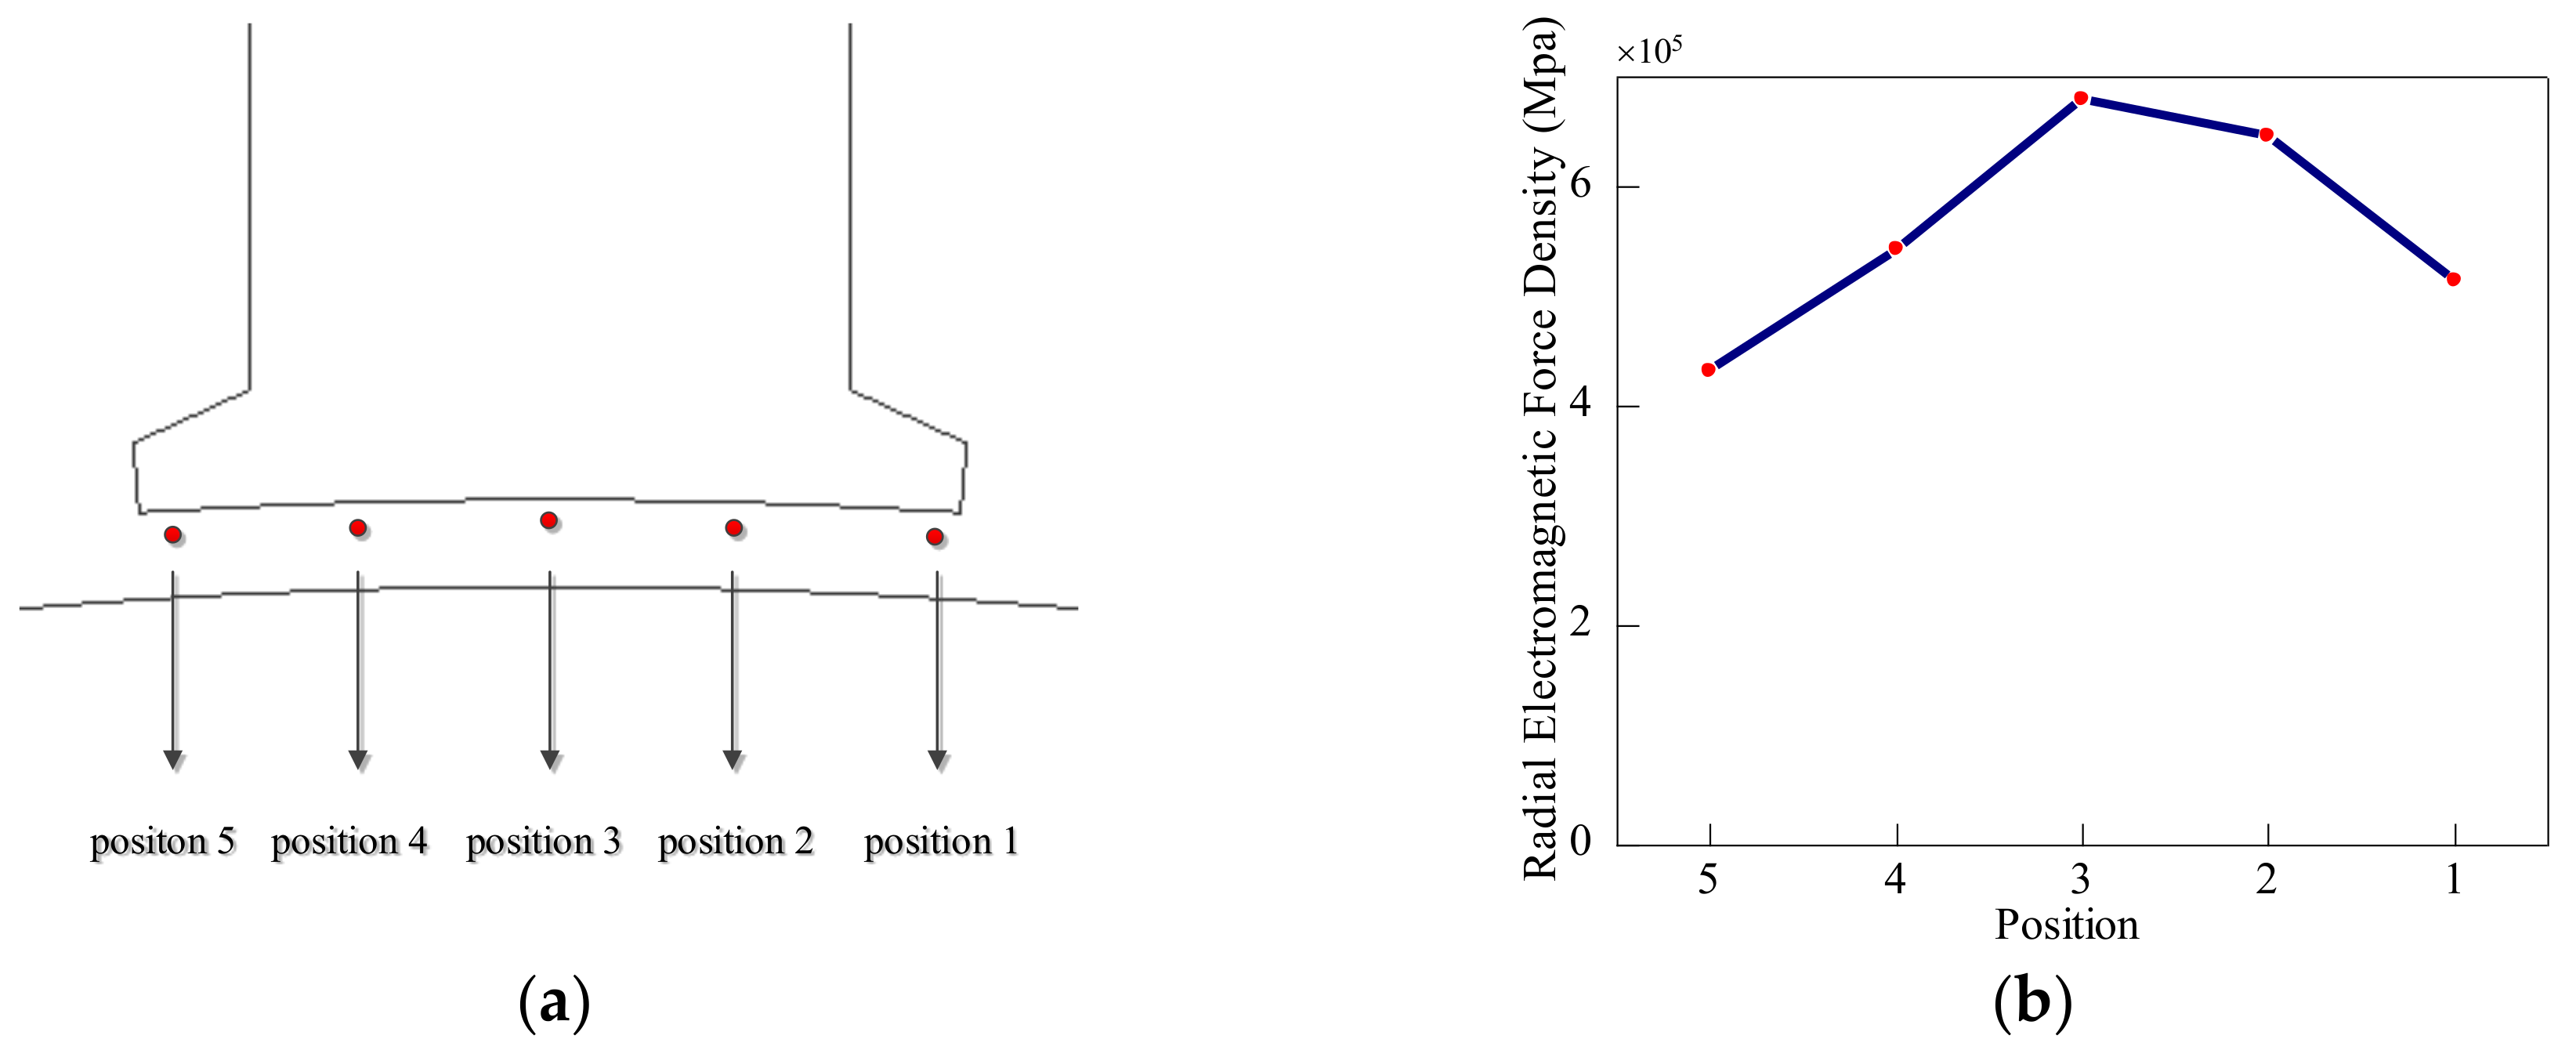
The distribution of the radial electromagnetic force on the stator teeth should be studied because the electromagnetic vibration is mainly caused by it. Five positions marked 1–5 are selected uniformly on a certain stator tooth, as shown in Figure 13a. According to the Maxwell tensor method, the radial electromagnetic force density of each position at a certain time is obtained, and the results are shown in Figure 13b. The radial electromagnetic force density at position 3 is greater than it is at other positions, and this is because the flux always follows the path of least reluctance. Hence, the magnetic density and the electromagnetic force at the middle position of the stator teeth are greater than the electromagnetic force at other positions.
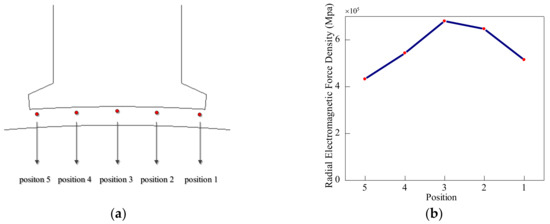
Figure 13.
(a) Position of selected points on a stator tooth; (b) Radial electromagnetic force density of five selected points.
Based on the above analysis results, an offset design on the top of the stator tooth is proposed in this section, that is, in the optimized motor, the top arc will be offset some distance along the radial direction. The sketch of this design can be seen in Figure 14, and W is the offset distance of position 3.
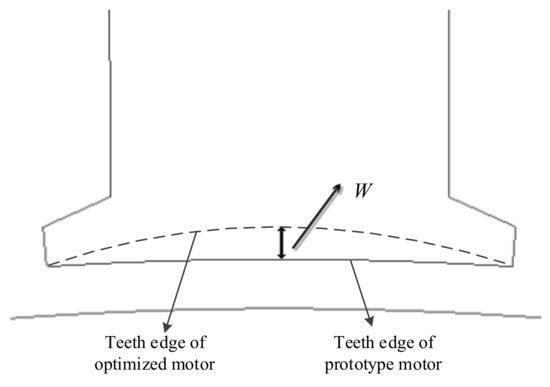
Figure 14.
Stator tooth of optimized motor.
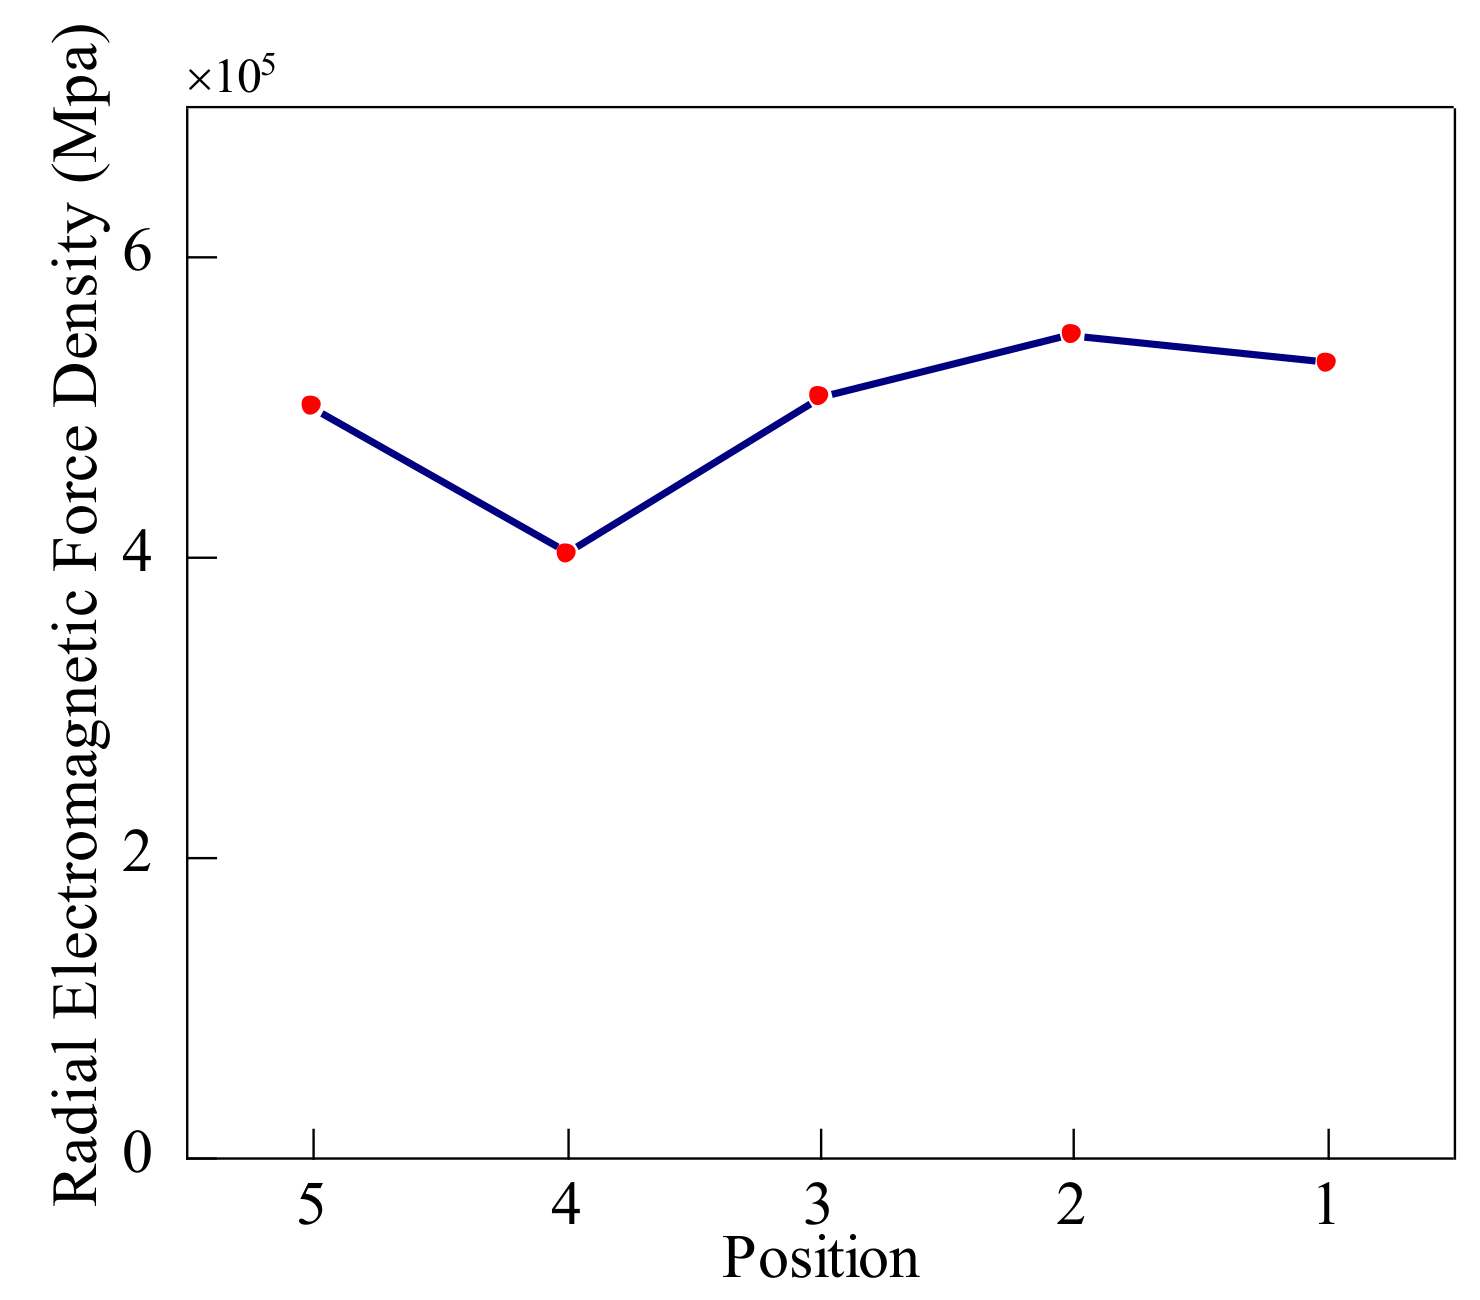
The W is calculated by FEM when W = 0.7 mm, the amplitude difference of the radial electromagnetic force density has a trend of decreasing markedly and the radial electromagnetic force at each point is more uniform. Figure 15 shows the radial electromagnetic force density of five selected points when W = 0.7 mm. Therefore, W = 0.7 mm is adopted in the optimized model.
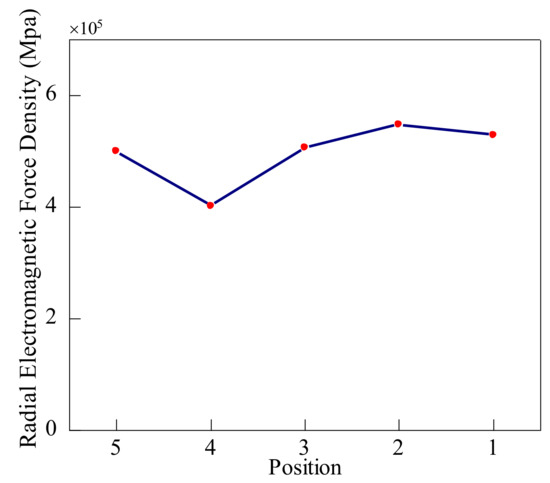
Figure 15.
Radial electromagnetic force density of five selected points when W = 0.7 mm.
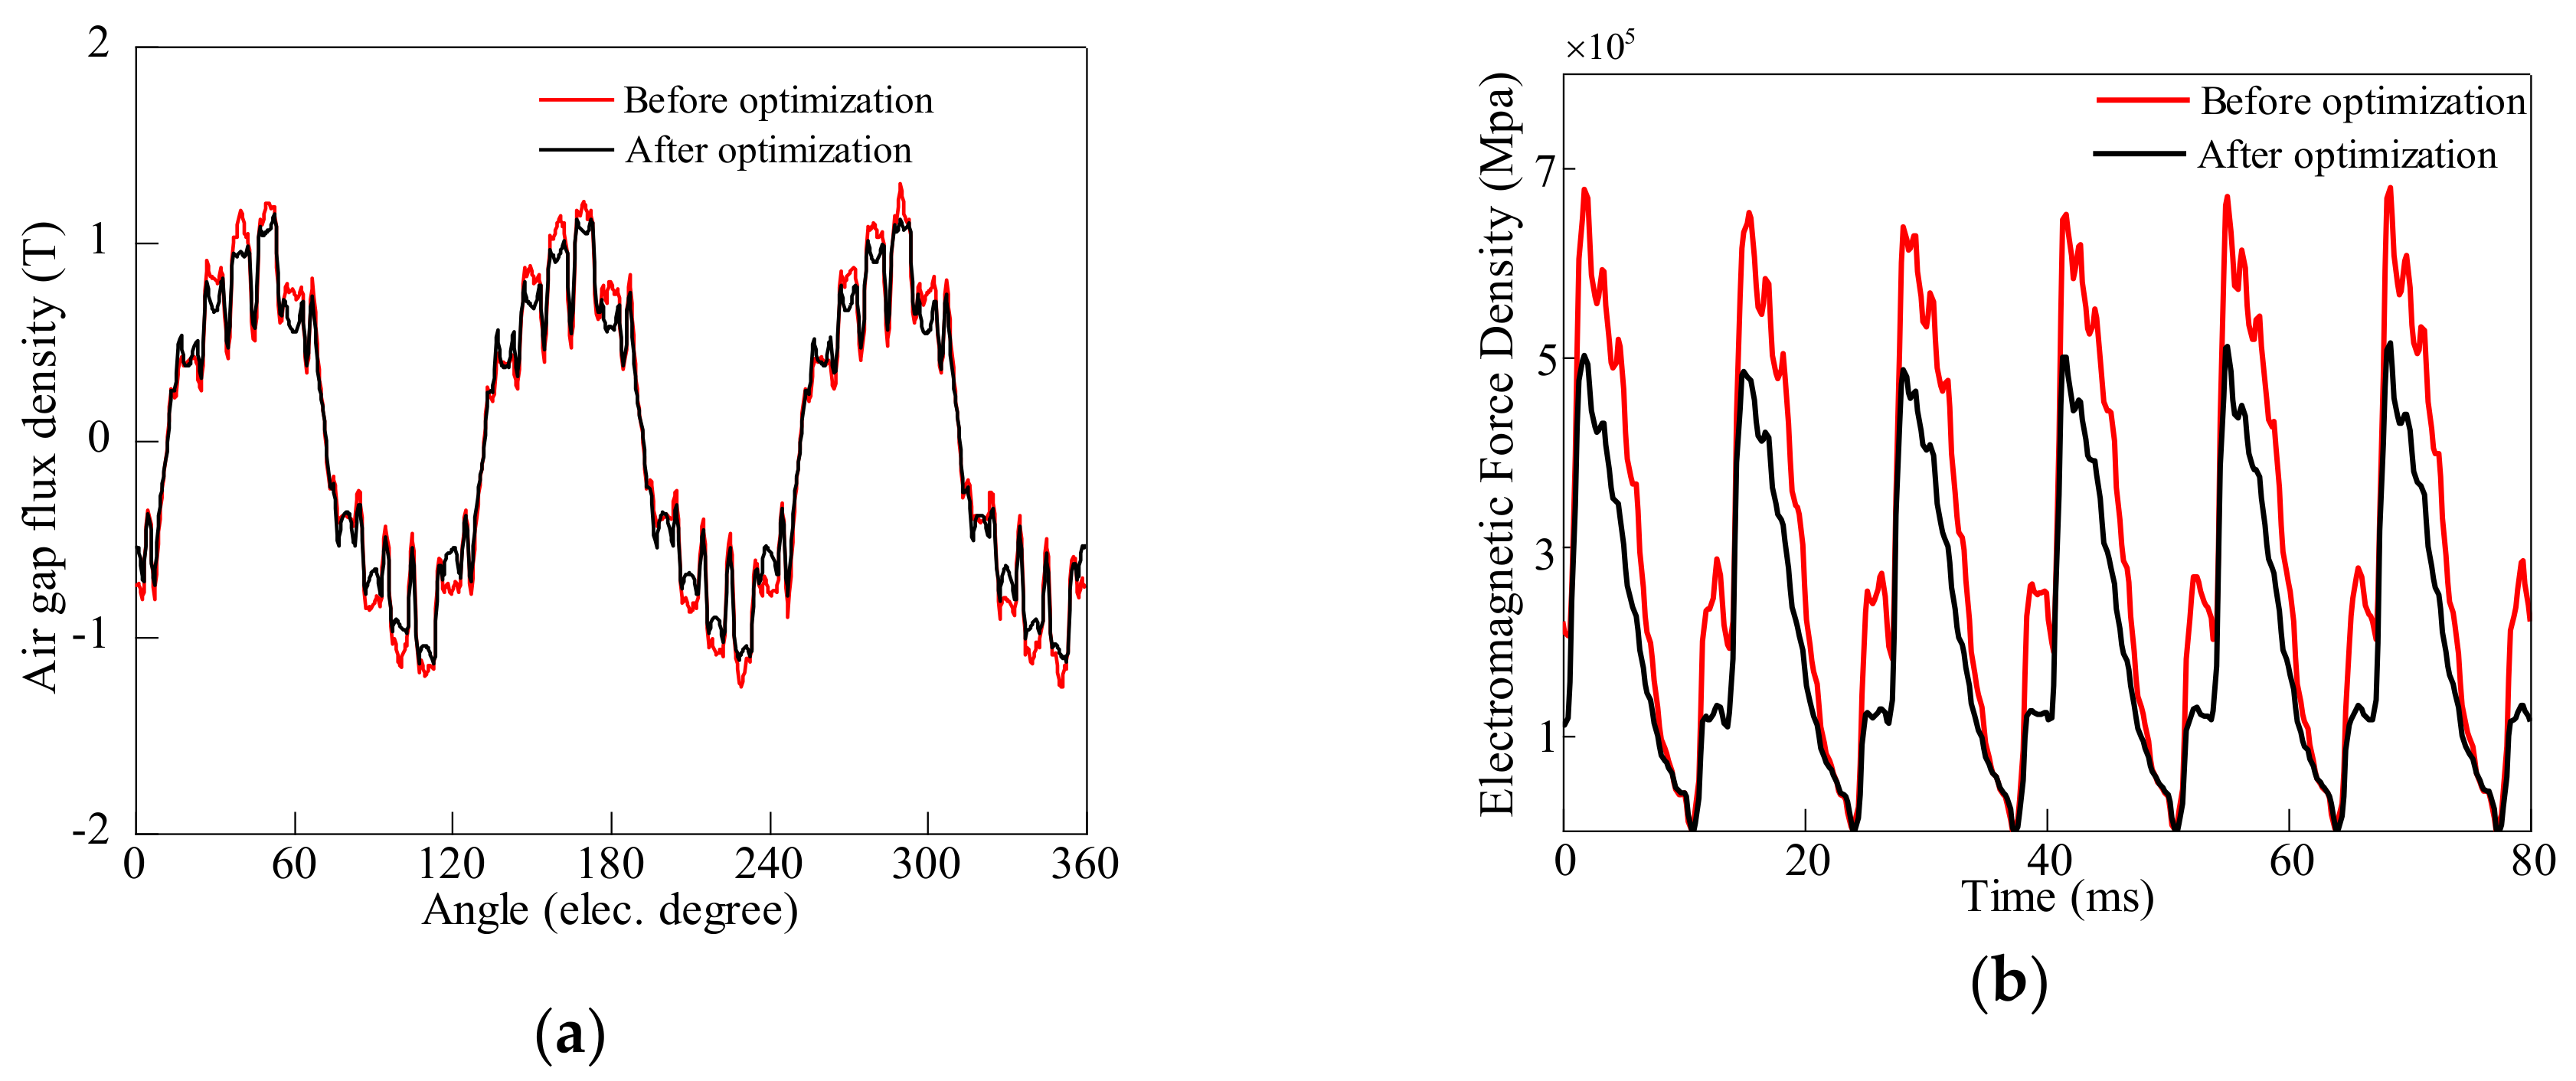
Figure 16a compares the radial air-gap flux density before and after optimization design. The amplitude of the radial electromagnetic force density at position 3 is effectively reduced after optimization, as shown in Figure 16b.

Figure 16.
Comparison of radial air-gap flux density and time-varying electromagnetic force at position 3 before and after optimization. (a) Radial air-gap flux density; (b) Radial time-varying electromagnetic force.
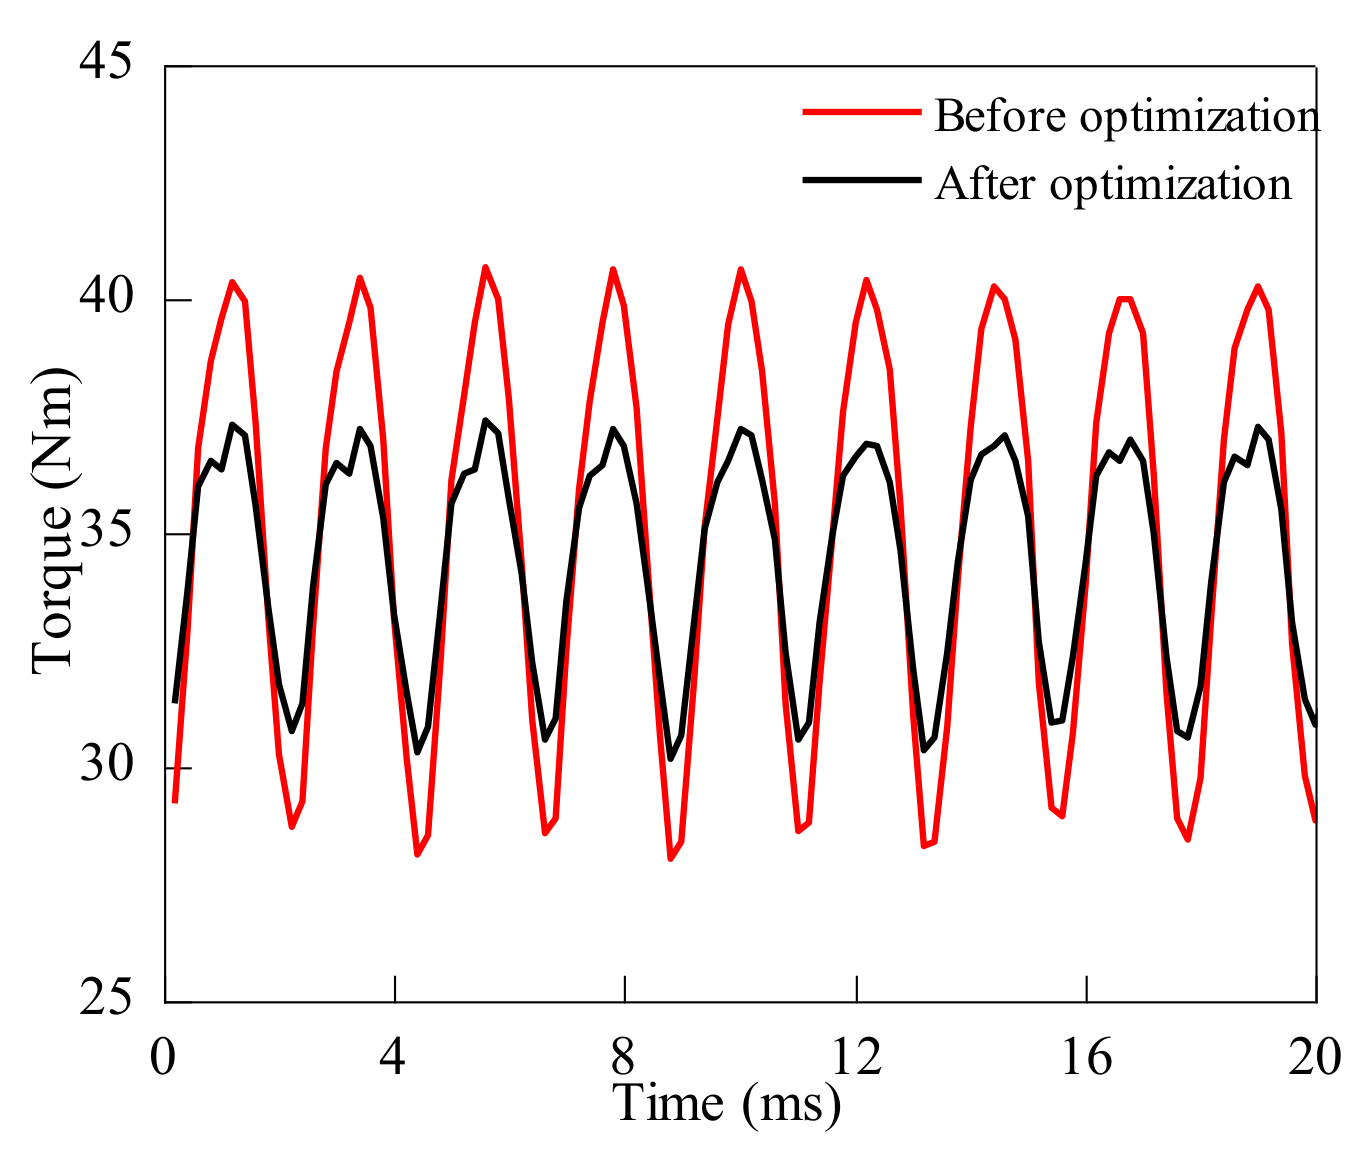
Meanwhile, the comparison of the torque before and after optimization is shown in Figure 17. Table 6 gives the value of the average torque and the torque ripple of the motor before and after optimization.
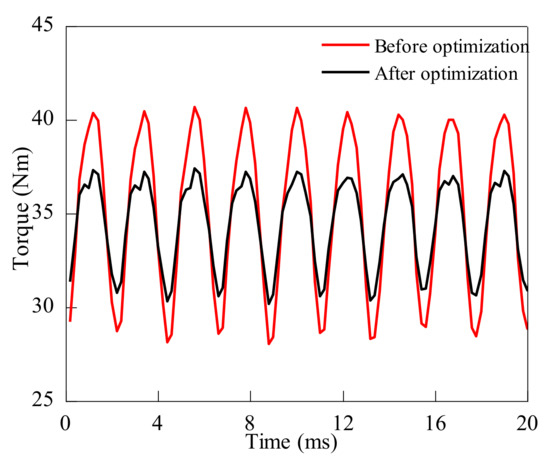
Figure 17.
Comparison of output torque before and after optimization.
Table 6.
Average torque and torque ripple of prototype motor and optimization motor.
The average torque of the prototype motor is 34.78 Nm, and the average torque of the optimized motor is 33.32 Nm. From Table 6, the output torque of the motor changes little, and the torque ripple is greatly reduced.
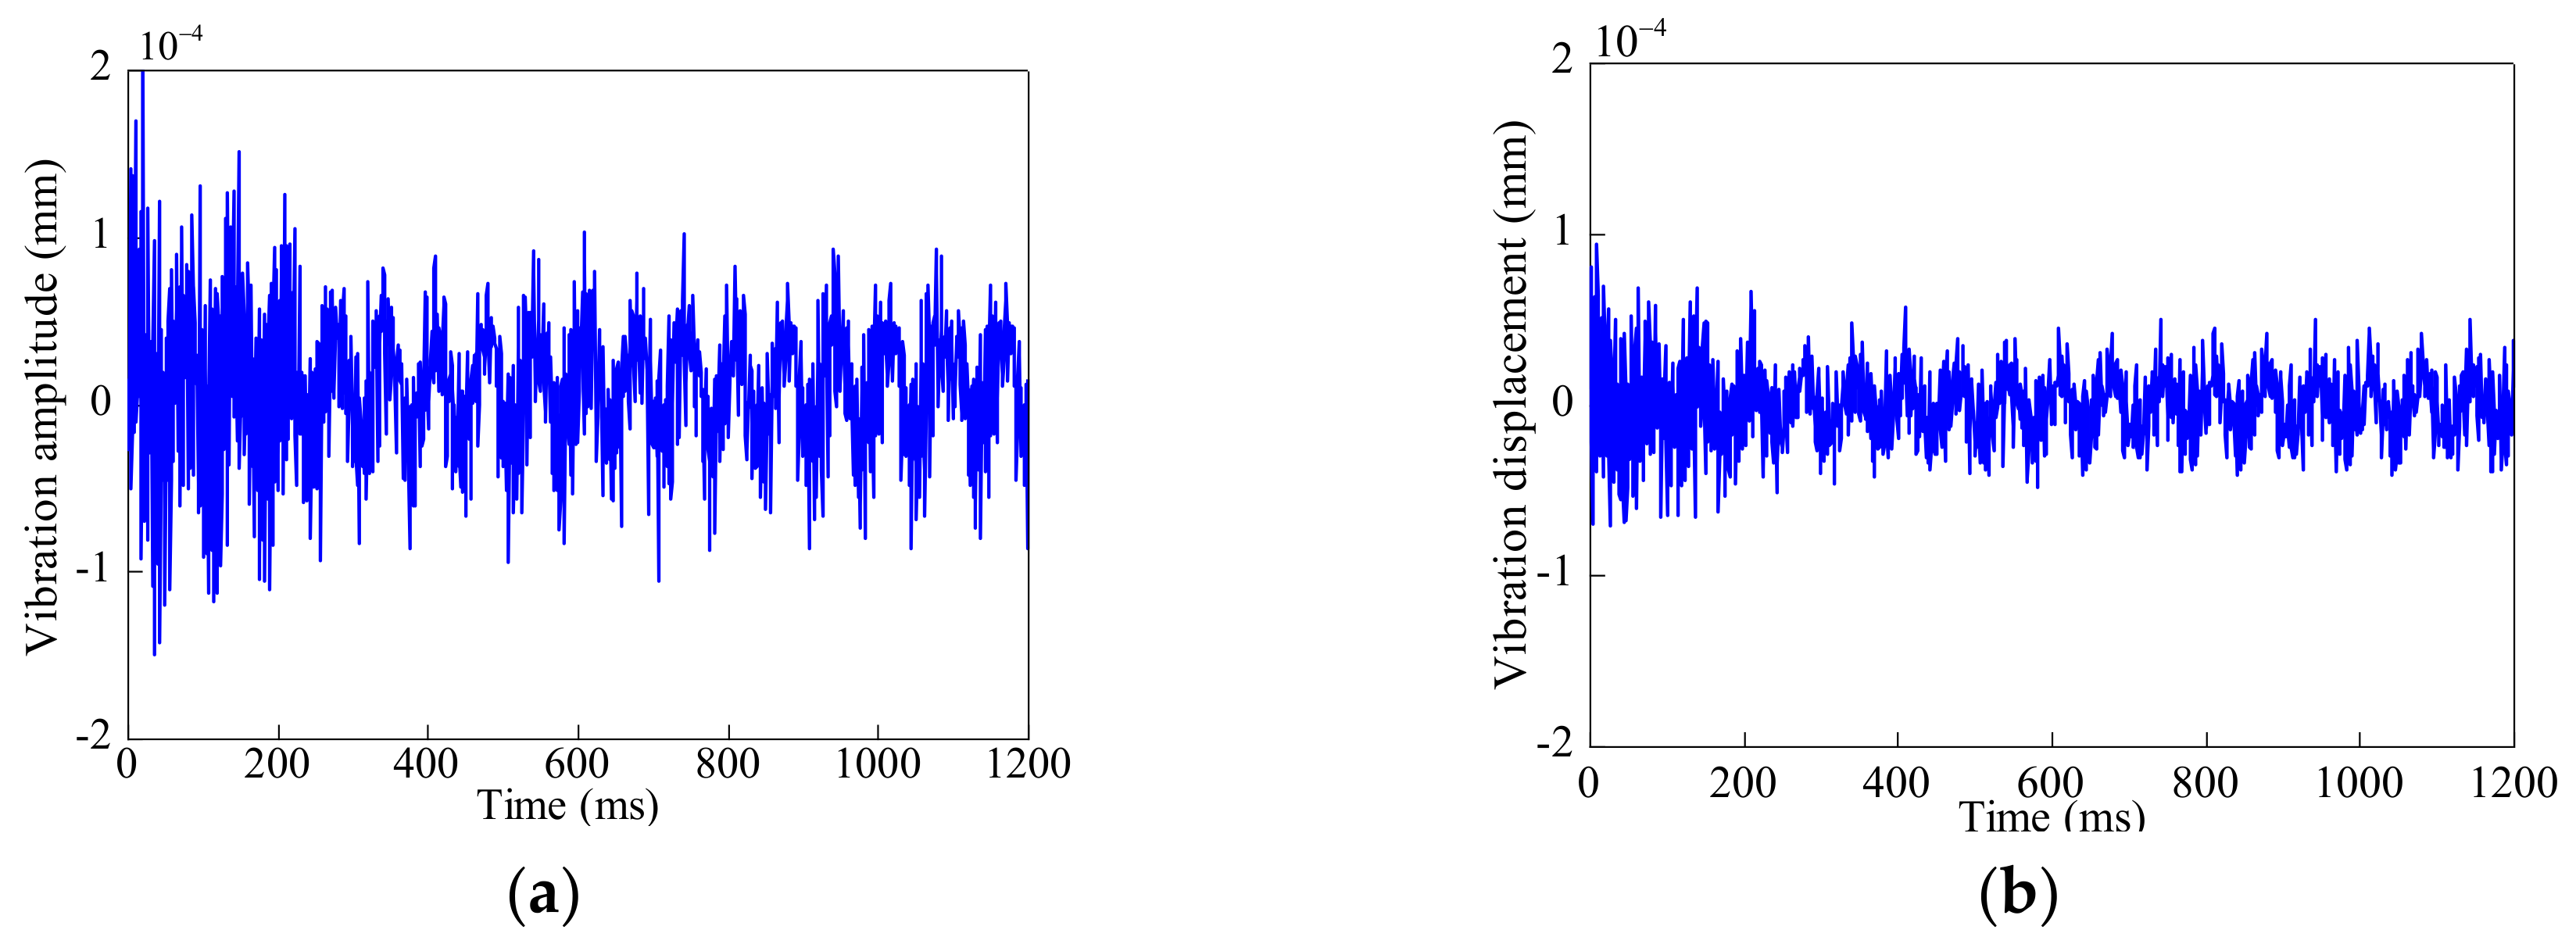
Figure 18 shows the waveforms of the vibration displacement in the Y-direction of point A on the motor. As can be seen from this figure, the amplitude of the radial vibration displacement is significantly reduced because the radial electromagnetic force is reduced after optimization.

Figure 18.
Waveforms of vibration displacement in the Y-direction of point A on the motor. (a) Prototype motor; (b) Optimized motor.
5. Conclusions
In this paper, a 3 kW, 380 V, 6-pole IPMSM is taken as the research object, and the orders of the electromagnetic force wave and the natural frequencies of the electromagnetic force are deduced. The natural frequencies of the stator and the motor are calculated respectively. The electromagnetic vibrations of the prototype motor are analyzed, and the simulation results of the vibration displacement are verified by the experimental results. The eccentric tooth edge design is also proposed to reduce the motor vibration. The conclusions obtained are as follows:
(1) For an integer slot motor, the electromagnetic force is generated by the interaction of the MMF of the fundamental wave, the winding and the PM. However, the amplitude of the electromagnetic force at the double frequency generated by the MMF of the fundamental wave is the maximum, and it has the greatest influence on motor vibration. The decrease of the electromagnetic force at the double frequency can effectively reduce the electromagnetic vibration.
(2) The characteristic frequency of the electromagnetic force is 75 Hz, which has the greatest influence on vibration. The characteristic frequency is much smaller than the natural frequencies of the second radial modal shape, so the motor is not prone to violent resonance.
(3) An acceleration sensor is used to collect the vibration displacement waveform of the prototype motor under the rated load condition, and the spectrum analysis is carried out. The simulation results are compared with the simulation results to verify the correctness of the transient dynamic analysis method and simulation used in this paper.
(4) We have proposed an unconventional stator tip arc shape to reduce the unevenness of the radial magnetic density distribution at the stator tip in this paper, thereby reducing the motor vibration caused by the radial force. The method used in this paper is different from the method of increasing the air gap. The method used in this paper reduces the radial electromagnetic force and effectively reduces the torque fluctuation, which is beneficial to weaken the vibration of the motor and make the operation of the motor more stable. The effect of the radial electromagnetic force density is greatly reduced, so the method used in this paper has little effect on the electromagnetic performance of the motor.
Author Contributions
Y.X. (Ying Xie). supervised all process; Y.X. (Yu Xia) implemented simulation; Z.L. analyzed the data; F.L. checked paper format.
Funding
This research received no external funding.
Acknowledgments
This work was supported by National Natural Science Foundation of China (51977052); National Engineering Research Center of Large Electric Machines and Heat Transfer Technology.
Conflicts of Interest
The authors declare no conflict of interest.
References
- Dai, Y.; Cui, S.M.; Song, L.W. Finite element method modal analysis of driving motor for electric vehicle. Proc. CSEE 2011, 319, 100–104. [Google Scholar]
- Yang, Z.L.; Wang, S.M.; Hong, J.F. Analysis of electromagnetic exciting force and vibration of rotating armature permanent magnet synchronous motor. J. Eng. 2018, 2018, 1903–1908. [Google Scholar] [CrossRef]
- Jang, I.S.; Ham, S.H. Method for analyzing vibrations due to electromagnetic force in electric motors. IEEE Trans. Magn. 2014, 502, 297–300. [Google Scholar] [CrossRef]
- Zheng, J.; Dai, Y.; Shi, J. Electromagnetic noise characteristics of permanent magnet synchronous motor applied in electric vehicle. Trans. China Electrotech. Soc. 2016, 31, 53–59. [Google Scholar]
- Liu, C.M.; Cao, G.Z.; Huang, S.D. Modal analysis and linear static structure analysis of linear switched reluctance motor. In Proceedings of the 2014 4th IEEE International Conference on Information Science and Technology, Shenzhen, China, 26–28 April 2014. [Google Scholar]
- Calin, I.; Filip, F.; Helerea, E. Three-phase squirrel-cage induction motor modal analyses. Theoretical and experimental aspects. In Proceedings of the 2012 13th International Conference on Optimization of Electrical and Electronic Equipment (OPTIM), Brasov, Romania, 24–26 May 2012. [Google Scholar]
- Xie, Y.; Wang, Y.; Lv, S. Modal calculation and test of small asynchronous motor. Trans. China Electrotech. Soc. 2015, 3016, 1–9. [Google Scholar]
- Liu, D.Z. Modal analysis of induction motor stator. Drive Syst. Tech. 2016, 303, 24–29. [Google Scholar]
- Wang, K.; Wang, X.H.; Tian, M.M. The model analysis of the stator of the interior permanent magnet machine. In Proceedings of the 2017 20th International Conference on Electrical Machines and Systems (ICEMS), Sydney, Australia, 11–14 August 2017. [Google Scholar]
- Wang, K.; Wang, X.H. The model analysis of the stator of the interior permanent magnet synchronous motor. In Proceedings of the 2017 IEEE Transportation Electrification Conference and Expo, Asia-Pacific (ITEC Asia-Pacific), Harbin, China, 7–10 August 2017. [Google Scholar]
- Chai, F.; Li, Y.; Pei, Y.L. Accurate modelling and modal analysis of stator system in permanent magnet synchronous motor with concentrated winding for vibration prediction. IET Electr. Power Appl. 2018, 128, 1225–1232. [Google Scholar] [CrossRef]
- Li, X.H.; Huang, S.R.; Zhang, Q. Analysis of natural frequencies of stator structure of permanent magnet synchronous motors for electric vehicles. Proc. CSEE 2017, 378, 2383–2390. [Google Scholar]
- Doyeon, K.; Jeongyong, S. Magnetic and structural finite element analysis of rotor vibrations due to magnetic forces in IPM motor. IEEE Trans. Magn. 2014, 50, 502. [Google Scholar]
- Wang, L.; Bao, X.H.; Di, C. Influence on vibration and noise of squirrel-cage induction machine with double skewed rotor for different slot combinations. IEEE Trans. Magn. 2016, 52, 1–4. [Google Scholar] [CrossRef]
- Lee, J.Y.; Chang, J.H. Analysis of the vibration characteristics of coaxial magnetic gear. IEEE Trans. Magn. 2017, 53, 1–4. [Google Scholar] [CrossRef]
- Chen, Y.G.; Han, B.R.; Shen, Y.H. Electromagnetic vibration analysis of permanent magnet synchronous propulsion motor. Trans. China Electrotech. Soc. 2017, 3223, 16–22. [Google Scholar]
- Li, X.; Yang, K.M.; Zhu, Y. Research on vibration suppression for planar motors on the basis of modal force constraint. Proc. CSEE 2015, 3512, 3124–3131. [Google Scholar]
- Yang, X.D.; Bai, R.L.; Yu, S.L. Fractional-Slot Surface-Mounted Permanent Magnet Synchronous Motor Vibration. Small Spec. Electr. Mach. 2017, 45, 18–20. [Google Scholar]
- Zhang, R.; Wang, X.H.; Qiao, D.W.; Yang, Y.B. Reduction of Exciting Force Wave for Permanent Magnet Motors by Teeth Notching. Proc. CSEE 2010, 3018, 103–108. [Google Scholar]
- Zang, X.; Wang, X.H.; Yang, Y.B.; Wei, B. Vibration Reduction of a Switchen Reluctance Motor Using New Rotor Tooth with Slot on Each Side. Proc. CSEE 2015, 356, 1508–1515. [Google Scholar]


© 2019 by the authors. Licensee MDPI, Basel, Switzerland. This article is an open access article distributed under the terms and conditions of the Creative Commons Attribution (CC BY) license (http://creativecommons.org/licenses/by/4.0/).