Abstract
Tectonically deformed coal (TDC) has a significant influence on coalbed methane recovery. Well-logging is a reliable and efficient way to predict the development of TDCs for understanding the role of TDC on the productivity of coalbed methane (CBM) wells. However, there has been insufficient research regarding both the static physical properties and dynamic invasion of mud-filtrate related to TDCs. Therefore, a new TDC-detecting approach using two indicators of the relative physical properties and fluid attributes was proposed. Through the data normalization and optimization of correlation coefficients and factor analysis, five logs were chosen to construct the two indicators, and three types of TDC were recognized: I—undeformed or cataclastic; II—granulated; and III—mylonitized. It was found out that the identification error rate decreased from 30% to 15%. Furthermore, the thickness ratio of a well-preserved coal layer derived from TDC interpretation was adopted to correlate the gas production of a coal seam. An application in the Hancheng block demonstrated that the thickness ratio of 60% is an explicit threshold value to distinguish between high-yield well (>1000 m3/d) and low-yield one (<750 m3/d). The development of granulated and mylonitized coals mainly exerts negative influence on CBM well production.
1. Introduction
In China, coalbed methane (CBM) recovery faces many challenges due to highly diversified and complicated geologic conditions [1]. Tectonically-deformed coal (TDC) is one of the crucial factors leading to low gas productivity [2]. Getting a high production of gas from tectonically deformed coal (TDC) is very difficult. The occurrence of TDC has caused many problems, such as poor permeability [3,4,5,6], coal fine blockage and rapid productivity degradation [7,8]. Therefore, the accurate interpretation of TDC zones is of importance in the productivity evaluation of CBM wells.
TDC is known as the deformation of the texture and sedimentary structure of coal mass in the course of tectonic history evolution. In general, TDC can be classified into three types, cataclastic, granulated, and mylonitized [9]. Due to extremely rare samples of CBM exploitation wells, extracting explicit information about TDCs using geophysical logging has become a key issue.
Reliable well-logging interpretation depends on a rock physics test. It has been testified that the static physical properties of mechanical strength [7,10], velocity [11,12], resistivity [13,14], elastic modulus [15] and pore-fracture system [16] change complicatedly with the type of TDC. A more consistent understanding of the increasing deformation degree of TDC can be obtained by means of decreasing density, sonic velocity, resistivity and strength. However, these abnormalities are influenced by the gas content, water saturation, stress condition, and metamorphic grade of coal. Wang et al. and Lu et al. pointed out that it is virtually impossible to find a defined threshold value to distinguish TDC and undeformed coal [12,17]. Thus, the accurate prediction of TDC is a huge challenge for geophysical logging.
Based on the rock physics knowledge, the well-logging identification methods of TDC have mainly focused on the logs of hole diameter, resistivity, acoustic travel-time, density and natural gamma, neutron porosity, and their absolute amplitude or threshold value corresponding to the different TDCs and undeformed coal. Generally, resistivity, hole diameter, density and acoustic travel-time are more sensitive to TDC and are widely used [5,14,18,19,20,21,22,23,24,25]. However, these parameters are analyzed independently in the conventional or qualitative methods. In order to synthetically extract or magnify these logging abnormalities, some quantitative prediction methods have been developed including cluster analysis [26,27], principal component analysis [28,29], extreme learning machines [30] and simple algebraic operations [31]. These applications have improved the efficiency and accuracy of TDC prediction. However, a key point which has still been neglected is the reference substance: Undeformed coal. If undeformed coal has a defined value in the quantitative TDC prediction model of a certain block, this model will become meaningless to other blocks, because the physical properties of undeformed coal vary greatly from different blocks. The relative change rate for the value of undeformed coal is universal rather than a defined value. This idea was adopted in the proposed method.
A still rarely noticed phenomenon is the mud-filter invasion related to TDCs. The dual-laterolog method, including the logs of deep-laterolog resistivity (LLD), shallow-laterolog resistivity (LLS) and microspherical focused resistivity (MSFL), has been widely used to study mud-filtrate invasion caused by the variations in sandstone permeability and fluid types around the borehole since 1985 [32]. Hoyer [33] and Rozak [34,35] both found obvious mud-filtrate invasion and successfully predicted coal permeability. They illustrated that the invasion can occur in medium- and low-rank coal. Our previous work [36] observed mud-filtrate invasion in high-rank coal, and the difference in dual-laterolog can be used to accurately identify granulated coal. Chen [37] and Wang [38] studied high-rank coal with deep buried depth and found that, compared to undeformed and cataclastic coal, the overlapping area between LLD and LLS in granulated coal tended to decrease by 5%–10%. The relative changes of LLD, LLS and MSFL can reflect the dynamic invasion of mud-filtrate related to TDCs and can be applied to reduce the uncertainty of TDC identification.
The purpose of this study was to propose a comprehensive method regarding both the static physical properties and dynamic invasion of mud-filtrate related to TDCs. Eighty-one drilling coal core samples and five logs, including hole diameter (CAL), bulk density (DEN), acoustic travel-time (DT), LLD and MSFL, were utilized to construct the two indicators—the relative physical properties indicator (RPPI) and the relative fluid indicator (RFI)—which is the novelty of the proposed method. In addition, 36 CBM exploitation wells in the Hancheng (HC) block were employed to verify that the TDC information derived from geophysical logging is helpful to evaluate CBM well-productivity, both simply and reliably.
2. Geological Setting
2.1. Geological Setting
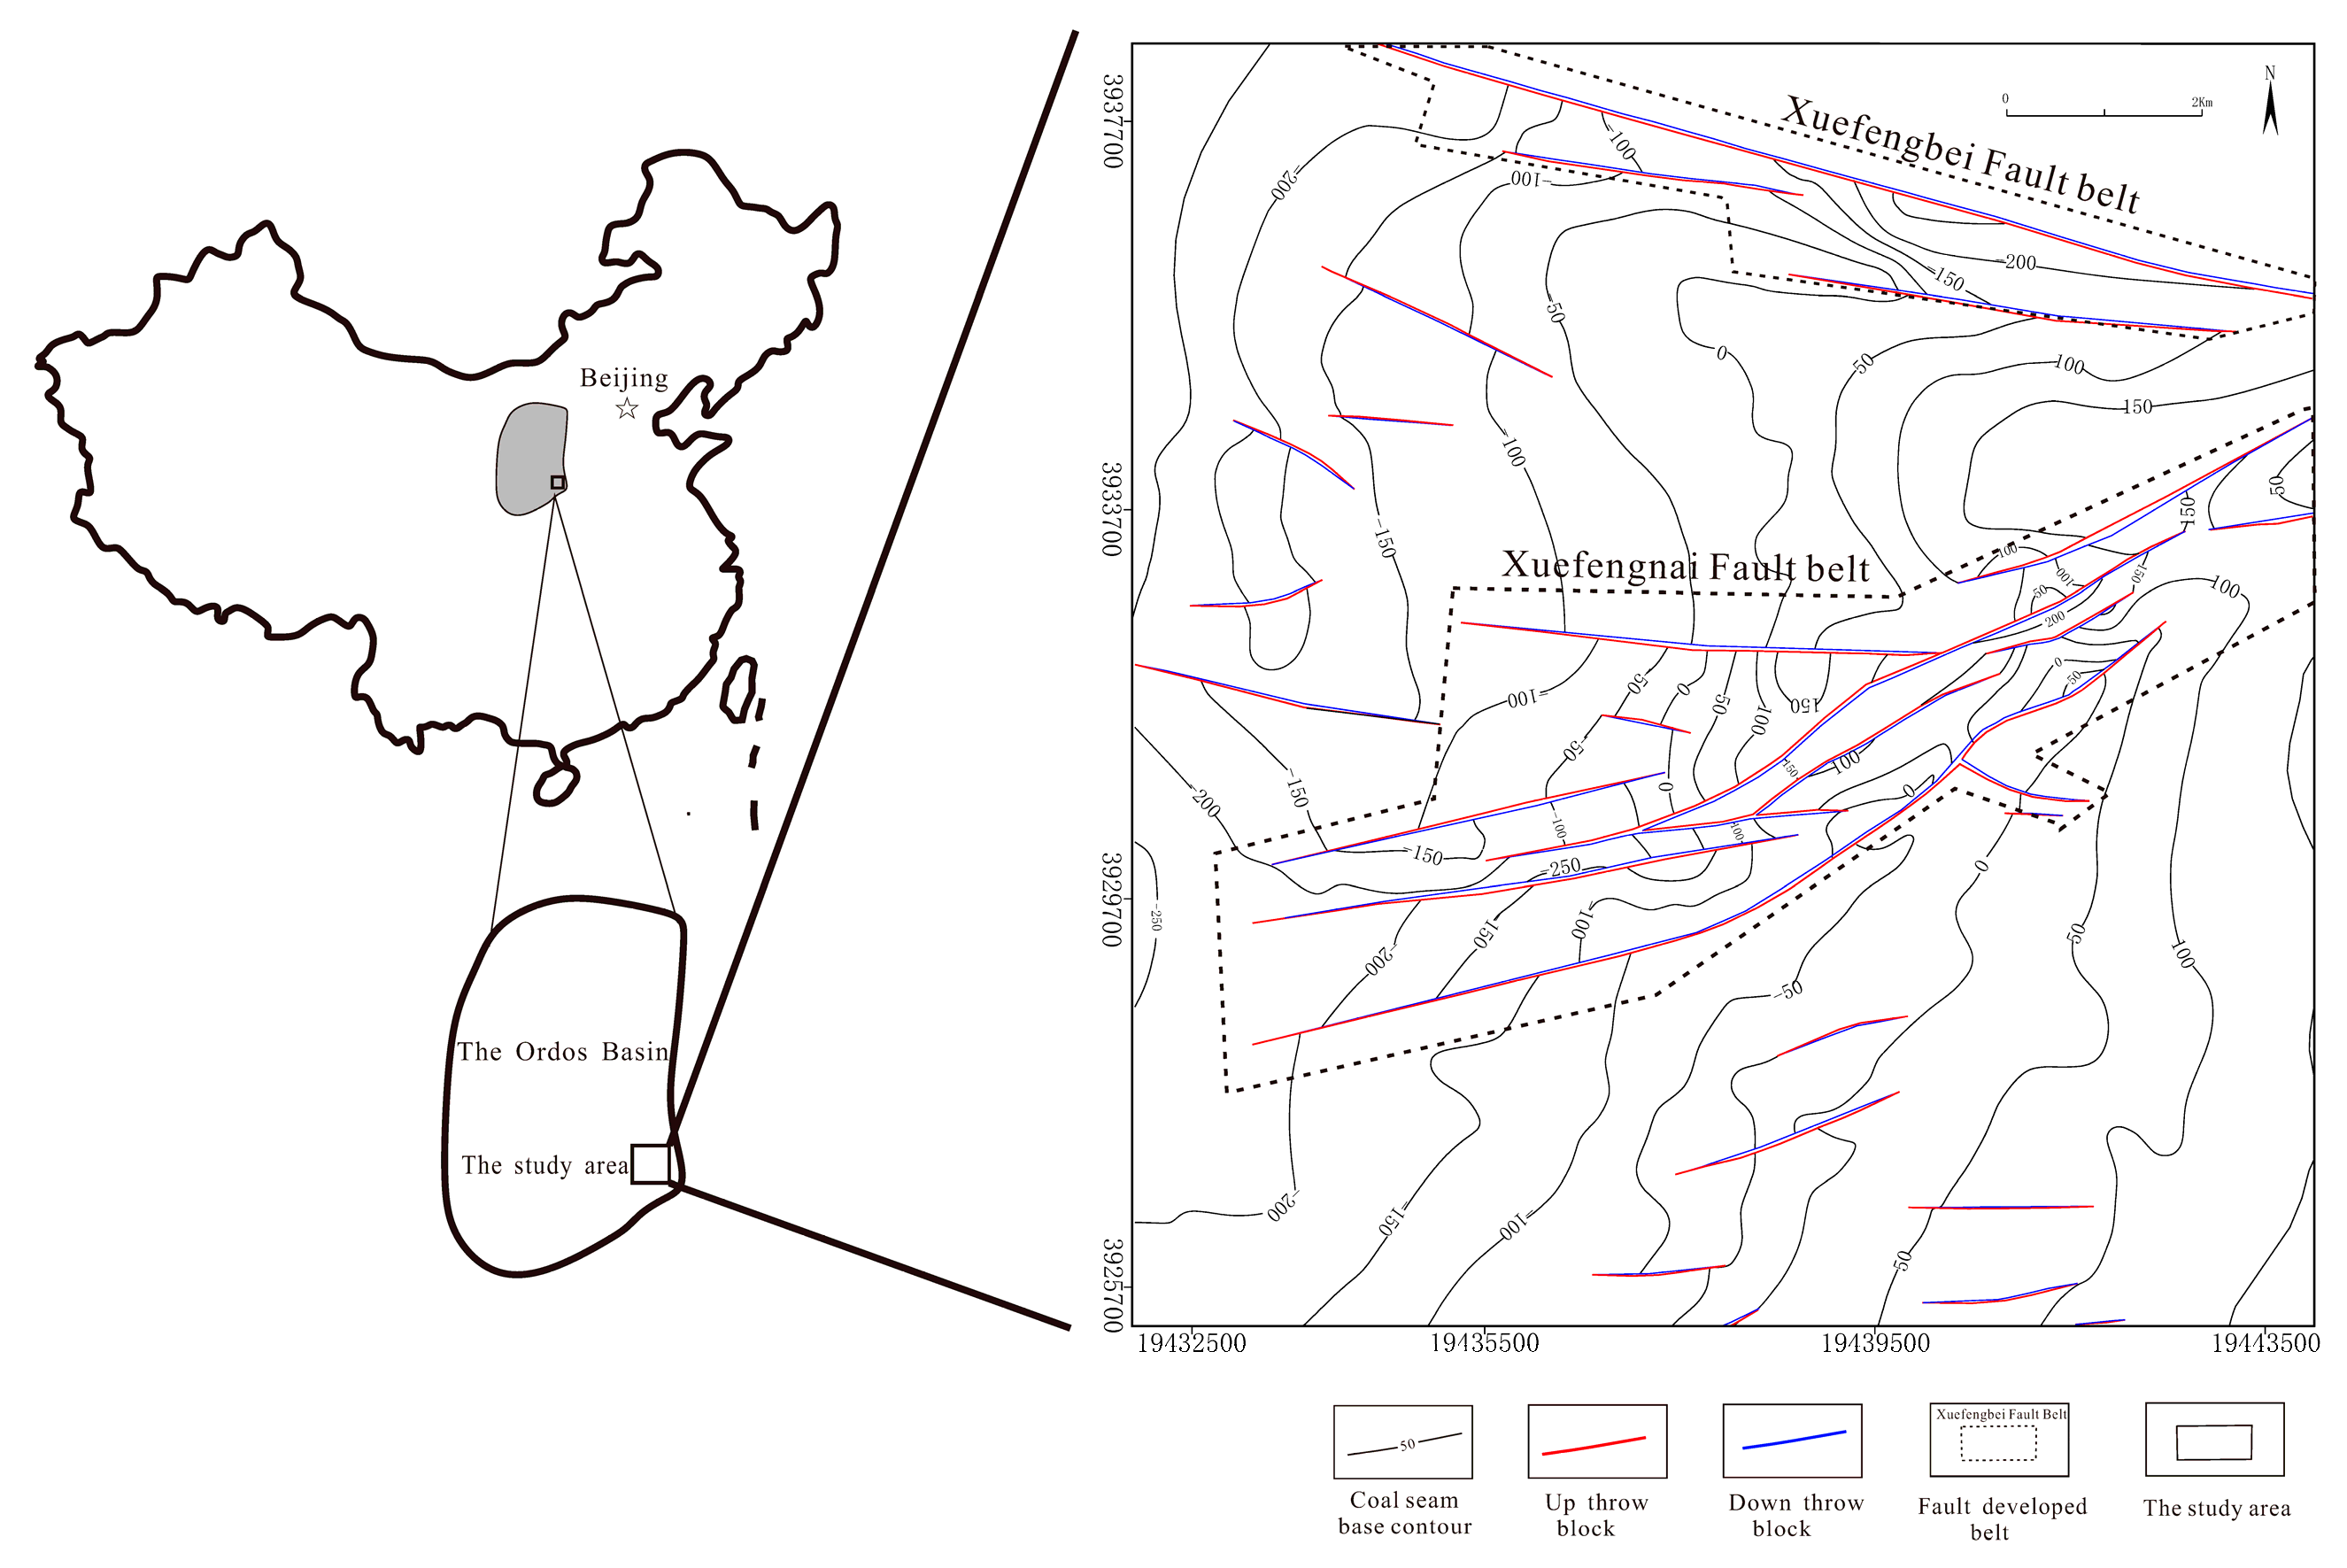
The HC Block lies along the southeastern margin of the Ordos Basin. The study area has a simple uniclinal structure with a northeastern strike and northwestern dip (Figure 1) controlled by Indosinian, Yanshan and Himalayan movements, which form the two major faults zones of the Xuefengbei reverse fault and Xuefengnan normal fault.
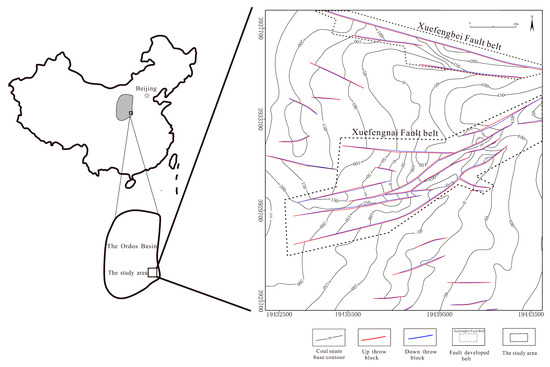
Figure 1.
Location and geological structure of the Hancheng (HC) block (the structural outline is from the No. 11 coal seam base).
2.2. Coal-Bearing Strata
The measured coal strata refer to the Carboniferous Taiyuan Formation and the Lower Permian Shanxi Formation. The Shanxi Formation and Taiyuan Formation developed in seashore-delta and tidal flat sedimentary environments, respectively [39]. The Shanxi Formation consists of coal seams, mudstone, and sandstone, and the Taiyuan Formation mainly consists of coal seams, limestone and mudstone [29]. The target No. 5 and No. 11 coal seams are the two CBM development layers. In the study area, both coal seams are continuous and stable. The average thickness of the No. 5 coal seam is 2.79 m, while the thickness of the No. 11 coal seam is 5.85 m. They are all high-grade metamorphic bituminous coal with a mean maximum vitrinite reflectance value of 1.7%.
2.3. Site Observations of Coal Samples
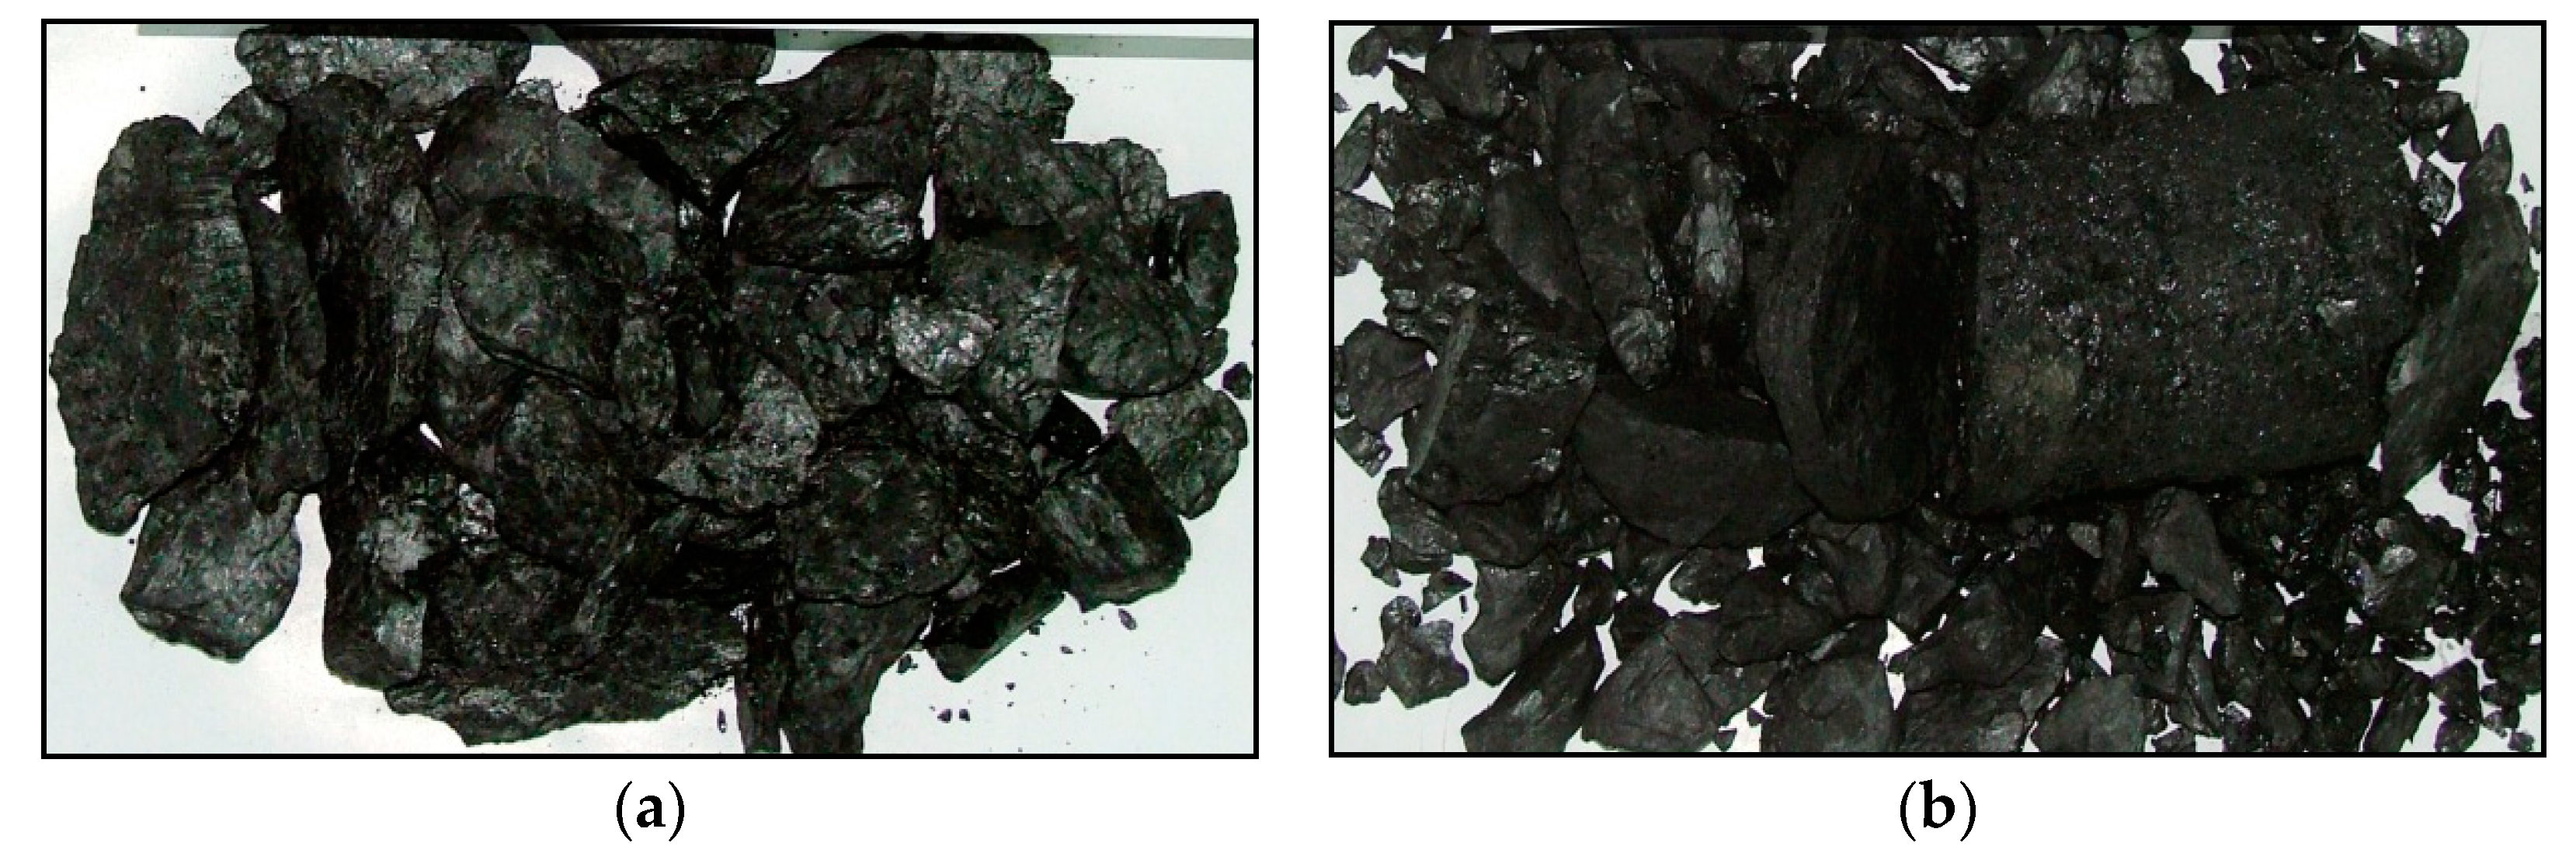
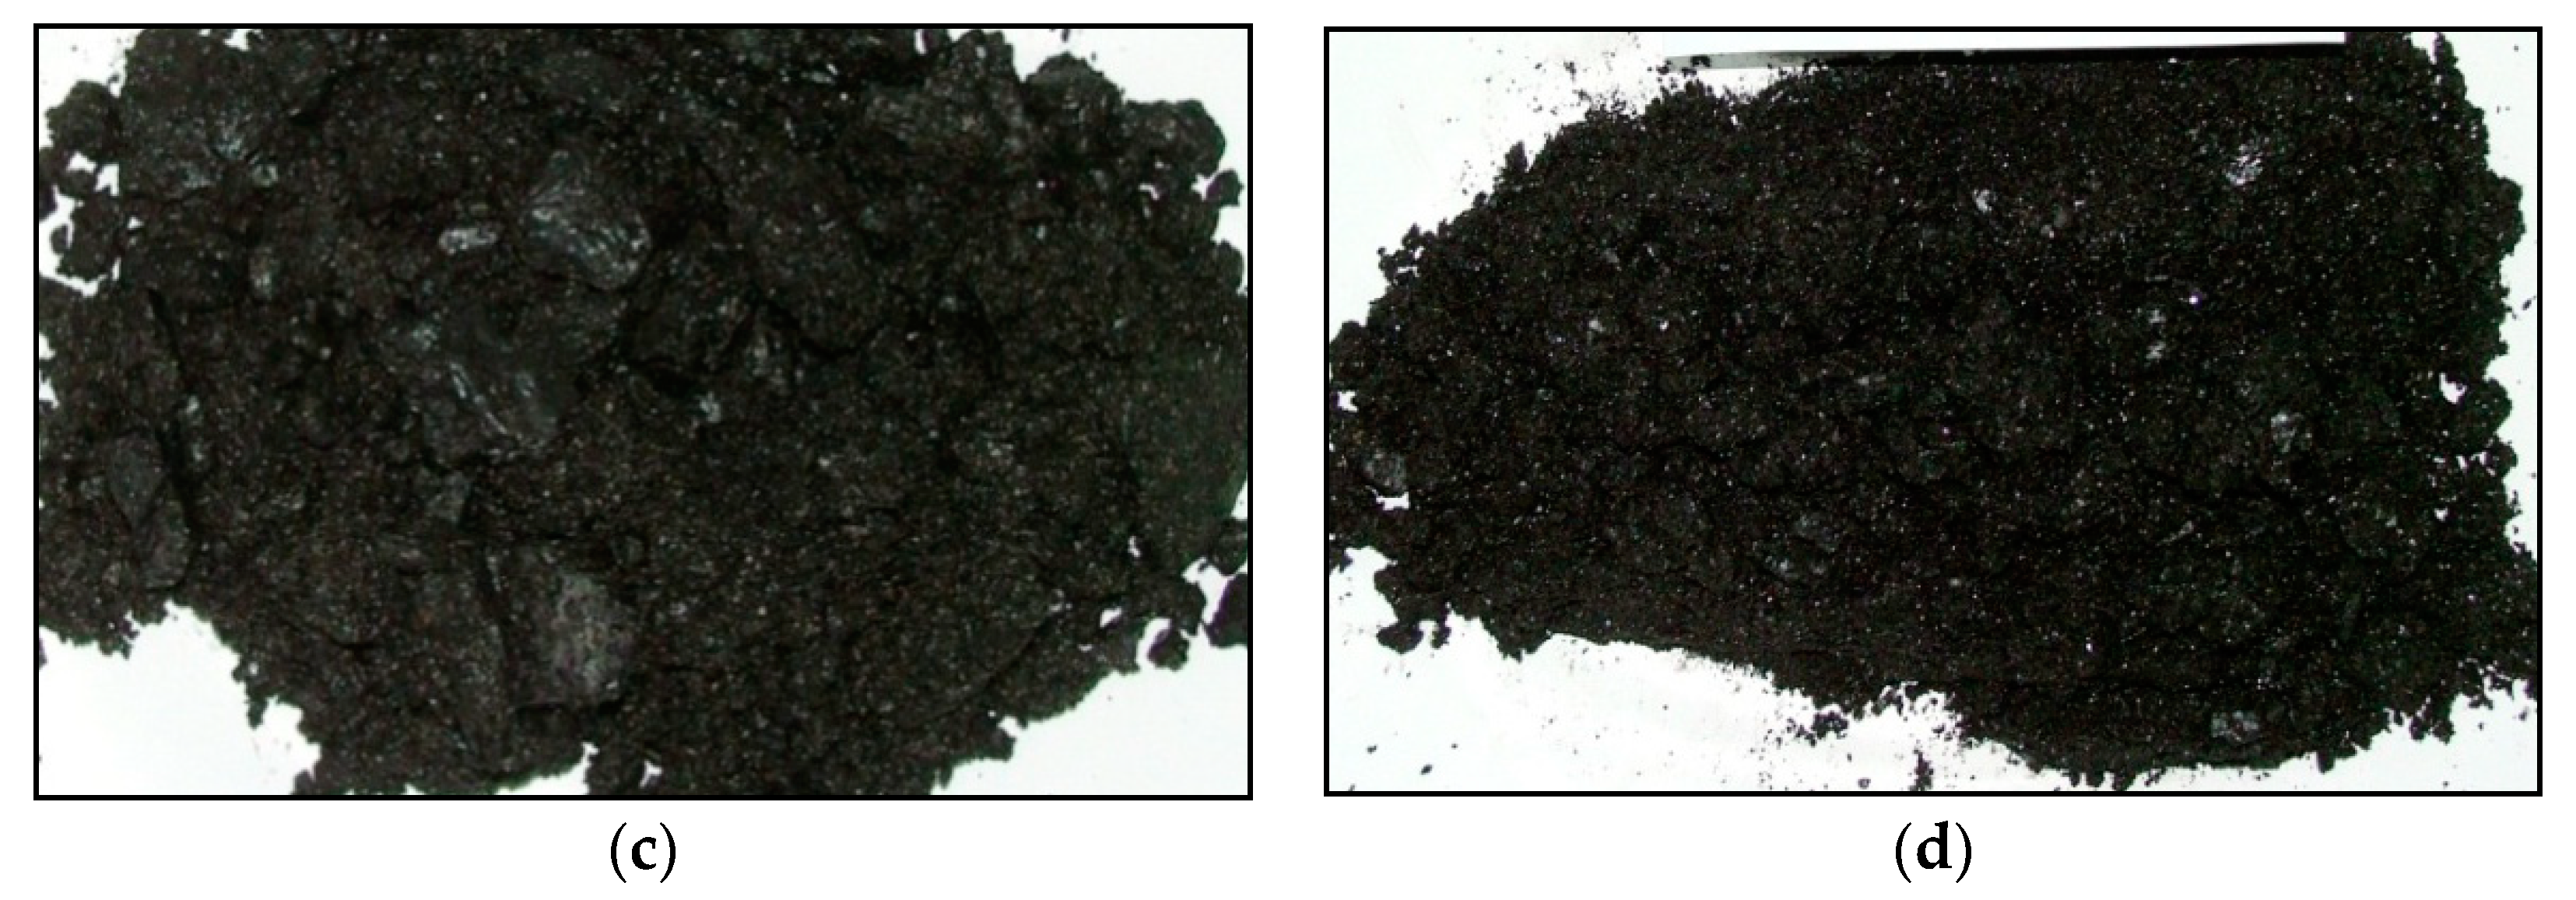
Eighty-one drilling core samples from the No. 5 and No. 11 coal seams were collected. Through macroscopic descriptions of the coal sample shape, cracks and cleats, apart from undeformed coal, three types of TDC were found in this area: Cataclastic, granulated, and mylonitized (Figure 2). Face cleats and butt cleats are developed in undeformed coal; their coal cores mostly have a bulky columnar shape. In addition to developed endogenic cracks in cataclastic coal cores with a short column shape, there also are many orthogonal exogenous cracks. Granulated coal is mostly clastic and granular. Mylonitized coal is largely powdery (Table 1).
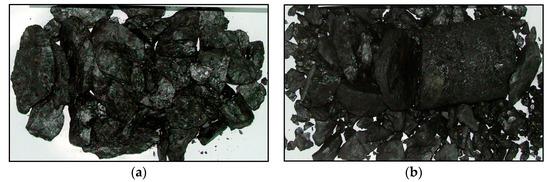
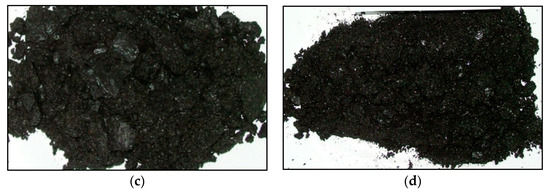
Figure 2.
Macroscopic characteristics of samples from Well L1. (a) Undeformed coal, No. 11 coal seam, 417.45–417.97 m in depth. (b) Cataclastic coal, No. 5 coal seam, 372.84–373.34 m in depth. (c) Granulated coal, No. 11 coal seam, 414.45–414.97 m in depth. (d) Mylonitized coal, No. 11 coal seam, 413.96–414.45 m in depth.

Table 1.
Tectonically deformed coal (TDC) and its corresponding shape and macroscopic fracture characteristics in the coal core samples of the study area.
3. Method
The TDC type of the coal samples was classified according to China National Standard of Classification of TDC [9]. The logging data collected here were measured strictly according to the China Energy Industry Standard of Quality requirements for original log information [40]. The accuracy of the measurements and the determined measurement errors meet the requirements of the China Energy Industry Standard of Acceptance specification for coalbed methane well-logging data and its interpretation data [41]. All these data can be used in further data processing to classify TDCs in the HC block.
3.1. Depth Matching of Coal Samples and Geophysical Logging Data
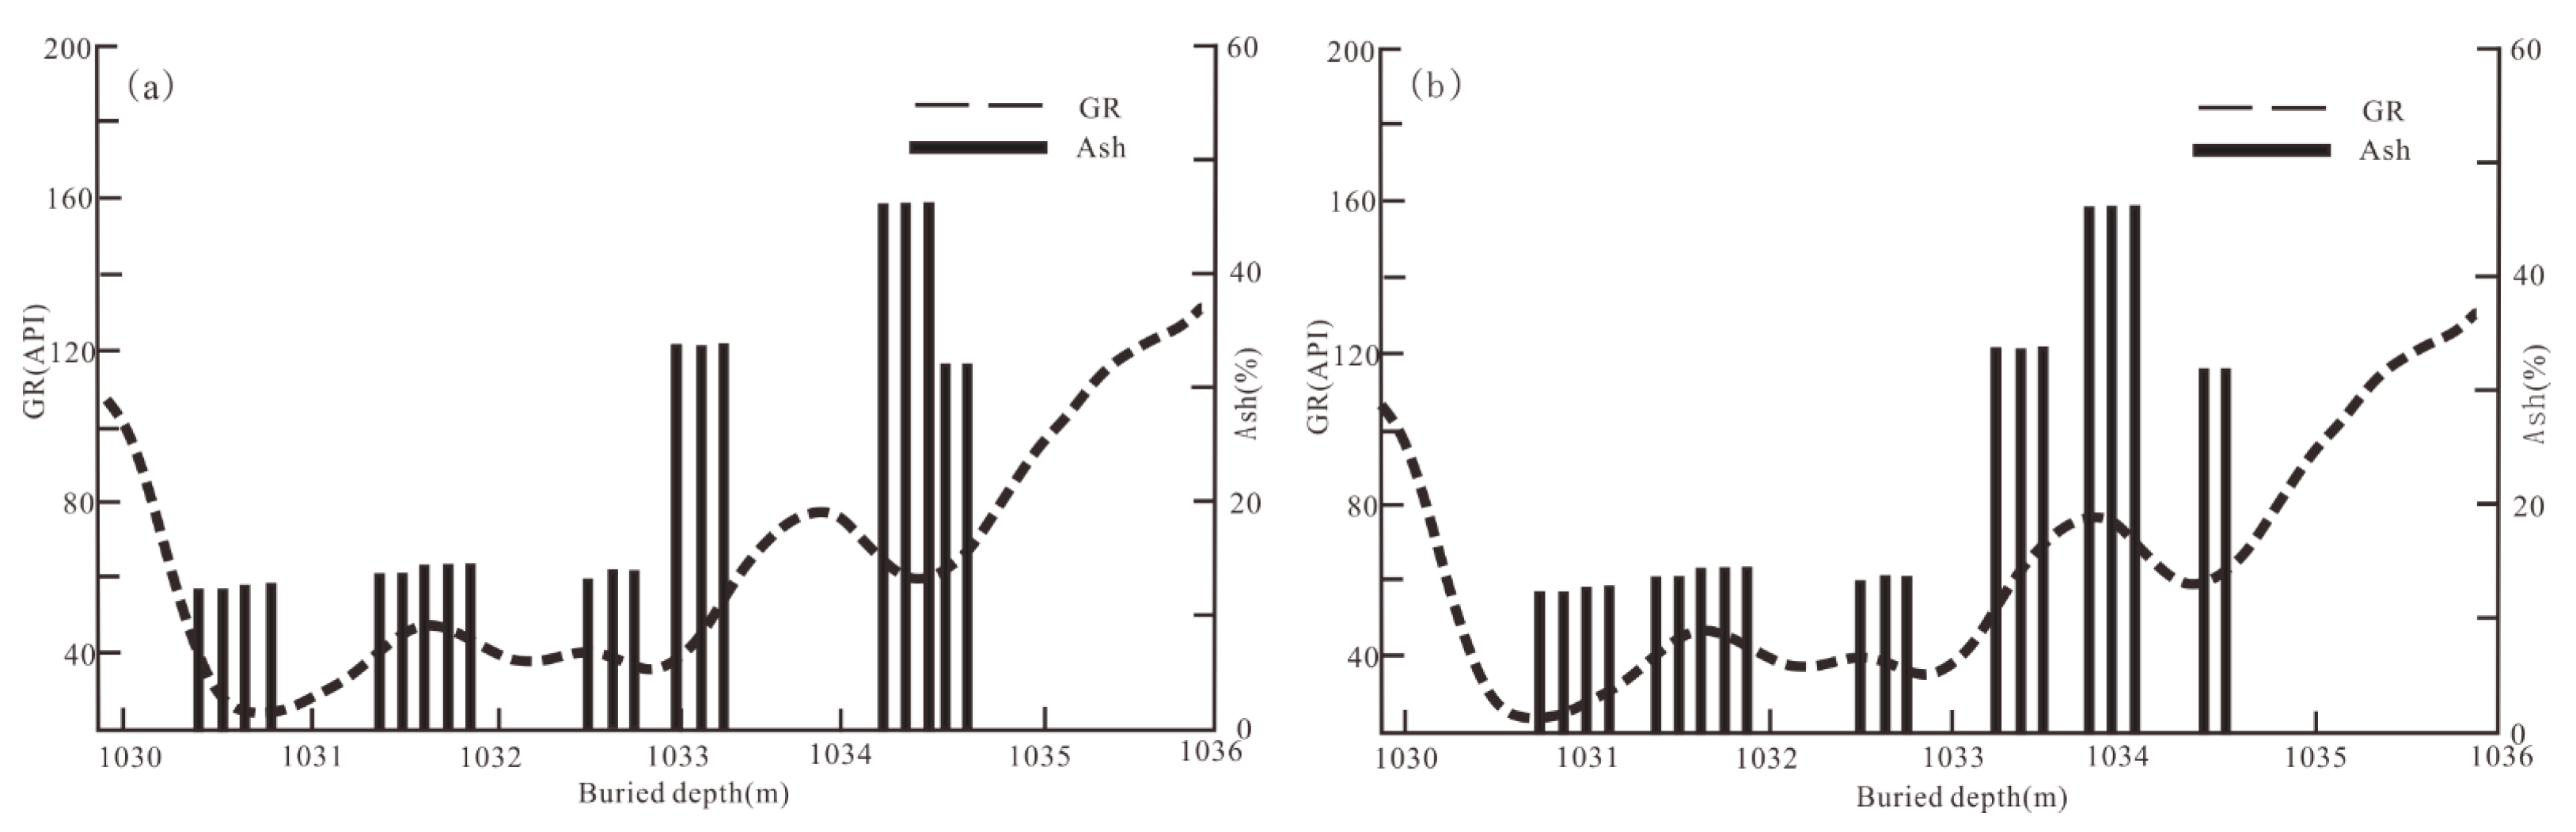
Usually, there is a between-the-burial-depth of the drilling cores and the geophysical logging data; the error is irregular because coal cores are very soft. The previous research of our group corrected the mismatch error according to the positive correlation of coal ash and natural gamma (GR), and we obtained significant results [36]. The same method was adopted here.
Figure 3 shows a case of before and after depth matching for coal cores from the No. 11 seam in Well C04. The problem of depth mismatches was obviously corrected between the GR log and cores data.
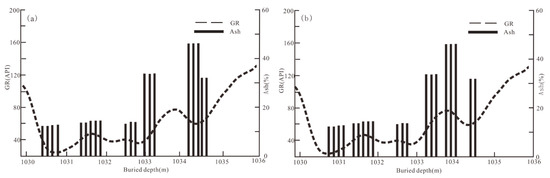
Figure 3.
Comparison chart of before (a) and after (b) depth matching between coal core samples ash content and natural gamma (GR) log data (No. 11 seam of well C04).
3.2. Logging Data Processing Methods
3.2.1. Logging Data Normalization
On the basis of the preferred exploration wells, taking marine mudstone and limestone layers thicker than 5 m in the Taiyuan Formation as markers, we used an environmental correction and normalization method to eliminate the errors caused by the logging apparatus capacity, well conditions, and surrounding rock environment. This ensured the consistency of the data in the whole area and achieved a reliable comparison of different wells.
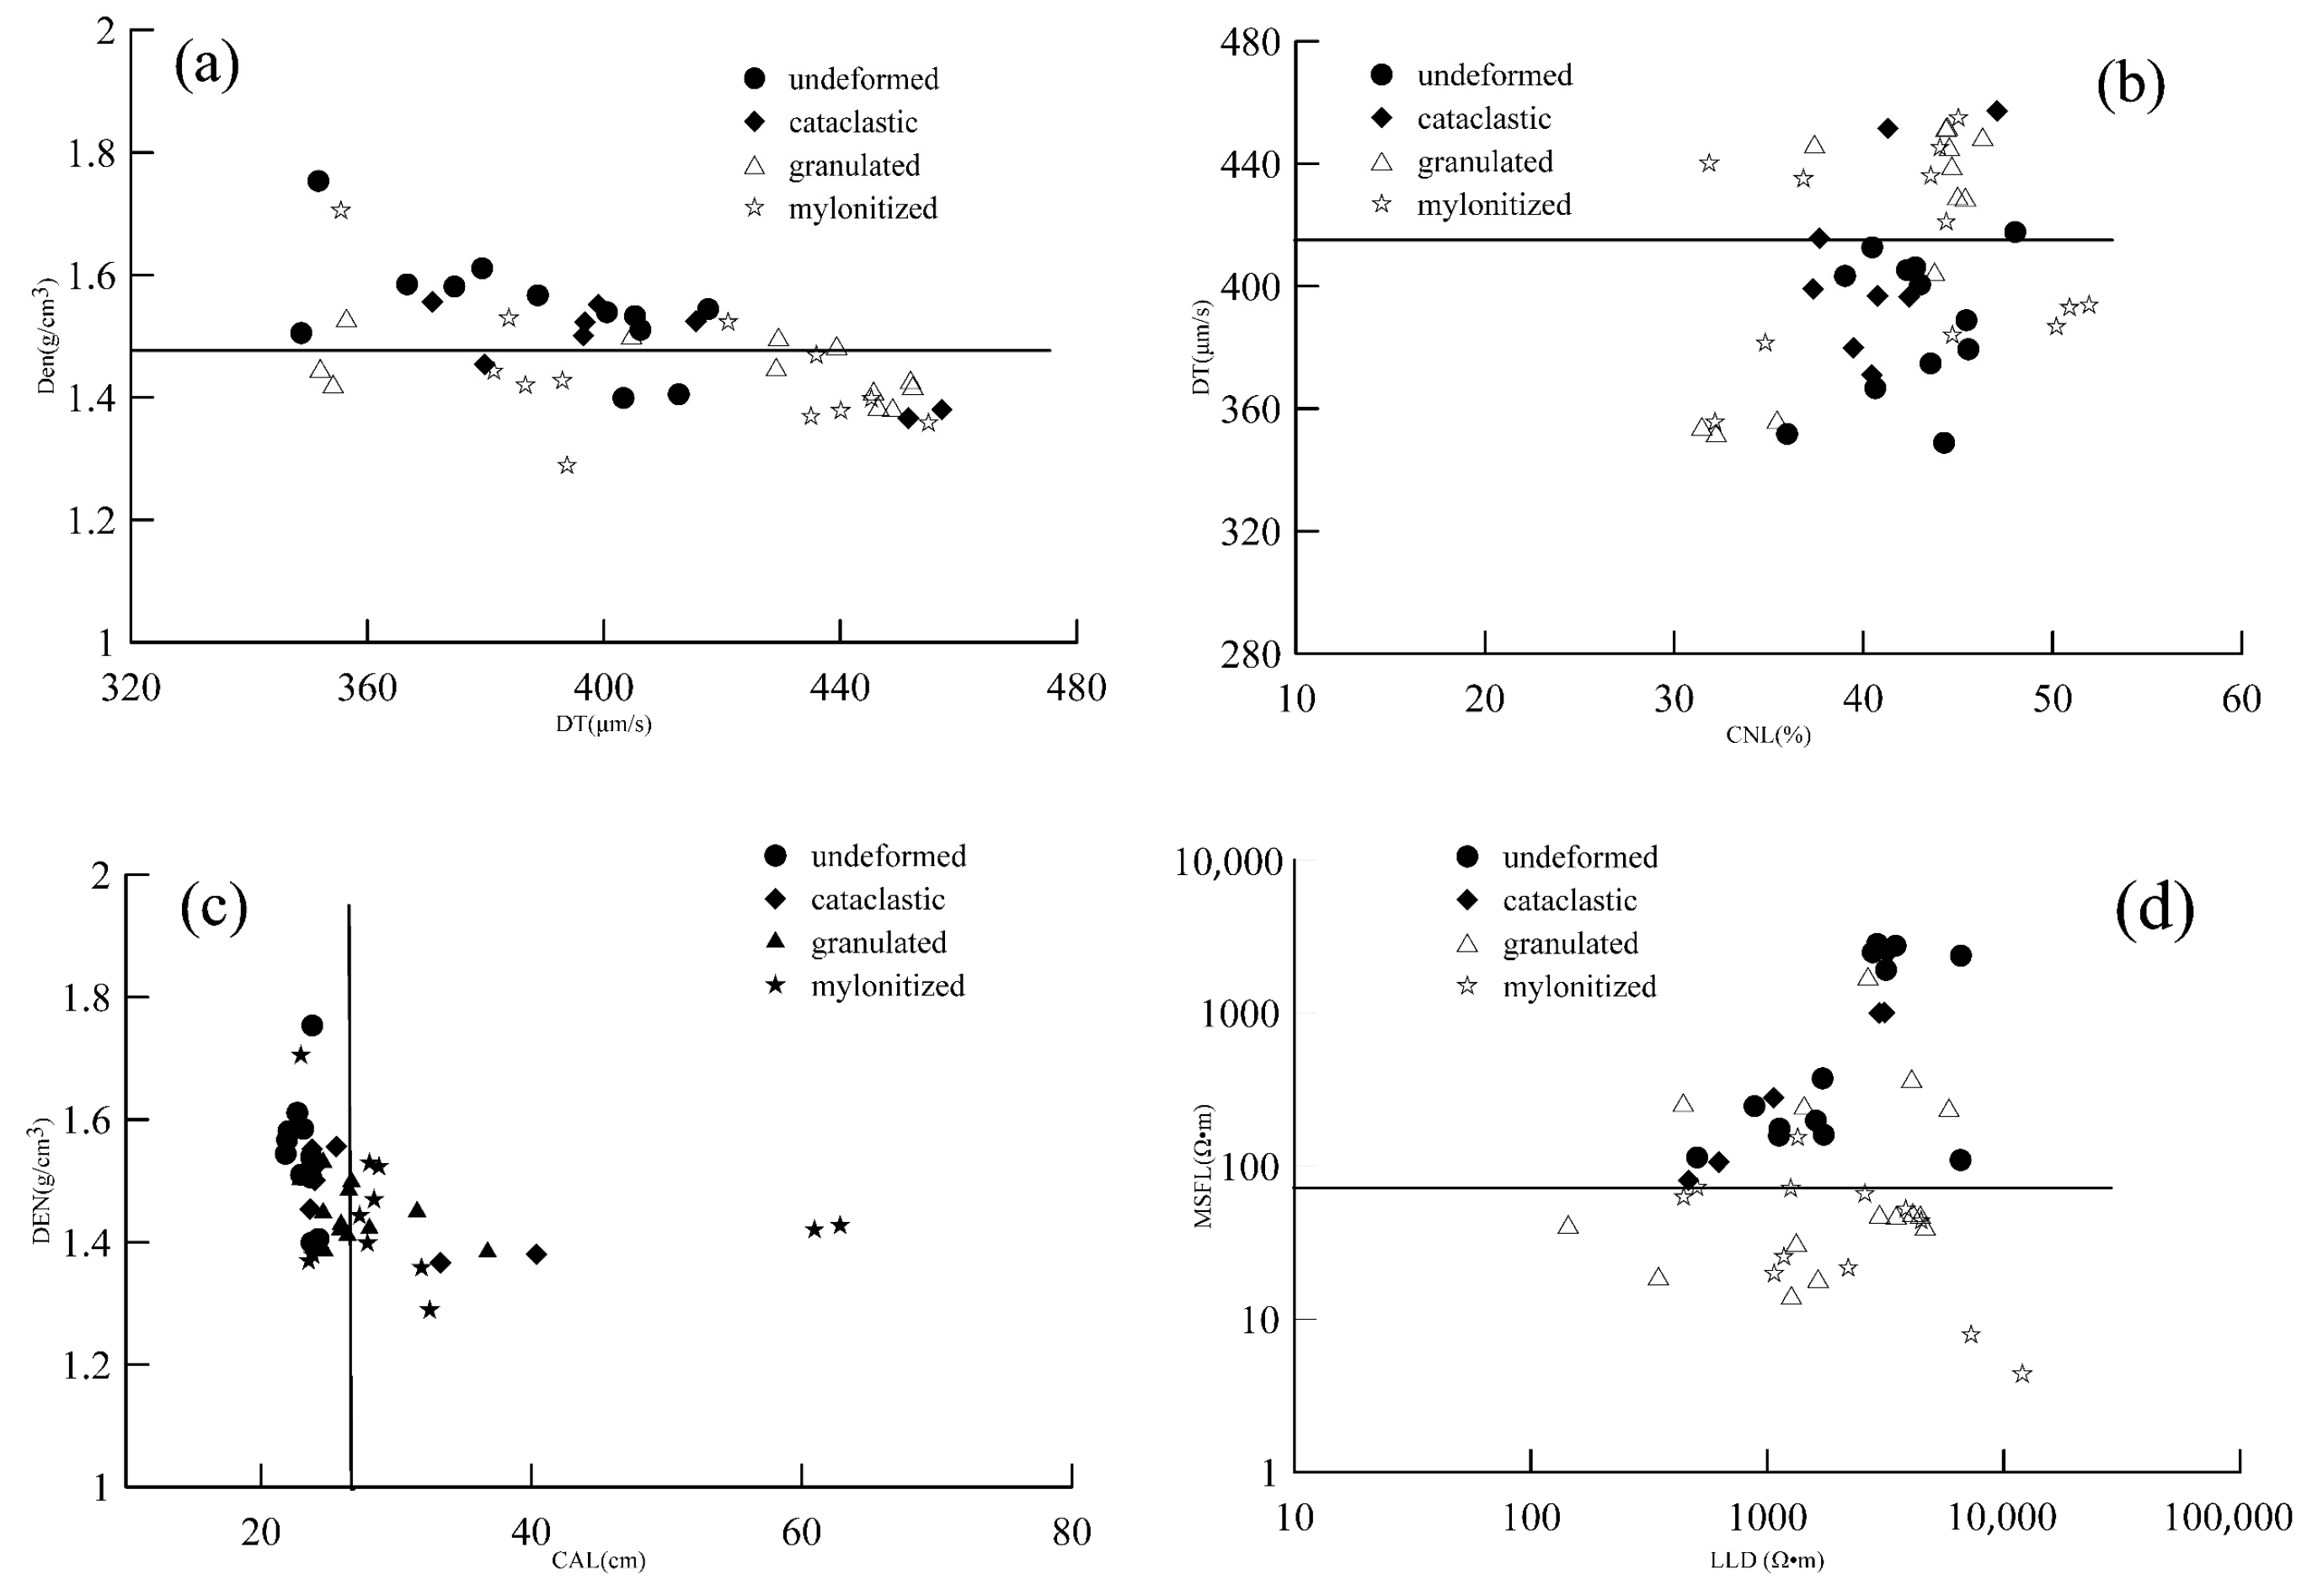
Through cross-plot analysis (Figure 4) after data normalization, TDC could be roughly divided into two types: Undeformed plus cataclastic and granulated plus mylonitized. The former’s DEN was generally greater than 1.45 g/cm3 (Figure 4a), with a DT less than 427 um/s (Figure 4b), a CAL less than 24 cm (Figure 4c), and an MSFL greater than 93 Ω·m (Figure 4d). However, the error rate was mostly greater than 30%, illustrating that TDC identification using the combination of the two logging data sets is not feasible.
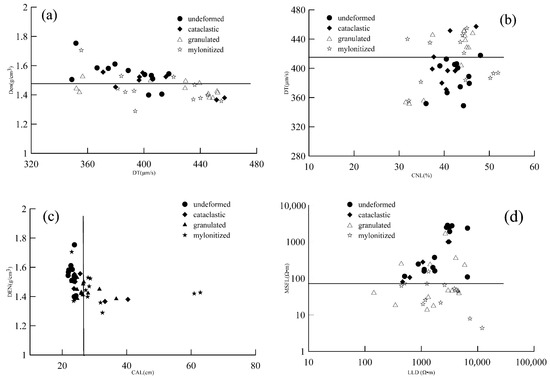
Figure 4.
Cross plots between the TDC of the coal core sample from the No. 11 coal seam and its log response. (a) bulk density (DEN) and acoustic travel-time (DT); (b) DT and compensated neutron log (CNL); (c) DEN and hole diameter (CAL); (d) deep-laterolog resistivity (LLD) and microspherical focused resistivity (MSFL).
3.2.2. Optimization of Well-Logging Data
Generally, the logging data of LLD, LLS, MSFL, compensated neutron log (CNL), DEN, DT, and CAL are adopted to identify TDC [23,24,25]. Abiding to this, the 7 logging response were used to analyze the different TDC of 81 coal core samples from the No. 5 and 11 coal seams.
To choose adequate and appropriate variables, a logging data correlation coefficients and factor analysis were conducted, and the results are shown in Table 2 and Table 3. It was observed that CNL and LLS had a significant correlation with DEN and LLD, respectively, as shown in Table 2, and when we removed them, we reduced the variable numbers from 7 to 5. According to the factor analysis results (Table 3), the variance percentage of the initial eigenvalues were 34.83, 21.74, 16.32, 15.23, and 11.88, meaning each of the 5 numbers could not be neglected.
Table 2.
Correlation matrix of the logging responses from the No. 11 and No. 5 coal in the HC block.
Table 3.
Total variance explained of the logging responses of core samples from the No. 11 and No. 5 coal in the HC block. Extraction method: Principal components analysis (PCA).
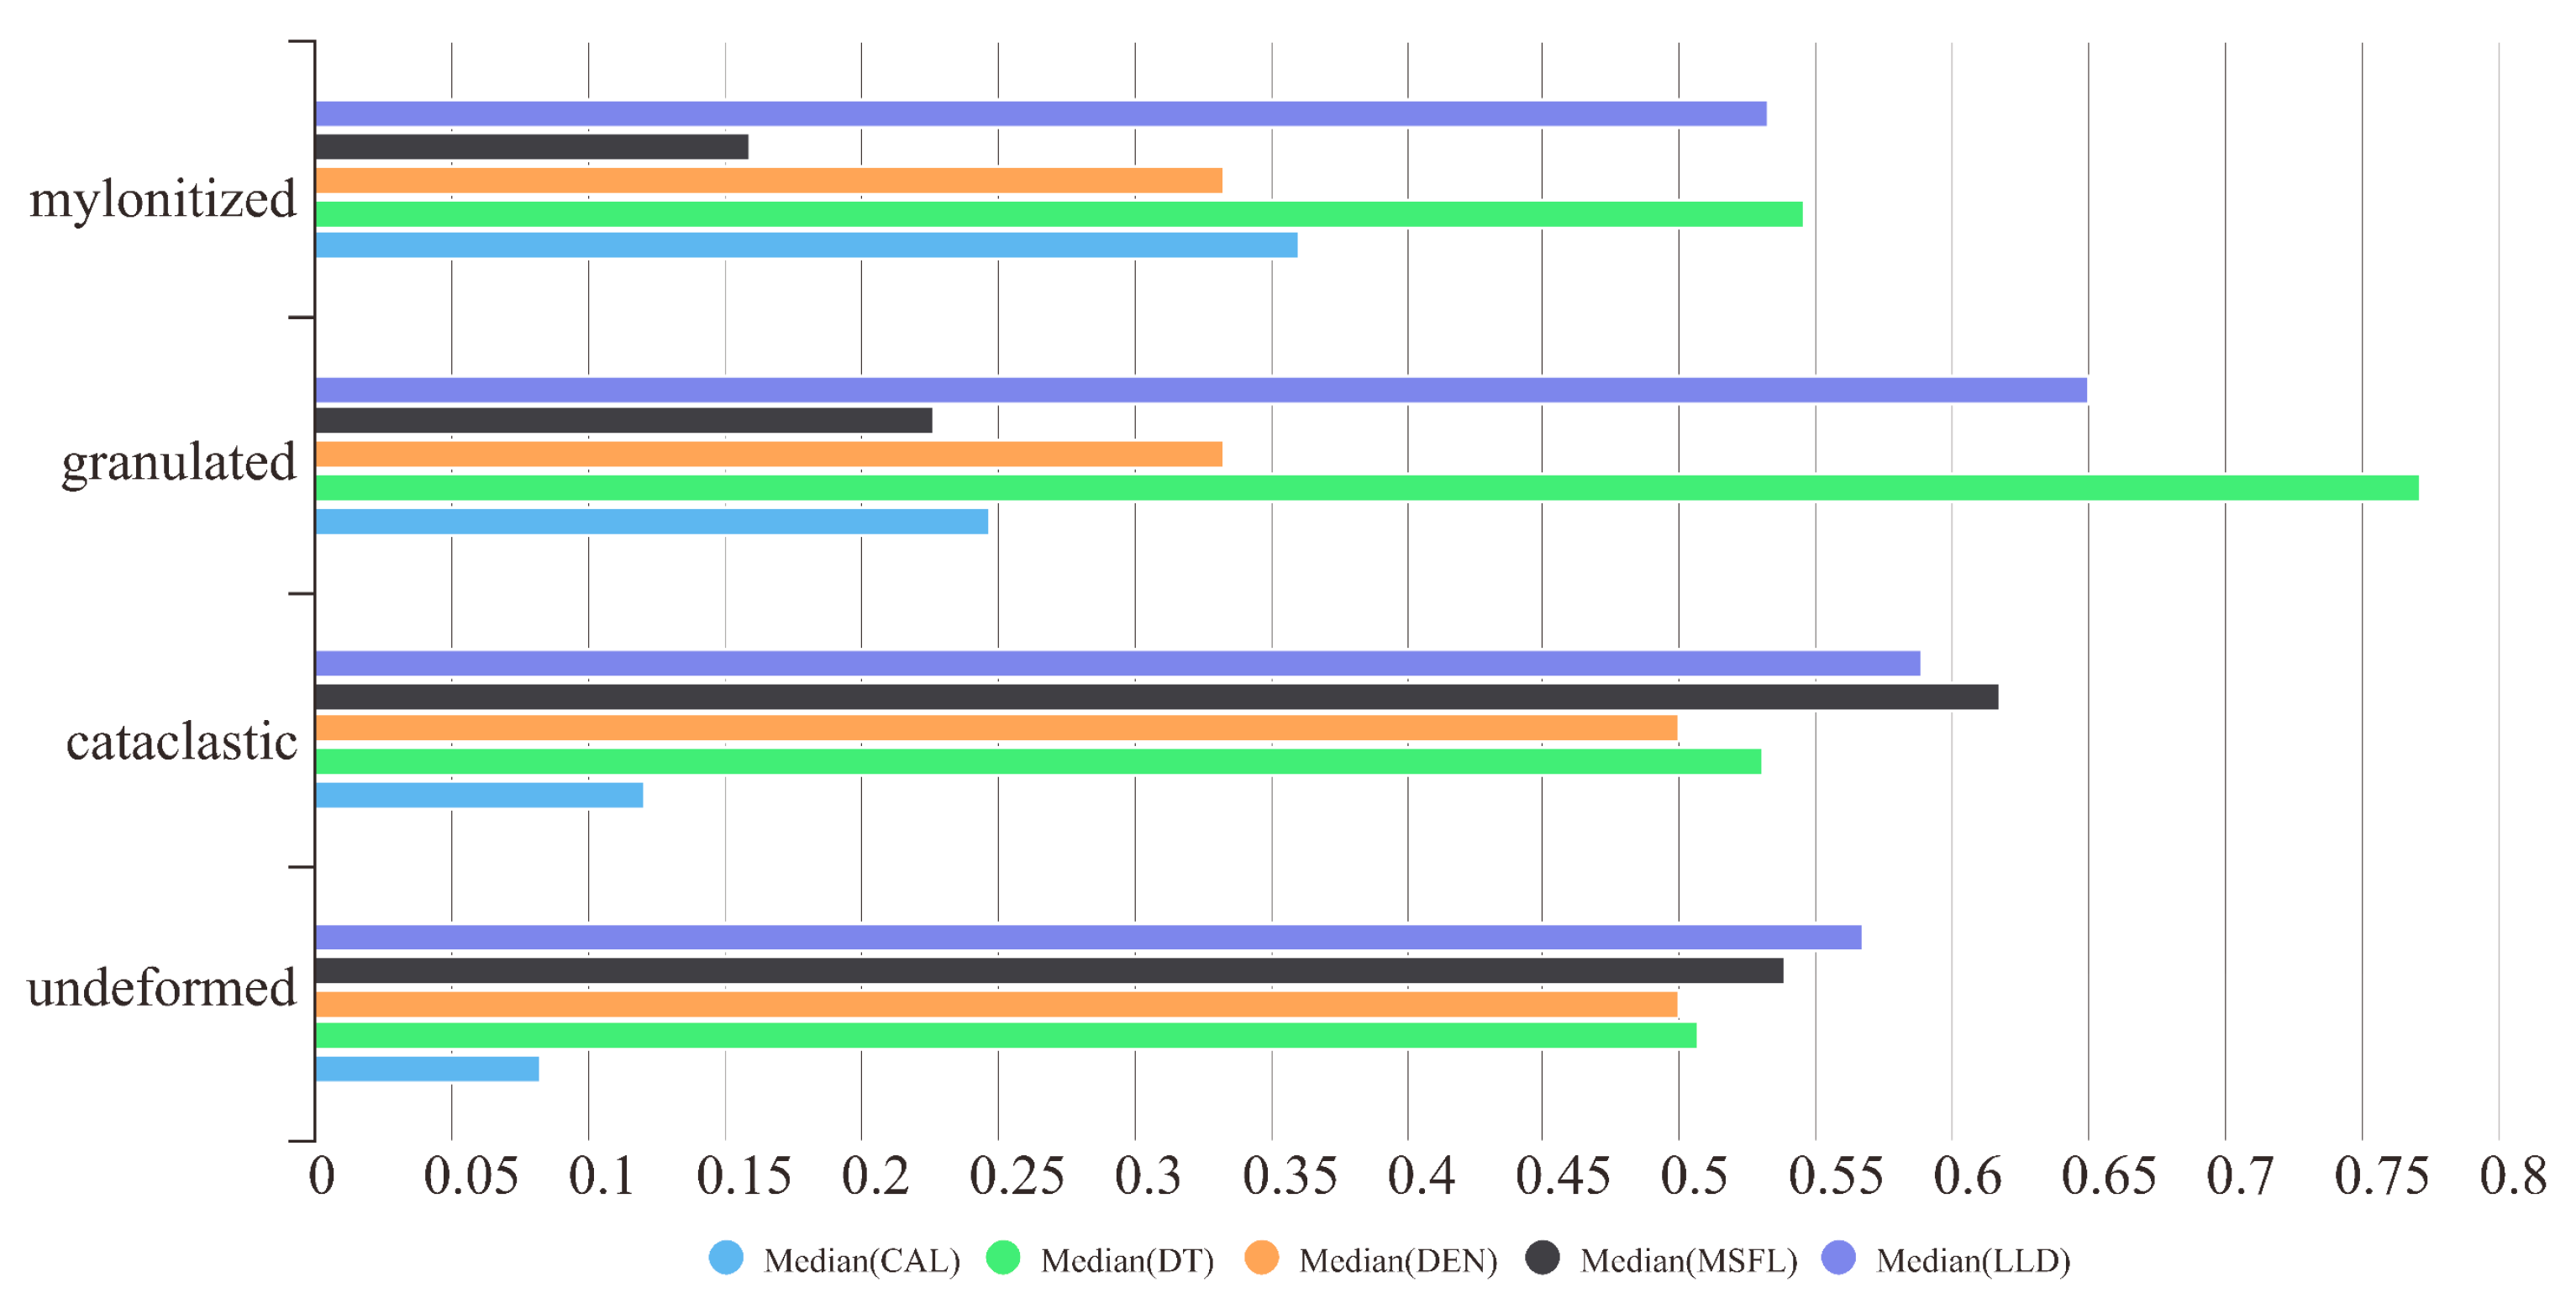
In addition, the medians of the five logging responses to the TDC and the undeformed coal of the 81 coal samples (Figure 5) were calculated. From undeformed to mylonitized, they ere characterized clearly by decreasing LLD, MSFL and DEN, and increasing DT and CAL. They all exhibited abnormal responses with the increase of coal damage.
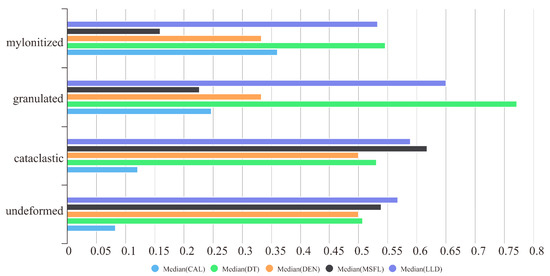
Figure 5.
The normalized value horizontal bar of logging data with different TDC.
3.3. Relative Physical Properties Indicator (RPPI)
Xie [31] proposed a calculation method for the TDC indicator N, shown as Formula (1) as follows:
where N is the TDC indicator, a and b are constants usually ≥1, CAL is in cm, DEN is in g/cm3, and DT is in us/m. N has no physical significance.
To improve Formula (1), we adopted the relative change in value. All the logging data were divided by the mean value of the undeformed coal from the coal cores, so the values of the measured curves in Formula (1) were converted into the ratios corresponding to the specific standard value of the undeformed coal. The formula is as follows:
where RPPI is the dimensionless relative physical properties indicator, RCAL is the ratio of the CAL value of coal samples to the given standard CAL value, RDEN is the ratio of the DEN value of the coal samples to the given standard DEN value, and RIMP is the ratio of the acoustic impedance( IMP) value of the coal samples to the given standard IMP value.
3.4. Relative Fluid Indicator (RFI)
There is a ten-times difference between the measured depth of MSFL (5–10 cm) and LLD (150 cm). When a coal seam is penetrated by a drill bit, small-scale methane desorption and emission occurs near the borehole wall [42]. The desorption causes coal matrix shrinkage, which induces microcracks with improved connectivity [43]. The microcracks are repeatedly washed by the mud filtrate, changing the water saturation [44,45,46]. Following that, the coal properties of stress concentration and strength will induce the flushed zone. When the flushed and undisturbed zone develop, changes between MSFL and LLD occur [34,35].
To highlight the difference responses upon mud-filtrate zone development, based on our previous research work [36], the relative fluid indicator (RFI) could be calculated as follows:
where RFI is the relative fluid properties indicator, which is dimensionless, expressing the relative change between the LLD and MSFL logging responses in logarithmic coordinate.
4. Results
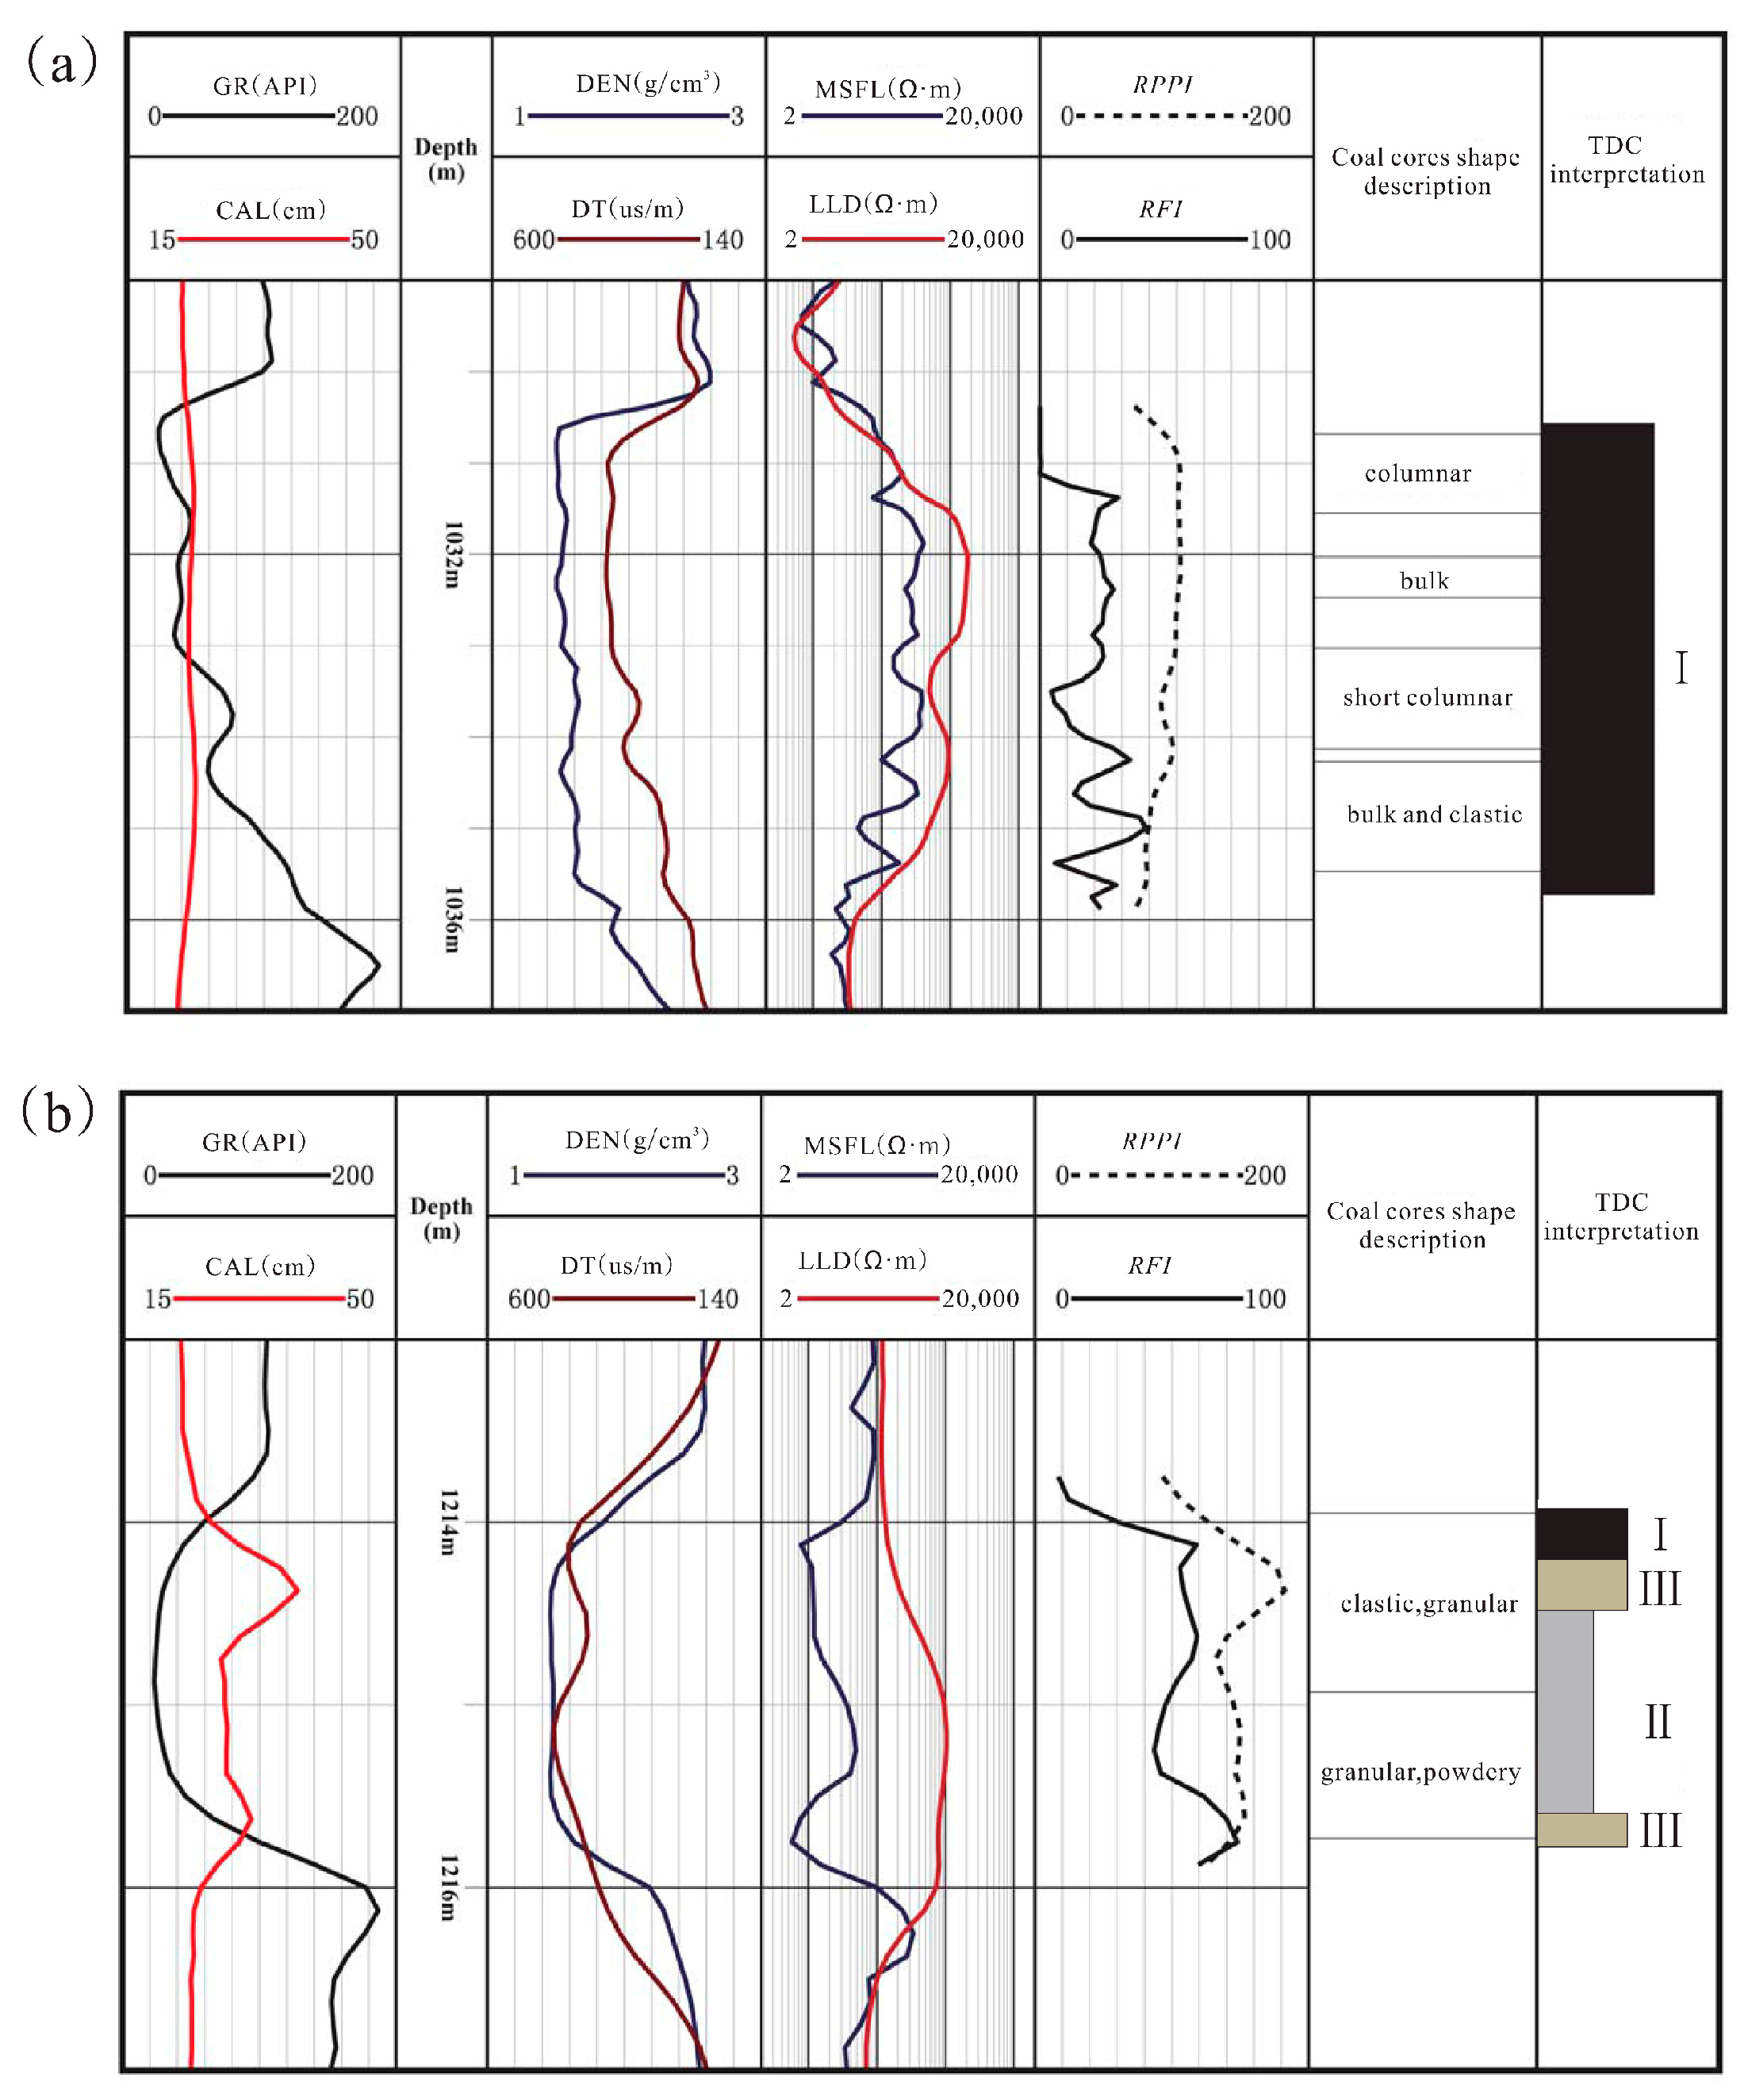
The RPPI and RFI for each layer with a thickness of 12.5 cm were extracted as quantitative identification indicators of TDC. Twelve exploration wells with macroscopic records were selected as the primary reference wells (Table 4). Then, as shown in Figure 6, the typical logging curve characteristics of the different TDC in wells LC04 and LC02 were developed and showed an evident increasing trend of the RPPI and RFI values with the increase in the deformational degree of TDC.
Table 4.
TDC and logging data of coal core samples from the No. 11 coal in the HC block.
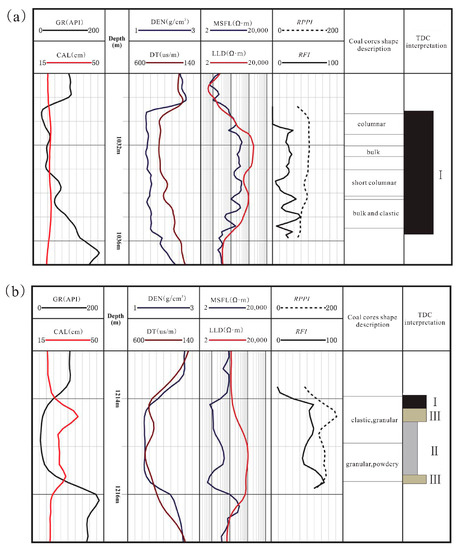
Figure 6.
TDC results as interpreted from the core record corresponding to the dimensionless relative physical properties indicator (RPPI) and relative fluid properties indicator (RFI) of (a) the No. 11 coal seam of well LC04; (b) the No. 5 coal seam of well LC02.
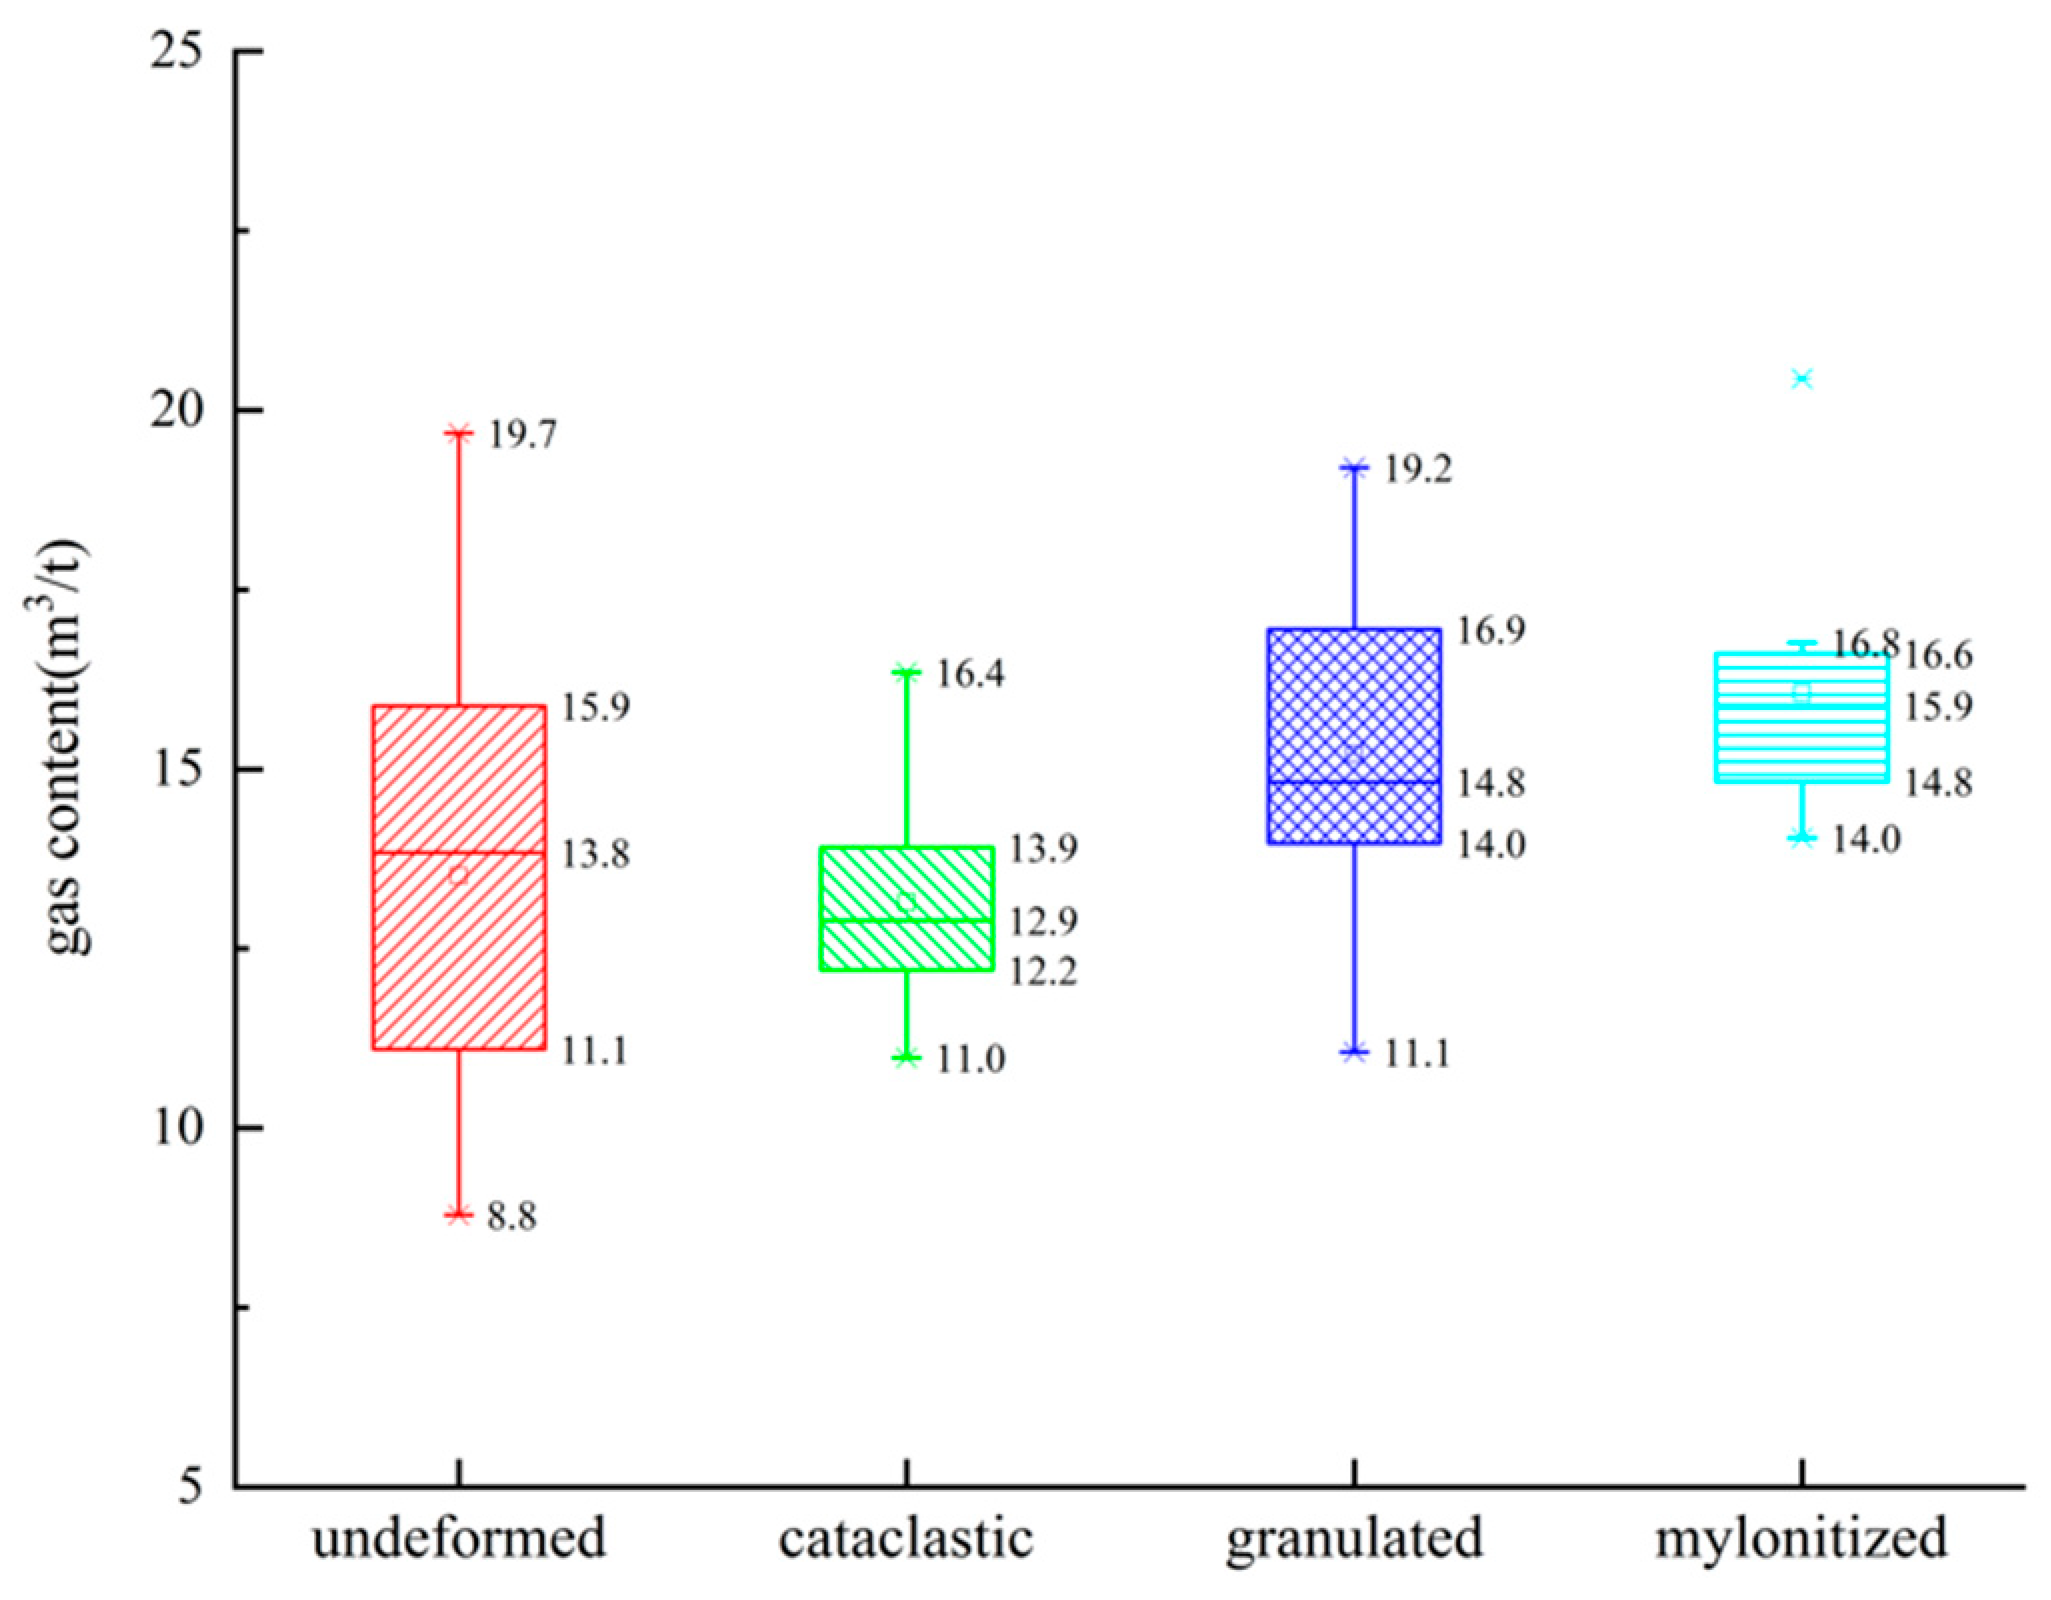
The characteristic statistics of gas content was also conducted, as shown in Figure 7. The median values of gas content were 13.8, 12.9, 14.8, and 15.9 m3/t corresponding undeformed coal to mylonitized coal in turn. The results presented poorer TDC with higher gas content.
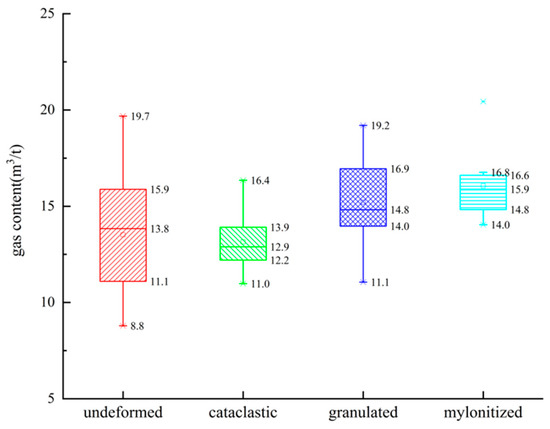
Figure 7.
The gas content box diagram of different TDC from data listed in Table 4.
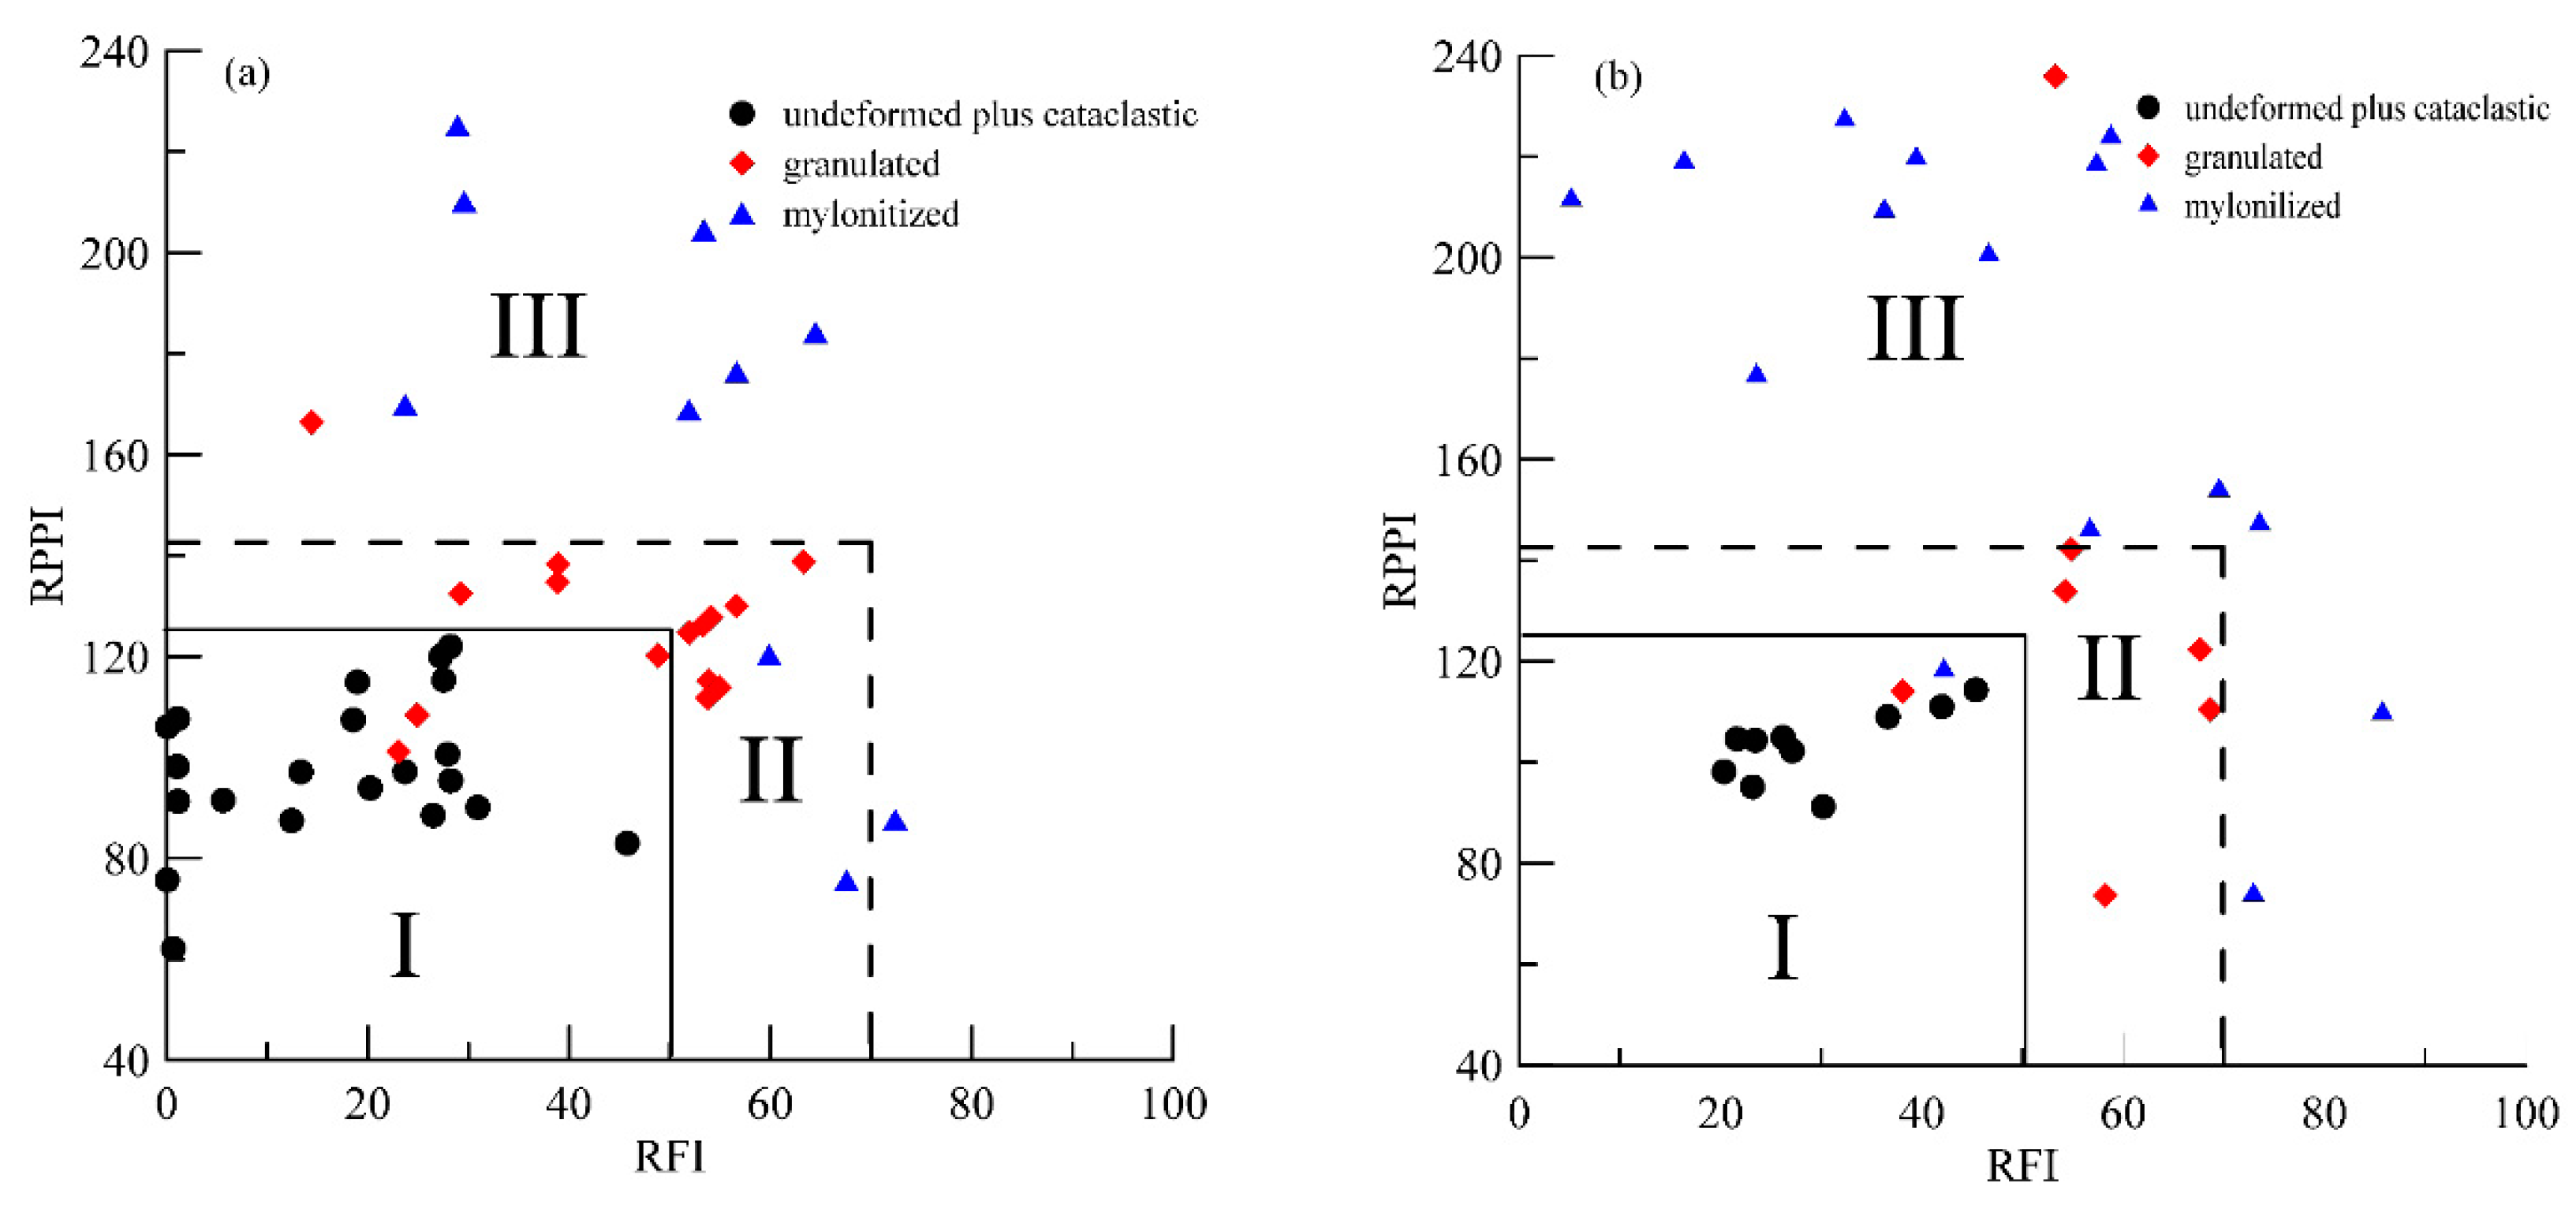
The results of the cross plot analysis of the RPPI and RFI of the 81 coal core samples from the No. 11 and No. 5 coal seams are shown in Figure 8. Three partitions of I, II and III were designated according to the values of the RPPI and RFI. The flag values were 125 and 142 for the RPPI indicator, while the RFI indicator were 50 and 70, respectively. It could also be seen that the data sets that represented undeformed and cataclastic coal were clustered clearly in partition I, granulated in II, and mylonitized in III. The No. 5 coal seam had the same pattern and parameters as No. 11 (Figure 8).
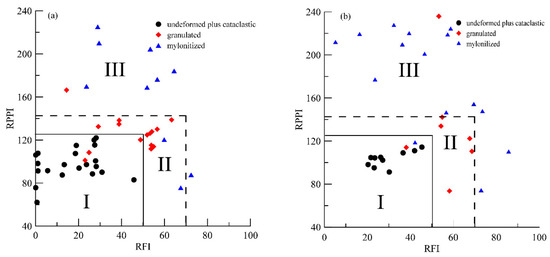
Figure 8.
Cross plots of the RPPI versus RFI from the No. 11 (a) and No. 5 (b) coal seams.
Based on the above features, the RPPI values of 125 and 142 and RFI values of 50 and 70 were set as the minimum boundaries of the different TDC. The TDC was classified into three types: Type I—undeformed and cataclastic; Type II—granulated; and Type III—mylonitized. Nine of the 81 samples were wrongly identified, and the average error rate was 11.1%. The detail identification results are summarized in Table 5.
Table 5.
Quantitative interpretation parameters and misjudgment rate of TDC.
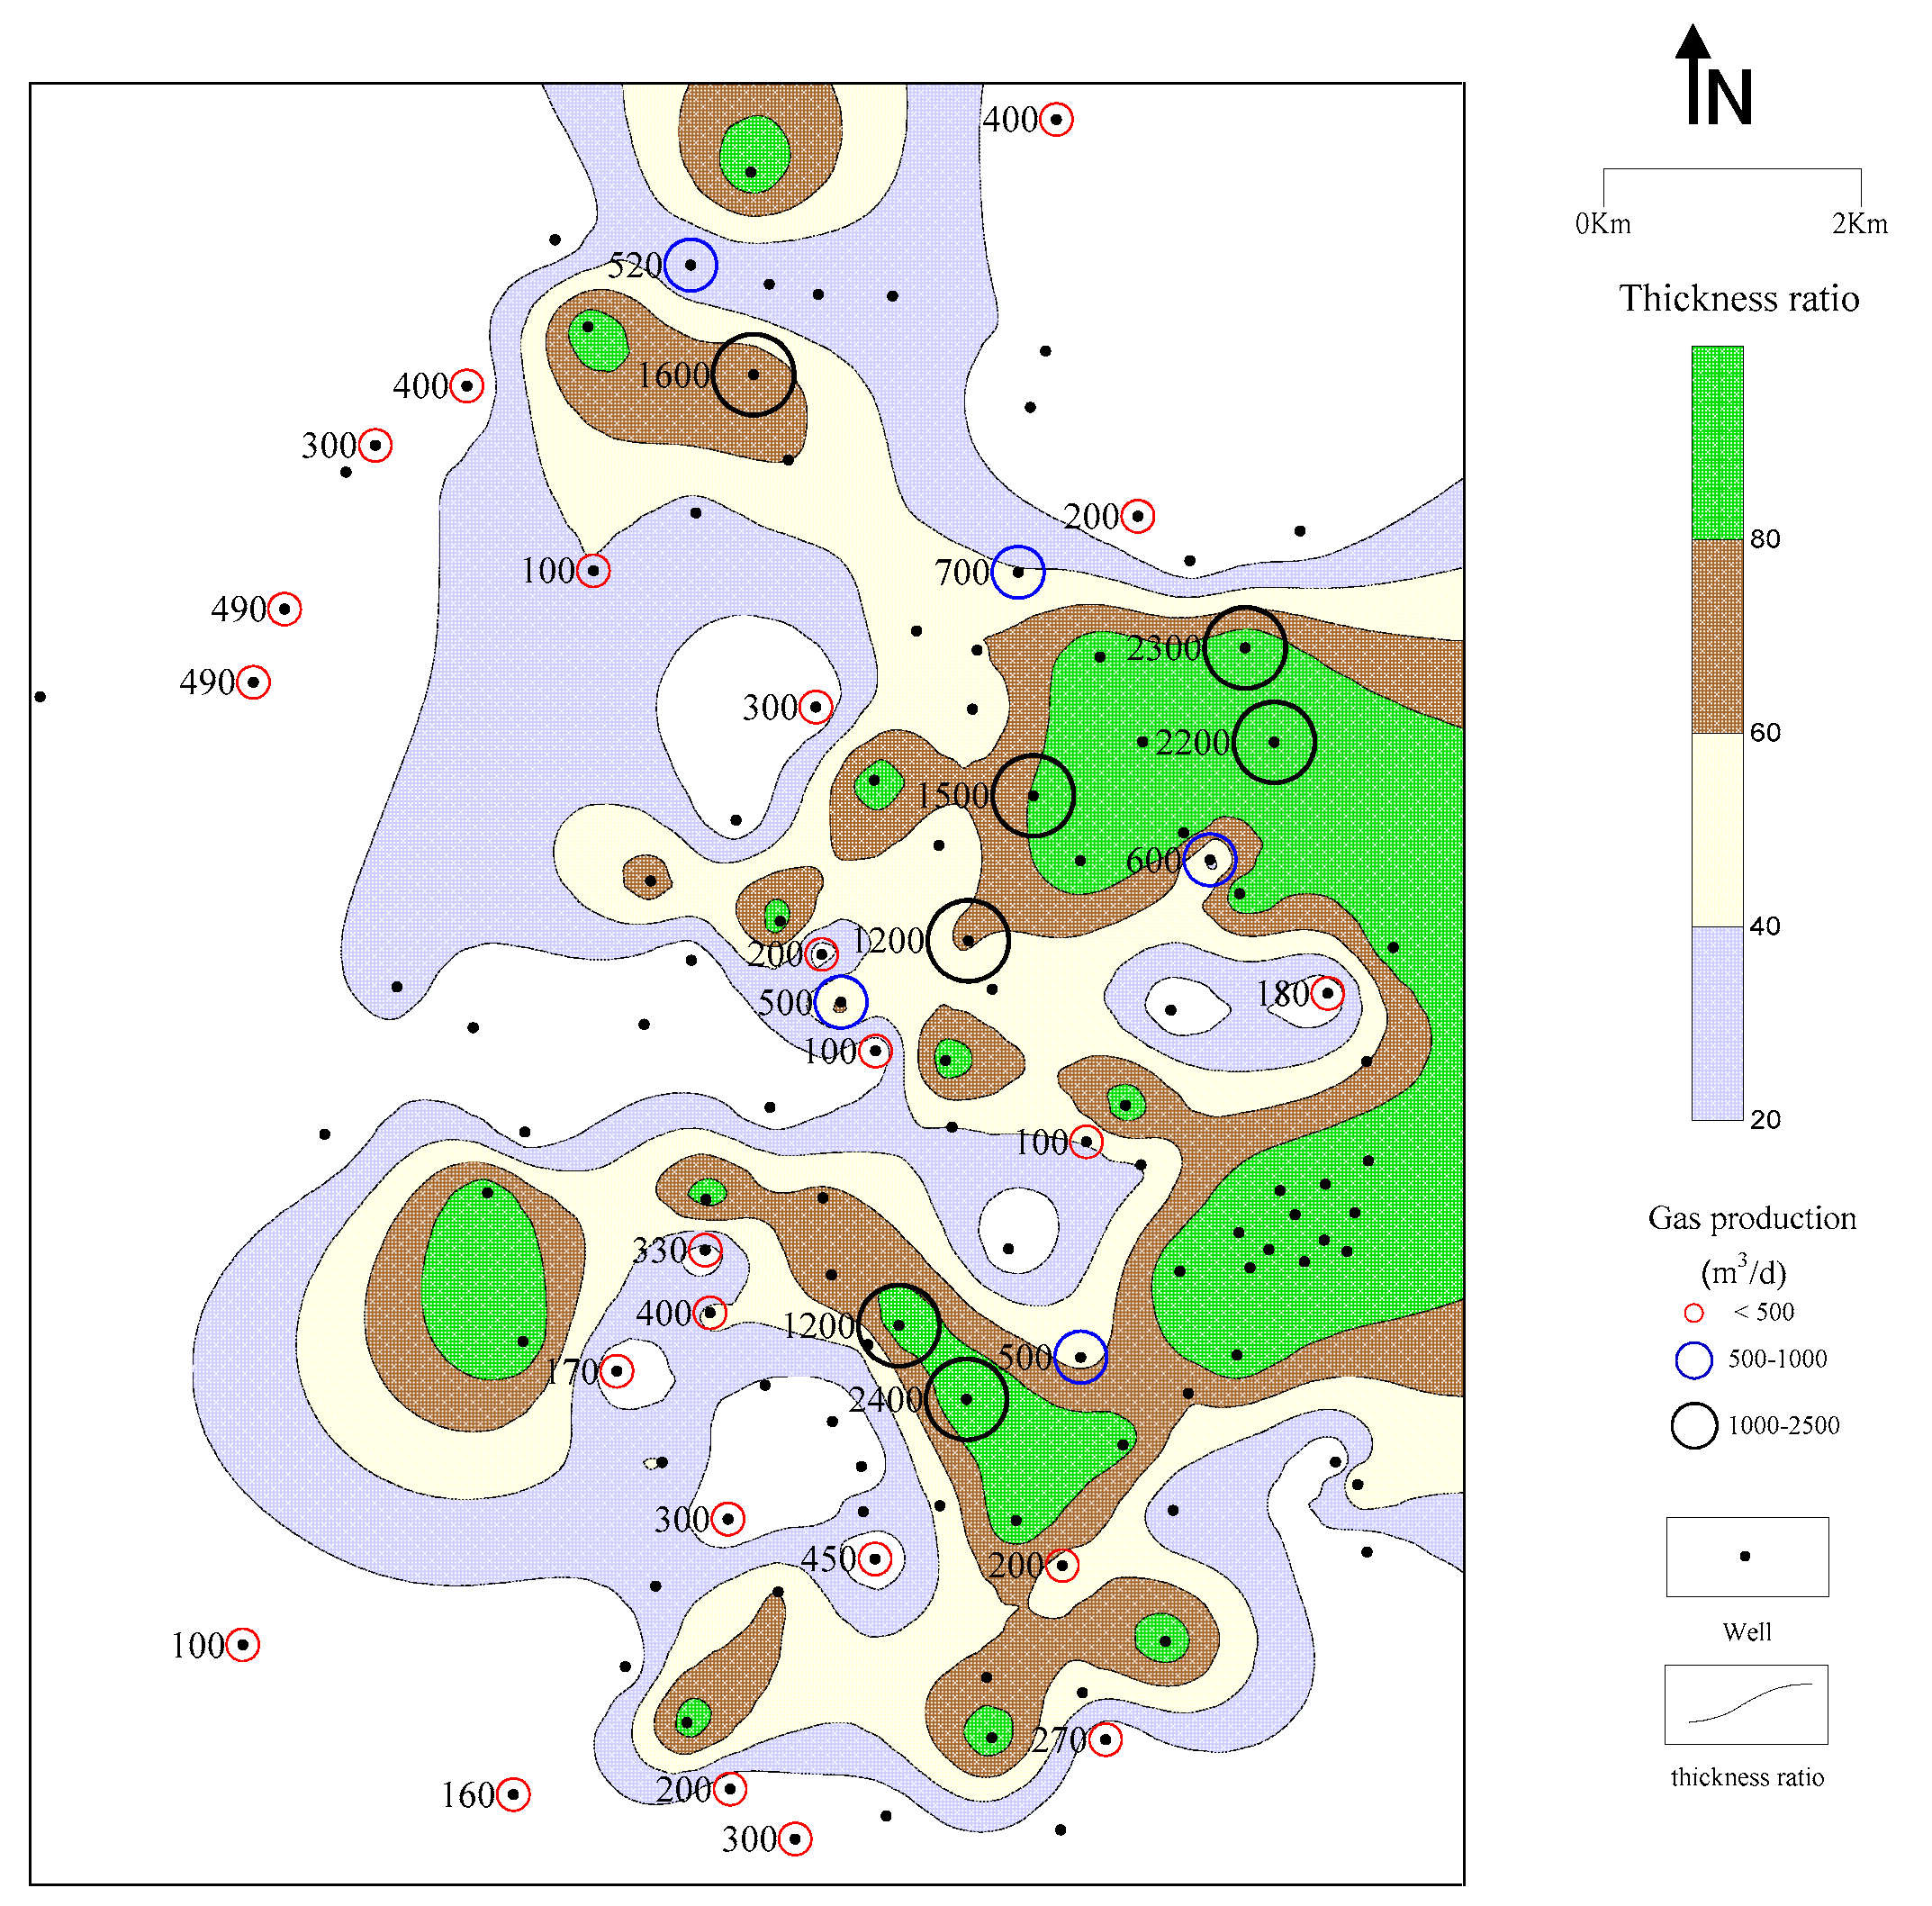
According to the parameters presented in Table 5, the types of TDC and corresponding thicknesses of the No. 11 coal seam in 83 exploitation wells was completed. Then, we adopted the method of Tang et al. [29], and two patterns of CBM development layers were defined: A well-preserved layer with type I coal and a poorly preserved layer with type II and III coals. The ratio of the well-preserved coal thickness to the total coal thickness in each well was calculated, and the thickness ratio was mapped (Figure 9).
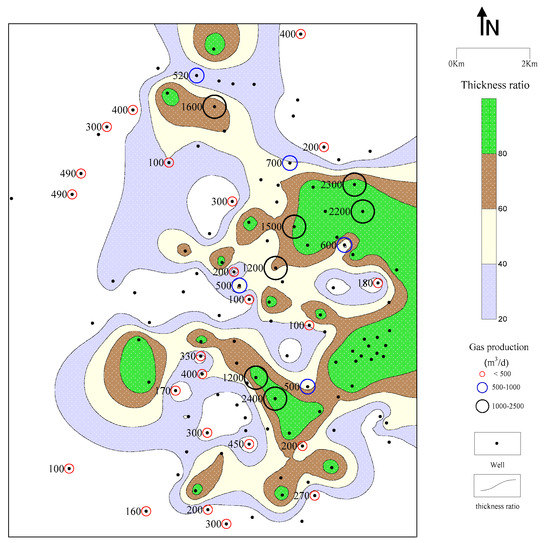
Figure 9.
Overlay isopach map of the well-preserved coal thickness ratio and gas production of the No. 11 coal seam.
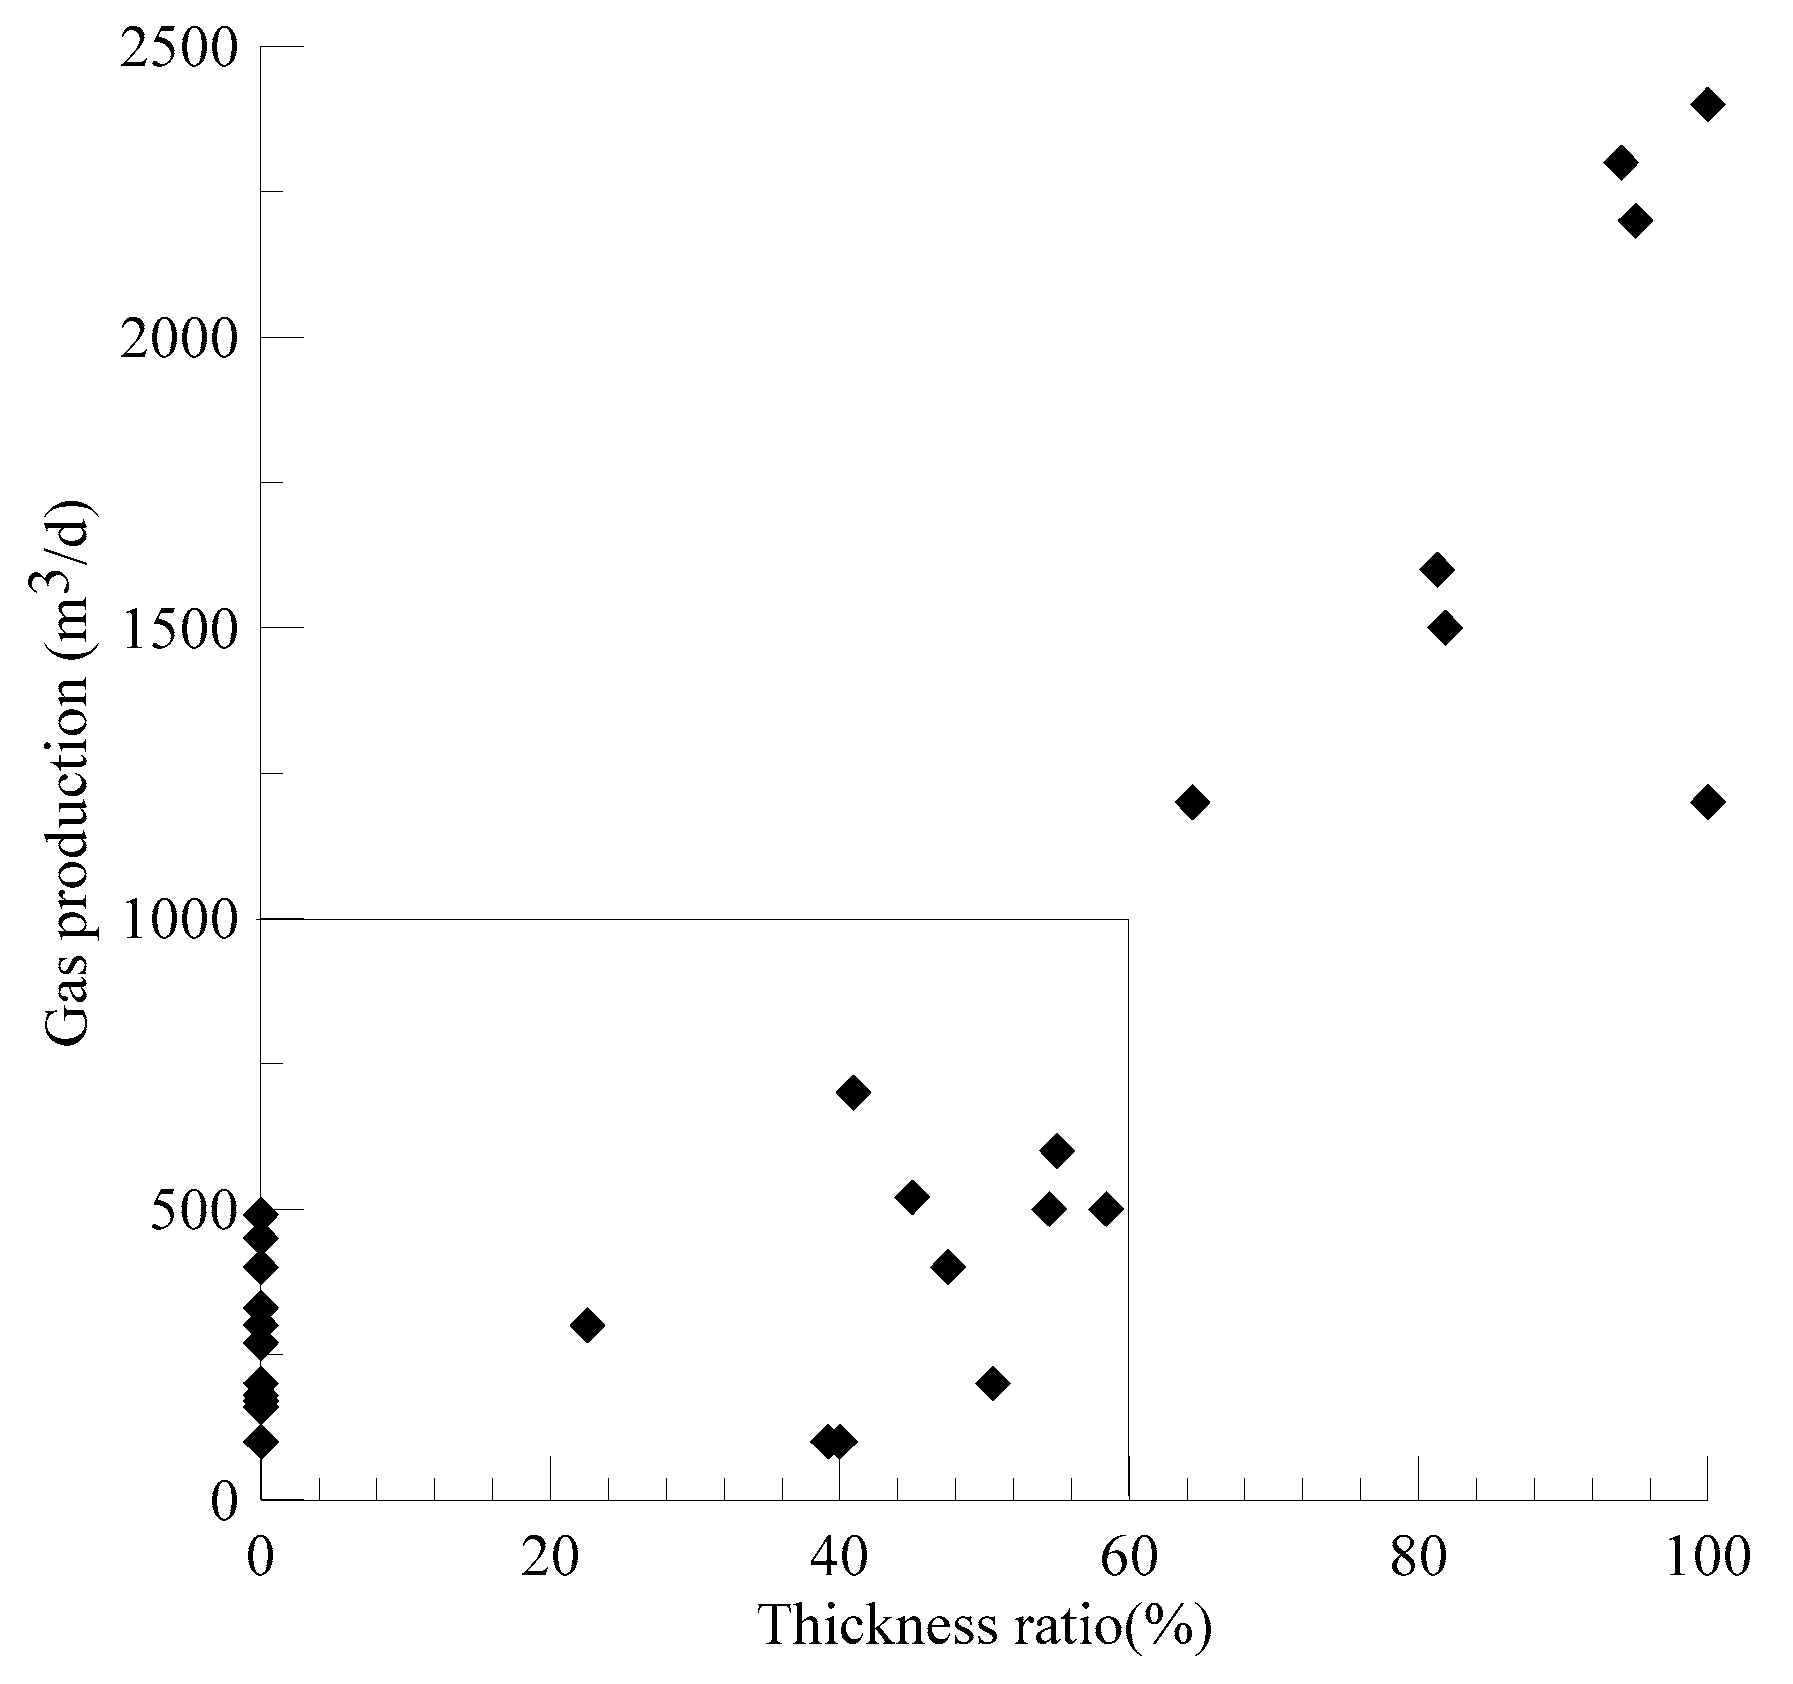
To improve comparability, 36 exploitation wells with similar hydraulic fracturing methods and production layer conditions that were long-term gas producers (greater than two years) were chosen. The daily gas production was overlain, as shown in Figure 9. The gas production of the wells and the corresponding type I coal thickness ratio are plotted in Figure 10.

Figure 10.
The thickness ratio of well-preserved coal vs. gas production of the No. 11 coal seam in 36 exploitation wells.
5. Discussion
5.1. Identification of TDC with a Static RPPI and Dynamic RFI
We demonstrated that the RPPI and RFI values go up explicitly along with type I, type II and type III coal. Though the idea of RPPI was inspired by the N-index of Xie et al. [31], here, it is more comparative and meaningful. Here, the RPPI took the physical properties of undeformed coal as a reference, and the relative changes of 25% (the flag value of 125) and 42% (the flag value of 142) in the static physical properties were assumed to denote two threshold values of the deformation degree. With the RFI taking the variable LLD amplitude as a reference, it was introduced to measure the non-overlapping area between the LLD and MSFL curves and highlight the small-scale mud-filter invasion. We showed that, type I coal tended to have less than 50% of non-overlapping area, while type II had 50%–70%, and type III had greater than 70%, corresponding to shallow, medium, and deep invasion, respectively. This increasing trend with the coal damage conformed to the result of Chen et al. [36,37], Wang et al. [38], and Ren et al [47]. The primary importance is that the above threshold values all are relative, have explicit physical significance, and should be comparable among different blocks.
Furthermore, it can be found that neither RPPI nor RFI could distinguish the TDCs precisely in Figure 8, but the complementarity of both indicators is obvious. By integrating the both indicators, a high identification accuracy of 88.9% was reached. The stability of flag values in two coal seams of No. 5 and No. 11 also confirmed this complementarity. All these facts illustrated the method of joint RPPI and RFI performed outstanding in the reliability and accuracy. Otherwise, compared to the algorithms of the cluster analysis, the principal component analysis, and extreme learning machine, the new proposed indicators simply used algebraic operation, so their results could be gotten very fast and easily. Therefore, the method is more feasible and practical for the on-site identification of the TDCs.
However, we can see that the LLD value in Table 4 varied one or two orders from one-tens of thousands Ω·m to a few hundred Ω·m among the 25 samples of type II and III coal. This even occurred in the same well (samples C01-11-01, C01-11-02, and C01-11-03 in Table 4). This problem was also found by some scholars. The water and stresses [13], ash content [47], and gas content [18], were suggested as the possible reasons. However, some overlap still remained between the different types of TDC with the RPPI or RFI, which caused the 6.7–15.4% error rate (Table 5). These uncertainties illustrated that the changes in TDC cannot always explain the physical or fluid property responses of DEN, DT, CAL, MSFL, and LLD. It was generally accepted that the above factors sometimes exert great influence on logging responses. The influence cannot be neglected when their impact on density, velocity, resistivity, etc., is greater than changes in TDC.
5.2. TDC and CBM Well Productivity
It is well known that another key factor is the methane content in CBM productivity evaluation. However, gas contents were high, and their difference was small in the HC block (Figure 7). Therefore, the factor of gas content can be excluded from this evaluation of CBM well production.
The data sets of the undeformed coal and cataclastic coal were mixed together and did not support being distinguished from each other in the HC block, so the two coals were both termed as Type I here. This uncertainty has also been reported in previous studies [20,21,22,23,29]. The main reason is believed to be that the majority of original coal textures are preserved in both kinds of coal, and all features will show little difference after fractures are closed under high effective stresses [13,37]. In addition, in contrast to granulated and mylonitized coal, undeformed and cataclastic coal can both acquire higher permeability after the enhancement of hydraulic fracturing, and they are favorable for CBM recovery [4,5,29]. As a result, this uncertainty was supposed to have little influence on the evaluation of gas productivity.
It can be observed that in Figure 9 and Figure 10, with the increase in daily gas production, the thickness ratio had an obvious increasing trend. The occurrence of the two types of productivity patterns was mainly induced by the proportional difference in the well-preserved layer. The well-preserved coal seam as well as the high CBM productivity zone mainly concentrated in the eastern areas of the HC block. Wells with gas production less than 750 m3/d had a thickness ratio of less than 60%, and their average production was 320 m3/d. The ratio was greater than 60% when gas production exceeded 1000 m3/d and the average was 1700 m3/d. When the well-preserved layer thickness ratio was greater than 60%, and the CBM reservoir productivity was better. The development of granulated and mylonitized coals mainly exerted a negative influence on CBM well production.
6. Conclusions
This paper proposed a new TDC detection method using joint static and dynamic indicators of RPPI and RFI based on drilling core samples of exploration wells and well logs of CAL, DEN, DT, MSFL and LLD. Three types of TDC were identified: Type I, undeformed and cataclastic coal; type II, granulated coal; and type III, mylonitized coal. The flag threshold values were 125 and 142 for the RPPI indicator, while for the RFI indicator, the threshold values were 50 and 70. The test results prove that the proposed method can reach an identification accuracy of 88.9%. TDCs and their thickness of 83 non-cored exploitation wells in the HC block were interpreted. It was found that CBM wells with well-preserved coal (the thickness ratio of type I coal being more than 60%) had a higher production (>1000 m3/d); ones with poorly preserved coal (the thickness ratio of type I coal being less than 60%) tend to have lower productivity (<750 m3/d). The study testified that TDC and its thickness derived from geophysical logging can provide meaningful information to evaluate gas productivity in strong, tectonically deformed areas like the HC block.
7. Patent
The method used here has been officially authorized the invention patent in China.
A Prediction Method of Tectonically deformed Coal Based on Geophysical Logging data. (Grant No.: ZL201610497394.5).
Author Contributions
Conceptualization, Q.C.; methodology, Q.C. and J.L. (Jianhui Long); formal analysis and resources, J.J.; validation and investigation, J.L. (Jun Liu); writing—original draft, Q.C.; writing—review and editing, Q.C., J.J., J.L. (Jianhui Long) and S.Z.
Funding
This work was supported by the China National Major Science Project (Grant No. 2016ZX05065), the Shanxi Provincial Natural Science Foundation of China (Grant No. 201801D121032) and Research and Application of Key Technologies for Seismic Recognition of Coal Seam Gas Outburst Dangerous Areas (Grant No. GY18027).
Conflicts of Interest
The authors declare no conflicts of interest.
References
- Hou, Q.; Li, H.; Fan, J.; Ju, Y.; Wang, T.; Li, X.; Wu, Y. Structure and coalbed methane occurrence in tectonically deformed coals. Sci. China Earth Sci. 2012, 55, 1755–1763. [Google Scholar] [CrossRef]
- Clarkson, C.R. Production data analysis of unconventional gas wells: A review of theory and best practices. Int. J. Coal Geol. 2013, 109, 101–146. [Google Scholar] [CrossRef]
- Connell, L.D.; Lu, M.; Pan, Z.J. An analytical coal permeability model for tri-axial strain and stress conditions. Int. J. Coal Geol. 2010, 84, 103–114. [Google Scholar] [CrossRef]
- Fu, X.; Qin, Y.; Wang, G. Evaluation of coal structure and permeability with the aid of geophysical logging technology. Fuel 2009, 88, 2278–2285. [Google Scholar] [CrossRef]
- Fu, X.; Jiang, B.; Qin, Y. Identifying coal structure and forecast of coal reservoir permeability using well logs. J. Well Log. Tech. 2003, 27, 140–143. [Google Scholar]
- Pan, Z.; Connell, L.D. Modelling of anisotropic coal swelling and its impact on permeability behaviour for primary and enhanced coalbed methane recovery. Int. J. Coal Geol. 2011, 85, 257–267. [Google Scholar] [CrossRef]
- Yao, Z.; Cao, D.; Wei, Y.; Li, X.; Wang, X.; Zhang, X. Experimental analysis on the effect of tectonically deformed coal types on fines generation characteristics. J. Petrol. Sci. Eng. 2016, 146, 350–359. [Google Scholar] [CrossRef]
- Li, Y.; Wang, L.; Liu, G. Study on coal reservoir damage mechanism in dewatering and extraction process of CBM wells. China Coal. Meth. 2010, 7, 39–43. [Google Scholar]
- China National Standard. Classification of Coal-Body Structure (GB/T 30050-2013); China National Standardization Administration: Beijing, China, 2013. [Google Scholar]
- Zhao, H.; Zhang, H.; Yin, G. Experiments on triaxial mechanical properties of soft coal containing gas. J. Chongqing Univ. 2013, 36, 103–109. [Google Scholar]
- Wang, Y.; Xu, X.; Yang, D. Ultrasonic elastic characteristics of five kinds of metamorphic deformed coals under room temperature and pressure conditions. Sci. China Earth Sci. 2014, 11, 2431–2439. [Google Scholar] [CrossRef]
- Wang, Y.; Xu, X.; Zhang, Y. Ultrasonic elastic characteristics of six kinds of metamorphic coals in China under room temperature and pressure conditions. Chin. J. Geophys. 2016, 59, 350–363. [Google Scholar]
- Teng, J. Identification of Coal Structures with the Aid of Geophysical Logs: A Case Study of the Southern Qinshui Basin. Ph.D. Thesis, China University of Geosciences, Beijing, China, 2016. [Google Scholar]
- Lv, S.; He, J. Electrical property measurements for the outburst coal mass. J. Cent. Sout. Univ. Tech. 1998, 29, 511–513. [Google Scholar]
- Chen, H.; Jiang, B.; Chen, T.; Xu, S.; Zhu, G. Experimental study on ultrasonic velocity and anisotropy of tectonically deformed coal. Int. J. Coal Geol. 2017, 179, 242–252. [Google Scholar] [CrossRef]
- Song, X.; Tang, Y.; Li, W.; Zeng, H.; Xiang, J. Pore structure in tectonically deformed coals by small angle X-ray scattering. J. China Coal Society. 2014, 39, 719–724. [Google Scholar]
- Lu, J.; Wang, Y.; Chen, J. Detection of tectonically deformed coal using model-based joint inversion of multi-component seismic data. Energies 2018, 11, 829–845. [Google Scholar] [CrossRef]
- Hou, H.; Shao, L.; Guo, S.; Li, Z.; Zhang, Z.; Yao, M. Evaluation and genetic analysis of coal structures in deep Jiaozuo Coalfield, northern China: Investigation by geophysical logging data. Fuel 2017, 209, 552–566. [Google Scholar] [CrossRef]
- Fu, X.; Lu, G. The effect of logs in predicting coal and gas outburst. Coal Geol. China 1998, 10, 82–83. [Google Scholar]
- Qiao, W.; Ni, X.; Zhang, X. The relation between the coal structure combination and the changes in well diameter. J. Henan Polyt. Univ. 2010, 29, 162–166. [Google Scholar]
- Chen, Y.; Tang, D.; Xu, H. The distribution of coal structure in Hancheng based on well logging data. J. China Coal Soci. 2013, 38, 1435–1442. [Google Scholar]
- Lu, X.; Huang, W.; Wang, J. The development characteristics of deep coal structure in northern Shizhuang area. Coal Geol. Expl. 2014, 42, 8–11. [Google Scholar]
- Guo, T.; Wang, Y. Evaluation of logging of coal texture of seam 2 in southern of Yanchuan and analysis of its main controlling factors. Coal Geol. Expl. 2014, 42, 22–25. [Google Scholar]
- Li, J.; Liu, D.; Yao, Y. Evaluation of the reservoir permeability of anthracite coals by geophysical logging data. Int. J. Coal Geol. 2011, 87, 121–127. [Google Scholar] [CrossRef]
- Liu, J.; Wang, J.; Fu, Q. Study on logging response characteristics and distribution of coal rock structure in Zhengzhuang Area. J. Coal Sci. Eng. 2013, 10, 9–14. [Google Scholar]
- Ma, G.; Chen, T.; Cui, R. Identification of tectonically deformed coal using well logs: A case study. Prog. Geophy. 2017, 32, 1208–1216. [Google Scholar]
- Yao, J.; Sima, L.; Zhang, Y. Quantitative identification of deformed coals by geophysical logging. J. China Coal Soc. 2011, 36, 94–98. [Google Scholar]
- Wang, Y.; Liu, D.; Cai, Y.; Yao, Y.; Zhou, Y. Evaluation of structured coal evolution and distribution by geophysical logging methods in the Gujiao block, northwest Qinshui basin, China. J. Nat. Gas Sci. Eng. 2018, 51, 210–222. [Google Scholar] [CrossRef]
- Tang, S.; Tang, D.; Li, S.; Xu, H.; Tao, S.; Geng, Y. Fracture system identification of coal reservoir and the productivity differences of CBM wells with different coal structures: A case in the Yanchuannan Block, Ordos basin. J. Petrol. Sci. Eng. 2018, 161, 175–189. [Google Scholar] [CrossRef]
- Wang, X.; Li, Y.; Chen, T. Quantitative thickness prediction of tectonically deformed coal using extreme learning machine and principal component analysis: A case study. Comput. Geosci. 2017, 101, 38–47. [Google Scholar] [CrossRef]
- Xie, X.; Fan, M. Quantitative identification of deformed coals based on logging response. China Coal. Meth. 2013, 10, 27–29. [Google Scholar]
- Sibbit, A.M.; Faivre, O. The dual laterolog response in fractured rock. In Proceedings of the SPWLA 26th Annual Logging Symposium, Dallas, TX, USA, 17–20 June 1985. [Google Scholar]
- Hoyer, D.L. Evaluation of coalbed fracture porosity from dual laterolog Log. Log Anal. 1991, 32, 654–662. [Google Scholar]
- Rozak, A.T. Evaluation and Application of Fracture Detection Software to Coalbed Methane Exploration. Ph.D. Thesis, University of British Columbia, Kelowna, BC, Canada, 2003. [Google Scholar]
- Rozak, A.T.; Bustin, R.M.; Strashok, G.W.; Beaton, A.; Richardson, R.; Hunter, T. Application of logfac to coalbed methane exploration in western Canada: A case history from Ardley coals near Red Deer Alberta. In Proceedings of the SPE Gas Technology Symposium, Calgary, AB, Canada, 30 April–2 May 2002. [Google Scholar]
- Chen, Q.; Yao, H.; Chang, S. Coalbody structure classification method based on dual-lateral and RXO cross-plot analysis. J. Coal Sci. Eng. 2013, 19, 522–529. [Google Scholar] [CrossRef]
- Chen, G.; Hu, Z.; Su, K.; Zhang, Y. Analysis on relationship between coal structure and gas production quantity in deep coal seam of Yanchuannan area at southeast Ordos. Coal Sci. Tech. 2016, 44, 107–112. [Google Scholar]
- Wang, L.; Liu, C.; Wu, Y. Shanxi Formation coal No.2 lithotype features and gas-bearing property logging response analysis in Yanchuan South Block. China Coal Geol. 2013, 25, 48–52. [Google Scholar]
- Li, Z.; Han, M.; Wei, J.; Yu, J.; Li, J.; Lu, D. Analysis of high-resolution sequence stratigraphy and coal accumulation law of upper Paleozoic erathem in Ordos basin. J. China Univ. Petro. Nat. Sci. 2008, 32, 5–12. [Google Scholar]
- China Energy Industry Standard of Quality. The Specifications for Coalbed Methane Well-Logging (NB/T 10021-2015); China National Energy Administration: Beijing, China, 2015. [Google Scholar]
- China Energy Industry Standard of Quality. Acceptance Specification for Coalbed Methane Well-Logging Data and Its Interpretation Data (NB/T 10023-2015); China National Energy Administration: Beijing, China, 2015. [Google Scholar]
- Wei, J.; Chen, Y.; Wen, J. Study of gas desorption laws of tectonically Coal. Safe. Coal Mines 1998, 29, 1–3. [Google Scholar]
- Hu, G.; Jiang, B.; Chen, F. Study on different type structure coal features and gas outburst control. Coal Sci. Tech. 2012, 40, 111–115. [Google Scholar]
- Levine, J.R. Model Study of the influence of matrix shrinkage on absolute permeability of coalbed reservoirs. Geol. Soci. Publ. 1996, 199, 197–212. [Google Scholar] [CrossRef]
- Harpalani, S.; Schraufnagel, R.A. Shrinkage of coal matrix with the release of gas and its impact on the permeability of coal. Fuel 1990, 69, 551–556. [Google Scholar] [CrossRef]
- Chen, J.; Zhang, S.; Huang, Z. Coupling effect between coal matrix shrinkage and its mechanical properties. J. Wuhan Univ. Tech. 2004, 26, 67–70. [Google Scholar]
- Ren, P.; Xu, H.; Tang, D.; Li, Y.; Sun, C.; Tao, S.; Li, S.; Xin, F.; Gao, L. The identification of coal texture in different rank coal reservoirs by using geophysical logging data in northwest Guizhou, China: Investigation by principal component analysis. Fuel 2018, 230, 258–265. [Google Scholar] [CrossRef]
© 2019 by the authors. Licensee MDPI, Basel, Switzerland. This article is an open access article distributed under the terms and conditions of the Creative Commons Attribution (CC BY) license (http://creativecommons.org/licenses/by/4.0/).