1. Introduction
Cities have become the centers of social economies and human activity, and promoting cities’ efforts to reduce carbon emissions is essential for global carbon emissions reduction. At the same time, due to the increase of energy consumption and emissions brought by rapid economic development, the issue of energy and emissions in developing countries is attracting growing attention [
1,
2,
3,
4]. As the world’s largest carbon emitter and a party to the Paris Agreement, China’s actions are crucial in dealing with global warming [
5,
6,
7]. The Chinese government has committed to peak its carbon emissions by 2030, and the transformation of its urban development patterns is crucial in reducing carbon emissions. The Chinese government has taken a top-down approach to reducing carbon emissions. China’s central government set up a low-carbon city construction project in 2010 and hopes to promote the experiences of the selected pilot cities across the country by 2020. These selected pilot cities will focus on promoting energy-saving and emissions reduction policies, and take the reduction of carbon emissions as part of the government’s mission [
6,
8,
9]. The results of energy conservation and emissions reduction in the previous year and the targets for the next year are clarified in the annual government work reports of all pilot city governments. The specific content includes developing low-carbon industry, low-carbon technology, low-carbon transportation, and so on. An investigation of these policy instruments and their effectiveness can produce lessons for low-carbon city development not only in China but also in other places around the world, and then can eventually contribute to global carbon emissions reduction.
The study investigated the policy instruments and the effectiveness used in one Chinese city’s low carbon city development efforts. The unit we selected, Qihe County in Shandong Province, is a pilot and model for low-carbon city development in China. Policies published by the local government of Qihe County from 2008 to 2014 were collected and coded as raw data. There were two innovation points in this paper, including a policy analysis framework and a set of policy effect evaluation methods. The policy analysis framework was a two-dimensional analysis framework, which was used to typify policy provisions so as to analyze the policy status quo of low-carbon city construction. The two dimensions of this analytical framework contained the types of policy instruments and the objectives of low-carbon policies. Policy instruments consisted of three major categories and ten sub-categories; as to the low-carbon policy objectives, there were six categories involved. All the policy provisions on low-carbon city construction from 2008 to 2014 in Qihe County were collected, and all of them were classified into concrete types of policy instruments with assigned low-carbon policy purposes. In this way, specific policy instruments could be linked to policy objectives, which helped to understand the ideas and approaches that local governments in China have employed in building low-carbon cities. The second innovative point, a three-step analytical framework was then used to analyze the effectiveness of these policy instruments. The first step addressed the balance between the proportion of policy instruments and the completion degree of each instrument. The second estimated the optimum combination of different policy instruments, which meant the highest degree of completion. The third step addressed the stability of policy completion among leading years using a specific combination of policy instruments. Based on these analyses, our paper contributes to current knowledge regarding low-carbon city policies in China, and these lessons learned can be applied for low-carbon development in other countries as well.
The paper consists of six parts. This first section introduces the importance of studying policy instruments related to China’s low-carbon city construction, as well as the uniqueness of the study. The second part is a literature review, which mainly introduces the concepts of and cutting-edge research on the low-carbon city and policy instruments. The third section presents the research method used in the study, including the two-dimensional analytical framework and the three indicators for evaluating the accomplishment of policy instruments. In the fourth section, the use of policy instruments is then described, and the effectiveness of policy instruments has also been analyzed. The fifth part discusses the effectiveness of different policy instrument combinations and the optimal ratio of policy instruments, as well as the reasons for this result. Finally, the last section presents the paper’s conclusions.
2. Literature Review
2.1. Low-Carbon Cities
A low-carbon city’s key task is to establish an environmental friendly society by developing a low-carbon economy, city development, and increasing citizens’ low-carbon awareness to promote harmonious economic, societal, and environmental development [
10,
11]. Many countries and international organizations around the world have taken measures to deal with climate change at the city level [
12,
13]. In the construction of low-carbon cities, strategies such as transforming the power system and optimizing the transportation system are the most direct measures adopted to reduce carbon emissions [
7,
14,
15,
16,
17]. In addition, other policy measures are also gaining attention, such as establishing a standardized carbon emissions trading market, calling for citizens to reduce the use of private cars, and investing funds in research on new energy technologies [
18,
19]. However, these policies are diverse and need to be sorted out to establish multi-dimensional output standards, so as to clarify the overall goal of low-carbon city construction.
It is clear that the low-carbon city outcome criteria must involve at least three dimensions: the economy, society, and environment [
5,
20]. The China Low-carbon Economy Media Federation (CLEMF) issued an authoritative report titled
The Evaluation System of the Low-carbon Cities in China on 19 January 2011, which put forth 10 low-carbon city outcome criteria: an urban low-carbon development planning target, a low-carbon transportation target, an urban low-carbon building target, an urban air quality target, a media dissemination target, a utility ratio of new energy, an renewable energy and low-carbon products target, an urban green coverage rate target, an urban direct carbon reduction target, a citizens’ satisfaction and support target, and a one-vote negation target [
21]. Researchers used economic development, industry development, science and technology development, and social support and environmental support as low-carbon city evaluation criteria [
8,
22,
23]. Some others regarded the economy, society, and the environment as low-carbon city building outcome criteria [
24]. After reviewing the literature on the issue, this study determined that the economy, society, and the environment are the three basic fields of a low-carbon city, with varying connotations among them. In the economic field, the effective utilization of resources and energy, as well as the application of low-carbon technology, is of great significance. In the societal field, urban planning is the primary task, especially for low-carbon construction and low-carbon transportation regulations. The societal field also stresses fostering low-carbon awareness. The environmental field clearly underlines the governance of urban greening and pollution control.
2.2. Policy Instrument
Policy instruments are techniques of governance that involve the utilization of state resources, or their conscious limitation to achieve policy goals. They are the “tools of governance”, the mechanisms and techniques used to implement public policies [
25]. Since public policy scholars have different understandings of policy issues, goals, and relevant means, there are various classification methods [
6,
26,
27,
28,
29,
30,
31]. Generally speaking, policy instruments research can be divided into two approaches: the resource approach and the choice approach. The former refers only to the options within the government intervention branch, while the latter comprises the government nonintervention as well as the government intervention branches [
32].
In the resource approach, the first large scale attempt at classifying policy means was Kirschen’s analysis of the tools available for economic policy [
31]. This is a very detailed analysis with 64 types of instruments, relying upon the selection of optimal instruments for intervention. The major problem with this wide range of possible options is their lack of structure and organization. Hood used the acronym NATO to describe the policy instruments that can be applied by the government: Nodality, Authority, Treasure, and Organization. This classificatory branch illustrates that government can solve its problems by using the information at its disposal, its legal powers, its money, or its formal organizational capacity [
33]. McDonnell and Elmore also used a four-fold classification of policy instruments: mandates, inducements, capacity-building, and system-changing [
29]. Based on Amitai Etzioni’s categorization of three powers, coercive, remunerative, and normative power, Bemelmans-Videc et al. put forward three relevant policy instruments: regulation refers to coercion, economic means the use of remuneration or deprivation of material resources, and information refers to intellectual and moral appeals [
32].
Compared with the resource-reallocation-oriented approach, the choice approach has gained more attention along with the development of the market and civil society. Doern and Phidd discussed a continuum of instruments for intervening in the economy, ranging from self-regulation to public ownership [
34]. Similarly, Anderson discussed moving along “the continuum from freedom to control” or deciding upon “how much events will be controlled and regulated by government authority, and how much they will be left up to the voluntary initiatives of individuals” [
30]. The problem with Anderson’s classification is that market mechanism is equated with government non-interference, but the classification fails to mention other alternatives to public intervention such as civil society (neighborhood, social networks, and voluntary associations) and households. Howlett and Ramesh put forward a classic categorization including three primary (compulsory policy instrument, mixed policy instrument, and voluntary policy instrument) and ten basic types based on the standard of state interference [
28]. They then further divided voluntary policy instruments into two groups: the instruments of markets and the instruments of households or civil society [
27]. The specific connotations of these policy instruments are presented in
Table 1.
Based on the categorization of policy instruments, increasing research attention nowadays has gradually headed for the optimal design of policy instrument mixes [
28,
35,
36], which are based on policy instrument choice and policy effectiveness evaluation. Howlett and Rayner put forward that there have been three generations of policy instrument choice [
28]. “First-generation” scholars studying the tools of government were concerned largely with the analysis of business–government relations, and tended to portray instrument choices in stark, “good and evil” terms, embracing, for example, “good” pro-market choices and “evil” non-market ones (or vice versa) [
37]. “Second-generation” studies ignore the inter-relationships between substantive instruments (which affect goods and services production and delivery in society) and procedural instruments (which are designed to alter policy processes) [
28,
38,
39]. Recent, “third-generation” work on policy instruments has attempted to develop optimal policy instrument designs in complex multi-instrument settings [
36,
40]. Howlett and Rayner summarized that there are some significant design principles for policy instrument mixes, such as specifying what kinds of policy instruments are available to be mixed and employing a mix of policy instruments carefully chosen to create positive interactions with each other and to respond to particular, context-dependent features of the policy sector [
35]. Therefore, research on policy instruments should move beyond simple instrument selection to address a series of concerns involved in designing and adopting optimal mixes of policy instruments in complex decision-making and implementation contexts.
3. Data and Methods
This study adopted Howlett and Ramesh’s policy instrument theory and constructed methods for evaluating the status quo of policy instruments and the effectiveness of these policy instruments. The analysis of the status quo entailed descriptive inference, and the analysis of the effectiveness of policy instruments entailed causal inference. A two-dimensional analytical framework was developed to assess the status quo of the policy instruments. Normalization processing, correlation analysis, and variance approaches were used to analyze the effectiveness of the policy instruments, reflecting the completion degrees of those instruments.
3.1. The City Background of Qihe and Data Collection Methods
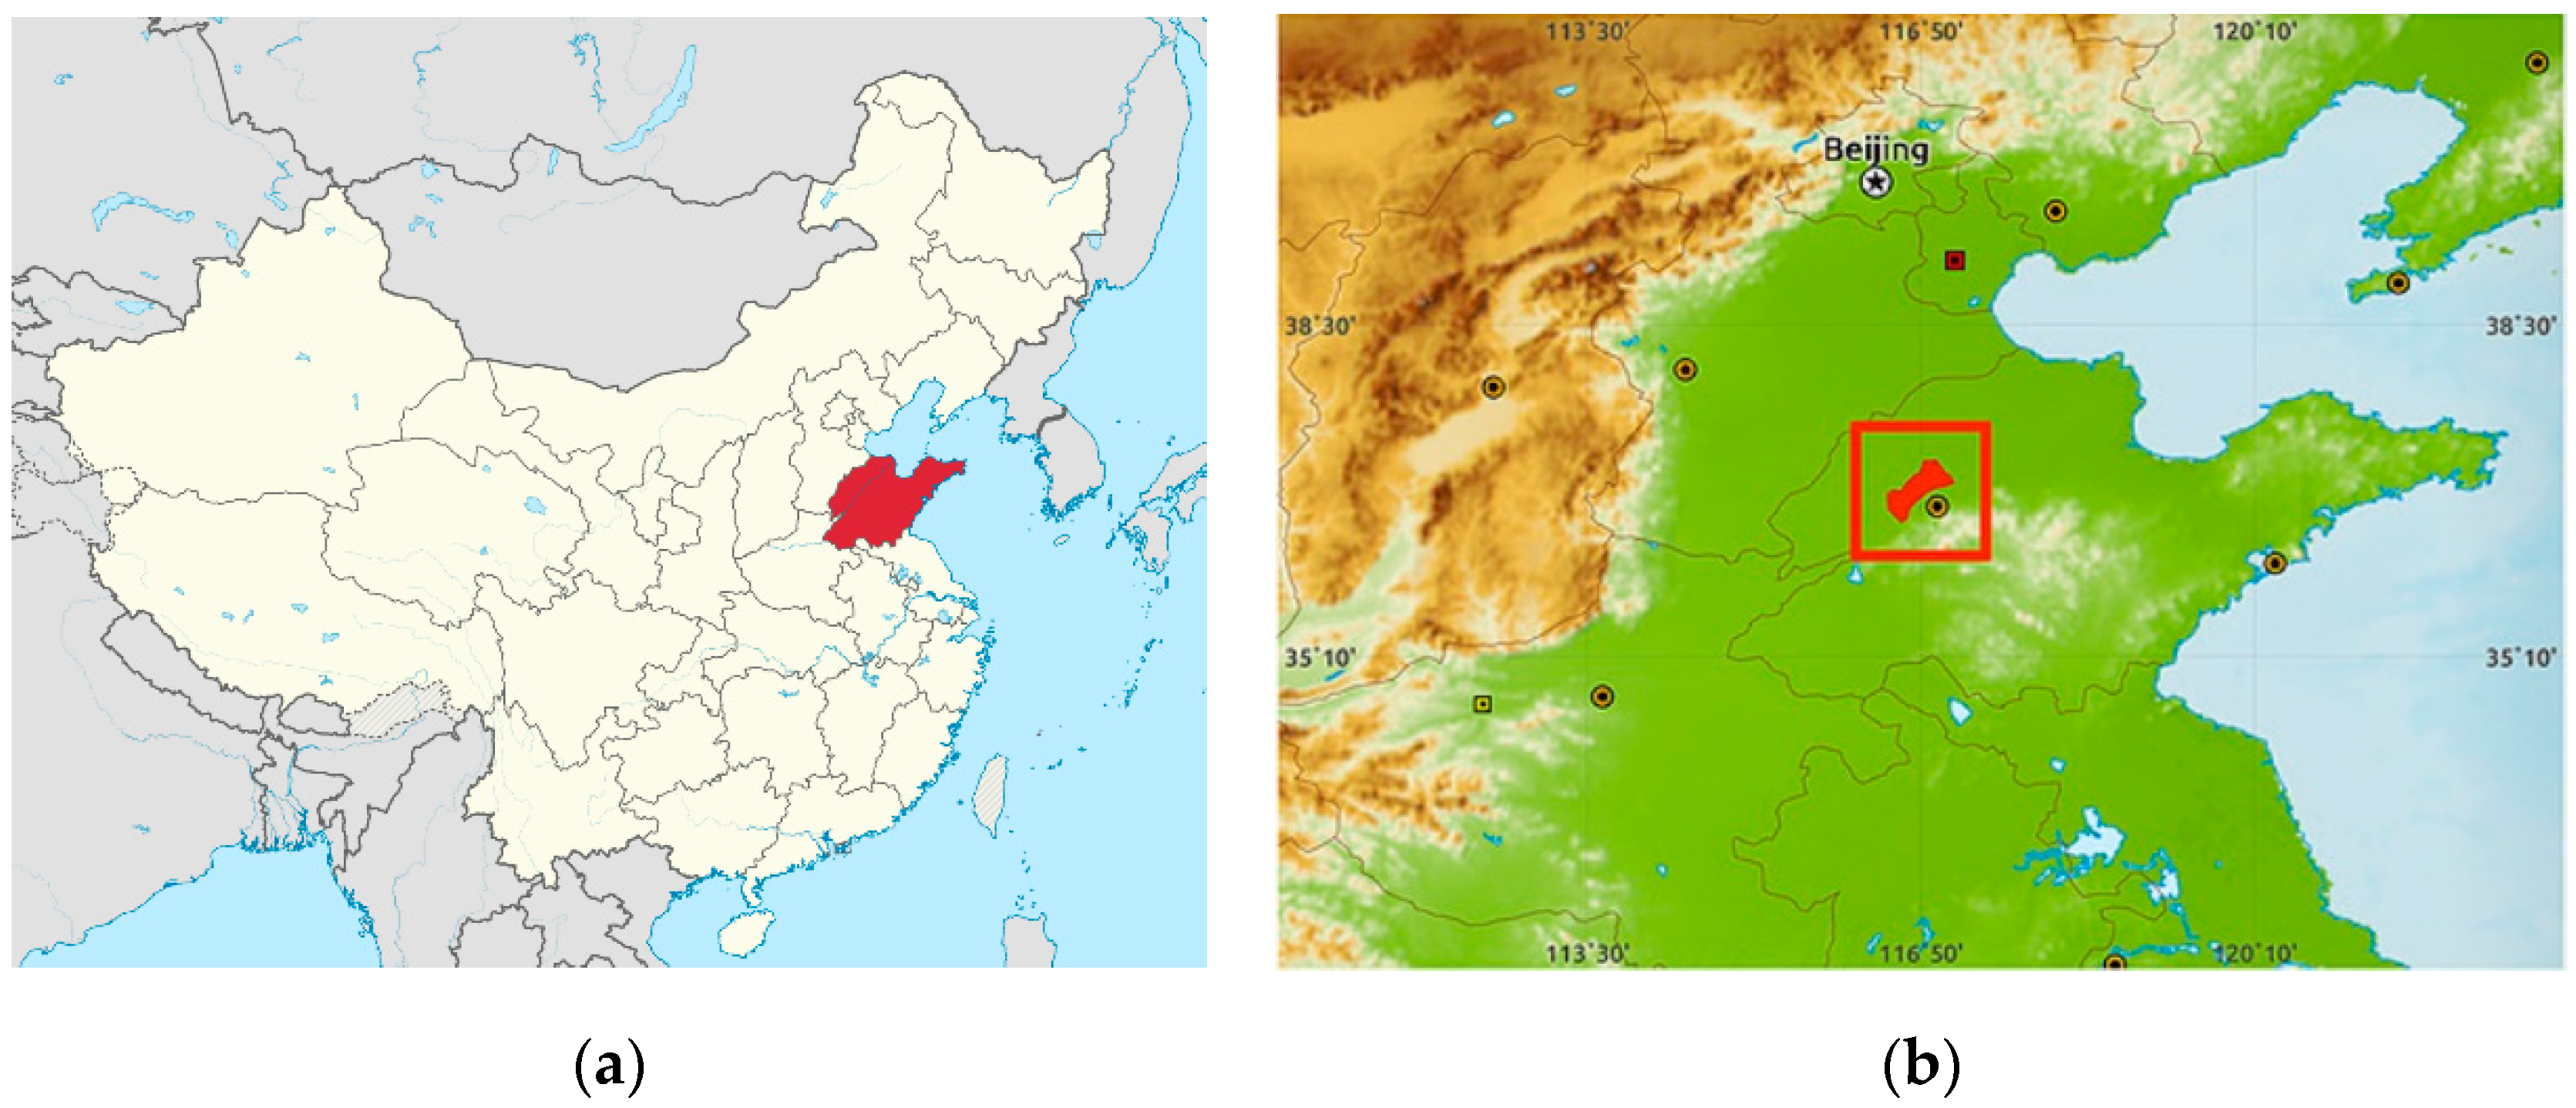
China’s low-carbon city development is an important effort to combat climate change and reduce greenhouse gas emissions. The central government of China put forward China’s goal of controlling greenhouse gas emissions by 2020 in 2009, and low-carbon city development has been considered as an important method. Qihe, a county in Shandong Province, was chosen as a pilot city to participate in the first national low-carbon city building efforts (For the location of Qihe County, please see
Figure 1). After several years’ efforts, the county has become a showcase and role model of low-carbon city building, and various titles like the “Model County for Environmental Protection in Shandong Province” and “Garden City of Shandong Province” have been awarded by the provincial government. Therefore, Qihe County was selected as the place to conduct this analysis, and all the low-carbon-city-development-related policies from the government of Qihe County from 2008 to 2014 were collected and analyzed. In total, there were 50 provisions in 31 documents, and some provisions were related to the goal of low-carbon policy, while others involved evaluation.
3.2. Methods for Discovering the Status Quo of Policy Instruments
3.2.1. Coding Scheme
The specific connotations of these policy instruments are presented in
Table 1. However, the abstract analytical schemes concerning policy instruments have to be contextualized to particular political–economic–societal situations [
41]. Coding is the initial process of connecting theoretical frameworks and specific occasions together. First, 31 valid policies were selected and coded as 1 to 32 after screening the Qihe’s policy files from 2008 to 2014 (see
Table A1). Each policy was then considered as a coding unit, all the selected policies were coded as follows: [(policy number)-(the first-grade title of provision)-(the second-grade title of provision)], e.g., [21-5-2] is an example from the 25th policy, under the 5th first title and the 2nd second-grade title (see
Table A2). Based on Howlett and Ramesh’s policy instrument theory, all the provisions were allocated into three categories: compulsory, mixed, and voluntary (see
Table 2).
3.2.2. Two-Dimensional Analytical Framework
This study constructed a two-dimensional analytical framework—with an x-axis dimension and a y-axis dimension. The x-axis referred to the three categories of policy instruments: compulsory policy instruments, voluntary policy instruments, and mixed policy instruments, based on Howlett and Ramesh’s theory. The y-axis contained six low-carbon city outcome criteria.
Based on Howlett and Ramesh’s theory, the compulsory policy instrument included public enterprises, regulation, and direct provisions. The mixed policy instruments included information and persuasion, taxation and user payment, auction of property rights, and assistance. The voluntary policy instrument included family and community, voluntary organization, and market. Those policy instruments are listed on the
x-axis. The specific contents are shown in
Table 1.
On the
y-axis, the six low-carbon city outcome criteria were derived from the low-carbon city concept and research on the relevant outcome criteria systems for low-carbon cities [
6,
42,
43]. The six low-carbon city outcome criteria included low-carbon technology, low-carbon resources, low-carbon building, low-carbon transportation, low-carbon awareness, and low-carbon environment (
Figure 2). “Low-carbon technology” refers to the development of low-carbon technology by direct or indirect investment from the government. “Low-carbon resources” refers to the investment in new energy resource fields, including in photovoltaic power generation, wind power, power grid upgrading and so on. “Low-carbon buildings” refers to the government’s investment in promoting energy-saving renovation and installation of energy-saving monitoring equipment in buildings. “Low-carbon transportation” mainly includes the government’s efforts in transforming the public transport system. “Low-carbon awareness” includes the publicity of low-carbon life and knowledge, as well as the public satisfaction degree of the government’s low-carbon policies. “Low-carbon environment” involves efforts in reducing energy consumption and pollution emissions. These dimensions are considered to be the main direction of the government’s low-carbon city construction policies. Therefore, by incorporating policy provisions into this two-dimensional analytical framework, a link between policy instruments and low-carbon policy objectives was established.
3.3. Method for Evaluating the Effectiveness of Policy Instruments
The effectiveness of these policy instruments was evaluated in three dimensions: evaluation of the policy accomplishment, the optimal proportion of the three kinds of policy instruments, and the consistency of policy instruments.
Firstly, the policy target and outcome of each provision from sample policy files were recorded. The outcomes in a given year’s files were matched with the policy targets in the previous year’s, so the status of each policy can be evaluated (see
Table A3). After that, a key indicator named as the degree of completion was defined by the ratio of the outcome value to the target value by each policy. These two values were obtained from the provisions (see
Table A4), and the degree of completion was standardized and calculated for further analysis. The formula used for normalization was:
The coefficient refers to the score of provision i in year j, while refers to the lowest score in all provisions, and refers to the highest one. Based on the formula above, the score of each provision’s objective achievement could be calculated.
An indicator defined as the annual policy completion degree was used to calculate the annual accomplishment of low-carbon policies. The index was indicated by the average degree of policy compilation each year. The formula used was as follows:
In this formula, the coefficient refers to the score of low-carbon policy accomplishment of year j. The number of a certain year’s policy provisions is expressed as n. The coefficient in this formula refers to the normalized score of provision i in year j, which is produced by the Equation (1). These indicators make the base of the other two effectiveness evaluation indicators.
The second purpose of this study was to figure out the optimal proportion of policy instruments according to the annual score and proportion of policy instruments. At first, the correlation between annual score and proportion were used to reveal the relationship between the two variables. This revealed which policy instruments were more conducive to improving policy completion. Combined with the correlation between the composition of policy instruments and the degree of policy completion in each year, the proportion of policy instruments that achieved the best policy completion degree was obtained. This analysis helped to maintain a balance between the effects of different policy instruments that may conflict with each other.
Finally, the last indicator refers to the annual consistency of policy instruments. Consistency refers to the balance of policy effectiveness among different instruments in a certain year. Consistency was operationalized as the variance of completion degree on different policy instruments. Low variance of the completion degree of policies on different policy instruments variance indicates strong consistency, while high variance indicates poor consistency. The formula for policy instrument consistency is:
In this formula, is the key indicator used to evaluate the annual variation of the effectiveness of different provisions, which also refers to the instrument consistency. The number of a certain year’s policy provisions, also expressed as n. , refers to the score of provision i in year j, while is the score of low-carbon policy accomplishment of year j. These two coefficients are produced by Equations (1) and (2).
In this study, MATLAB 8.4 was used for model construction and calculation. This is software specially adopted for model construction, simulation, and matrix calculation. The functions applied in this study, including the calculation of policy completion degree and policy stability, certain correlation analysis, and chart presentation, were also involved.
4. Results
4.1. Status Quo of Policy Instruments
4.1.1. The Proportions of Different Policy Instruments
The three-axis diagram in
Figure 3 shows the proportion of policy instruments in Qihe’s low-carbon city development from 2008 to 2014. The three primary policy instruments, compulsory, mixed, and voluntary, shared 56%, 40%, and 4% of the total provisions from 2008 to 2014, respectively. Among these instruments, the regulation policy instrument in the category of compulsory primary policy instrument had the highest application, comprising 56% of the total number. Mixed policy instruments varied. Apart from the policy instrument for the auction of property rights, accounting for 0%, policy instruments for assistance, information and persuasion, and taxation and user fees constituted 20%, 14%, and 6%, respectively. Finally, voluntary policy instruments had the lowest application, and only the instrument for voluntary organizations was used, representing 4%.
4.1.2. Policy Instruments by Outcome Criteria
The policy instrument allocation by outcome criteria was unbalanced and there were large gaps among the efforts of policy instruments in different outcome criteria, as shown in
Figure 4. The different colors represent the six low-carbon city outcome criteria, while the rising and falling patterns represent allocation changes of the policy instruments.
In view of the policy instruments, compulsory policy instruments and mixed policy instruments covered nearly all six outcome criteria (namely, low-carbon technology, low-carbon resources, low-carbon building, low-carbon transportation, low-carbon awareness, and low-carbon environment), while voluntary policy instruments primarily focused on low-carbon awareness. Among all basic policy instruments, regulation and assistance instruments were in the top two. The highest figure for the allocation of regulation instruments was in the outcome criterion for low-carbon resources. Meanwhile, the highest figure for assistance instruments was in the outcome criterion for low-carbon technology. Notably, the policy instrument for information and persuasion was the most comprehensive, covering all the outcome criteria except low-carbon building (namely, low-carbon technology, low-carbon resources, low-carbon transportation, low-carbon awareness, and low-carbon environment).
As for low-carbon city outcome criteria, the policy instruments in different outcome criteria also varied. For the majority of the outcome criteria, there were always two primary policy instruments applied; however, the outcome criteria for low-carbon building and low-carbon technology were served only by one type of policy instrument, which consisted of compulsory and mixed policy instruments. The diagram also showed that four basic policy instruments were applied to low-carbon resources, while only two were applied to the low-carbon environment, indicating that the government of Qihe put the most effort toward developing low-carbon resources and the least effort towards a low-carbon environment.
4.2. The Effectiveness of Policy Instruments
4.2.1. The Fulfillment of Policies
The degree of policy completion was used as a direct indicator to evaluate the relationship between the different primary policy instrument proportions and the total score for completion degree. Scatter diagrams have been used to show the relationship of completion degree and each policy instrument’s proportion, respectively. It was obvious that there might be a correlation between the accomplishment and the proportion of compulsory and mixed policy instruments (see
Figure 5a,b). By contrast, because there were too few data regarding voluntary policy instruments, the relationship between the accomplishment and proportion of voluntary policy instruments could not be established (see
Figure 5c).
Kendall’s tau coefficient was applied to calculate the correlation between the proportion of compulsory policy instruments and the degree of completion. The result showed that the proportion of compulsory policy instrument use was negatively correlated with the score for the current year, with a correlation coefficient of −0.39. However, the result was statistically insignificant (sig = 0.224). The correlation between the proportion of mixed policy instrument and the degree of completion was calculated with the same method. The proportion of mixed policy instrument use had a positive correlation with the score, with a correlation coefficient of 0.514. The result was almost statistically significant (sig = 0.117). This means, to some degree, that the higher the proportion of mixed policy instrument use in a year, the higher the effect on the construction of low-carbon cities during that year. Therefore, these results revealed that the implementation of mixed policy instruments is better than compulsory policy instruments, in general.
4.2.2. The Optimum Balance between Various Policy Instrument Categories
Figure 6a shows the variation of the scores from 2008 to 2014.
Figure 6b integrates the annual use proportion of the different policy instruments. Combined with the curve of
Figure 6a,
Figure 6b makes it easier to see the effectiveness of policy instruments in different usage combinations. Results showed that the highest score point was in 2013, while the lowest was in 2014 (see
Figure 6a). This means the effectiveness of policy instruments peaked in 2013 and bottomed in 2014. Combined with
Figure 6b, the two years’ corresponding proportions of compulsory and mixed policy instrument use were almost 1:2 (2013) and 3.33:1 (2014). This showed that the optimum balance proportion between compulsory and mixed policy instrument use is likely to be 1:2. However, the year 2009 was an exception, although the accomplishment score of 2009 was also very high, second only to the score of 2013. That means the ratio of optimal balance may not be entirely fixed at 1:2. However, there was also other evidence that could support such a conclusion.
4.2.3. The Consistency of Policy Instruments
The consistency of the policy instruments was analyzed to make a further evaluation of the relationship between the instrument proportions and the policy effectiveness. Consistency refers to the balance of policy effectiveness among different instruments in a certain year. In fact, the evolution of consistency is a remedy for the former evolution of optimal balance. Our aim was to test whether the high score under optimum instrument combination resulted from a high completion degree of one or two specific policy instruments. If so, that means the balance of instrument combination is broken. If the balance is broken, then the usage of policy instruments lacks consistency. The key indicator used to evaluate the consistency was here the variance of accomplishment of different policy instruments. The higher the variance value is, the poorer the consistency of the policy instrument.
Figure 7 shows changes in the annual variance of the policy instruments’ accomplishment. In
Figure 7, it is clear that the variance in 2013 far exceeded that of other years, and the variance in 2014 was the lowest. This means that the consistency of policy instruments in 2013 was the poorest, and the consistency of policy instruments in 2014 was much better. However, according to
Figure 6a, 2013 had the highest score, while 2014 had the lowest score. This shows that it is difficult to strike a balance between degree of policy completion and stability of the overall policy effect.
5. Discussion
Through the analysis of policy tools and the low-carbon city construction target model, it was found that in the process of low-carbon city construction in China, the most used policy tools have been compulsory instruments, especially regulations. These accounts for more than half of all policy instruments. Voluntary policy instruments are rarely used, and mixed policy instruments account for about 40%. Moreover, there are various specific instruments within the category of mixed policy instruments. This shows that China’s low-carbon city construction is mainly a policy framework implemented by the government’s direct manipulation and intervention. Existing studies also show that China’s low-carbon city construction is often dominated by regulatory instruments, supplemented by market-based means [
6,
9,
44].
A two-dimensional analysis of policy instruments and low-carbon city construction outputs has shown that low-carbon technology and energy are the main outputs of policy instruments. The regulations’ main outputs are low-carbon energy and low-carbon buildings, while mixed instruments’ main output is promoting the development of low-carbon technologies. The less-used voluntary instruments aim to raise public awareness of low-carbon life. It has been indicated that China’s low-carbon city construction mainly takes mandatory and mixed instruments as the main instruments, and takes the development of low-carbon energy and technology as the main outputs [
5,
45].
In terms of policy effectiveness, this study analyzed the correlation between the composition ratio of policy tools and the policy completion degree in each year, and found that the higher the proportion of compulsory policy instruments, the higher the policy completion degree. This indicates that mandatory tools contribute more to overall policy completion. The reason may be due to prescription-driven enforcement instruments being more powerful and able to be prioritized. Another reason may be that compulsory policy tools are clear and definite to implement. This is also the reason why policymakers are more willing to use compulsory instruments.
Annual comparisons showed that 2009 and 2013 had the best policy effect, while 2014 was the least effective year. In the two years with the highest policy efficiency, the ratio of compulsory policy instruments to mixed policy instruments was approximately 2:1. This value can be considered the optimal ratio of the two policy instruments. As conflicts may occur between different policy instruments, the balance between policy instruments is very important to ensure the overall completion of the policy. Thus, based on existing data analysis, 2:1 is the best ratio between compulsory instruments and mixed policy tools, and is also the best ratio to maintain the effectiveness of policies.
Finally, variances between policy completions were calculated to assess the consistency of policy instruments. The smaller the variance is, the smaller the difference between completion degrees of different policy instruments. The results showed that the year when the policy was most effective was also the year when the policy was least stable. In the year 2013, the addition of voluntary instruments with a low completion degree may also have affected the consistency of the policy completion degree. This indicates that when resources are invested into specific policies, the overall degree of policy completion will be elevated, but the resource allocation among different policies will be unbalanced. Some easily targeted policies are well implemented and may even be exceeded. In turn, the less emphasized policies will be mal-implemented with insufficient resources and followed by reduced degree of completion [
32,
37,
41]. This breaks the stability among various policy instruments. However, the imbalance between completions should not be a reason for policymakers to abandon policy instruments with a low completion degree. Policymakers may abandon policies that work in the long run but cannot be completed in a short time; on the contrary, those policy instruments that have long been less completed may have great potential and deserve more attention from policymakers. In the Chinese context, the government has dominated the construction of low-carbon cities for a long time. In this case, policymakers should pay more attention to those mixed policy instruments and voluntary policy instruments and use them actively. These policy instruments are not entirely dependent on government resources and are likely to be useful complements to compulsory policy instruments. In addition, with its dense population, China should pay extra attention to the effective use of land and the application of low-carbon bio-energy in the field of transportation in the process of low-carbon city construction [
17,
46,
47].
6. Conclusions
This study investigated the policy instruments governing China’s low-carbon city construction. By introducing Qihe in Shandong as a case study, this study used a two-dimensional analytical framework to describe the status quo of policy instruments. Chinese local governments mainly use compulsory and mixed policy instruments in dealing with low-carbon city matters, focusing on the development of low-carbon technologies and low-carbon energy. In general, the county’s low-carbon city construction policy completion degree is high, with relatively stable effects brought by compulsory policy instruments. Further research indicated that the optimal ratio of compulsory policy to mixed policy instruments is 2:1, which means that the combination of policy instruments can achieve the best overall policy effect under such a ratio. The results also revealed that, in the field of low-carbon city construction, high accomplishment and high consistency can seldom be simultaneously achieved. Policymakers should not only choose the proper policy instrument, but also take the mixed effects of those instruments into considerations. Aside from trying to provide some discussion about low-carbon city construction in China, this study also proposed methods and frameworks for evaluating the status quo and effectiveness of policy instruments in low-carbon city construction in China. The main purpose of this exploratory study was to explore methods of policy analysis and evaluation in the field of low-carbon city construction. The main limitation of this study lay in data collection, as only the seven-year data from one city were adopted. For further research, panel data from more cities shall be included, and causal inference can thus be conducted based on such a database.
Author Contributions
Conceptualization, B.M. and Q.M.; methodology, Q.M.; software, Q.M.; validation, Q.B.; formal analysis, X.X.; investigation, H.W.; resources, B.M.; data curation, Q.M.; writing—original draft preparation, H.W.; writing—review and editing, Q.B.; visualization, Q.B.; supervision, Q.B.; project administration, H.W.; funding acquisition, B.M.
Funding
This research was funded by “the program for Outstanding PhD candidate of Shandong University”; “the Graduate Research Fund of PSPA, Shandong University”; “China Scholarship Council”; and Shandong University Humanities and Social Sciences Youth Team Project, grant number as IFYT12106.
Acknowledgments
The authors would also acknowledge the contribution of Lianhu Zheng for the modeling and data analysis, Ziqiang Han and Xinlei Li’s help for polishing.
Conflicts of Interest
The authors declare no conflict of interest. The funders had no role in the design of the study; in the collection, analyses, or interpretation of data; in the writing of the manuscript, or in the decision to publish the results.
Appendix A
Table A1.
Sample policy file list.
Table A1.
Sample policy file list.
| No. | Policy Files |
|---|
| 1 | Energy-Saving Self-Inspection Report 2008 |
| 2 | Annual Emission Reduction Plan of Qihe County 2008 |
| 3 | Notice on Executing the Income Tax Preferential Catalogs of Special Equipment Companies for Environmental Protection, Energy and Water Saving, and Safety in Production |
| 29 | Work Focus to Energy Conservation and Emission Reduction of the Transportation Industry 2010 |
| 30 | Notice by the General Office of the Shandong Provincial Government on Printing and Distributing the Subsidy Scheme of Weeding Out Yellow Label Cars Early in Shandong Province |
| 31 | Notice by the Ministry of Transportation on Printing and Distributing the Five-year Development Program about Protecting the Road and Waterway Traffic Environment |
Appendix B
Table A2.
Unit coding table for policy provisions.
Table A2.
Unit coding table for policy provisions.
| No. | Policy Document | Low-Carbon Policy Text Analysis Unit | Code |
|---|
| 1 | Energy-Saving Self-Inspection Report 2008 | 1(3) Perfected the encouraging system and increased government investment. Implemented the spirit of the Decision by the State Council on Strengthening Energy Conservation (the 28th document [2006] of our country) and Suggestions by Provincial Government on Further Strengthening the Energy-saving Work (the 108th document [2006] of Shandong Province), encouraged enterprises transforming the mode of economic growth, and improved the utilization efficiency of resources and energy. Gave priority to the promotion of circular economy projects, energy- and water-saving projects, industrial energy-saving and water-saving technique transformation projects, and energy-saving and water-saving techniques and processes. Encouraged and rewarded those units and individuals that made important contributions toward the research and promotion of energy-saving management and technology. | [1-1-3] |
| 2. The energy-saving goal of six key enterprises in 2008 was 70,970 tons. | [1-2] |
| 2 | Annual Emission Reduction Plan of Qihe County 2008 | In 2008, the county’s energy consumption per 10,000 GDP declined by 4.9%, power consumption per 10,000 GDP declined by 2%, and the water consumption of the added value of large industrial enterprises declined by 11%, having achieved the energy-saving goals set by the municipal government. | [2] |
| 5(3) Ensured a decrease in the energy consumption per unit GDP of the county by 5.54% in 2009, which decreased by 23% during the 11th Five-Year Plan. | [2-5-3] |
| 31 | Notice by Ministry of Transportation | Strengthen policy support and guidance. Transportation departments at all levels and enterprises and public institutions should formulate relevant policies, support and encourage the transport environmental protection according to relevant regulations, and raise construction funds for the transport environmental protection actively, invest more research funds, reinforce scientific support, and ensure adequate maintenance funds for traffic facilities and environmental conservation management. | [31-4] |
Appendix C
Table A3.
Samples of Policy provision scores.
Table A3.
Samples of Policy provision scores.
| Year | Policy | Code | Low-Carbon Policy Text Analysis Unit | Complete Status | Grade |
|---|
| 2008 | Energy- Saving Self-Inspection Report 2008. | [1-2] | 2. The energy-saving task of six key enterprises in 2008 was 70,970 tons. | 2. The six key enterprises saved 107,100 tons of standard coal and completed the task. | 159% |
| 2014 | The Self-inspection Report Regarding Energy-Saving Completion by the People’s Governments of Qihe County 2014. | [19-4-3-2] | 4(3) Transform existing residential buildings such as Yixin Garden, Guoshui Garden, Yingbin Garden 1 business-residential building, altogether 80,000 m2 and 4,820,000 tons. | 4(3) Having transformed the existing residential buildings such as Yixin Garden, Guoshui Garden, Yingbin Garden 1 business-residential building, altogether 97,260 m2, which was above the quota of 80,000 m2. | 121.58% |
Appendix D
Table A4.
Samples of basic policy instruments’ degree of completion in different years.
Table A4.
Samples of basic policy instruments’ degree of completion in different years.
| Type | Basic Instruments | Code | 2008 | 2009 | 2010 | …… | 2014 |
|---|
| Compulsory | Regulation | [1-2] | 159.09% | | | | |
| [2] | 100% | | | | |
| [2-5-3] | 100.36% | | | | |
| [4-2] | | 147.75% | | | |
| [4-5-3-1] | | | 102.58% | | |
| [4-5-3-2] | | | 105.08% | | |
| Voluntary | Voluntary organization | [13-8] | | | | | |
| [17-6-2] | | | | |
References
- Kharlamova, G.; Nate, S.; Chernyak, O. Renewable energy and security for Ukraine: Challenge or smart way. J. Int. Stud. 2016, 9, 88–115. [Google Scholar] [CrossRef] [PubMed]
- Strielkowski, W. Social and economic implications for the smart grids of the future. Econ. Sociol. 2017, 10, 310. [Google Scholar] [CrossRef]
- Hnatyshyn, M. Decomposition analysis of the impact of economic growth on ammonia and nitrogen oxides emissions in the European Union. J. Int. Stud. 2018, 11, 201–209. [Google Scholar] [CrossRef] [Green Version]
- Appiah, K.M.; Possumah, B.T.; Ahmat, N.; Sanusi, N.A. External environment and SMEs investment in the Ghanaian oil and gas sector. Econ. Sociol. 2018, 11, 124–138. [Google Scholar] [CrossRef] [PubMed]
- Zhang, L.; Feng, Y.; Chen, B. Alternative Scenarios for the Development of a Low-Carbon City: A Case Study of Beijing, China. Energies 2011, 4, 2295–2310. [Google Scholar] [CrossRef]
- Baeumler, A.; Ijjasz-Vasquez, E.; Mehndiratta, S. Sustainable Low-Carbon City Development in China; World Bank: Washington, DC, USA, 2012. [Google Scholar]
- Cheshmehzangi, A.; Xie, L.; Tan-Mullins, M. The role of international actors in low-carbon transitions of Shenzhen’s International Low Carbon City in China. Cities 2018, 74, 64–74. [Google Scholar] [CrossRef]
- Su, M.; Zheng, Y.; Yin, X.; Zhang, M.; Wei, X.; Chang, X.; Qin, Y. Practice of Low-carbon City in China: The Status Quo and Prospect. Energy Procedia 2016, 88, 44–51. [Google Scholar] [CrossRef] [Green Version]
- Lo, K. China’s low-carbon city initiatives: The implementation gap and the limits of the target responsibility system. Habitat Int. 2014, 42, 236–244. [Google Scholar] [CrossRef]
- Tan, S.; Yang, J.; Yan, J.; Lee, C.; Hashim, H.; Chen, B. A holistic low carbon city indicator framework for sustainable development. Appl. Energy 2017, 185, 1919–1930. [Google Scholar] [CrossRef]
- Skea, J.; Nishioka, S. Policies and practices for a low-carbon society. Clim. Policy 2008, 8, S5–S16. [Google Scholar] [CrossRef]
- Bulkeley, H.; Broto, V.C.; Edwards, G. Bringing climate change to the city: Towards low carbon urbanism? Local Environ. 2012, 17, 545–551. [Google Scholar] [CrossRef]
- Meeus, L.; Azevedo, I.; Marcantonini, C.; Glachant, J.-M.; Hafner, M. EU 2050 low-carbon energy future: Visions and strategies. Electr. J. 2012, 25, 57–63. [Google Scholar] [CrossRef]
- Capros, P.; Tasios, N.; Marinakis, A. Very high penetration of renewable energy sources to the European electricity system in the context of model-based analysis of an energy roadmap towards a low carbon EU economy by 2050. In Proceedings of the 9th International Conference on the European Energy Market, Florence, Italy, 10–12 May 2012; IEEE: Piscataway, NJ, USA, 2012; pp. 1–8. [Google Scholar]
- Alonso, P.M.; Hewitt, R.; Pacheco, J.D.; Bermejo, L.R.; Jiménez, V.H.; Guillén, J.V.; Bressers, H.; de Boer, C. Losing the roadmap: Renewable energy paralysis in Spain and its implications for the EU low carbon economy. Renew. Energy 2016, 89, 680–694. [Google Scholar] [CrossRef]
- Hiteva, R.P. Fuel poverty and vulnerability in the EU low-carbon transition: The case of renewable electricity. Local Environ. 2013, 18, 487–505. [Google Scholar] [CrossRef]
- Simionescu, M.; Albu, L.-L.; Raileanu Szeles, M.; Bilan, Y. The impact of biofuels utilisation in transport on the sustainable development in the European Union. Technol. Econ. Dev. Econ. 2017, 23, 667–686. [Google Scholar] [CrossRef]
- Simoes, S.; Nijs, W.; Ruiz, P.; Sgobbi, A.; Thiel, C. Comparing policy routes for low-carbon power technology deployment in EU—An energy system analysis. Energy Policy 2017, 101, 353–365. [Google Scholar] [CrossRef]
- De Jong, M.; Wang, D.; Yu, C. Exploring the Relevance of the Eco-City Concept in China: The Case of Shenzhen Sino-Dutch Low Carbon City. J. Urban. Technol. 2013, 20, 95–113. [Google Scholar] [CrossRef]
- Luo, G.; Zhang, J.; Rao, Y.; Zhu, X.; Guo, Y. Coal Supply Chains: A Whole-Process-Based Measurement of Carbon Emissions in a Mining City of China. Energies 2017, 10, 1855. [Google Scholar] [CrossRef]
- Su, M.; Li, R.; Lu, W.; Chen, C.; Chen, B.; Yang, Z. Evaluation of a Low-Carbon City: Method and Application. Entropy 2013, 15, 1171–1185. [Google Scholar] [CrossRef]
- Xia, C.; Li, Y.; Ye, Y.; Shi, Z.; Liu, J. Decomposed Driving Factors of Carbon Emissions and Scenario Analyses of Low-Carbon Transformation in 2020 and 2030 for Zhejiang Province. Energies 2017, 10, 1747. [Google Scholar] [CrossRef]
- Su, M.R.; Chen, B.; Xing, T.; Chen, C.; Yang, Z.F. Development of low-carbon city in China: Where will it go? Procedia Environ. Sci. 2012, 13, 1143–1148. [Google Scholar] [CrossRef] [Green Version]
- Chen, F.; Zhu, D. Theoretical research on low-carbon city and empirical study of Shanghai. Habitat Int. 2013, 37, 33–42. [Google Scholar] [CrossRef]
- Elliott, O.V.; Salamon, L.M. The Tools of Government: A Guide to the New Governance; Oxford University Press: Oxford, UK, 2002. [Google Scholar]
- Howlett, M.; Ramesh, M. Patterns of Policy Instrument Choice: Policy Styles, Policy Learning and the Privatization Experience. Rev. Policy Res. 1993, 12, 3–24. [Google Scholar] [CrossRef]
- Howlett, M.; Ramesh, M. Globalization and the choice of governing instruments: The direct, indirect, and opportunity effects of internationalization. Int. Public Manag. J. 2006, 9, 175–194. [Google Scholar] [CrossRef]
- Howlett, M.; Ramesh, M.; Perl, A. Studying Public Policy: Policy Cycles and Policy Subsystems; Oxford University Press: Oxford, UK, 2009; Volume 3. [Google Scholar]
- McDonnell, L.M.; Elmore, R.F. Getting the job done: Alternative policy instruments. Educ. Eval. Policy Anal. 1987, 9, 133–152. [Google Scholar] [CrossRef]
- Anderson, C.W. Statecraft: An Introduction to Political Choice and Judgment; John Wiley & Sons: Hoboken, NJ, USA, 1977; ISBN 0-471-02896-7. [Google Scholar]
- Kirschen, É.S. Economic Policy in Our Time; North-Holland Pub. Co., [distributor for U.S.A.: Rand McNally]: Amsterdam, The Netherlands, 1964. [Google Scholar]
- Bemelmans-Videc, M.-L.; Rist, R.C.; Vedung, E. Carrots, Sticks & Sermons: Policy Instruments and Their Evaluation; Transaction Publishers: New Brunswick, NJ, USA, 1998; ISBN 978-1-56000-338-0. [Google Scholar]
- Hood, C. Tools of Government; Chatham House Pub: Chatham, NJ, USA, 1986; ISBN 978-0-934540-52-0. [Google Scholar]
- Doern, G.B.; Phidd, R.W. Canadian Public Policy: Ideas, Structure, Process; Methuen: North Yorkshire, UK, 1983. [Google Scholar]
- Howlett, M.; Rayner, J. Design principles for policy mixes: Cohesion and coherence in ‘new governance arrangements’. Policy Soc. 2007, 26, 1–18. [Google Scholar] [CrossRef]
- Howlett, M. Designing Public Policies: Principles and Instruments; Routledge: Abingdon, UK, 2019. [Google Scholar]
- Woodside, K. Policy instruments and the study of public policy. Can. J. Political Sci. Rev. Can. Sci. Polit. 1986, 19, 775–794. [Google Scholar] [CrossRef]
- Howlett, M. Beyond good and evil in policy implementation: Instrument mixes, implementation styles, and second generation theories of policy instrument choice. Policy Soc. 2004, 23, 1–17. [Google Scholar] [CrossRef]
- Howlett, M. Managing the “hollow state”: Procedural policy instruments and modern governance. Can. Public Adm. 2000, 43, 412–431. [Google Scholar] [CrossRef]
- Eliadis, P.; Hill, M.M.; Howlett, M. Designing Government: From Instruments to Governance; McGill-Queen’s Press-MQUP: Montréal, QC, Canada, 2005. [Google Scholar]
- Linder, S.H.; Peters, B.G. Instruments of Government: Perceptions and Contexts. J. Public Policy 1989, 9, 35–58. [Google Scholar] [CrossRef] [Green Version]
- Goodall, C. How to Live a Low-Carbon Life: The Individual’s Guide to Tackling Climate Change; Routledge: Abingdon, UK, 2010. [Google Scholar]
- Glaeser, E.L.; Kahn, M.E. The greenness of cities: Carbon dioxide emissions and urban development. J. Urban Econ. 2010, 67, 404–418. [Google Scholar] [CrossRef] [Green Version]
- Khanna, N.; Fridley, D.; Hong, L. China’s pilot low-carbon city initiative: A comparative assessment of national goals and local plans. Sustain. Cities Soc. 2014, 12, 110–121. [Google Scholar] [CrossRef]
- Liu, W.; Qin, B. Low-carbon city initiatives in China: A review from the policy paradigm perspective. Cities 2016, 51, 131–138. [Google Scholar] [CrossRef]
- Simionescu, M.; Bilan, Y.; Gędek, S.; Streimikiene, D. The Effects of Greenhouse Gas Emissions on Cereal Production in the European Union. Sustainability 2019, 11, 3433. [Google Scholar] [CrossRef]
- Shi, J.; Guo, X.; Hu, X. Engaging Stakeholders in Urban Traffic Restriction Policy Assessment Using System Dynamics: The Case Study of Xi’an City, China. Sustainability 2019, 11, 3930. [Google Scholar] [CrossRef]
© 2019 by the authors. Licensee MDPI, Basel, Switzerland. This article is an open access article distributed under the terms and conditions of the Creative Commons Attribution (CC BY) license (http://creativecommons.org/licenses/by/4.0/).

