Article

Impact of Water Content on Energy Potential and Combustion Characteristics of Methanol and Ethanol Fuels

Faculty of Materials Science and Technology in Trnava, Institute of Integrated Safety, Slovak University of Technology in Bratislava, Jana Bottu 2781/25, 917 24 Trnava, Slovakia
*
Author to whom correspondence should be addressed.
Energies 2019, 12(18), 3491; https://doi.org/10.3390/en12183491
Submission received: 12 August 2019 / Revised: 31 August 2019 / Accepted: 2 September 2019 / Published: 10 September 2019
(This article belongs to the Special Issue Advances in Combustion of Gases, Liquid Fuels, Coal and Biomass)

Abstract

:
Methanol and ethanol are among the most important biofuels and raw materials used to produce biorenewable fuels. These fuels are used with varying water contents. Nevertheless, the exact impact of the water content of these fuels on the energy potential and combustion characteristics is still unknown. Besides that, there are two noticeable risks (environmental impact of combustion and fire risk) associated with their production, processing, and utilization. Likewise, impact of the water content of these fuels on fire risk and the impact of their combustion on the environment is also unknown. The best indicator of energy potential is the effective heat of combustion, and the best combustion characteristic and indicator of the impact of the combustion of alcohols on the environment is the carbon monoxide (CO) yield, whereas the fire risk of liquid fuels is quantified by the flash point and maximum heat release rate (mHRR). The dependency of flash point on the water content was determined via the Pensky-Martens apparatus and the dependencies of the effective heat of combustion, CO yield, and mHRR on the water content were determined via the cone calorimeter. With increased water content, the flash points of both methanol and ethanol exponentially increased and the both effective heat of combustion and mHRR almost linearly decreased. In the range of water content from 0 to 60%, the CO yield of both methanol and ethanol was practically independent of the water content.

Graphical Abstract

1. Introduction

Methanol and ethanol are the primary alcohols utilized as biofuels, biorenewable components of automotive fuels, and raw materials for the production of biorenewable components of automotive fuels. Of the bio-recoverable components of automotive fuels, methyl tert-butyl ether (IUPAC name: 2-methoxy-2-methylpropane, MTBE) is produced from methanol, and ethyl tert-butyl ether (IUPAC name: 2-ethoxy-2-methyl-propane, ETBE) is produced from ethanol. In addition, biomethanol and bioethanol are widely used in households, e.g., as stove fuels.
Both methanol and ethanol are fuels that are fully miscible with water. The unlimited miscibility with water allows for the preparation and utilization of optimal concentration solutions for each application. The best indicator of energy potential of fuels is the effective heat of combustion. The effective heat of combustion of methanol and ethanol fuels decrease with water content increase, but the exact (under real combustion conditions) impact has not been quantified still. Besides that, there are two significant risks associated with the production, processing (e.g., formation of MTBE or ETBE), transport, and utilization of methanol and ethanol. The first major risk is the environmental impact, and the second is the fire risk. Likewise, the exact impact of the water content in methanol and ethanol on the impact of their combustion on the environment and on fire risk has not been quantified.
The impact of alcohol fuel combustion on the environment is expressed by carbon monoxide (CO) yield per unit released heat. The impact of methanol and ethanol combustion on the environment has been partially explored in scientific papers by Cooney et al., Zhang et al., Liang et al., and Melo et al. [1,2,3,4]. The fire risk of liquid fuels is determined by their flash point, the heat released, and the CO yield per mass loss. Nevertheless, no scientific paper has examined the complex components of the fire hazard of methanol and ethanol. Selected components related to the fire risk of methanol and ethanol and their mixtures were partially examined by Liaw et al., Vidal et al., and Guo et al. [5,6,7]. The methanol and ethanol production process is described, e.g., by Kurambhatti et al. and Wang et al. [8,9].
The results from scientific papers of Simonelt et al. and Luche et al. [10,11] show that the combustion of most fuels produce a large quantity of combustion products. To assess the toxicity of combustion products, it is not technically or economically possible to measure and assess all of the components of the combustion products. However, the results of scientific papers of Ometto et al. and Gann et al. [12,13] and IEC 60695-7:2010, IEC 60695-7-3:2011, and C/VM2:2014 technical standards [14,15,16] show that during the combustion of methanol and ethanol (like with most carbon, hydrogen, and oxygen compounds), only carbon monoxide (CO) is important from the toxicological point of view. Other compounds are formed in too small a quantity and/or their toxicity is too low to significantly affect the resultant toxicity of the combustion products. Additionally, the results from scientific papers of Karlsson and Quintiere [17] and Maricq [18] show that only a negligible amount of soot is produced during the combustion of methanol and ethanol fuels. Therefore, the toxicity of methanol and ethanol combustion products is virtually determined by the amount of CO released.
The impact of water content of methanol and ethanol fuels on their combustion characteristics is very important data for set the parameters of the power equipment (e.g., boilers or stoves) and for fire risk assessment of these fuels. Nevertheless, there is still missing scientific study clarifies impact of water content of methanol and ethanol fuels on their combustion characteristics. Therefore, this study targets to clarify this issue.
The aim of the presented scientific study is to quantify the impact of the water content of methanol and ethanol fuels on the impact of their energy potential, combustion characteristics, the impact of their combustion on the environment, and fire risk.

2. Materials and Methods

Samples of methanol and ethanol fuels with a purity of 99.80% by volume, supplied by Centralchem Slovakia, S.R.O., Bratislava, Slovakia, were used for the research. The raw material for methanol production was wood and the raw material for ethanol production was corn. The samples were examined in both their pure and diluted forms. They were diluted using distilled water to provide water contents of 10, 20, 30, 40, 50, 60, 70, 80, and 90% by volume (pure samples containing 99.80% of the main components are referred to as samples with a water content of 0%).
The samples containing 0, 10, 20, 30, 40, 50, 60, 70, 80, and 90% of water were used to examine the effect of water content on the flash point. To examine the impact of water content on the effective heat of combustion (EHC), heat release rate (HRR), maximum heat release rate (mHRR), maximum average rate of heat emission (MARHE), and CO yield (per unit mass loss and unit released heat), samples containing 0, 20, 40, 60, and 80% of water were used.
The impact of water content on the flash point of methanol and ethanol was determined using the Pensky-Martens apparatus (NPM 131; Normalab, S.A., Naninne, Belgium) according to ISO 2719:2016 [19]. The test procedure complied with ISO 2719:2016 [19] (Test Procedure A) with one modification. The modification of the test procedure consisted of cooling the sample and the test flask of the test apparatus prior to testing. Prior to testing the methanol and ethanol solutions with water contents of 0 to 70%, the samples and the test flask were cooled to −15 °C. Prior to testing the methanol and ethanol solutions with water contents of 80 and 90%, the samples and the test flask were cooled to 0 °C. The Pensky-Martens apparatus has been calibrated according to ISO 2719:2016 [19].
The impact of the water content on the EHC, HRR, mHRR, MRHE, and CO yield (per unit mass loss and unit released heat) was determined using a cone calorimeter (Dual Cone Calorimeter; Fire Testing Technology, Ltd., East Grinstead, UK) according to ISO 5660-1:2015 [20]. The test procedure complied with ISO 5660-1:2015 [20] with one modification. The modification was the replacement of the solid sample holder with a liquid sample container consisting of a steel circular vessel with an internal diameter of 106 mm and a height of 20 mm (the wall thickness of the container was 2 mm). The vessel diameter was chosen so that the surface area of the liquid fuel would correspond to the surface area of the solid fuel required by ISO 5660-1:2015 [20]. The test procedure and the modification were described in detail in the scientific paper of Martinka et al. [21]. During the test, the samples, in compliance with the requirements of ISO 5660-1:2015 [20], were exposed to a heat flux of 10 kw/m2 from a cone heater (cone heater is a part of Dual Cone Calorimeter; Fire Testing Technology, Ltd., East Grinstead, UK). The sample volume used for each cone calorimeter test was 85 ± 5 mL. The combustion efficiency was calculated from the data measured using the cone calorimeter by using the method according to scientific papers of Ward et al. and Ferek et al. [22,23].
The cone calorimeter has been calibrated in accordance with ISO 5660-1:2015 [20].
The HRR describes amount of heat released in one second from one square meter of the sample. Unit of the HRR is kW/m2. This unit could also be expressed as kJ/(s × m2) because kW = kJ/s. The cone calorimeter measure heat release rate for samples with 0.0088 m2 surface and then recalculate it to 1 m2 sample surface. The mHRR is defined as the maximum value (peak) of the heat release rate recorded during the test. Another parameter is MARHE. This parameter can be defined as maximum average rate of heat release rate. Units of the mHRR and MARHE are the same as unit of the HRR. The CO yield per mass loss is defined as amount of CO (g) released per 1 kg mass loss of fuel (this parameter express how many CO is released from 1 kg burned fuel). The unit of the CO yield per mass loss unit is therefore g/kg. Similar parameter is the CO yield per released heat. This parameter express amount of CO (g) released per 1 MJ heat released from burned fuel. The unit of the CO yield per released heat is therefore g/MJ.

3. Results and Discussion

The dependence of the flash points of the alcohol–water solutions examined on the water content is shown in Figure 1. Both methanol and ethanol exhibited an exponential flash point dependence on water content. The flash point of the undiluted methanol was 13 °C and the undiluted ethanol had a flash point of 14 °C. In contrast, the flash points of methanol and ethanol with a water content of 90% were 55 °C and 50 °C, respectively. The data shows that the flash points of the alcohols examined exhibited noticeable increases with increasing water content. However, even a water content of 90% cannot be considered as sufficient protection against ignition, and even with such a degree of dilution with water, the examined fuels act as flammable liquids (as evidenced by the fact that their flash points can be determined). Therefore, during their production, processing, and utilization, methanol and ethanol are to be considered as flammable liquids irrespective of their degree of dilution with water.
The impact of the water content on the heat release rate is illustrated in Figure 2. It shows a noticeable decrease in the heat release rate with increasing water content. During combustion, the undiluted alcohols began to boil (under cone calorimeter test conditions). The boiling of undiluted methanol began at approximately 150 s and undiluted ethanol at approximately 200 s (Figure 2). The boiling in Figure 2 shows a rapid increase in the heat release rate to approximately 60 kW/m2 for methanol or to 150 kW/m2 for ethanol. For alcohols with a water content of 20%, boiling was only observed for a relatively short period of time (Figure 2). At a water content equal to or above 40%, boiling was not observed. This was due to the lower flame temperature and the resultant decrease in the reverse heat radiation from the flame to the surface of the alcohol–water solution and the higher heat capacity and boiling point of water compared to the alcohols. The reason for the lower flame temperature was that in the combustion zone, apart from alcohol (fuel), water was also evaporated from the alcohol–water solution. As a result, less alcohol was evaporated into the combustion zone (the heat released from the combustion zone reduced), and the heat released from the combustion zone was consumed to heat the combustion products and to heat the evaporated water.
The comparison of the heat release rate of the examined fuels with other scientific papers is rather complicated, as this is the first scientific study to fully examine the impact of water content on heat release rate and the impact of methanol and ethanol combustion on the environment. However, there are scientific papers that have thoroughly examined the heat release rate of other flammable liquid fuels (e.g., [21] examined the fire risk of automotive gasoline). The comparison of Figure 2 with the results of the scientific paper of Martinka et al. [21] shows that methanol and ethanol had a lower maximum heat release rate than automotive gasoline, but the course of the heat release rate was similar. The comparison of the heat release rate for solid biorenewable sources (lignocellulosic fuels) published in scientific papers of Janssens, Maciulaitis et al., Akaki et al., and Carosio et al. [24,25,26,27] demonstrates that undiluted methanol and ethanol exhibit higher heat release rates and more even heat release than lignocellulosic fuels. Conversely, methanol with a water content equal to or higher than 40% and ethanol with a water content equal to or higher than 60% showed a lower heat release rate than solid biorenewable fuels according to Janssens, Maciulaitis et al., Akaki et al., and Carosio et al. [24,25,26,27].
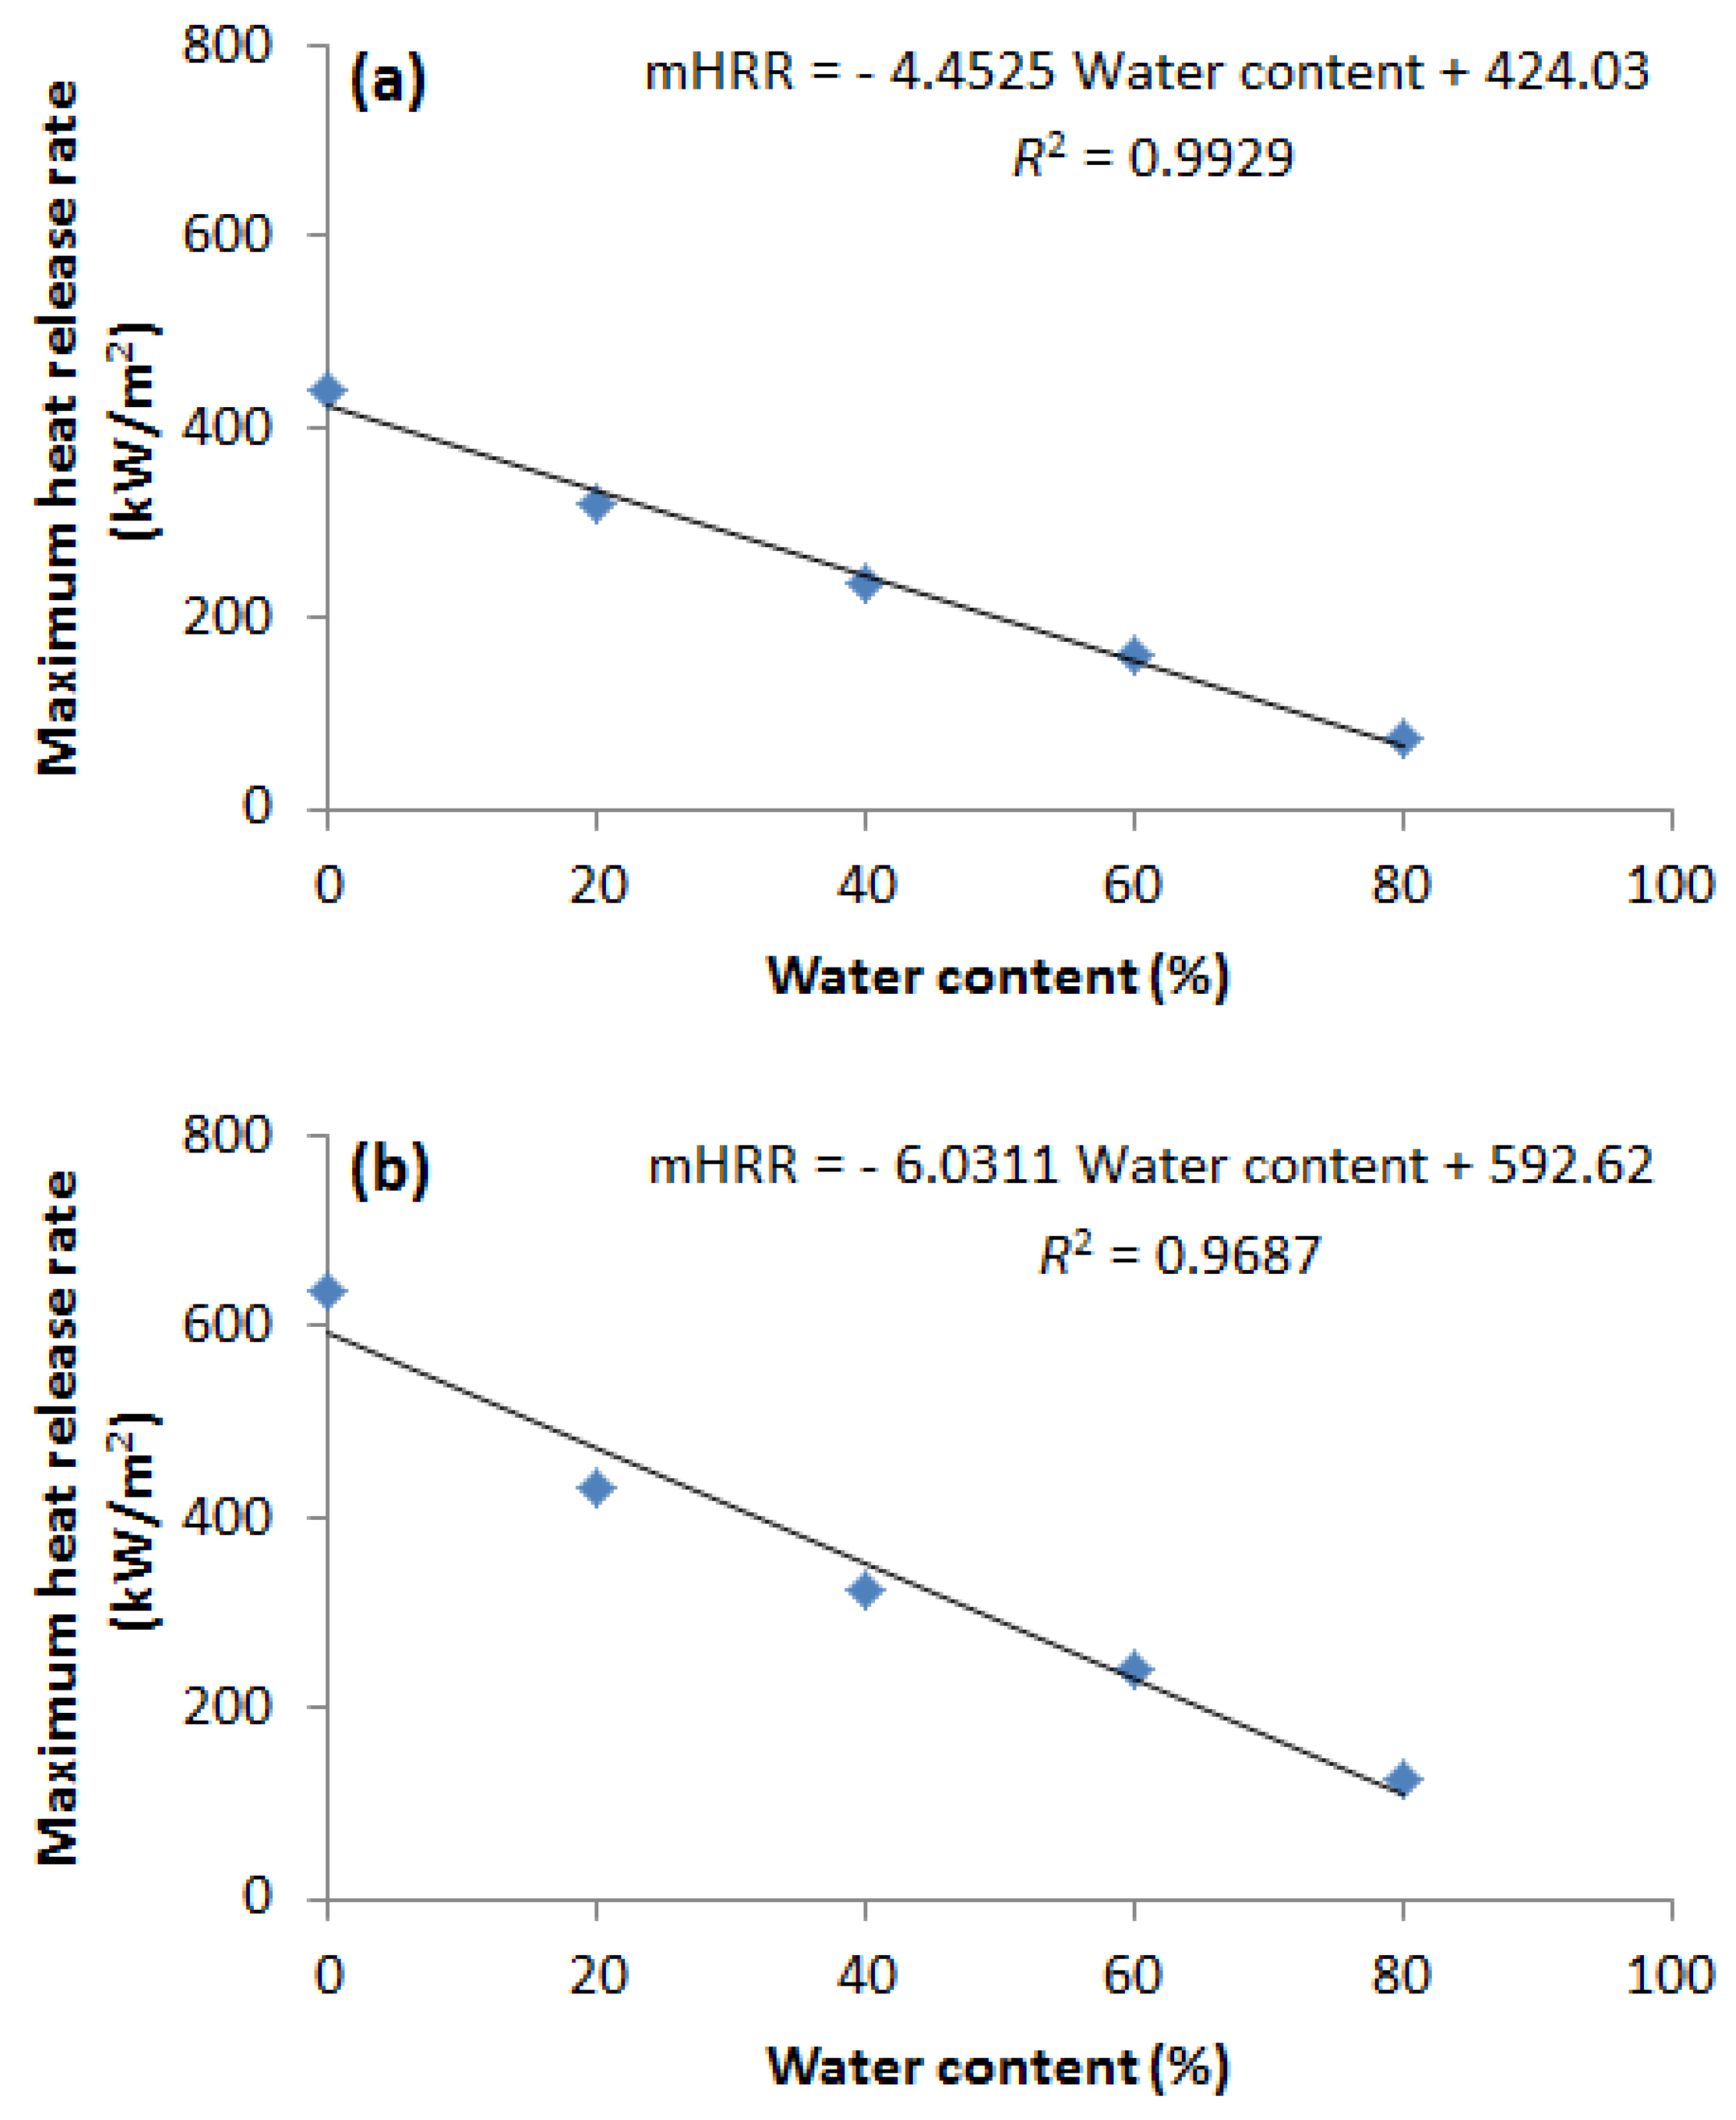
The primary derived heat release rate parameters are the mHRR shown in Figure 3, the MARHE shown in Figure 4, and the EHC shown in Figure 5. The mHRR is the maximum heat release rate (local maximum) recorded during the test. The MARHE was calculated according to Equation (1),
MARHE = max t i t HRR ( t ) + HRR ( t 1 ) 2 · t Δ t t i
where MARHE is maximum average rate of heat emission (kW/m2), HRR(t) is heat release rate at time t (kW/m2), HRR(t−1) is heat release rate at time t−1 (kW/m2), t is time for which average rate of heat emission is calculated (s), ti is time to ignition (s) and Δt is time increment between successive measured values between HRR (s) [28].
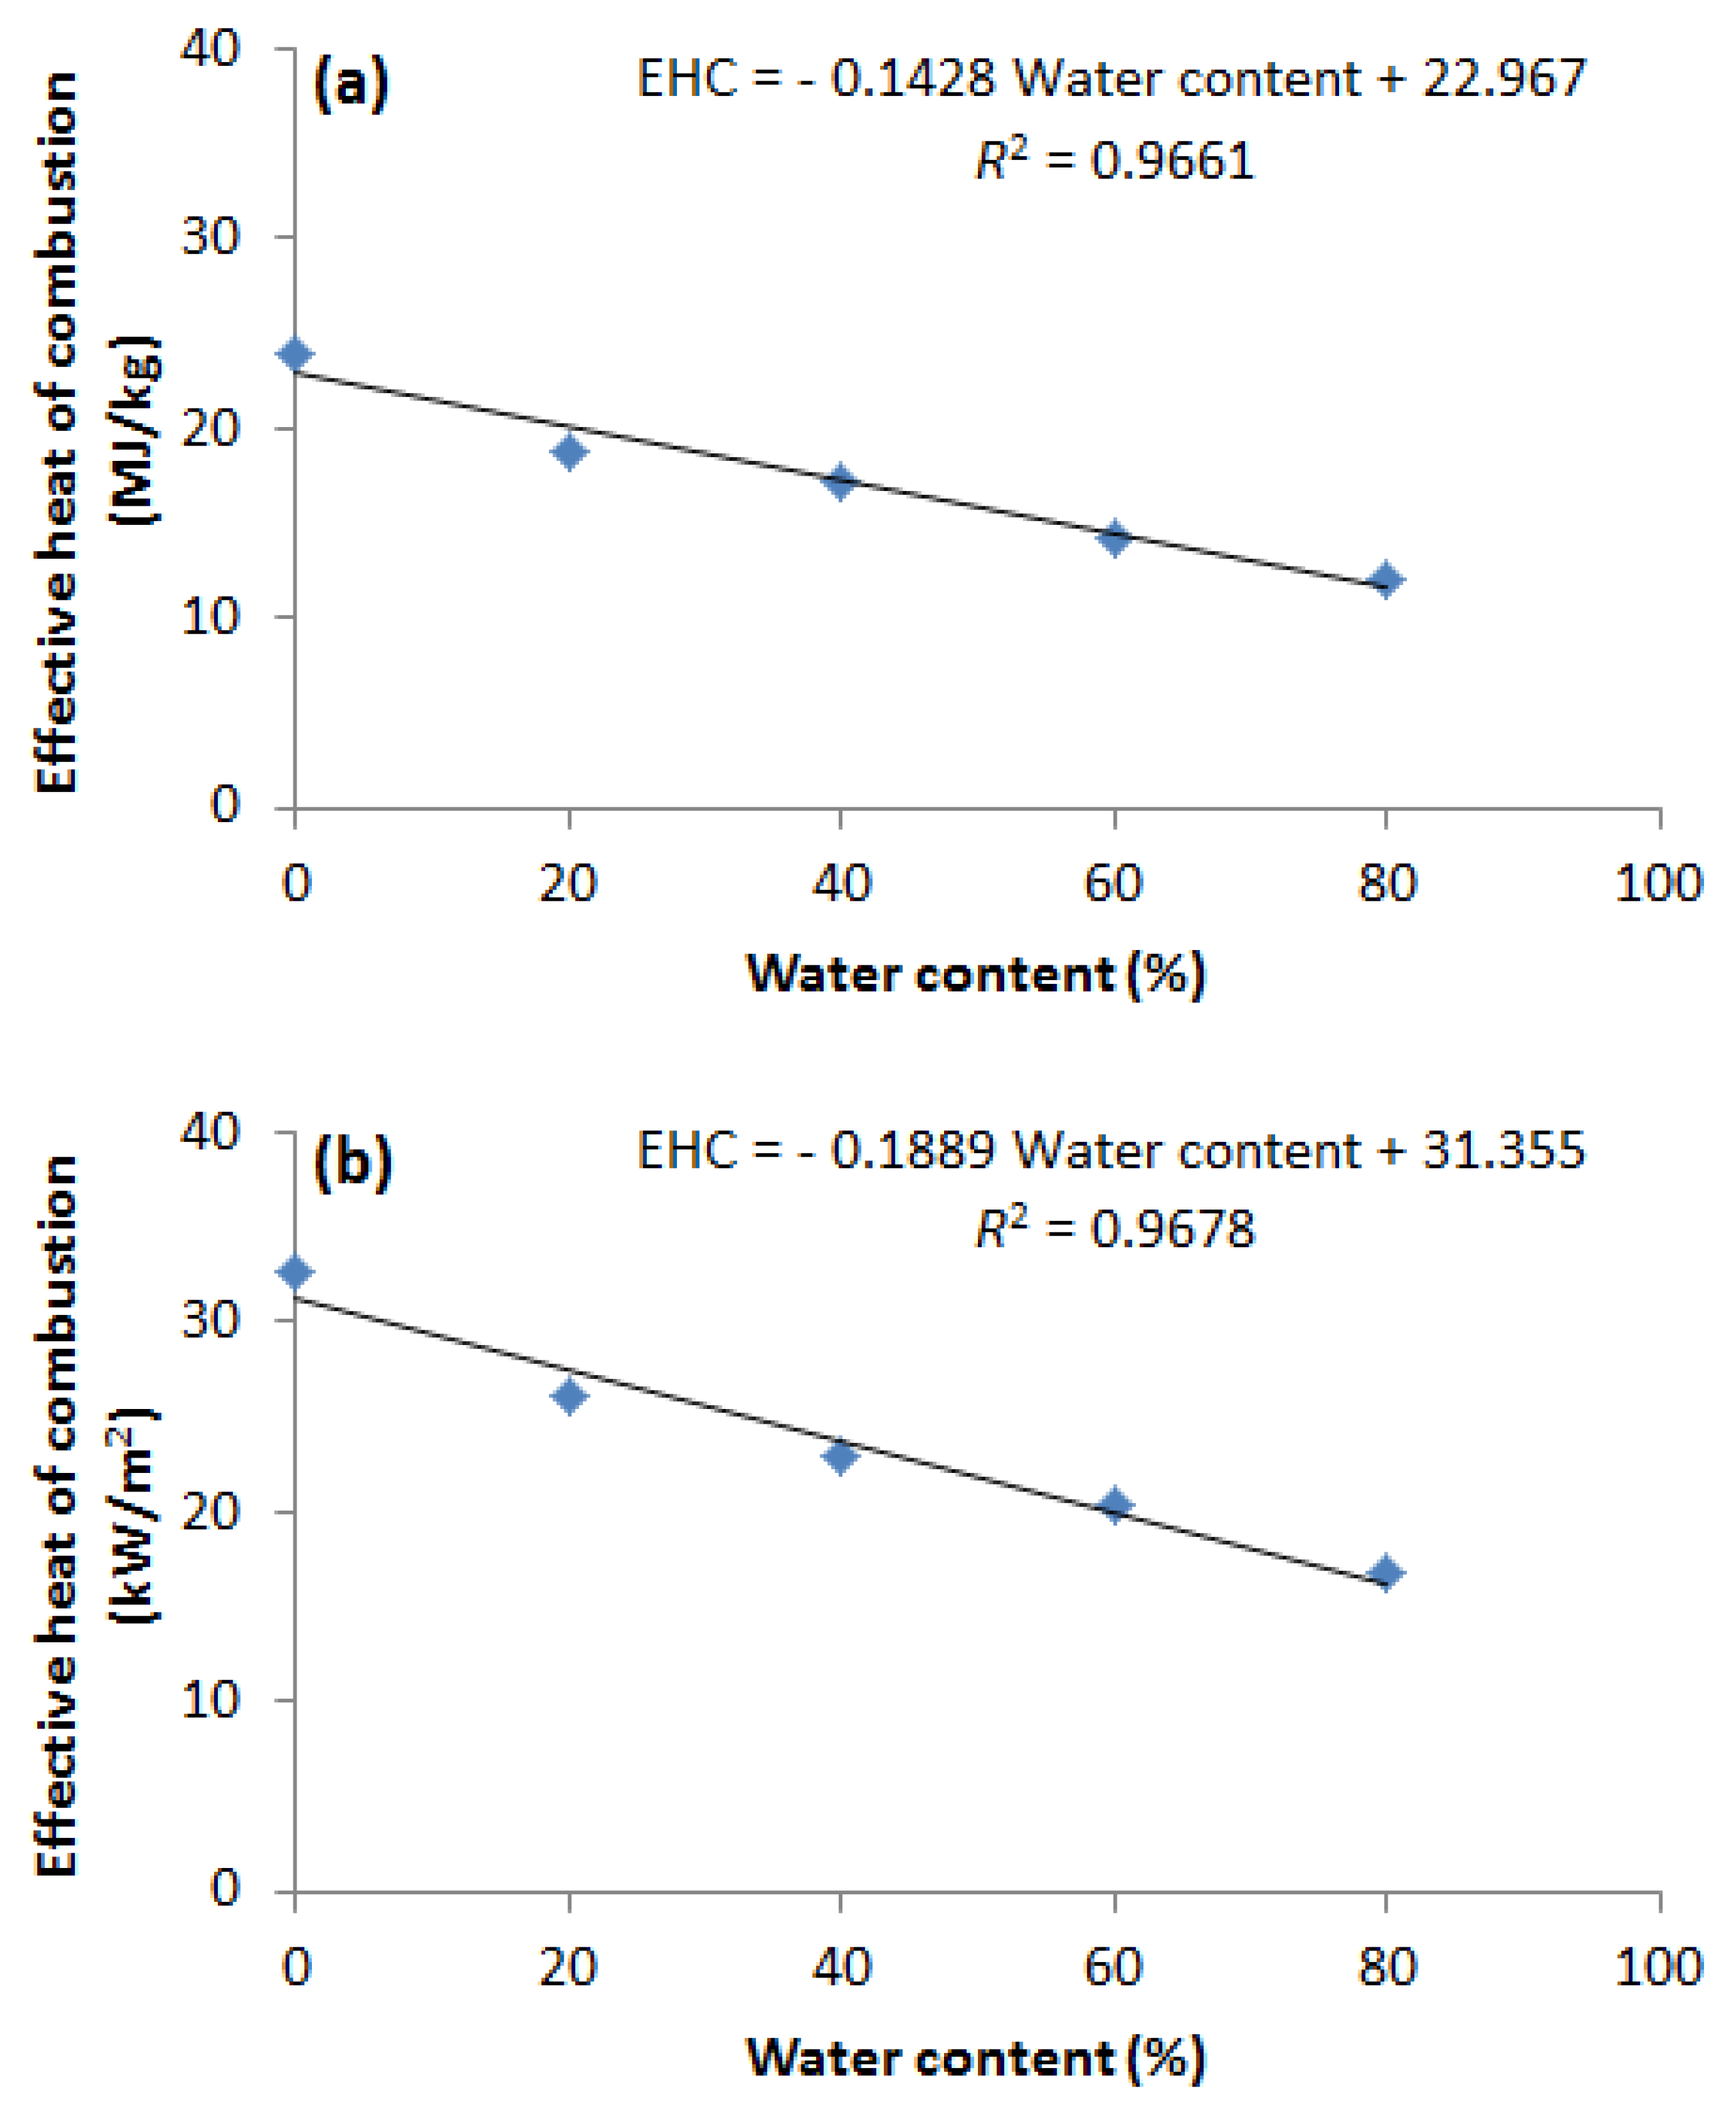
The EHC is the amount of heat released per unit mass loss fuel under the conditions of a cone calorimeter test. The mHRR (Figure 3), MARHE (Figure 4), and EHC (Figure 5) linearly decreased with increasing water content.
A comparison of the mHRR (Figure 3) and MARHE (Figure 4) with the data in [24,25,26,27,29,30,31,32] shows that the undiluted methanol and ethanol both exhibit a higher mHRR and MARHE than most natural polymers (fuels), but are at the same time lower than most synthetic polymers and flammable liquids. This comparison further demonstrates that methanol with a water content of 40% and ethanol with a water content of 60% both exhibit a lower mHRR and MARHE than most substances. For comparison purposes, the combustion and fire characteristics of common alcohols and biorenewable fuels can be found in [33,34,35,36,37,38,39,40].
The EHC values (Figure 5) of undiluted methanol (23.9 MJ/kg) and ethanol (32.7 MJ/kg) were approximately equal to the maximum theoretical gross calorific values of methanol (22.7 MJ/kg) and ethanol (29.7 MJ/kg). Additionally, they were approximately 20% higher than the maximum theoretical net calorific values of methanol (20.1 MJ/kg) and ethanol (27 MJ/kg) calculated from the standard enthalpy of formation and the vaporization enthalpy of water published in the scientific paper by Haynes [41]. The reason for the slight difference between the gross and net calorific values and the EHC of methanol and ethanol was due to the use of different principles for their measurement. The standard enthalpy of formation needed to calculate the gross and net calorific value is measured in an oxygen calorimeter according to ISO 1716:2018 [42], which measures the heat released based on the increase in water temperature in a calorimetric vessel. The cone calorimeter measures the EHC based on the oxygen consumption (to which 13.1 ± 0.7 kJ of heat per 1 g of consumed oxygen is released during the combustion of most organic substances [43]. In comparison, from the results in [44,45], the net calorific value of most wooden fuels (wood is considered to be a reference material to biofuels comparison) ranges from 17 to 18 MJ/kg. As shown in Figure 5, methanol shows similar EHC values (17.25 MJ/kg) at a water content of 40%, and ethanol also shows similar values (20.4 MJ/kg) at a water content of 60%. This comparison illustrates that from the point of view of EHC, methanol and ethanol show a comparable energy potential as wooden fuels at water contents of 40% for methanol and 60% for ethanol.
Fuel and water were not evaporated from the solution into the combustion zone in the proportions corresponding to their ratio in the solution. This was due to the different boiling temperatures and vaporization enthalpies of alcohols and water. The fuel–water ratio in the combustion zone can be estimated by using the fact that no heat is released from the water evaporated from the solution into the combustion zone. Therefore, the ratio of the EHC for a solution with certain water content to the EHC of pure (undiluted) fuel approximately corresponds to the average fuel–water ratio in the combustion zone. The average fuel–water ratios in the combustion zone for solutions with the water contents examined are shown in Figure 6. Figure 6 shows that the average methanol-to-water ratio, as well as the ethanol-to-water ratio in the combustion zone, decreased almost linearly with increasing water content of the solution. At a water content of 80%, the average methanol-to-water ratio in the combustion zone was approximately 0.50, and the average ethanol-to-water ratio was approximately 0.51 (Figure 6).
In addition to the fuel–water ratio (evaporated from the solution) in the combustion zone, another important combustion characteristic is the minimum fuel content in the solution, which is still combustible under the given conditions (critical alcohol content for spontaneous flame extinction). The conditions are represented by the ambient temperature or heat flux exposed to the surface of the combustible liquid. Determination of the critical fuel ratio of the solution (for spontaneous flame extinction) is based on the fact that the EHC of alcohol linearly decreases as water content increases (Figure 5). Thus, if the original mass or volume of the solution and the mass or volume loss of the solution during the spontaneous flame extinction (Table 1) are known, the mass of fuel evaporated from solution can be calculated according to Equation (2) and the mass of water evaporated from the solution can be calculated according to Equation (3),
FE = MLS × (EHC/EPF)
MEW = (MLS/100) × (1 − EHC/EPF)
where FE is the mass of fuel evaporated (g), MLS is the mass loss of the solution of fuel and water (g), EHC is the effective heat of combustion of a solution of fuel and water (kJ/kg), EPF is the effective heat of combustion of pure fuel (kJ/kg), and MEW is the mass of evaporated water (g).
The mass of fuel in the solution during spontaneous flame extinction is then calculated as the difference between the fuel in solution before the start of the test and the mass loss of fuel. The critical fuel concentration in the solution is calculated from the mass or volume of fuel in the solution and the volume or mass of the solution (in the case of spontaneous flame extinction). The critical concentrations (mass ratios of fuel to water) for the fuels examined in a water solution, for which spontaneous flame extinction occurs, are illustrated in Table 2. The critical fuel content for a solution with an alcohol content of more than 40% was not determined due the fact that, during the combustion of the 60% and 80% alcohol solutions, only a negligible residue remained (water evaporated into the combustion zone together with the alcohol). The data in Table 2 shows that the critical methanol content (in solution with water) for spontaneous flame extinction is about 15.6 to 17.3%, and the critical ethanol content is about 11 to 14.2%. This conclusion, however, only applies for these experimental conditions. For practical applications, it is necessary to refer to Figure 1, according to which it is possible to determine the flash point of methanol and ethanol even at a water content of 90%. The reason for the difference between the critical water content for spontaneous flame extinction determined using a cone calorimeter according to ISO 5660-1:2015 [20] and the flash point determined using the method according to ISO 2719:2016 [19]) is the different procedures used for the determination of these parameters.
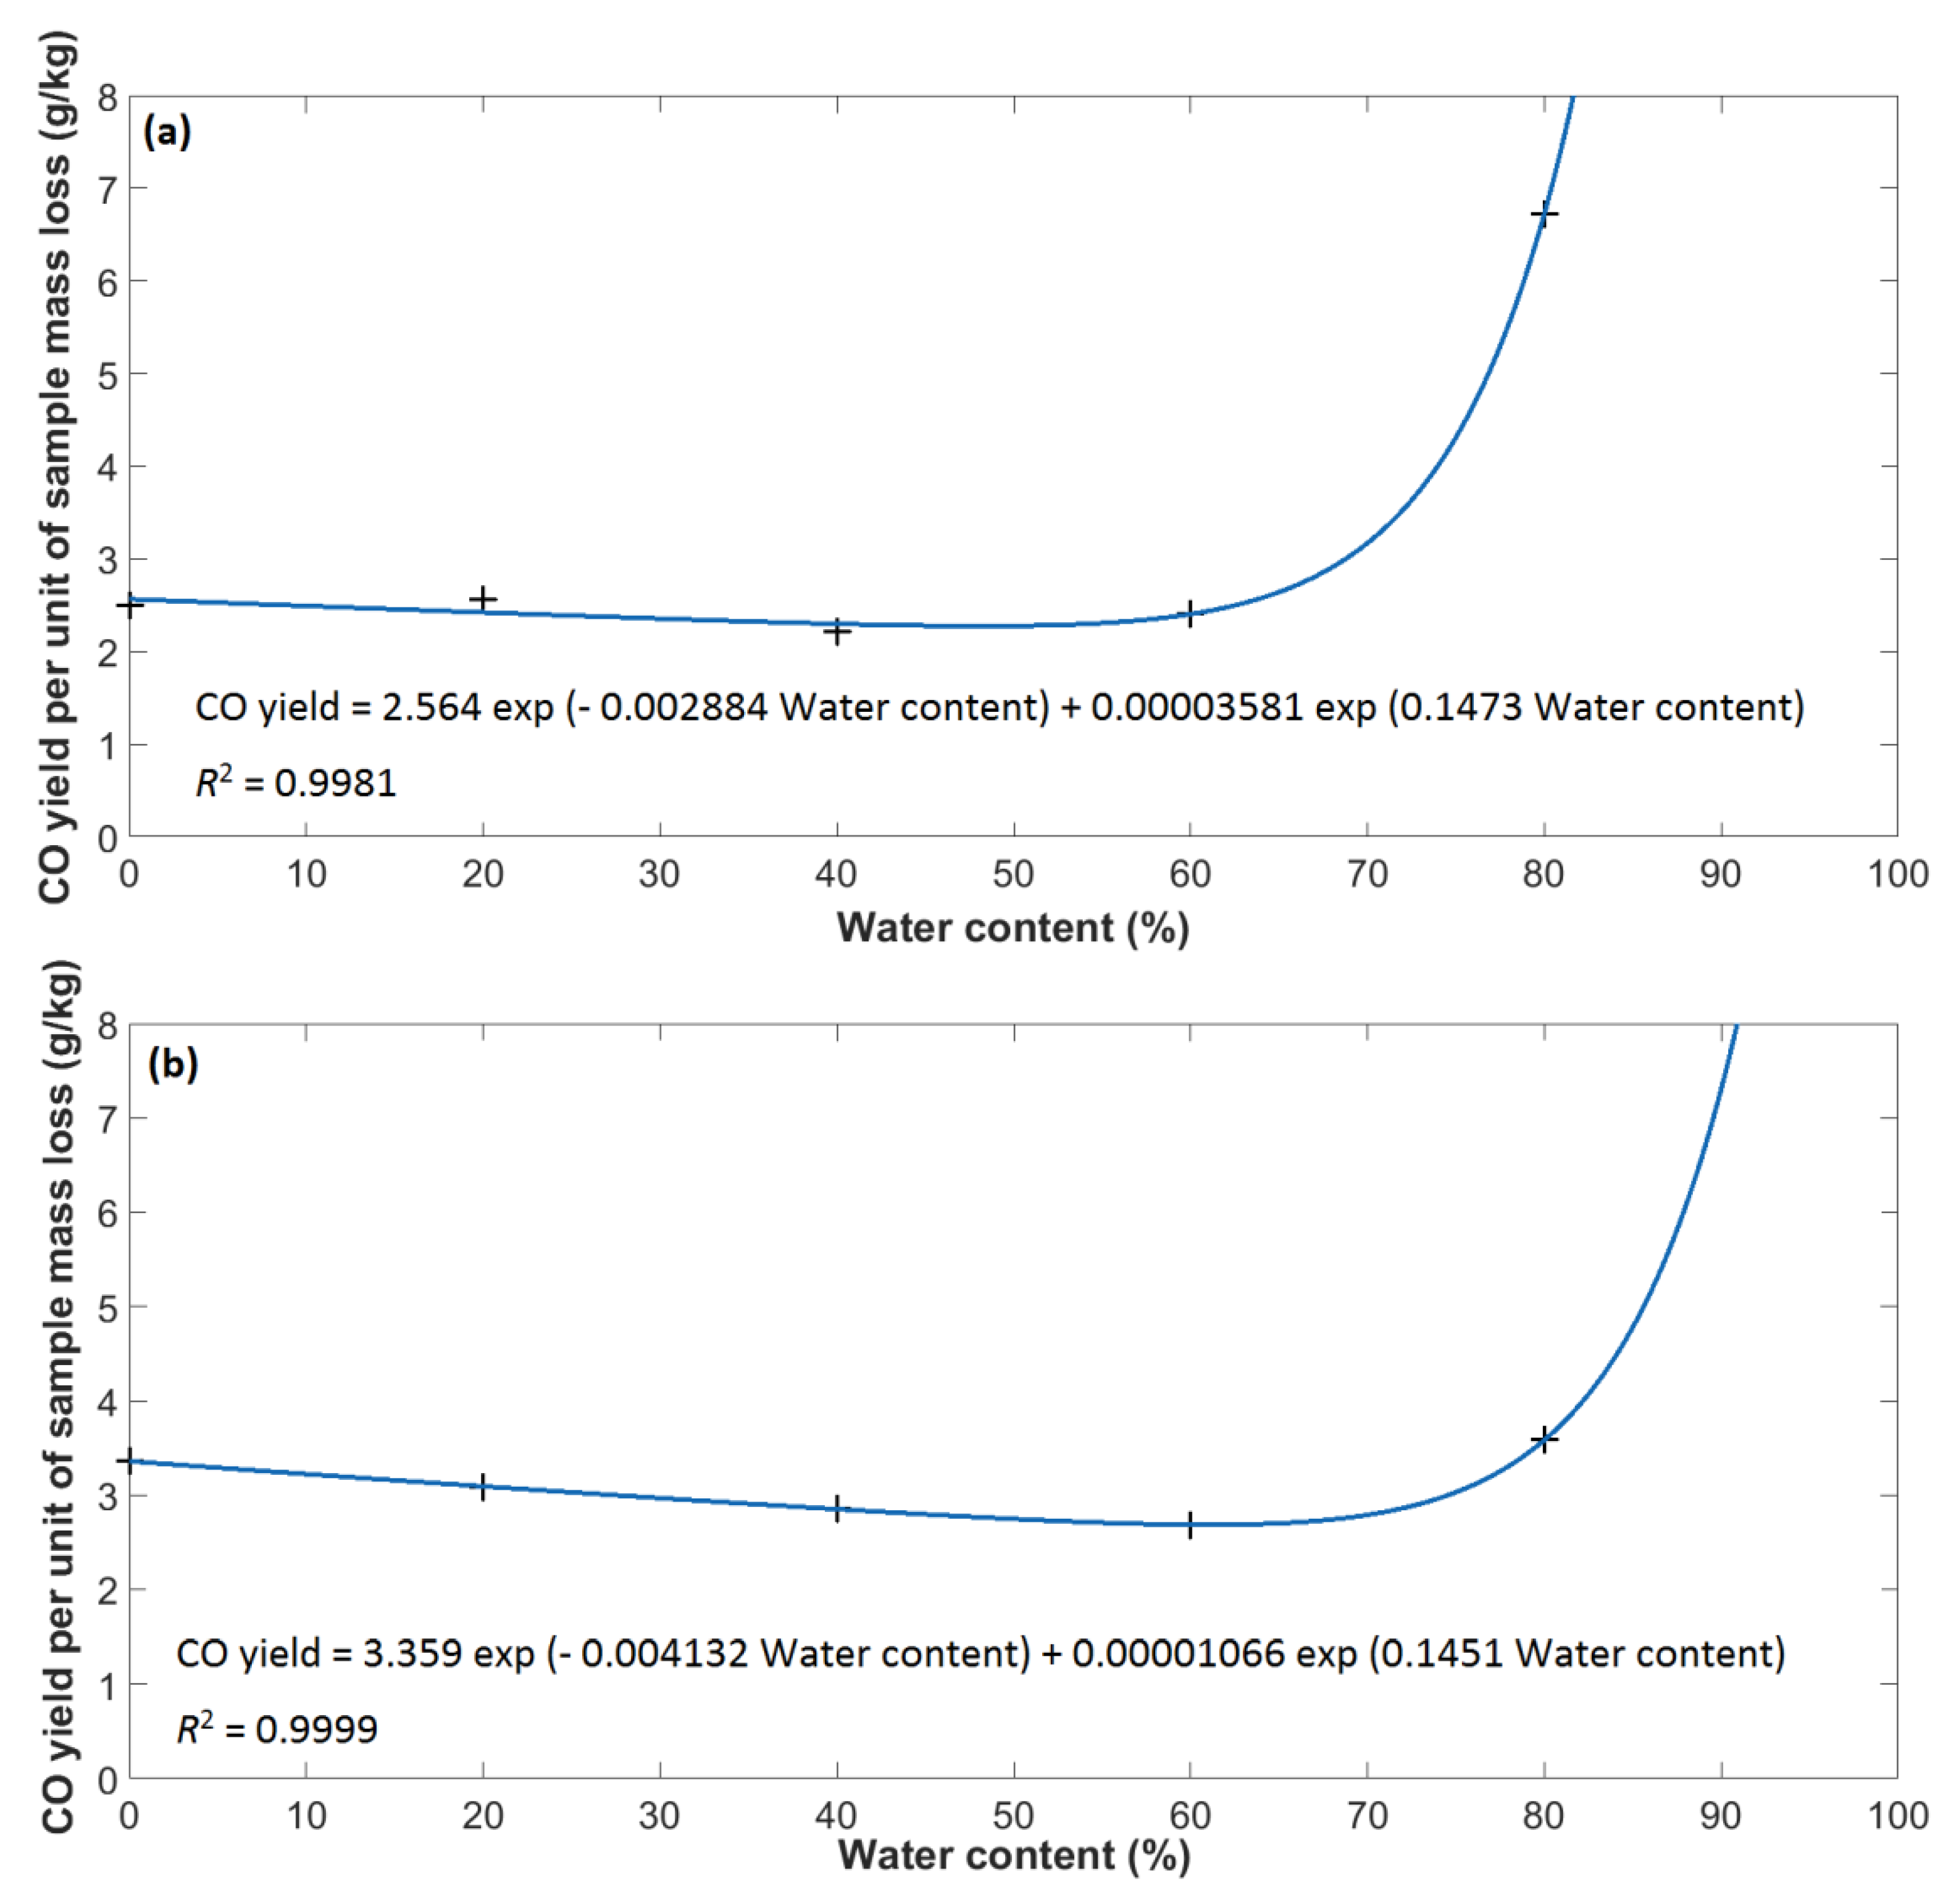
The dependency of the CO yields on the water content in methanol and ethanol is illustrated by Figure 7 (the CO yields per mass loss unit) and Figure 8 (the CO yields per released heat unit). Figure 7 shows that the water content in methanol (in the interval from 0 to 60%) have virtually no effect on the CO yield (per mass loss unit), while the CO yield (per mass loss unit) of ethanol with increasing water content (in the interval of 0 to 60%) decreases. The decrease in the CO yield from ethanol can be explained by the fact that, besides ethanol, water also contributes to the mass loss from the sample solution (input data for the CO yield calculation), and no CO is released in the combustion zone from the water evaporated from the solution. However, this effect did not appear in the decrease of the CO yield (per mass loss unit) from methanol. This is probably due to the lower boiling point of methanol 64.7 °C, according to [41], compared to ethanol 78.4 °C, according to [41], and the faster evaporation of methanol from the water solution. As a result of this faster evaporation, methanol burns in the combustion zone at a higher mass ratio of alcohol to water than ethanol (this conclusion is also confirmed by Figure 6). The result is the independence of the CO yield (per unit of sample mass loss) from methanol to the water content (in the interval 0 to 60%). For both methanol and ethanol with a water content of 80%, a sharp rise in the CO yield (per mass loss) was observed (Figure 7).
The CO yield (per released heat) increases exponentially with increasing water content for both methanol and ethanol (Figure 8). This trend clearly demonstrates the decreased efficiency of combustion of the examined fuels and hence an increasing impact of combustion on the environment with increasing water content. Both fuels showed a maximum CO yield (per both mass loss and released heat) at a water content of 80% (Figure 7 and Figure 8). At the stated water content of the solution, the ratio of fuel to water (evaporated from solution) in the combustion zone is relatively low (Figure 6). A high water level in the combustion zone is manifested through a decrease in flame temperature, through the disruption of the proportion ratio (fuel—oxidant in the combustion zone), which ultimately leads to a reduction in combustion efficiency and a high increase in the CO yields (Figure 7 and Figure 8).
The comparison of the CO yields (per mass loss and released heat) of the examined fuels (Figure 7 and Figure 8) with the CO yields from natural and synthetic polymers (fuels) published in scientific papers by Karlsson and Quintiere [17], DiNenno, and Ozgen et al. [46,47] shows that both methanol and ethanol exhibit a substantially lower CO yield than most natural and synthetic polymers and fuels. Moreover, scientific study by Gardiner [48] demonstrates that the intermediates of burning organic compounds consisting of carbon, hydrogen, and oxygen are oxidized to CO substantially more readily than CO to carbon dioxide (CO2). Additionally, methanol and ethanol generally only produce a negligible amount of soot. CO is therefore a reliable indicator of the combustion efficiency of methanol and ethanol and the impact of their combustion on the environment. At water contents of 0 to 60%, the impact of the combustion of methanol and ethanol on the environment is negligible due to low CO yields (Figure 7 and Figure 8). At a water content of 80%, the impact of the combustion of methanol and ethanol on the environment, given the higher CO yields (Figure 7 and Figure 8), is more pronounced, but still relatively low in comparison to other substances. Likewise, the contribution of methanol and ethanol fires to the toxicity of combustion products is low due to the low CO yields (Figure 7 and Figure 8) in comparison to other substances.
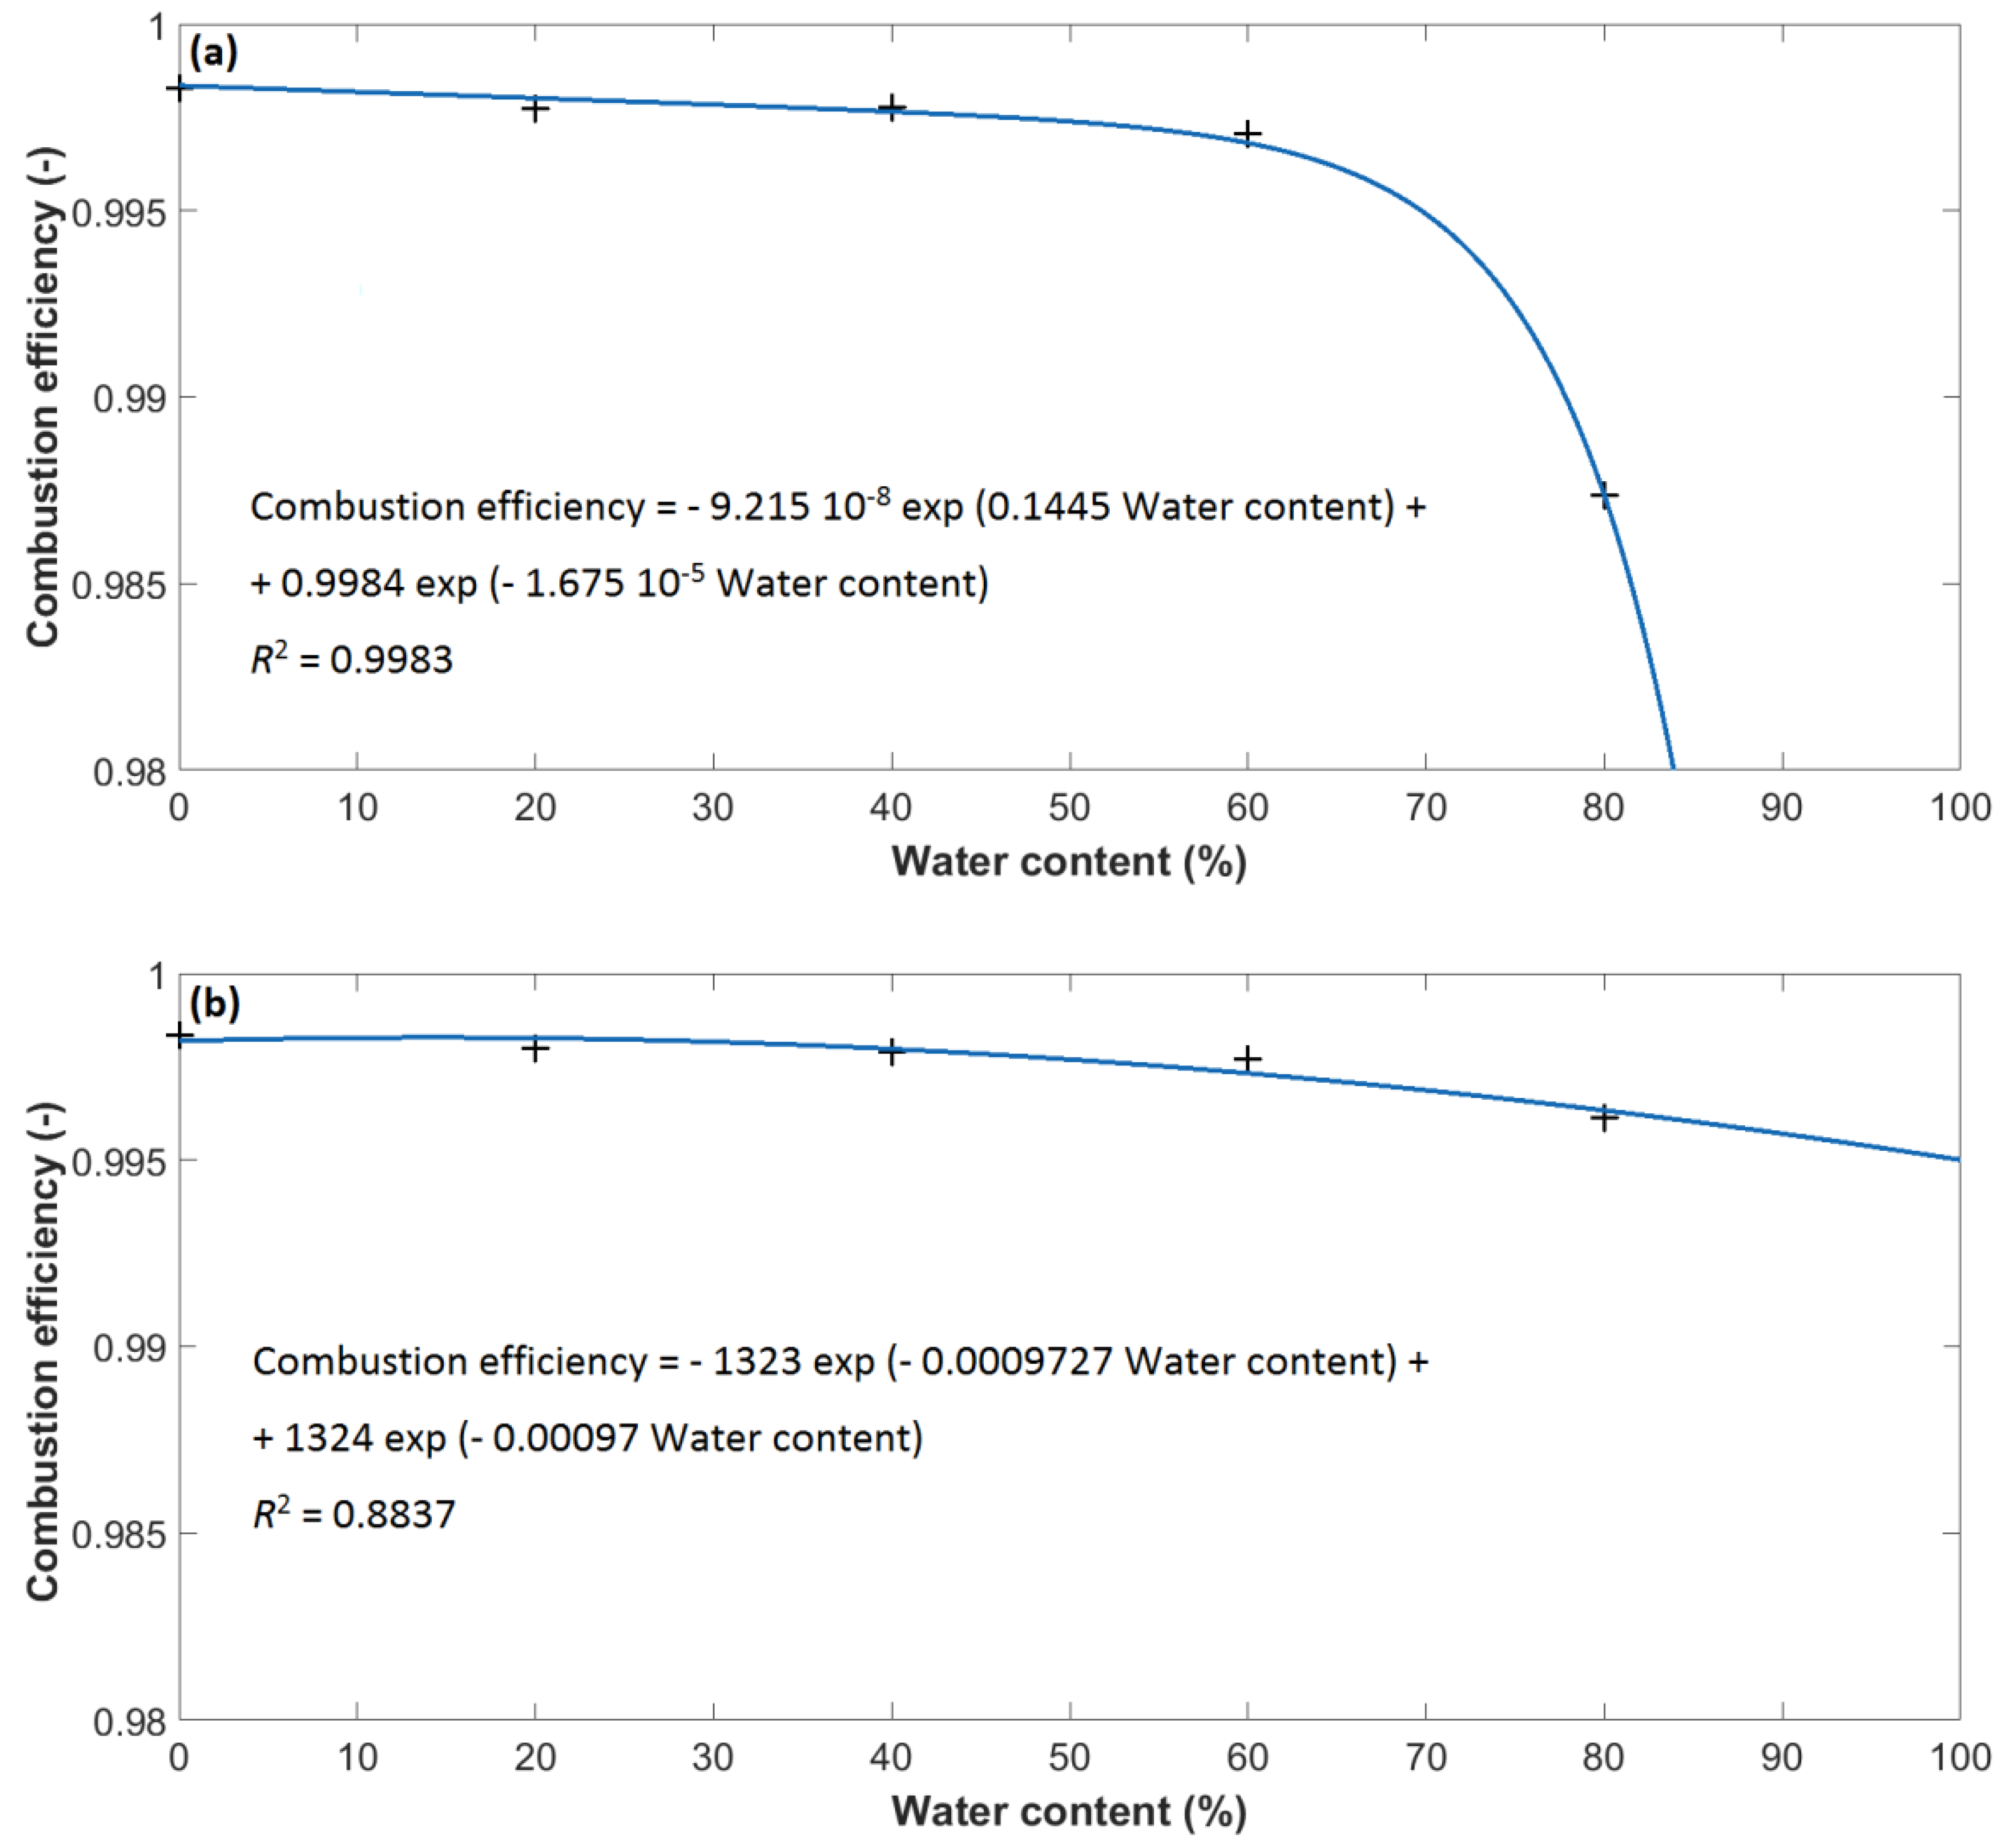
In addition to CO yields, combustion efficiency is also a reliable combustion characteristic (with the decreasing effectiveness of combustion, the amount of toxic combustion products increases, and more of the substance must burn to obtain the same amount of heat). The impact of water on the combustion efficiency of methanol and ethanol is shown in Figure 9. The combustion efficiency data (Figure 9) roughly corresponds to the inverse data in Figure 7 and Figure 8 and thus confirms the maximum impact of combustion on the environment at a water content of methanol and ethanol of 80%.

4. Conclusions

This study attempts to quantify the impact of the water content of methanol and ethanol fuels on their energy potential, combustion characteristics, and fire risk. The results of the study may be summarized in the following conclusions.
  • With increasing water content, the flash point of both methanol and ethanol considerably increased. Both methanol and ethanol show an exponential dependence of flash point on water content. Despite the noticeable increase in the flash point (in an undiluted state, methanol and ethanol have flash points of 13 and 14 °C, while for a water content of 90%, the flash point rises to 55 and 50 °C, respectively), the examined alcohols behave as flammable liquids even at a water content of 90%.
  • The EHC, mHRR, and MARHE of methanol and ethanol decrease linearly with increasing water content.
  • The water content of methanol (in the range 0 to 60%) has no practical effect on the CO yield (per mass loss), while the CO yield (per mass loss) of ethanol with decreasing water content (in the range 0 to 60%) slightly decreases. The CO yield (per released heat) of both methanol and ethanol increases with increasing water content. The maximum CO yield (per both mass loss and released heat) of both methanol and ethanol was found to be at a water content of 80%. As the combustion of methanol and ethanol only produces a negligible amount soot, and from a toxicological point of view, CO is the most important combustion product, the impact of the combustion of methanol and ethanol on the environment is determined only the CO yield (mainly per released heat). Minimizing the impact of methanol and ethanol combustion on the environment can thus be achieved by minimizing the water content.
  • The ratio of methanol to water (evaporated from the solution into the combustion zone) and the ratio of ethanol to water (evaporated from the solution into the combustion zone) both decrease linearly with increasing water content of the solution.
  • A methanol solution with water exposed to a heat flux of 10 kw/m2 stops burning when the methanol content decreases to 15.6–17.3%. A solution of ethanol with water exposed to the same heat flux stops burning when the ethanol content decreases to approximately 11–14.2 %.
Based on these conclusions, it is possible to state that increase of the water content of the examined fuels has a significant effect on the effective heat of combustion decrease and a moderate effect on combustion efficiency decrease. Based on these conclusions, it is also possible to state that the water content of the examined alcohols has an adverse effect on the environmental impact and fire risk. While most components of fire risk (flash point and released heat) decrease with increasing water content, the environmental impact of combustion (CO yield to released heat) increases as the water content increases.

Author Contributions

Conceptualization, J.M.; Methodology, J.M., I.W., and P.R.; Investigation, P.R. and I.W.; Formal analysis, J.M.; Resources, J.M.; Visualization, J.M.; Writing—original draft, J.M.

Funding

This work was supported by the Slovak Research and Development Agency under the contract No. APVV-16-0223.

Conflicts of Interest

The authors declare no conflict of interest.

Abbreviations

EPFEffective heat of combustion of pure fuel (kJ/kg)
EHCEffective heat of combustion (MJ/kg)
ETBEEthyl tert-butyl ether (-)
FE Mass of fuel evaporated (g)
HRRHeat release rate (kW/m2)
IUPACInternational Union of Pure and Applied Chemistry (-)
MARHEMaximum average rate of heat emission (kW/m2)
MEW Mass of evaporated water (g)
mHRRMaximum heat release rate (kW/m2)
MLS Mass loss of the solution of fuel and water (g)
MTBEMethyl tert-butyl ether (-)

References

  1. Cooney, C.P.; Worm, J.J.; Naber, J.D. Combustion characterization in an internal combustion engine with ethanol—gasoline blended fuels varying compression ratios and ignition timing. Energy Fuel 2009, 23, 2319–2324. [Google Scholar] [CrossRef]
  2. Zhang, Z.H.; Cheung, C.S.; Chan, T.L.; Yao, C.D. Experimental investigation on regulated and unregulated emissions of a diesel/methanol compound combustion engine with and without diesel oxidation catalyst. Sci. Total Environ. 2010, 408, 865–872. [Google Scholar] [CrossRef] [PubMed]
  3. Liang, C.; Ji, C.; Liu, X. Combustion and emissions performance of a DME-enriched spark-ignited methanol engine at idle condition. Appl. Energy 2011, 88, 3704–3711. [Google Scholar] [CrossRef]
  4. Melo, T.C.C.D.; MacHado, G.B.; Belchior, C.R.P.; Colaco, M.J.; Barros, J.E.M.; De Oliveira, E.J.; De Oliveira, D.G. Hydrous ethanol-gasoline blends-combustion and emission investigations on a flex-fuel engine. Fuel 2012, 97, 796–804. [Google Scholar] [CrossRef]
  5. Liaw, H.J.; Tang, C.J.; Lia, S.J. A model for predicting the flash point of ternary flammable solutions of liquid. Combust Flame 2004, 138, 308–319. [Google Scholar] [CrossRef]
  6. Vidal, M.; Rogers, W.J.; Mannan, M.S. Prediction of minimum flash point behaviour for binary mixtures. Process Saf. Environ. 2006, 84, 1–9. [Google Scholar] [CrossRef]
  7. Guo, Y.; Wei, H.; Yang, F.; Li, D.; Fang, W.; Lin, R. Study on volatility and flash point of the pseudo-binary mixtures of sunflowerseed-based biodiesel + ethanol. J. Hazard. Mater. 2009, 167, 625–629. [Google Scholar] [CrossRef]
  8. Kurambhatti, C.V.; Kumar, D.; Rausch, K.D.; Tumbleson, M.E.; Singh, V. Ethanol production from corn fiber separated after liquefaction in the dry grind process. Energies 2018, 11, 2921. [Google Scholar] [CrossRef]
  9. Wang, X.; Martin, N.M.; Nilsson, J.; Carlson, S.; Gustafson, J.; Skoglundh, M.; Carlsson, P.A. Copper-modified zeolites and silica for conversion of methane to methanol. Catalysts 2018, 8, 545. [Google Scholar] [CrossRef]
  10. Simonelt, B.R.T.; Rogge, W.F.; Mazurek, M.A.; Standley, L.J.; Hildemannand, L.M.; Cass, G.R. Lignin pyrolysis products, lignans, and resin acids as specific tracers of plant classes in emissions from biomass combustion. Environ. Sci. Technol. 1993, 27, 2533–2541. [Google Scholar] [CrossRef]
  11. Luche, J.; Mathis, E.; Rogaume, T.; Richard, F.; Guillaume, E. High-density polyethylene thermal degradation and gaseous compound evolution in a cone calorimeter. Fire Saf. J. 2012, 54, 24–35. [Google Scholar] [CrossRef]
  12. Ometto, A.R.; Hauschild, M.Z.; Roma, W.N.L. Lifecycle assessment of fuel ethanol from sugarcane in Brazil. Int. J. Life Cycle Assess. 2009, 14, 236–247. [Google Scholar] [CrossRef]
  13. Gann, R.G.; Babrauskas, V.; Grayson, S.J.; Marsh, N.D. Hazards of combustion products: Toxicity, opacity, corrosivity, and heat release: The experts’ views on capability and issues. Fire Mater. 2011, 35, 115–127. [Google Scholar] [CrossRef]
  14. IEC 60695-7:2010. Fire Hazard Testing. Part 7-1: Toxicity of Fire Effluent—General Guidance, 3rd ed.; International Electrotechnical Commission: Geneva, Switzerland, 2010; p. 50. [Google Scholar]
  15. IEC 60695-7-3:2011. Fire Hazard Testing. Part 7-3: Toxicity of Fire Effluent—Use and Interpretation of Test Results, 1st ed.; International Electrotechnical Commission: Geneva, Switzerland, 2011; p. 68. [Google Scholar]
  16. C/VM2:2014. Verification Method: Framework for Fire Safety Design, 1st ed.; The Ministry of Business, Innovation and Employment: Wellington, New Zealand, 2014; p. 74. [Google Scholar]
  17. Karlsson, B.; Quintiere, J. Enclosure Fire Dynamics, 1st ed.; CRC Press: Boca Raton, FL, USA, 1999; p. 336. [Google Scholar]
  18. Maricq, M.M. Soot formation in ethanol/gasoline fuel blend diffusion flames. Combust Flame 2012, 159, 170–180. [Google Scholar] [CrossRef]
  19. ISO 2719:2016. Determination of Flash Point: Pensky-Martens Closed Cup Method, 4th ed.; International Organization for Standardization: Geneva, Switzerland, 2016; p. 22. [Google Scholar]
  20. ISO 5660-1:2015. Reaction to Fire Tests. Heat Release, Smoke Production and Mass Loss Rate. Part 1: Heat Release Rate (Cone Calorimeter Method) and Smoke Production Rate (Dynamic Measurement), 3rd ed.; International Organization for Standardization: Geneva, Switzerland, 2015; p. 55. [Google Scholar]
  21. Martinka, J.; Chrebet, T.; Balog, K. An assessment of petrol fire risk by oxygen consumption calorimetry. J. Therm. Anal. Calorim. 2014, 117, 325–332. [Google Scholar] [CrossRef]
  22. Ward, D.E.; Hao, W.M. Air Toxic Emissions from Burning of Biomass Globally: Preliminary Estimates. In Proceedings of the 85th Annual Meeting and Exhibition, Air and Waste Management Association, Kansas City, MO, USA, 16–25 June 1992; Air and Waste Management Association: Kansas City, MO, USA, 1992; pp. 92–98. [Google Scholar]
  23. Ferek, R.J.; Reid, J.S.; Hobbs, P.V.; Blake, D.R.; Liousse, C. Emission factors of hydrocarbons, halocarbons, trace gases and particles from biomass burning in Brazil. J. Geophys. Res. Atmos. 1998, 103, 32107–32118. [Google Scholar] [CrossRef] [Green Version]
  24. Janssens, M. Rate of heat release of wood products. Fire Saf. J. 1991, 17, 217–237. [Google Scholar] [CrossRef]
  25. Maciulaitis, R.; Praniauskas, V. Fire tests on wood products subjected to different heat fluxes. J. Civ. Eng. Manag. 2010, 16, 484–490. [Google Scholar] [CrossRef]
  26. Akaki, T.; Maehara, H.; Tooyama, M. Development of wood and wood ash-based hydroxyapatite composites and their fire-retarding properties. J. Wood Sci. 2012, 58, 532–537. [Google Scholar] [CrossRef]
  27. Carosio, F.; Cuttica, F.; Medina, L.; Berglund, L.A. Clay nanopaper as multifunctional brick and mortar fire protection coating-Wood case study. Mater. Des. 2016, 93, 357–363. [Google Scholar] [CrossRef]
  28. Zhang, J. Study of Polyamide 6-Based Nanocomposites. Ph.D. Thesis, Polytechnic University, New York, NY, USA, 27 November 2008. [Google Scholar]
  29. Beyer, G. Flame retardant properties of EVA-nanocomposites and improvements by combination of nanofillers with aluminium trihydrate. Fire Mater. 2001, 25, 193–197. [Google Scholar] [CrossRef]
  30. Wang, S.; Hu, Y.; Li, Z.; Wang, Z.; Zhuang, Y.; Chen, Z.; Fan, W. Flammability and phase-transition studies of nylon 6/montmorillonite nanocomposites. Colloid Polym. Sci. 2003, 281, 951–956. [Google Scholar] [CrossRef]
  31. Chigwada, G.; Jash, P.; Jiang, D.D.; Wilkie, C.A. Fire retardancy of vinyl ester nanocomposites: Synergy with phosphorus-based fire retardants. Polym. Degrad. Stab. 2005, 89, 85–100. [Google Scholar] [CrossRef] [Green Version]
  32. Varley, R.J.; Groth, A.M.; Leong, K.H. The role of nanodispersion on the fire performance of organoclay-polyamide nanocomposites. Compos. Sci. Technol. 2008, 68, 2882–2891. [Google Scholar] [CrossRef]
  33. Srinivasan, K.K.; Mago, P.J.; Krishnan, S.R. Analysis of exhaust waste heat recovery from a dual fuel low temperature combustion engine using an organic Rankine cycle. Energy 2010, 35, 2387–2399. [Google Scholar] [CrossRef]
  34. Maurya, R.K.; Agarwal, A.K. Experimental study of combustion and emission characteristics of ethanol fuelled port injected homogeneous charge compression ignition (HCCI) combustion engine. Appl. Energy 2011, 88, 1169–1180. [Google Scholar] [CrossRef]
  35. Liang, C.; Ji, C.; Gao, B.; Liu, X.; Zhu, Y. Investigation on the performance of a spark-ignited ethanol engine with DME enrichment. Energy Convers. Manag. 2012, 58, 19–25. [Google Scholar] [CrossRef]
  36. Zachar, M.; Mitterova, I.; Xu, Q.; Majlingova, A.; Cong, J.; Galla, S. Determination of fire and burning properties of spruce wood. Drvna Ind. 2012, 63, 217–223. [Google Scholar] [CrossRef]
  37. Kim, J.; Lee, J.H.; Kim, S. Estimating the fire behavior of wood flooring using a cone calorimeter. J. Therm. Anal. Calorim. 2012, 110, 677–683. [Google Scholar] [CrossRef]
  38. Pfeil, M.A.; Groven, L.J.; Lucht, R.P.; Son, S.F. Effects of ammonia borane on the combustion of an ethanol droplet at atmospheric pressure. Combust Flame 2013, 160, 2194–2203. [Google Scholar] [CrossRef]
  39. Cekovska, H.; Gaff, M.; Osvaldova, L.M.; Kacik, F.; Kaplan, L.; Kubs, J. Tectona grandis Linn. and its fire characteristics affected by the thermal modification of wood. BioRes 2017, 12, 2805–2817. [Google Scholar] [CrossRef]
  40. Martinka, J.; Martinka, F.; Rantuch, P.; Hrusovsky, I.; Blinova, L.; Balog, K. Calorific value and fire risk of selected fast-growing wood species. J. Therm. Anal. Calorim. 2018, 131, 899–906. [Google Scholar] [CrossRef]
  41. Haynes, W.M. Handbook of Chemistry and Physics, 96th ed.; CRC Press: Boca Raton, FL, USA, 2015; p. 2677. [Google Scholar]
  42. ISO 1716:2018. Reaction to Fire Tests for Products: Determination of the Gross Heat of Combustion (Calorific Value), 4th ed.; International Organization for Standardization: Geneva, Switzerland, 2018; p. 30. [Google Scholar]
  43. Thornton, W.M. The relation of oxygen to the heat of combustion of organic compounds. Philos. Mag. 1917, 33, 196–203. [Google Scholar] [CrossRef]
  44. Gunther, B.; Gebauer, K.; Barkowski, R.; Rosenthal, M.; Bues, C.T. Calorific value of selected wood species and wood products. Eur. J. Wood Prod. 2012, 70, 755–757. [Google Scholar] [CrossRef]
  45. Todaro, L.; Rita, A.; Cetera, P.; D’Auria, M. Thermal treatment modifies the calorific value and ash content in some wood species. Fuel 2015, 140, 1–3. [Google Scholar] [CrossRef]
  46. DiNenno, P.J. SFPE Handbook of Fire Protection Engineering, 3rd ed.; National Fire Protection Association: Quincy, MD, USA, 2002; p. 1606. [Google Scholar]
  47. Ozgen, S.; Caserini, S.; Galante, S.; Giugliano, M.; Angelino, E.; Marongiu, A.; Hugony, F.; Migliavacca, G.; Morreale, C. Emission factors from small scale appliances burning wood and pellets. Atmos. Environ. 2014, 94, 144–153. [Google Scholar] [CrossRef]
  48. Gardiner, W.C. Gas-Phase Combustion Chemistry, 2nd ed.; Springer: New York, NY, USA, 2000; p. 543. [Google Scholar]
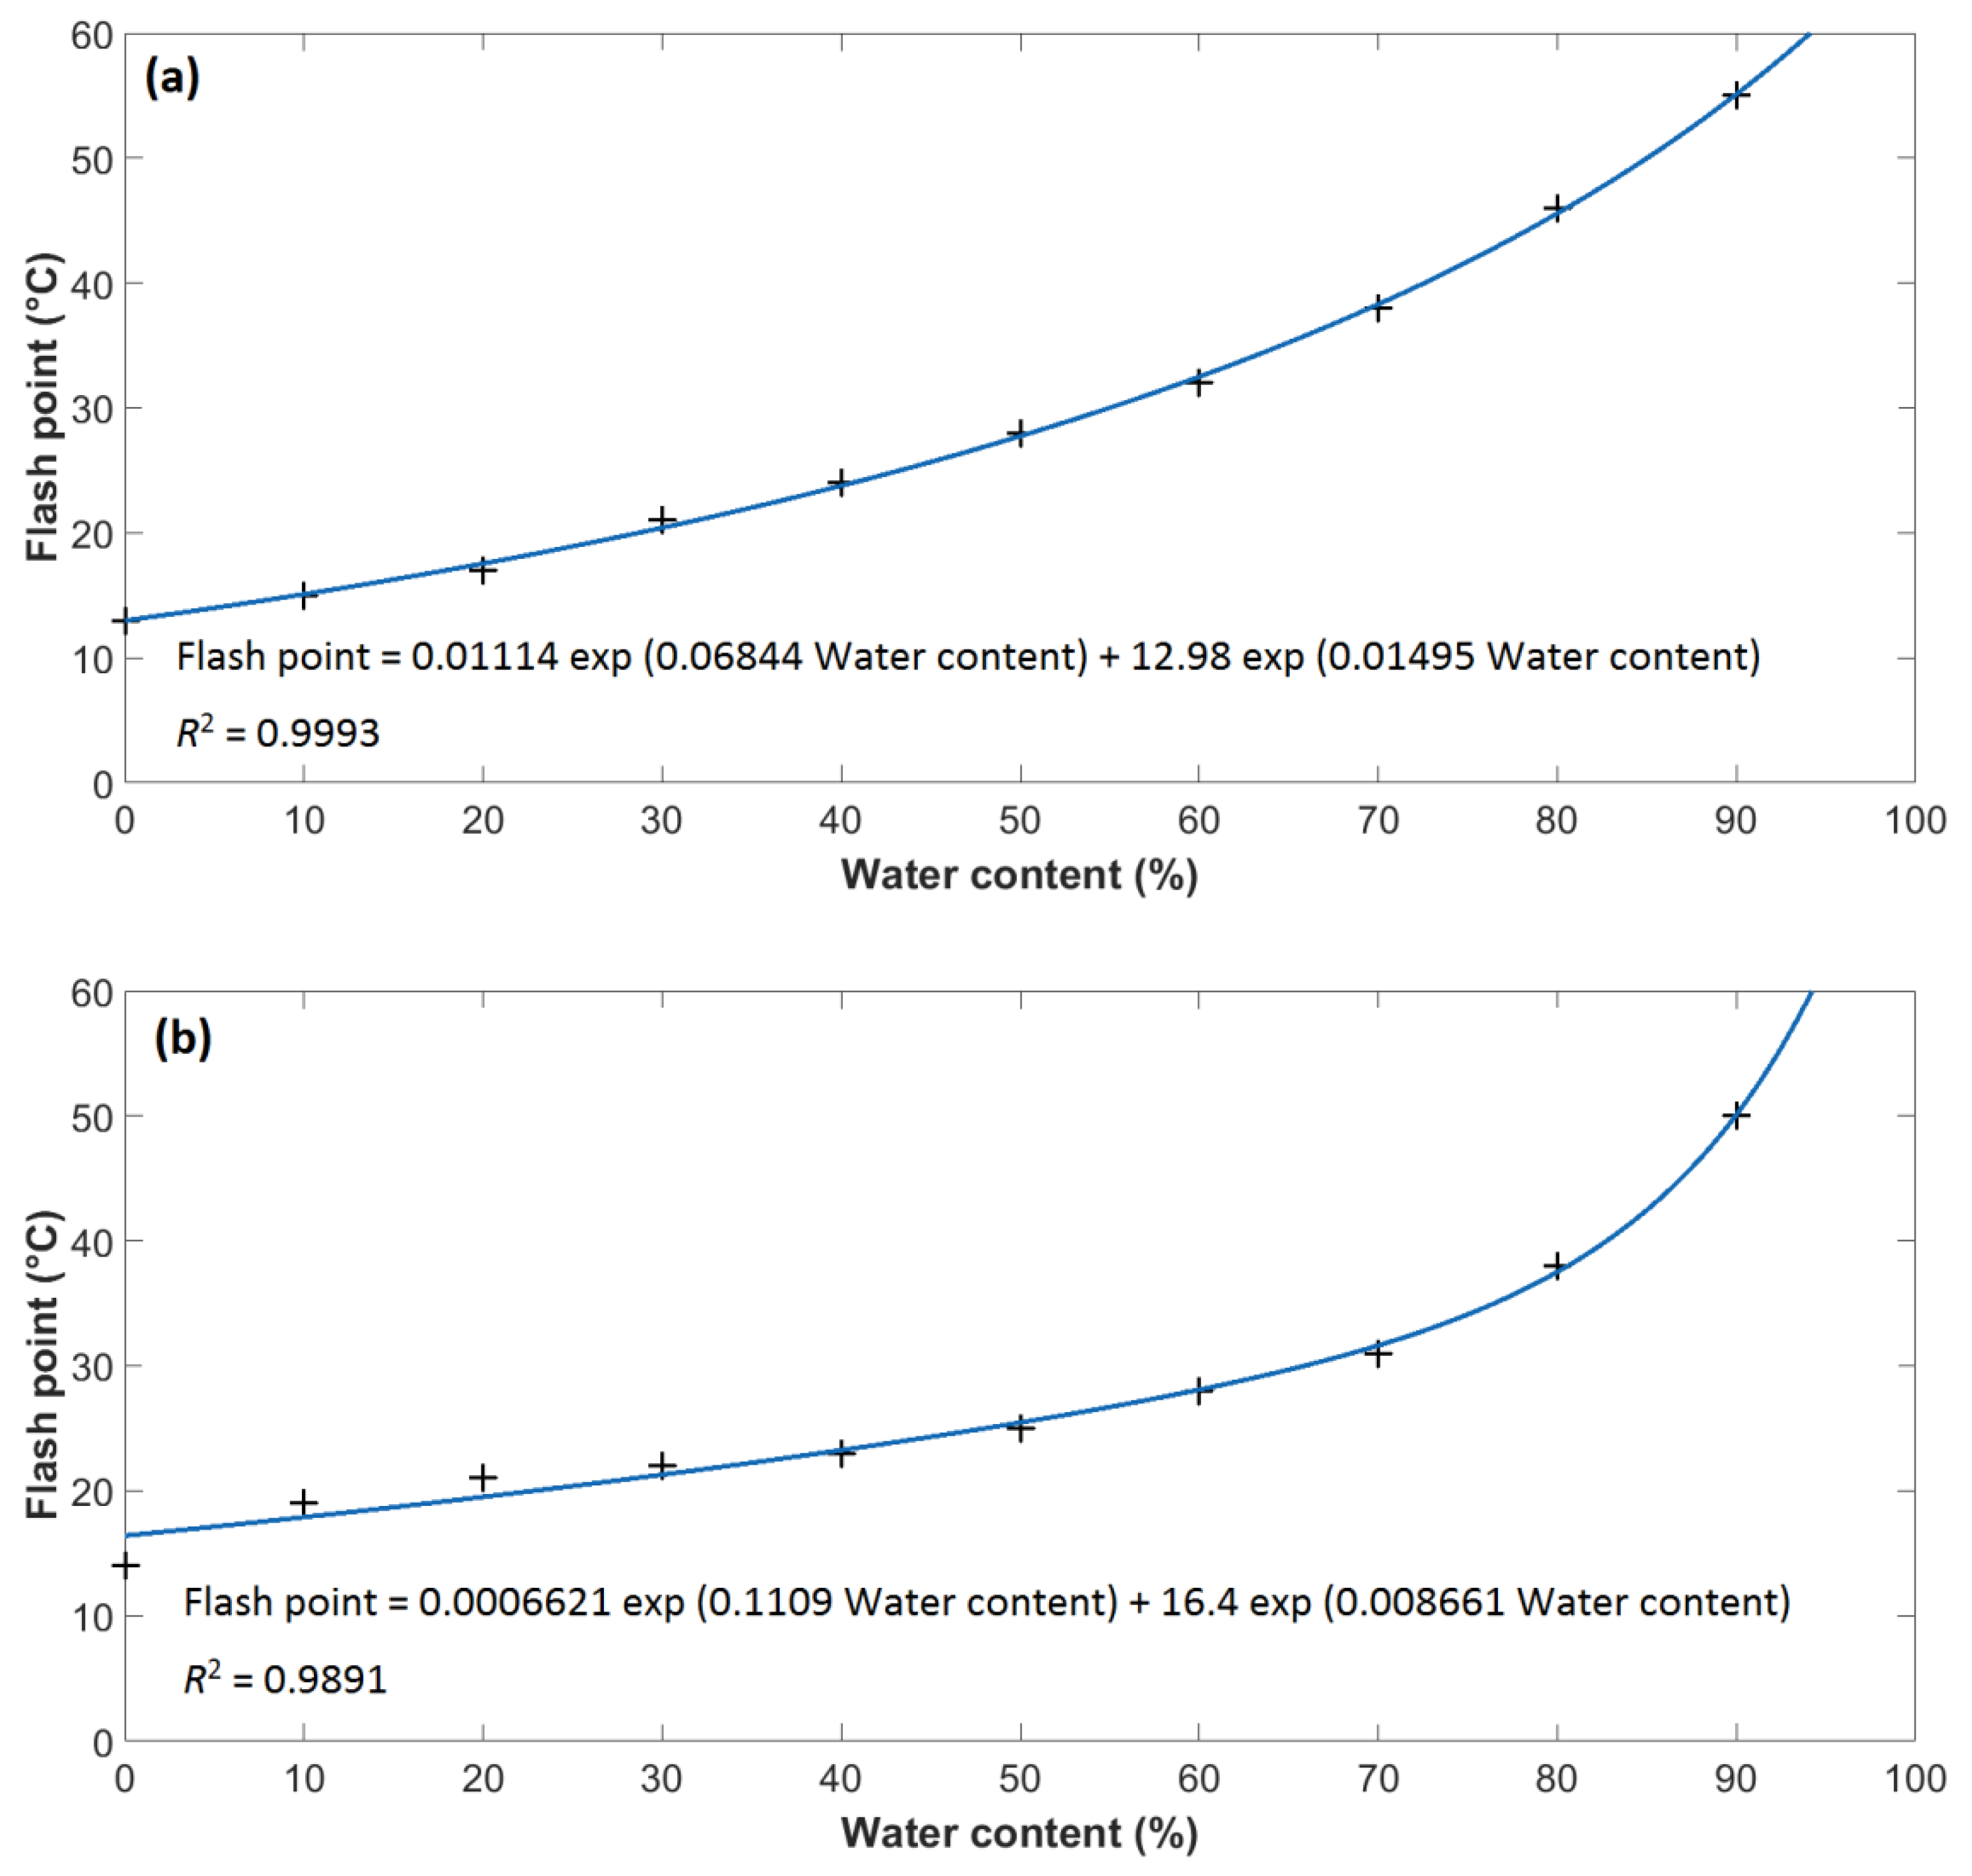
Figure 1. Dependency of the flash point of investigated fuels on the water content: (a) Dependency of the flash point of methanol on the water content; (b) Dependency of the flash point of ethanol on the water content.
Energies 12 03491 g001
Figure 2. Dependency of the heat release rate of investigated fuels on the water content: (a) Dependency of the heat release rate of methanol on the water content; (b) Dependency of the heat release rate of ethanol on the water content.
Energies 12 03491 g002
Figure 3. Dependency of the maximum heat release rate of investigated fuels on the water content: (a) Dependency of the maximum heat release rate of methanol on the water content; (b) Dependency of the maximum heat release rate of ethanol on the water content (mHRR: maximum heat release rate).
Energies 12 03491 g003
Figure 4. Dependency of the maximum average rate of heat emission of investigated fuels on the water content: (a) Dependency of the maximum average rate of heat emission of methanol on the water content; (b) Dependency of the maximum average rate of heat emission of ethanol on the water content (MARHE: maximum average rate of heat emission).
Energies 12 03491 g004
Figure 5. Dependency of the effective heat of combustion of investigated fuels on the water content: (a) Dependency of the effective heat of combustion of methanol on the water content; (b) Dependency of the effective heat of combustion of ethanol on the water content (EHC: effective heat of combustion).
Energies 12 03491 g005
Figure 6. Dependency of the mass ratio of investigated fuels to water (evaporated from solution) in the combustion zone on the water content: (a) Dependency of the mass ratio of methanol to water (evaporated from solution) in the combustion zone on the water content; (b) Dependency of the mass ratio of ethanol to water (evaporated from solution) in the combustion zone on the water content.
Energies 12 03491 g006
Figure 7. Dependency of the carbon monoxide (CO) yields (per mass loss) of investigated fuels on the water content: (a) Dependency of the CO yields (per mass loss) of methanol on the water content; (b) Dependency of the CO yields (per mass loss) of ethanol on the water content.
Energies 12 03491 g007
Figure 8. Dependency of the CO yields (per released heat) of investigated fuels on the water content: (a) Dependency of the CO yields (per released heat) of methanol on the water content; (b) Dependency of the CO yields (per released heat) of ethanol on the water content.
Energies 12 03491 g008
Figure 9. Dependency of the combustion efficiency of investigated fuels on the water content: (a) Dependency of the combustion efficiency of methanol on the water content; (b) Dependency of the combustion efficiency of ethanol on the water content.
Energies 12 03491 g009
Table 1. Mass loss of fuel solutions from ignition to the spontaneous flame extinction.
Water Content in Solution (%)6080
Mass loss of methanol solution (g)35.58.1
Mass loss of ethanol solution (g)35.414.8
Mass of burned methanol (g)20.94.1
Mass of burned ethanol (g)21.97.5
Mass of water evaporated from methanol solution (g)14.64
Mass of water evaporated from ethanol solution (g)13.57.3
Table 2. Critical fuels contents (ratio of alcohol mass to water mass) in solution for the spontaneous flame extinction.
Water Content in Solution (%)6080
Critical methanol content in solution (%)17.315.6
Critical ethanol content in solution (%)14.211