Abstract
Recently, the use of photovoltaic (PV) cells and the increase in the number of photovoltaic power plants has led to a detailed examination of their operating parameters. In this article, we discuss material and operating parameter influences on the performance and efficiency of photovoltaic panels in a photovoltaic power plant. The plant consisted of 3600 pieces of polycrystalline PV panels from Renewable Energy Corporation (REC) Solar (type REC 230AE) with a maximum power of 230 Wp. Parameter measurements were made three years after the power plant was started. The measured and computed data were statistically processed using multidimensional statistical methods where the relationships between input and output variables were examined, which was subsequently quantified by regression analysis. Using the ANOVA, the variability of the measured efficiency of the panels and the performance for individual years was examined. Efficiency has been found to increase significantly over the years. The reason for this is the statistically proven prevailing operating time of the PV power plant in conditions with lower temperature than standard operating conditions (25 °C). Ageing was not confirmed in optimal conditions and calculated efficiency was constant.
1. Introduction
For both large and small photovoltaic (PV) installations, the development of a symptom of PV module degradation is inevitable. PV degradation is known to cause a decrease in panel performance and the amount of energy produced, and the relationship between the different rates of degradation and PV system failures (including the types of faults, their location, and the current failure level) has been investigated by Dhoke, Sharma and Saha [1]. Their experiment involved arranging 16 modules with different levels of degradation which were applied to generate multiple short-circuit error scenarios. They found that degradation causes a reduction in current in the chain, increasing the probability of not detecting an error using conventional protection settings. The potential for the degradation of PV modules is of interest to manufacturers, promoters and owners of these systems.
The module fails for several reasons:
- Failure to control production quality,
- Faulty PV plant design,
- Faulty operation,
- Errors that occur after a certain period of operation,
- Visual errors.
Predicting the degradation of PV modules by simulation modeling has been discussed in India by Kumar et al. [2], who also discussed the possible degree of degradation of crystalline PV systems. The most widespread method is the simulation using power modeling tools like PVsyst, PV*Sol, HOMER, PVGIS, RETScreen, etc. The predicted results show that this degradation rate could range between −0.6% to −5% per and a possible degradation rate of −2.5% per year, resulting in a loss of energy of −8109.99 kWh per year and −1757.724 kWh per year to −14,647.7 kWh per year.
Degradation rate (DR) is formulated as a reduction of maximum power over time and its prediction is still a challenging task, especially since different PV technologies are subject to different degrees of degradation. Malvoni et al. [3], tried to accomplish this task by examining the rate of degradation using a linear regression model over time series performance ratios. In addition, they compared the accuracy of the prediction of two modeling software programs (PVsyst and SAM). They found that the degradation rate was about 0.52% per year using linear regression, and 1.48% per year using the classical decay method. The rate of degradation, therefore, depends not only on the surrounding climatic conditions, but also on the used module technology and calculation method. Thin-film PV modules have higher degradation rates than polycrystalline or crystalline silicon modules. Their behavior and degradation patterns in Jaen, Spain, a dry and sunny inland site with a continental–Mediterranean climate, were analyzed by Kichou et al. [4] from July 2011 to October 2014. They used the least squares method and linear regression.
An overview of the degree of degradation of PV systems, and an investigation, analysis and study focusing on individual regions of the world (USA, Europe, Japan) and subsequently on the individual technologies used (mixed, crystalline silicon, amorphous silicon, copper–indium–gallium–selenium, cadmium–telluride) was prepared by Jordan and Kurtz [5].
The fact that the degree of degradation of the PV modules is linear during long-term operation is now widely accepted, but during the first year at the start of operation, the degradation rate deviates from this linearity. This phenomenon was examined by Quansah and Adaramola [6], who observed a deterioration in the performance of five different solar photovoltaic technologies in the first months of exposure. The results show that early degradation (during the first year) was most pronounced in amorphous silicon (13.8%), while it decreased by 9.3% in copper–indium sulphide (CIS) technology installed as a thin film. Crystalline silicon systems lost 7.9–9%. Modules of hybrid Heterojunction with intrinsic Thin-layer (HIT) technology, which is a hybrid of amorphous and monocrystalline silicone technology, had a degradation of 11.1%.
Pingel et al. [7] dealt with the potential induced degradation (PID) of standard p-type silicon technology with a focus on increasing the lifetime of PV panels exposed to external potentials in the field. By means of tests, they tried to identify and demonstrate the effect of PV cell properties on PID, as well as to determine whether this process could be stopped or at least minimized. The results of the tests were that although the origin of PID is at the cellular level, it can be minimized or avoided at all levels (cell, panel and system). A system-level solution is to select a suitable grounding scheme for the poles, while at the panel level, the encapsulation material properties determine the current leakage levels that can lead to PIDs in the case of susceptible PV cells. There are many parameters at the cellular level that effect the stability of PID PV cells. In addition to the resistivity of the base material and the resistance of the emitter, the most important parameter is an anti-reflective coating, since the adaptation of this layer may prevent the PID effect.
Kaplani [8] have studied six modules from two different field producers for 18 years and over 22 years. The modules with over 22 years of operation time were exposed to natural field conditions, whereas modules with 18 years of operation, in addition to natural aging, were exposed to the strong effects of induced aging for several months. The results of this study propose that natural aging modules of natural milder aging effects were more evenly distributed across all cells of the module, while modules exposed to stronger local effects of induced aging exhibit uneven distribution of optical and thermal degradation, and ultimately cause much higher rates of degradation. Of course, the increased inequality of temperature distribution is related to localized accelerated aging conditions, but also to complex chemical reactions that occur during the progression of intense aging phenomena, leading to more severe disorders. The same effects due to aging could occur when PV modules operate in a field in remote locations or in areas rich in vegetation, where bird droppings occur repeatedly, and areas that are partially/completely obscured by nearby objects or fences. These can lead to a more permanent phenomenon of optical and physical degradation of the cells. This study showed some of the extent of optical, physical, thermal and power degradation in singlecrystal silicon sc–Si PV modules, both after normal and accidentally induced aging during operation. This shows the need for more sensitive care, transport, installation and maintenance procedures, in addition to telecontrols of photovoltaic sites using tele-diagnostic techniques to detect failures and induced effects of aging early in order to extend module life.
The reliability models of PV modules based on degradation studies were solved by Vazquez and Rey-Stolle [9]. They evaluated the most important analytical functions of reliability engineering using this model and applied it to a practical case based on state-of-the-art parameters of crystalline silicon PV technology. In short, we can summarize the conclusions reached by the authors as follows:
- The annual degradation rate for crystalline silicon PV modules is from 0.3% to 3% and appears to be constant over time. In some studies, during the first year, slightly higher degradation rates were observed.
- To guarantee the durability of PV panels for 25 years or more, the degradation rate must not exceed 0.5% per year. In the case of conditions with a higher standard PV power deviation, a lower degradation rate is required.
- Calculation values of durability and Mean time to failure (MTTF) of PV modules are significantly different from real values. This inconsistency is supported by the fact that the MTTF values recorded so far are the result of catastrophic failures during the first years of operation and do not consider degradation.
Jiang, Lu and Sun [10] paid attention to the impact of airborne dust deposition on PV modules on their overall efficiency. Many studies have mainly pointed to the influence of physical parameters of PV modules for dust settling. However, some studies also focused on the effect of dust on the performance of PV panels depending on their type and material. Jiang and his colleagues focused on the research of dust accumulation on many different types of photovoltaic modules and the corresponding reduction in efficiency. The experiment was carried out under laboratory conditions. The results showed that the dust pollution had a significant effect on the output of photovoltaic modules. With an increasing dust deposition density ranging from 0 g·m−2 to 22 g·m−2, the corresponding reduction in PV efficiency increased from 0% to 26%. The surface of the PV modules can significantly affect dust storage and accumulation. The polycrystalline silicon module packaged with epoxy were degraded more rapidly than other modules with a glass surface below the same dust concentration. However, there are also studies claiming that 4 g·m−2 of dust on the PV panel reduces the PV module output power by 40% [11,12,13,14,15].
Sulaiman et al. [11] also stress the need for appropriate maintenance of PV modules, particularly the removal of opaque particles of dust, sand (which can naturally be washed away by rain if the collector has an appropriate angle of inclination) and possibly moss or other impurities (presence of moss could reduce PV output power by up to 86%). The presence of raindrops does not affect the performance of the panels.
The objective of the study is to verify the influence of operating parameters on the performance characteristics and efficiency of photovoltaic panels in a photovoltaic power plant under real operation conditions and by comparison with the results of current research. At the same time, we analyze the impact of aging of photovoltaic power plant panels.
2. Materials and Methods
The analyzed photovoltaic power plant is in Slovakia in the Trnava region. The total available area of land on which the power plant is built is 30,000 m2, of which 75% of this area was used for installation. There are no forests or built-up areas in the power plant surroundings; agricultural land prevails. Soil tests were carried out on the land to verify the subsoil, and to determine what type of substrate reinforcement is needed. The land in question has class III soil with a load rating of 0.12–0.25 MPa. The construction of the PV plant was carried out in 2010 in the months of September to November and was put into trial operation at the end of November of the same year. In March 2011, the trial operation was terminated, and proper operation started [16]. The PV system dimensions were designed using the PC software PVsyst, and the meteorological data was used from the Meteonorm software. The optimum slope of the site was set at 35°. Other parameters are listed in Table 1.

Table 1.
Parameters of photovoltaic power plant.
Pieces of polycrystalline PV panels (3600) from REC Solar (type REC 230AE) with a maximum output of 230 Wp were used, which the company obtained directly from the manufacturer. This provides a guarantee of 90% power of photovoltaic panels after 10 years and 80% power after 25 years. The following quantities related to the power and material properties of PV modules and cells were measured: date, time, total inverter power (kW), hourly production (kWh) outputs from inverters, air temperature (°C; output from Vaisala Weather Transmitter WXT520), panel temperature (°C; output from Infrared Temperature Sensor PM-HA-201-MT-CB), global radiation (W·m−2; output from a pyranometer (Kipp & Zonen CMP6)). The data collected are data for the first two years of operation, i.e., 2012, 2013 and the control year 2015. Incomplete measurements are excluded from the statistical analyses. The result is data that allows us to declare the influence of the basic property of the material operating temperature on its efficiency of conversion of solar radiation into electricity. At the same time, we can analyze the effect of material aging on this efficiency. These parameters are conditioned to the determination of hypotheses based on commonly used definitions relating to material and power degradation of PV panels.
The 12-hour data with the highest average value of global radiation during the year was used for the evaluation. The values of the inverter power and the theoretical efficiency of the PV modules were calculated from the measured data of global radiation (GR), panel temperature (PT), air temperature (T), generated electricity (E), PV power, and panel efficiency (η).
To confirm/disprove the data in the introduction, it was necessary to determine the theoretical values used in the datasheets of the PV modules and compare them with the real values. The calculated values are related to the operating conditions used in laboratories, i.e., an ambient temperature of 25 °C and an irradiation intensity of 1000 W·m−2.
The calculation of the efficiency of the conversion of solar radiation into electricity using PV panels was based on Equation (1):
where PPVP is the power of photovoltaic panels (kW), GR is global radiation (kW·m−2), and A is the total area of the PV panels, which is 5940 m2.
η = PPVP/(GR·A)·100 %
Since the power of the PV modules was not known from the analyzed PV plant records or the power of the inverters, the power conversion equation was used to calculate the power of the installed modules:
where ηconv is 97.6%.
PPVP = Pconv/ηconv·100 (kW)
The theoretical calculation of PV module efficiency assumes that photovoltaic energy conversion efficiency is a linear dependence of PV panel temperature according to Equation (3):
where ηT is the instantaneous calculated PV module efficiency at a given panel temperature T (%), ηref is the PV module reference efficiency at Tref (reference operating temperature) and 1000 W·m−2 solar intensity as declared by the PV module manufacturer (%), βref is the temperature coefficient of the material (which indicates the percentage of efficiency and the power drops, respectively, when the temperature is increased by 1 °C) as declared by the PV module manufacturer (°C−1).
ηT = ηref·[1 − βref·(T − Tref)] (%)
In the calculations, we considered the temperature coefficient βref = 0.0046 °C−1 for polycrystalline silicon, the reference operating temperature Tref = 25 °C and the efficiency ηref = 13.9%.
The measured input and calculated data were evaluated by descriptive statistics. We analyzed the behavior of global radiation, panel temperature, air temperature, panel performance and efficiency over the reporting period. By decomposing the time series, the trend was assessed. Using the ANOVA, the variability of the measured efficiency of the panels and the performance for individual years was examined. By means of multivariate analysis of dependence data for individual numerical quantities, the relation between input data (radiation intensity and air temperature) and output data (temperature, power and efficiency of photovoltaic panels) was evaluated. Using a paired correlation analysis, the relationship between all pairs of indicators was investigated.
3. Analysis of PV Plant Operating Parameters
Based on the methodology described above, data were measured for two years (2012 and 2013) at a frequency of every second day and verified by measurements in 2015. In this way, 562 measurements were recorded. Based on the analysis of all numerical variables, the mean values, standard deviations and limit values (min and max) of the key indicators (global radiation, air temperature, panel temperature, PV power and PV panel efficiency) were determined (see Table 2).
Table 2.
Descriptive statistics.
Analysis of variability indicators (standard deviation and coefficient of variation) revealed high variability of input variables (global radiation and air temperature), which subsequently influenced the variability of some output variables (PV panel temperature and PV panel power). These findings are probably related to climatic variations during the year, highlighting the need for time series data analysis.
3.1. Global Radiation
The development of GR over the period under investigation is seen in Figure 1. The graph has a typical behavior with maximum values in summer and minimum in winter. The highest GR totals range from 0.02 kW·m−2 to about 1.26 kW·m−2 and appear from April to September. The highest GR value of the whole monitored period was recorded on 23 May 2013 (1.26 kW·m−2). In 2012, the maximum GR was 1.13 kW·m−2 (11 June 2012) and in 2015 (1.08 kW·m−2 on 5 April 2015). The above measurements confirm the established claims about the maximum value of global radiation in Slovakia on the level of 1000 W·m−2.
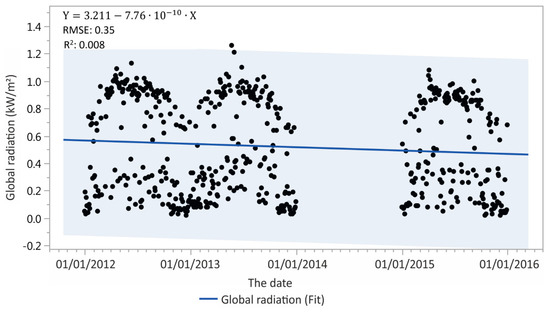
Figure 1.
Daily global radiation.
3.2. Air Temperature and Temperature of PV Panels
The temperature of the photovoltaic panel is influenced by global radiation, air temperature and other factors such as wind speed and hydrometeors. In the case of temperature evaluation, it is also necessary to consider the electrical resistance of the PV cells, which causes an increase in temperature when solar radiation is converted to electricity. This factor is the difference between the air temperature and the PV module operating temperature. The following figures (Figure 2 and Figure 3) provide an overview of the operating air temperature and the temperature of the PV modules over the period under investigation, where the interaction of the two parameters can be seen. The graph shows the influence of wind on the temperature of PV modules in the absence of GR. These are sections where the temperature of the PV modules is lower than the ambient air temperature (see Figure 3; black dots in the marked elliptical formations).
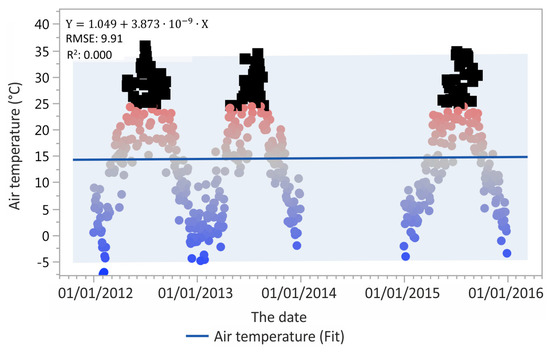
Figure 2.
Air temperature over the period.
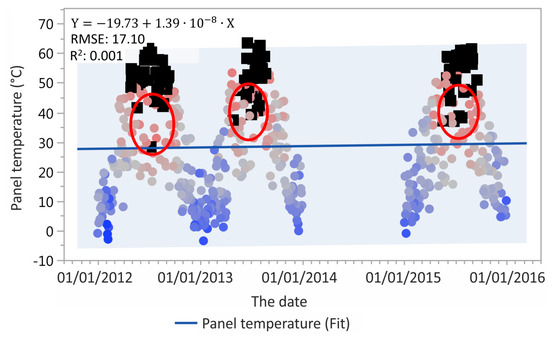
Figure 3.
Temperature of the photovoltaic (PV) modules.
3.3. Efficiency of PV Modules
The development of PV module efficiency (ηPVP) obtained from the measured operating parameters (from the ratio of PV panel power and radiation intensity to the PVP area) over the period under investigation is seen in Figure 4. Efficiency values range from 8% to 17.5%. Throughout the period considered, the efficiency was balanced. In Figure 4, it is possible to observe the recorded outlier values which could have been caused by contamination of the surface of the PV modules, air pollution, snow, hydrometeors, or measurement error of the inverters. An interesting and unexpected finding is the fact that the development of PV module efficiency has an increasing trend over time.
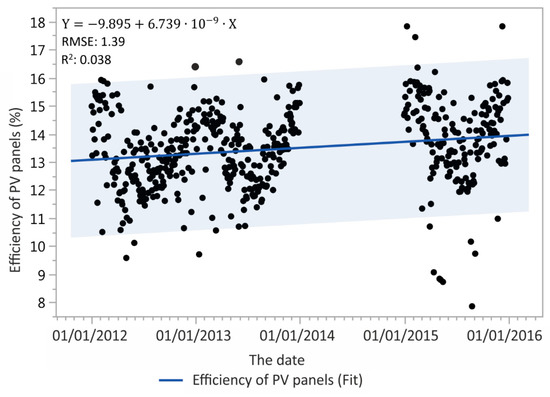
Figure 4.
The development of efficiency of PV panels obtained from the measured operating parameters.
This non-standard development of efficiency identified the need to investigate year-on-year variability in efficiency using the ANOVA. The average annual efficiency values are shown in Figure 5 and Table 3. The ANOVA average annual efficiency values show that the overall average efficiency is 13.47%. The annual efficiency values show significant statistical differences between them. The results highlight above-average efficiency values in 2015 and below-average efficiency values in 2012.
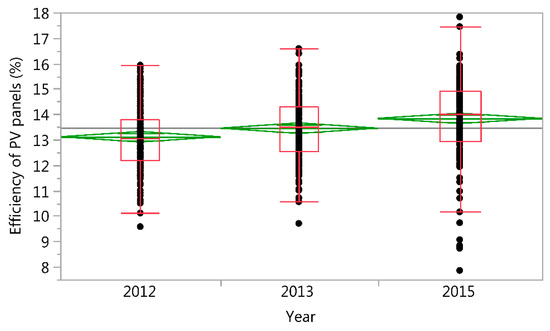
Figure 5.
Analysis of PV module efficiency for individual years.
Table 3.
ANOVA analysis of PV module efficiency for individual years.
3.4. PV Power
The power rating of the photovoltaic power plant ranges from 3.07 kW to 769.47 kW. The time course of the indicator shows an expected linear decrease over the period under investigation (Figure 6).
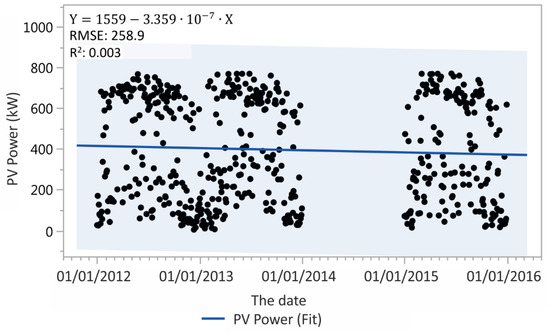
Figure 6.
The development of PV power plant output.
This decrease includes both the degradation of the photovoltaic panels as well as the close coupling to the decrease in the intensity of incident radiation. The analysis of variability shows a certain stability of the achieved power during the analyzed years (see Figure 7 and Table 4).
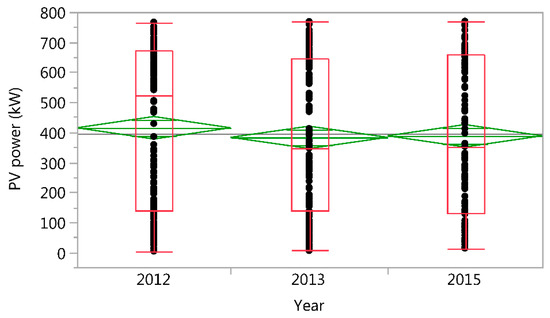
Figure 7.
Analysis of PV power plant output for individual years.
Table 4.
ANOVA analysis of PV power plant output for individual years.
3.5. Multivariate Analysis of Parameters
Using multivariate analysis of data dependencies and individual numerical values, we evaluated the relationship between input data (intensity radiation and air temperature) and output data (temperature, performance and efficiency of photovoltaic panels). The result of the analysis showed a very strong positive relationship with a Pearson correlation coefficient of greater than 0.9 between the panel temperature and the air temperature, as well as between global radiation and panel performance. Using analysis of pairwise correlation, we have studied the relationship between all pairs of variables, which in all cases was confirmed to be statistically significant (see Figure 8 and Table 5). Positive dependence was found in six pairs and negative dependence in four pairs. In the case of a negative dependence in each pair, an indicator of the efficiency of the PV modules is output, which is the subject of further investigation.
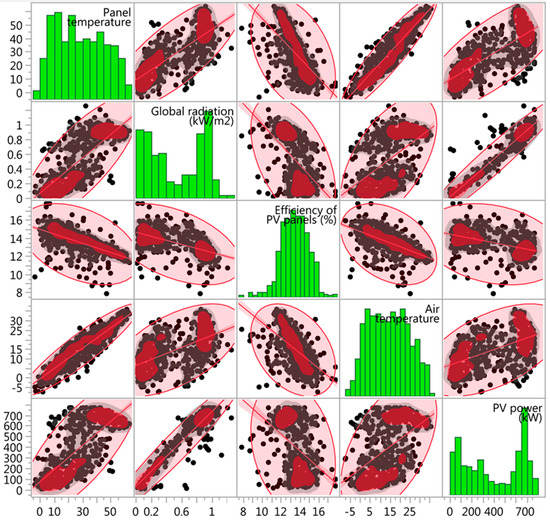
Figure 8.
Analysis of relationship of parameters. Red ellipses express the intensity of linear dependence of individual paired indicators. Narrow ellipse = strong dependence. The highest concentration of measurements is shown by the red areas.
Table 5.
Pairwise correlations of parameters.
In the next step, we will focus on evaluating the efficiency and power of PV panels. Pearson’s correlation coefficient in Figure 8 shows a weak negative linear dependency rate. Power panels should decline and decrease the intensity of the incident radiation as expected. However, efficiency increases significantly. When comparing the course of efficiency and power of PV panels over the year (Figure 9), it is possible to observe the efficiency of the panels, which is described by the quadratic regression function. The highest efficiency values are in the cold/winter months and the lowest in the summer, which is also due to the temperature of the panels. The behavior of the power of panels over the year can also be approximated by a quadratic regression function, but the deviations/residues from the function are significantly higher; the power values vary from 0 kW to 800 kW throughout the year.
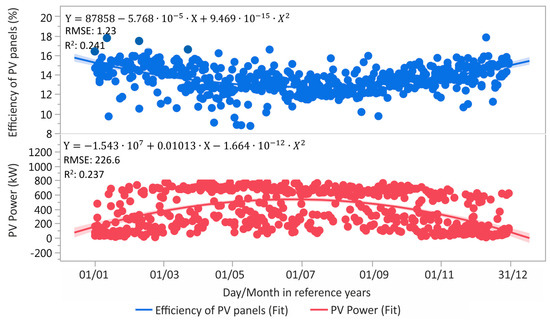
Figure 9.
Behavior of efficiency and power of PV modules during the year.
If we look at the area efficiency graph (Figure 10) in relation to the air temperature and the intensity of incident radiation (which was obtained by the method of least squares), we can see the following: the highest efficiency values were achieved at an air temperature of 7 °C to 14 °C and an incident radiation intensity of 0.2–0.5 kW/m2. Above-average efficiency values range from an outside temperature of −5 °C to 35 °C and a global radiation of up to 1 kW·m−2.
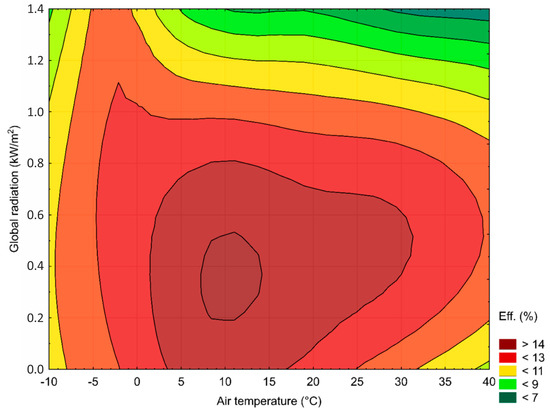
Figure 10.
Area chart of efficiency (Eff.) in relation to air temperature and global radiation.
At the same time, Figure 10 shows that efficiency values below 12% are achieved at global radiation intensity values and temperatures at which PV panels are dimensioned (1000 W·m−2 and 25 °C). To confirm the assumption that the increase in efficiency over the four analyzed periods is due to a decrease in global radiation intensity and hence temperature, we analyzed the frequency of occurrence of data in the outdoor temperature range of −5 °C to 25 °C, global radiation intensity up to 0.9 kW /m2 and the efficiency of PV panels of 14.5 to 17 %. Based on the filter determined in this way, 113 measurements were selected. The result of this analysis confirmed our assumptions as seen in Figure 11, where the relative frequency of occurrence of such days (measurements) is highest in 2015 with up to 53.7% of measurements. In 2013, it is 24.4% and in 2012, it is only 22% of the total number of selected observations.
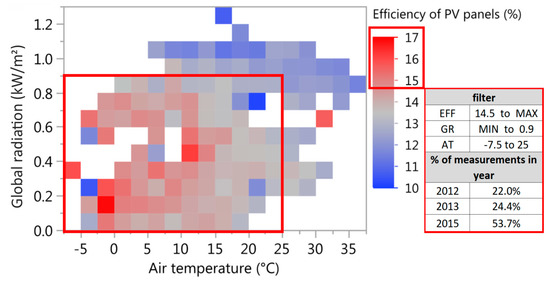
Figure 11.
Analysis of relative frequencies of observations with the highest efficiency for years 2012, 2013, 2015.
3.6. Analysis of the Impact of PV Module Aging on Their Ffficiency
For the next procedure, it was necessary to calculate the expected efficiency of the PV modules according to the equations given in the methodology with respect to the measured temperature of the PV modules. The expected efficiency of the PV modules with respect to their temperature is shown in Figure 12 for the whole period under investigation. The efficiency ranges from 11.5% to 15.5%. The development of efficiency throughout the period under review is balanced, since only the measured values of the PV module temperature were used in the calculation, eliminating some shortcomings (mainly inverter power measurement error) that could affect its value and show a very slight decreasing trend. The differences in efficiency for individual years are within the statistical error; therefore, it is not possible to determine the annual degradation coefficient of PV panel efficiency. It can be said that the efficiency for the first four years after the photovoltaic power plant was put into operation is constant.
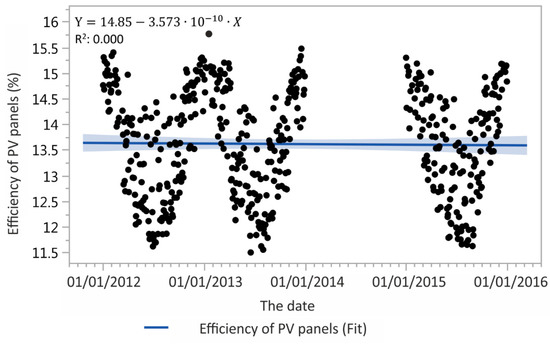
Figure 12.
Development of the calculated PV module efficiency.
4. Discussion
The assessed photovoltaic power plant was designed using tools that are also used by other authors. There are various ranges of degradation rates of PV panels in the literature depending on the technology used as well as the evaluation tools with different calculation methods [2,3,4].
Selected operating parameters were evaluated. We were able to statistically prove that the increase of measured efficiency and decrease of power is caused by the operation of the PV plant in conditions (global radiation and air temperature) where the highest efficiency is achieved. However, mainly due to lower global radiation values, the achieved performance of the devices decreases.
This finding about the higher operating power of the PV modules, and essentially the whole PV plant, can be interesting, particularly from an investor’s point of view. Consider that it is possible to statistically prove and identify sites with weather conditions that allow a higher yield of the PV plant than under standard operating conditions. It means that in the case of this PV technology, there would be a higher proportion of days with temperatures ranging from 5 °C to 15 °C and the intensity of solar radiation in the range of 200 W·m−2 to 800 W·m−2.
In this case, the energy and economic benefits of PV plants will be higher than would be expected by standard simulation tools. This result could improve the economic conditions for the installation and operation of PV plants and increase the number of installed PV devices. However, to verify such a claim is the long-term goal of research into the operating conditions in predicted locations. At the same time, it is necessary to prove the absence or minimal occurrence of unacceptable phenomena such as inverse weather.
In our case, we have observed the rate of degradation (determined through the calculated efficacy) caused by age using a linear regression model, which is generally the accepted method [3]. The degradation rate is so low (in the order of 1 × 10⁹) that it is impossible to determine because the changes in efficiency are within the statistical error and thus our results do not agree with the conclusions of the literature [5,8]. For midrange and polycrystalline PV panels, the degradation rates range from 0.3% to 2.9% per year [9]. However, from a level of 0.5% and above, manufacturers would not be able to guarantee the durability for 25 years [9] and above, or, as in our case, the manufacturer guarantees a maximum of 10% degradation in ten years. After the commencement of operation and alignment of components, it may be that there is also an occurrence in the literature that indicates an increase in efficiency in the first period after starting to use PV panels [5].
5. Conclusions
Statistical methods were used to verify the compliance of the measurement results with data from the available literature. Measured efficiency was found to increase significantly over the years. The reason for this is the statistically proven prevailing operating time of the PV power plant in conditions with lower temperature than the standard operating conditions (25 °C).
The results of the analysis did not confirm the reference data that due to the aging of the PV module material, their efficiency decreases on average by 0.7–0.8% per year (mild climate). One possible explanation could be the “rise time” theory of PV plants, in which the components will be aligned with a slight increase in the efficiency of the entire PV plant and the effect of material aging will then begin to show. This must be confirmed or refuted by long-term monitoring.
The results of our research can be used even in cases where the PV plant is used only seasonally. This creates space to execute the survey which would be focused on the conditions under consideration, like the time course of outside temperatures and intensity of solar radiation. A suitable correlation would be possible to establish time periods with maximum PV device efficiency, where it would be possible to use it optimally. At times with less favorable conditions, it could be planned to use another device, such as a mobile source.
The results of our research can be used to plan PV plants in specific conditions. The results of the statistical analysis may also be a secondary benefit. As is evident, with carefully statistical analysis of the environment, it is possible to define sites suitable for a particular PV technology.
Author Contributions
Conceptualization, D.K.; P.T.; methodology, M.T.; software, M.T.; validation, P.T.; D.K.; Ľ.G.; formal analysis, D.K.; investigation, D.K.; M.T.; P.T.; resources, Ľ.G.; data curation, P.T.; writing—Original draft preparation, J.K.; writing—Review and editing, D.K.; visualization, M.T.; supervision, P.T.; project administration, D.K.; funding acquisition, J.K.
Funding
This research was funded by the Scientific Grant Agency of the Ministry of Education, Science, Research and Sport of the Slovak Republic and the Slovak Academy of Sciences (VEGA), grant number 1/0509/18.
Conflicts of Interest
The authors declare no conflict of interest.
References
- Dhoke, A.; Sharma, R.; Saha, T.K. PV module degradation analysis and impact on settings of overcurrent protection devices. Sol. Energy 2018, 160, 360–367. [Google Scholar] [CrossRef]
- Kumar, N.M.; Gupta, R.P.; Mathew, M.; Jayakumar, A.; Singh, N.K. Performance, energy loss, and degradation prediction of roof-integrated crystalline solar PV system installed in Northern India. Case Stud. Therm. Eng. 2019, 13, 100409. [Google Scholar] [CrossRef]
- Malvoni, M.; Leggieri, A.; Maggiotto, G.; Congedo, P.M.; De Giorgi, M.G. Long term performance, losses and efficiency analysis of a 960 kWP photovoltaic system in the Mediterranean climate. Energy Convers. Manag. 2017, 145, 169–181. [Google Scholar] [CrossRef]
- Kichou, S.; Silvestre, S.; Nofuewntes, G.; Torres-Ramirez, M.; Chouder, A.; Guasch, D. Characterization of degradation and evaluation of model parameters of amorphous silicon photovoltaic modules under outdoor long term exposure. Energy 2016, 96, 231–241. [Google Scholar] [CrossRef]
- Jordan, D.C.; Kurtz, S.R. Photovoltaic degradation rates—An analytical review. Prog. Photovolt. Res. Appl. 2013, 21, 12–29. [Google Scholar] [CrossRef]
- Quansah, D.A.; Adaramola, M.S. Assessment of early degradation and performance loss in five co-located solar photovoltaic module technologies installed in Ghana using performance ratio time-series regression. Renew. Energy 2019, 131, 900–910. [Google Scholar] [CrossRef]
- Pingel, S.; Frank, O.; Winkler, M.; Daryan, S.H.; Geipel, T.; Hoehne, H.; Berghold, J. Potential induced degradation of solar cells and panels. In Proceedings of the 35th IEEE Photovoltaic Specialists Conference, Honolulu, HI, USA, 20–25 June 2010; pp. 002817–002822. [Google Scholar]
- Kaplani, E. Degradation effects in sc-Si PV modules subjected to natural and induced ageing after several years of field operation. J. Eng. Sci. Technol. Rev. 2012, 5, 18–23. [Google Scholar] [CrossRef]
- Vazquez, M.; Rey-Stolle, I. Photovoltaic module reliability model based on field degradation studies. Prog. Photovolt. Res. Appl. 2008, 16, 419–433. [Google Scholar] [CrossRef]
- Jiang, H.; Lu, L.; Sun, K. Experimental investigation of the impact of airborne dust deposition on the performance of solar photovoltaic (PV) modules. Atmos. Environ. 2011, 45, 4299–4304. [Google Scholar] [CrossRef]
- Nimmo, B.; Said, S.A.M. Effects of dust on the performance of thermal and photovoltaic flat plate collectors in Saudi Arabia-Preliminary results. In Alternative energy sources II, Proceedings of the Second Miami International Conference, Miami Beach, FL, USA, 10 December 1979; Hemisphere Publishing Corp: Washington, DC, USA, 1981; Volume 1, pp. 145–152. [Google Scholar]
- Sulaiman, S.A.; Singh, A.K.; Mokhtar, M.M.M.; Bou-Rabee, M.A. Influence of dirt accumulation on performance of PV panels. Energy Procedia 2014, 50, 50–56. [Google Scholar] [CrossRef]
- Munoz, M.A.; Alonso-García, M.C.; Vela, N.; Chenlo, F. Early degradation of silicon PV modules and guaranty conditions. Sol. Energy 2011, 85, 2264–2274. [Google Scholar] [CrossRef]
- Tomčejová, J. Research of Material and Power Degradation of Photovoltaic Panels of Various Types under Operating Conditions. Ph.D. Thesis, TU Košice BERG Faculty, Košice, Slovakia, 2018. [Google Scholar]
- Skoplaki, E.; Palyvos, J.A. On the temperature dependence of photovoltaic module electrical performance: A review of efficiency/power correlations. Sol. Energy 2008, 83, 614–624. [Google Scholar] [CrossRef]
- Hofierka, J.; Kaňuk, J. Assessment of Photovoltaic Potential in Urban Areas Using Open-Source Solar Radiation Tools. Renew. Energy 2009, 34, 2206–2214. [Google Scholar] [CrossRef]


© 2019 by the authors. Licensee MDPI, Basel, Switzerland. This article is an open access article distributed under the terms and conditions of the Creative Commons Attribution (CC BY) license (http://creativecommons.org/licenses/by/4.0/).