Article

A Novel Method for Comprehensive Quality and Reliability Optimization of High-Power DC Actuators for Renewable Energy Systems

School of Electrical Engineering and Automation, Harbin Institute of Technology, Nan Gang District, Harbin 150001, China
*
Author to whom correspondence should be addressed.
Energies 2019, 12(19), 3633; https://doi.org/10.3390/en12193633
Submission received: 28 August 2019 / Revised: 19 September 2019 / Accepted: 23 September 2019 / Published: 24 September 2019

Abstract

:
To better qualify various uncertainties in design and manufacturing, as well as to understand the time-varying degradation process, a novel method of quality and reliable design and optimization for high-power DC actuators was developed in this study that considered relevant uncertainties in design, manufacturing parameters, and the degradation process. Orthogonal transformation was used to normalize heterogeneous uncertainties and the results were quantitatively described by the hyperellipsoid set model. On the basis of the uncertainty quantitative relationship, a fast substitution model was developed for high-power DC actuators with permanent magnet output characteristics of strong non-linearity and insufficient accuracy. The response surface method was used to derive the basis function, and the error between the practical measured values and the calculation values was modified by the radial basis function model. Afterwards, a life cycle global sensitivity analysis method was put forward to determine the design parameters when parameter degradation existed during the life cycle of high-power DC actuators. Then, an optimization model was established considering parameter uncertainties and reliability constraints, and the particle swarm algorithm was used to obtain the solution. Finally, the effectiveness of the proposed method was verified by a case study of high-power DC actuators in electric vehicles.

1. Introduction

Fossil energy types, such as oil, natural gas, and coal, are the world’s main energy source and account for the vast majority of global primary energy consumption. Due to the non-renewability of and environmental pollution caused by fossil fuels, it is imperative to find reliable alternative energy sources and green energy consumption methods. In the field of energy production, energy sources such as wind, water, and solar energy can be recycled quickly without carbon dioxide emissions. They are clean energy sources and represent a reliable solution to replace fossil energy. At the same time, in the field of energy applications, in order to cope with climate change, transportation, as the main source of carbon emissions, shoulders the responsibility of transforming energy consumption and reducing carbon emissions. To meet this demand, the automotive industry is undergoing profound changes, moving from fossil fuel vehicles to hybrids and even electric vehicles [1,2,3].
Photovoltaic power generation, wind power generation, electric vehicle applications, and so forth, can effectively solve the non-renewability and environmental pollution problems of traditional fossil energy. In the past few decades, related technologies have made great progress starting from scratch, even for large-scale applications [4,5,6]. In recent years, with the increase in renewable energy generation and power consumption, as well as the expansion of human life and industrial production, the reliability requirements of related technologies have increased [7,8,9,10]. The operational reliability of power electronic and energy storage devices has become the main cause of failures in photovoltaic power generation, wind power generation, electric vehicles, and electric vehicle charging piles. The high-power DC actuator is the least reliable power electronic device and the worst one in terms of the “wooden barrel principle”. The complicated structure and manufacturing process and the degradation of important parts of the electromagnetic mechanism during operation have resulted in reliability problems for high-power DC actuators, which is an important reason for their poor reliability. However, state-of-the-art methods focus on the efficient conversion and storage of renewable energy [11,12]. Even though they are widely used in power electronics for photovoltaic power generation, wind power generation, and electric vehicles and their associated charging piles (their main applications are shown in Figure 1, for which they play a role in circuit conversion, automatic regulation, safety protection, etc.), high-power DC actuator reliability optimization is rarely mentioned. As a renewable energy source for the storage and power of electronic devices that directs energy flow and system protection during use, its reliability is directly related to the reliability and energy conversion efficiency of the entire renewable energy system. Its quality reliability problems can cause power transmission failures, failures in ensuring that the system is working properly, and even cause major accidents such as fires. Thus, continuously improving product quality and reliability has become a top priority for manufacturers. The main factors affecting product quality and reliability are the uncertainties of design, manufacturing, loads, and degradation. Therefore, efforts have been made to determine how to eliminate the impact of uncertainty factors and degradation on product quality and reliability [13,14].
Comprehensive consideration of various uncertainties and time-varying degradation is important for solving quality and reliability design process issues in the product’s life cycle. The non-probability model is a common method employed for this [15,16,17]. Although the non-probability model improves the optimization effect, it neglects correlations of uncertainties. In order to further improve the optimization effect, scholars have proposed an improved uncertainty quantitative method [18,19,20,21,22], which solves correlations of uncertainties to some extent, but these methods are only effective in a certain distribution and for linear design parameters. In addition, it should be pointed out that these methods only consider uncertainties from the manufacturing process and operational environment, optimize the initial quality, and ignore the degradation progress. Therefore, these methods struggle to assure quality and reliability throughout the product’s life cycle. Subsequently, quality and reliability parameter design methods that can be used for the life cycle optimization of high-power DC actuators have been proposed by means of combining degradation models and experimental designs [23,24,25]. However, since such methods are of low sensitivity in limited experimental programs, it is easy to become trapped in local optimization. To address the difficulty of determining the optimal solution in the experimental design, several reliability sensitivity analysis models that can be used for global optimization of high-power DC actuators have been proposed by means of combining degradation models and sensitivity analysis methods. The introduction of degradation effects, approximation models, and reliability sensitivity analysis methods was done to determine global optimal parameters [24,25,26,27,28,29,30]. The theoretical optimization effect of these methods is quite satisfactory, but the reliability of batch products is still not obvious. The basic reason for the lack of significant improvements in reliability is that the design parameters of current reliability sensitivity analysis methods are only suitable for fixed central points, which are not applicable when the parameters are extended from central values to uncertainties, and the degradation path is not treated as a practical uncertainty factor.
In this study, time domain variation was introduced into the hyperellipsoid set theory. A linear regression model was obtained using the time domain variation method on the basis of the degraded data, and the non-linear uncertainty variables of the non-normal distribution were converted into the standard positive by orthogonal transformation. The state distribution was then combined with the design and manufacturing uncertainty factors to obtain the mixed uncertainty quantitative relationship using the hyperellipsoid set method, which comprehensively considers various uncertainty factors such as design, manufacturing, and work degradation. At the same time, a fast substitution model based on error compensation was proposed. The response surface method (RSM) was used to obtain the basis function based on the finite element method (FEM), and then the radial basis method was used to obtain the error compensation function between the calculated and measured values. On this basis, the problem of calculation accuracy and efficiency was effectively solved. Further, a method for generating fixed-interval columns of uncertainty parameters by the sparse grid integration method was proposed, which extends the application range of W-index global sensitivity to time-varying and interval categories. The optimal design parameters were determined according to the time-varying global sensitivity relationship, completed optimization of quality, and reliability throughout the life cycle. Finally, a high-power DC actuator with a sector permanent magnet (PM) was taken as an example for quality and reliability optimization design, thereby validating the effectiveness of the method proposed in this study.

2. The Proposed Optimization Method

2.1. The Flow of the Method

In this study, probabilistic uncertainty distribution types of design parameters were analyzed. The normal and abnormal distribution types were uniformly transformed into a normal distribution through the orthogonal transformation method. Simultaneously, the time-varying uncertainty parameters of the degradation features were analyzed. The time-varying factors were unified into the same time measurement factors through a time domain model. Sample points within the allowed range of uncertainty parameters of high-power DC actuators were generated by Latin hypercube sampling (LHS), and output characteristics of each sample were obtained by practical measurement. On this basis, hyperellipsoid set analysis was carried out to quantify the uncertainty parameters and their correlations, which laid a foundation for product quality and reliability optimization.
At the same time, in order to improve optimization efficiency and precision, a substitution model based on the practical measurements was proposed in order to quickly and accurately calculate the relationship between the output parameters and characteristics. Sample points (a series of virtual prototypes of high-power DC actuators) within the allowed range of the design parameters of the actuators were generated by LHS, and output characteristics of each prototype were obtained by the FEM. Next, the RSM was adopted to obtain the relationship between each design parameter and output characteristic as the basis function of the substitution model. Meanwhile, the error between the practical measurement results and the basis function results was taken as the interpolation node, and the error function was obtained by the radial basis function (RBF) method. Eventually, the substitution model was obtained from the basis and error functions. The substitution model was able to perform fast calculations, which laid a foundation for the fast calculation of quality characteristics of high-power DC actuators.
To further accurately evaluate the time-varying output characteristics of the products, a life cycle sensitivity analysis method was proposed to determine the critical design parameter when parameter degradation exists during the operation of high-power DC actuators. A fixed-interval array of uncertain parameters was produced by the sparse grid integration method. Moreover, the response variance and conditional response variance was calculated for the parameters in a fixed-interval array. The screening of significant parameters of time-varying output performance and the analysis and evaluation of product performance were thus realized.
Based on the above results, the optimization model was established considering parameter uncertainties and reliability constraints, and the NASA-III intelligent optimization algorithm was used to obtain the solution. Finally, a batch of samples was produced using the Monte Carlo method to verify the quality and reliability. The overall flowchart of the optimization method is shown in Figure 2.

2.2. Quantization of Various Uncertainties

X = ( X 1 , X 2 , , X n ) T is a random uncertainty variable, and n is the number of random uncertainties. The uncertainty set X which contained non-linear factors was transformed into the linear uncertainty Y = ( Y 1 , Y 2 , , Y n ) T through the time domain transformation method. The random variable ( Y R n ) can be described by the probability density function f Y i ( y i ) , Y i f Y i ( y i ) . The random uncertain variables in abnormal distribution were transformed into a standard normal distribution through orthogonal transformation, expressed as U = ( U 1 , U 2 , , U n ) T . The transformation could be mapped to the independent standard normal space by Equations (1)–(3):
μ Z i = Y i Φ 1 [ F Y i ( Y i ) ] σ Y i
σ Z i = ϕ 1 [ Φ F Y i ( Y i ) ] / f Y i ( Y i )
U = d i a g ( λ 1 , λ 2 , , λ n ) 1 A T d i a g ( μ Z i σ Z i , μ Z i σ Z i , , μ Z i σ Z i ) ( Z + d i a g ( μ Z i σ Z i , μ Z i σ Z i , , μ Z i σ Z i ) )
where μ i and σ i are the mean and variance of the random variable Xi, Y i is the design checkpoint, Φ ( · ) is the standard normal cumulative distribution function, Φ 1 ( · ) is the inverse of the standard normal cumulative distribution function, and ϕ ( · ) is the standard normal probability density function.
For the random uncertainty factor Z R n , all possible values of uncertainties can be described by the ellipsoidal parallelepiped model set E:
V E = { V | ( V V ¯ ) T Q   ( V V ¯ ) }
where V ¯ = ( V L + V U ) / 2 is the internal value of the design parameter, V L is the low bounds of V, V U is the upper bounds of V, and Q is the symmetric characteristic matrix which determines the shape and size of the ellipsoidal parallelepiped model:
Q = [ D ( V 1 ) ρ ( V 1 , V 2 ) D ( V 1 ) D ( V 2 ) ρ ( V 1 , V n ) D ( V 1 ) D ( V n ) D ( V 2 ) ρ ( V 2 , V 2 ) D ( V 2 ) D ( V 2 ) ρ ( V 2 , V n ) D ( V 2 ) D ( V n ) D ( V n ) ρ ( V n , V 2 ) D ( V n ) D ( V 2 ) ρ ( V n , V n ) D ( V n ) D ( V n ) ]
where ρ ( V i , V j ) = C o v ( V i , V j ) / D ( V i ) D ( V j ) .
The relation model of various uncertainties was obtained from Equation (4). The parameters are shown in Figure 3, where ①–③ are failure zones without consideration of the correlations of various uncertainties, and ② is the extreme failure zone considering the correlations. The correlations of various uncertainties can significantly improve the accuracy of uncertainty quantification.

2.3. Establishment of Practical Model

The substitution model used in this paper was based on Equation (6). K ( d 1 , d 2 ... d n ) is the basis function acquired by the response surface method, and L ( d 1 , d 2 ... d n ) is the error correction function acquired by the radial basis function method in accordance with the FEM results:
O = K ( d 1 , d 2 ... d n ) + L ( d 1 , d 2 ... d n )
Based on practical measurements, the basis function established the relationship between the output S and the design parameters d 1 , d 2 , …, d n 1 , which is represented by Equation (7):
K = b 0 + i = 1 k b i d i + i = 1 k b i i d i i 2 + i < j k b i j d i d j + ε
The coefficient b = [ b 0 , b 1 , b 2 , ... , b l ] T can be determined by Equation (8):
{ E ( ε ) = j = 1 p { [ p ( D ˜ j ) i = 0 L b i ϕ i ( D ˜ j ) ] 2 } E ( ε ) b i | b i * = 2 D T p + 2 D T D B = 0 B = ( X T X ) 1 X T y
where p = [ p ( X ˜ 1 ) ,   p ( X ˜ 2 ) , , p ( X ˜ i ) ] is the response at P (P > L) test points, and D is the meta-function matrix.
An orthogonal experiment was used to generate samples at the boundary of the design parameters, and practical prototype models were made considering the samples. Then, output characteristics of each prototype model were practically measured and calculated by the basis function. The error values between the practical measured results by the practical prototype models and those gained from the basis function were taken as the critical compensation node. The RBF method was used to obtain the error function L from Equations (9) and (10), of which the type of corresponding correlation function is a Gaussian model:
y ˜ ( d ) = β T φ ( r ) = i = 1 N β i φ ( | | d ˜ d i | | )
β ( d i , d j ) = m = 1 n e ϑ k | d i d j | m h m
R ( x i , x j ) is the Gaussian correlation function, which expresses that the two design parameters d i , d j are correlated, where ϑ m determines how rapid the correlation is lost in the mth design variable, and p m determines the “smoothness” of the function in the mth design variable.

2.4. W-Index Time-Varying Global Sensitivity

The W-index is a global sensitivity index based on variance, which directly reflects the contribution of the input variable to the squared difference of the output performance when all the values are in the range of possible values. It can more comprehensively and accurately reflect contributions of the input variable to the variability of the output characteristics. However, the W-index sensitivity analysis method cannot immediately characterize the contribution of time-varying factors to output performance. The current calculation method is inefficient and difficult to apply directly to life cycle reliability optimization design. In this paper, we introduced time-varying characteristics into the W-index sensitivity analysis method.

2.4.1. Fixed-Interval Array (Ui(t)) of Uncertainty Factor (Ci(t)) is Produced

  • (1) From c i ( 1 ) ( t ) U ( 0 , 1 ) , the n 1 integral nodes c i ( 1 ) ( l ) ( t ) of c i ( 1 ) ( t ) and the corresponding weights ω 1 l ( t )   ( l = 1 , 2 , 3 , , n 1 ) are generated by the sparse grid integration method.
  • (2) From c i ( 2 ) ( t ) U ( c i ( 1 ) ( t ) , 1 ) , the n 2 integral nodes c i ( 2 ) ( l ) ( m ) ( t ) of c i ( 2 ) ( t ) and the corresponding weights ω 2 ( l ) ( m ) ( t )   ( l = 1 , 2 , 3 , , n 1 ; m = 1 , 2 , 3 , , n 2 l ) are generated by the sparse grid integration method.
  • (3) The fixed interval Ui(t) of the input Ci(t) is generated by the sparse mesh integral nodes of c i ( 1 ) ( t ) and c i ( 2 ) ( t ) .
    U i ( t ) = [ U i ( 1 ) ( 1 ) ( t ) U i ( 1 ) ( 2 ) ( t ) U i ( n 1 ) ( n 2 ) ( t ) ] = [ u i ( 1 ) 1 ( t )   u i ( 2 ) ( 1 ) ( 1 ) ( t ) u i ( 1 ) 2 ( t )   u i ( 2 ) ( 1 ) ( 2 ) ( t ) u i ( 1 ) n 1 ( t )   u i ( 2 ) ( 1 ) ( n 2 ) ( t ) ]

2.4.2. Calculation of W-Time-Varying Main Indices

One row was selected from U i ( t ) randomly, that is, the fixed interval U i ( l ) ( m ) ( t ) = [ u i ( 1 ) ( l ) ( ) ( t ) ,   u i ( 2 ) ( l ) ( m ) ( t ) ] ( l = 1 , 2 , n 1 , m = 1 , 2 , n 2 l ) of the given Ci(t). Under this circumstance, Ci(t) can be viewed as a variable in the fixed interval. Next, sample nodes were collected by the sparse grid integral method according to the conditional probability density function f C ( c ) , thus enabling calculation of the time-varying main indices Wi(t):
W i ( t ) = 1 l = 1 n 1 m = 1 n 2 ( l ) ω 1 ( l ) ( t ) ω 2 ( l ) ( m ) ( t ) T z ( t ) ( K , t | Z i ( t ) U i ( l ) ( m ) ( t ) ) T ( K , t )
where T ( S , t ) is the variance of the output characteristic and T z ( t ) ( K , t | Z i ( t ) U i ( l ) ( m ) ( t ) ) is the conditional variance of the output characteristic.
Then, the W-global time-varying sensitivity matrix was calculated. Changes of Wi(t) in the life cycle of high-power DC actuators were put in order and the factors which significantly affect the variance of the output variable were screened out. Specific attention was paid to these significant influencing factors during the optimization design to improve the quality and reliability of the products.

2.5. Construction of the Quality and Reliability Optimization Model

When considering only time-invariant factors, the robust and reliable design method can effectively improve the quality of products but does not significantly improve batch product reliability. In this study, W-index time-varying global sensitivity and the robust and reliable design method were combined to comprehensively consider time-varying uncertainty parameters, with the aim of decreasing the influence of time-varying uncertainty parameters on output characteristics and minimizing the fluctuation of life cycle reliability. The optimization model is as follows:
{ f 1 = min ( max   or   except ) f ( ξ d , ξ , ξ c , ψ ( t ) ) f 2 = min i = 1 n W i ( t ) s . t . R ( t ) [ R ] 0 g i ( ξ d , ξ , ξ c , ψ ( t ) + Δ g i ( ξ d , ξ , ξ c , ψ ( t ) ) 0 ξ Ω n        i = 1 , 2 , 3 , , n
where ξ d represents certain design parameters, ξ is the independent design parameter, ξ c represents coupling parameters, ψ ( t ) represents the time-varying design parameters, f ( · ) represents the objective functions, R(t) is the time-varying reliability, [R] is the stipulated allowable reliability, and g represents the constraint functions.

3. Results

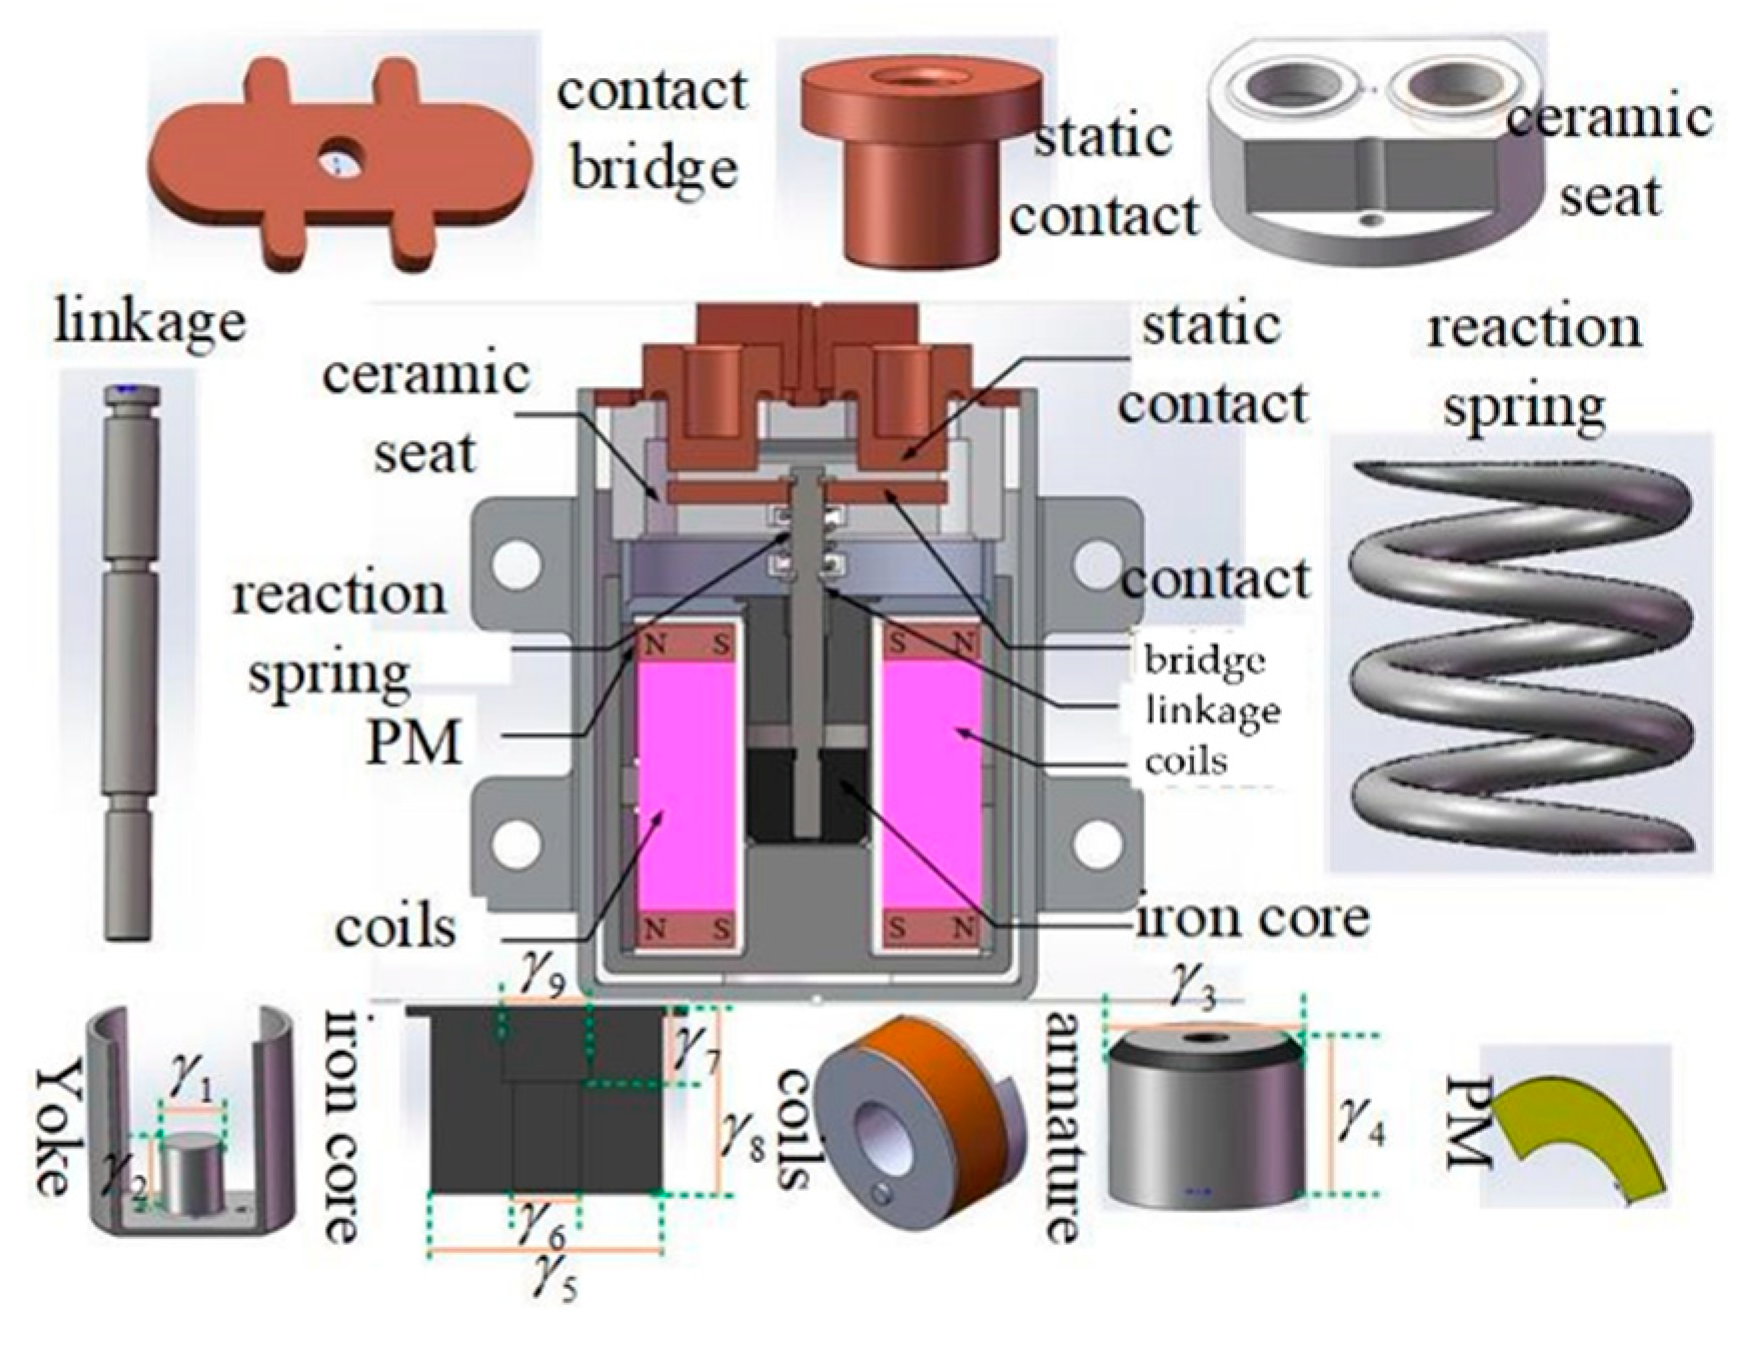
A high-power DC actuator containing sector permanent magnets was selected as the research object in this study; its structure is shown in Figure 3. The actuator was composed of an armature, a linkage, a yoke, an overtravel spring, a reaction spring, a ceramic seat, a static contact, a contact bridge, permanent magnets, a magnetic shell, an interrupter, and coils. The armature movement displacement was 3.0 mm, the coil rated voltage was 28 V, and the rated load was DC 400 V/350 A. The working principle was as follows: (1) Release state: when the armature was in the released state and the coil was not energized, the main magnetic flux path passed through the permanent magnet →magnetic shell→yoke→armature→permanent magnet, and the air gap was obtained near the armature release position and the direction was the same, which provided a comparison. Great retention maintained the release of the armature. (2) Pull-in state: when the coil was supplied with a forward current, the electromagnetic flux passed through the armature, the magnetic shell, and the yoke. As the air gap flux between the coil close to the armature release position and the permanent magnet air gap flux weakened each other, the lower suction force was reduced, and the armature was close to the armature. The air gap flux of the coil at the suction position and the magnetic flux of the permanent magnet were mutually enhanced, so that the upper suction force increased, and the armature moved upward to complete the suction action.
In the design of this high-power DC actuator, the critical design parameters of the output characteristics were screened as follows: permanent magnet retention F1 in the initial position under 0 V, which affected the actuator’s vibration characteristics; electromagnetic force at pull-in voltage F2 in the initial position at 0 V affected the magnitude of the pull-in voltage; and electromagnetic force at rated voltage F3 in the final position affected the bounce at the initial position. The crucial design parameters of the actuator were the yoke diameter ( γ 1 ), yoke height ( γ 2 ), armature diameter ( γ 3 ), armature height ( γ 4 ), core outer diameter ( γ 5 ), core height ( γ 7 ), iron core pole face height ( γ 8 ), and core pole outer diameter ( γ 9 ). The remanence Br of the permanent magnet, the number of permanent magnets, the size of the permanent magnets, the inner diameter of the main surface of the core ( γ 6 = 3.3 mm), the number of coil turns (N = 680), and the resistance ( R res = 40 Ω) were immutable design variables. After orthogonal transformation, the design variables of independent normal distribution were obtained, and the mean and variance were in the range shown in Table 1.
The magnetic material had a spontaneous magnetization according to a magnetic domain distribution below the Curie temperature. Spontaneous magnetization came from the parallel arrangement of spins in the material. With the help of the molecular field, the magnetic domains exceeded the irregularities of the thermal motion and became uniformly oriented, thereby exhibiting magnetic properties. The coils and contacts generated a large amount of heat during the execution of the function. The heat and contact of the coil acted on the permanent magnet by radiation and conduction, causing thermal motion of the magnetic domains inside the permanent magnet, which changed the magnetic domain orientation, so that the permanent magnet exhibited performance degradation, such as the change of Br. Furthermore, the electromagnetic force of the actuator was large at the final point and the armature moved at a very fast speed. In the final position of the armature and the iron core, the initial position of the armature and the yoke maintained a certain collision and friction, so that the armature height γ 2 also underwent a certain degree of degradation and reduction. The above three time-varying features were linearized by time domain variation as follows:
B r ( t ) = B r ( 1 λ 1 t ) , λ 1 = 3.97 × 10 6 / Cycles γ 2 ( t ) = γ 2 ( 1 λ 2 t ) ,   λ 2 = 2.54 × 10 6 / Cycles
A total of 100 groups of samples were produced in the variation range of the design parameters, and substitution models were used to calculate the output characteristics of the samples. Using the hyperellipsoid model, the uncertainties of the design parameters were analyzed. The correlation parameters were the yoke diameter γ 1 , the armature diameter γ 3 , and the armature height γ 4 ; the analysis results are shown in Figure 4 and Figure 5. At the same time, the influence of the hyperellipsoid set model on the sample space was verified. When the various uncertainty correlations were not considered, the sample space size was 3.0. After considering the correlations, the practical sample space was 2.43. The reduction of the sample space can effectively reduce the demand for the sample size in the optimization process, which can further improve the optimization efficiency and accuracy.
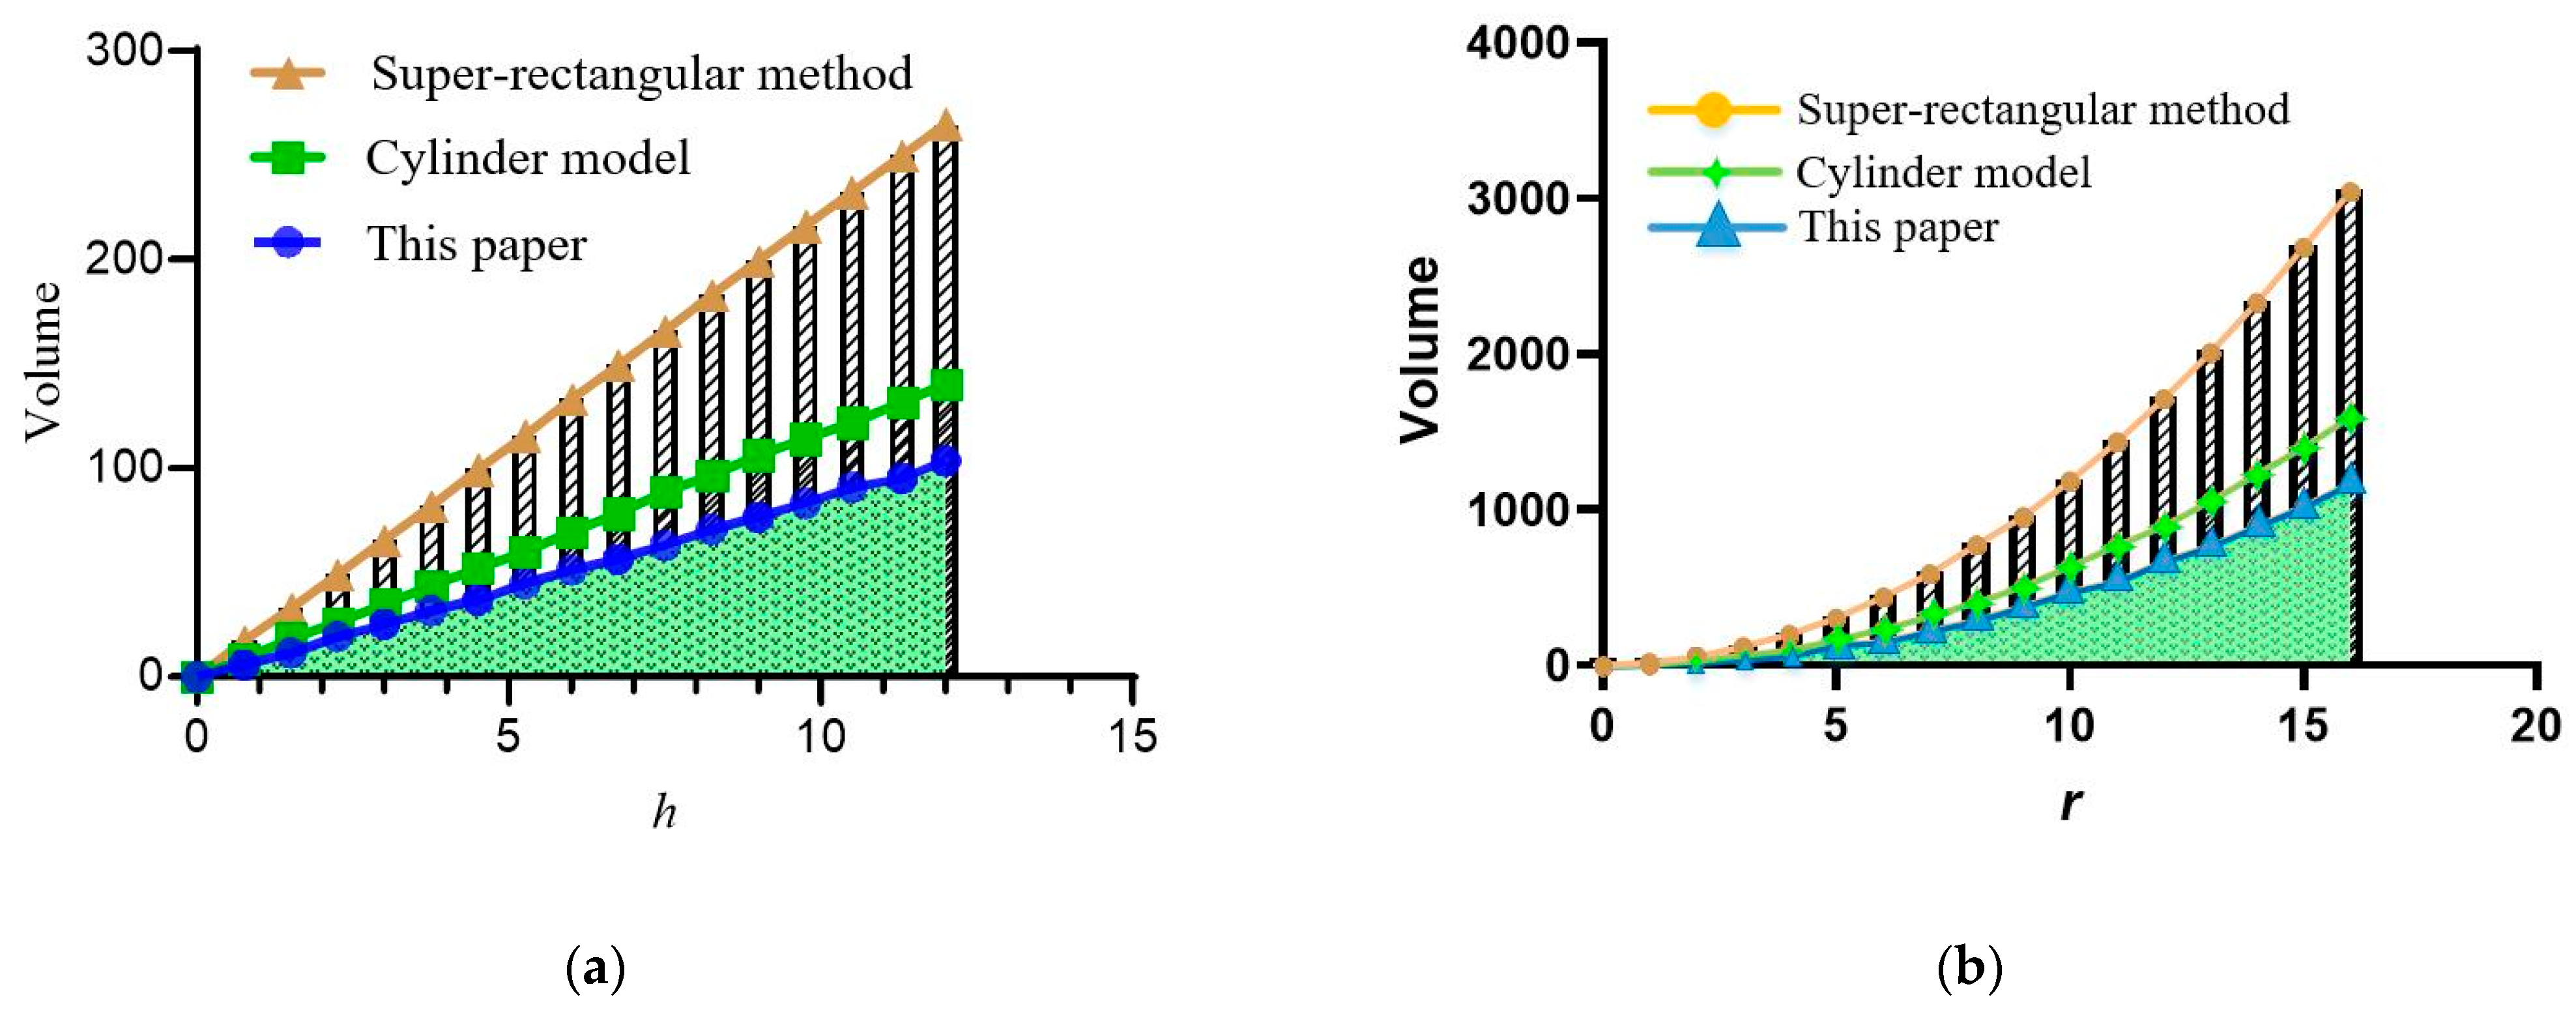
To further verify the superiority of the hyperellipsoid set model, the hyperellipsoid method was compared to state-of-the-art methods (i.e., cylinder set and superpolyhedral set) under different heights and radii; the results are shown in Figure 6. It can be seen from Figure 6, that for the same cylinder, the volume order of the three types of convex set models was Ω this study < Ω cylinder < Ω polyhedral . When the height and radius of the cylinder was small, the difference among the three was not obvious; when the height of the cylinder increased, the volumes of the three methods increased linearly, and the gap between this study’s method and the state-of-the-art methods (i.e., cylinder set and superpolyhedral set) increased. As the radius of the cylinder increased, the volumes of the three methods increased non-linearly and sharply, and the gap between this study’s method and the state-of-the-art methods (i.e., cylinder set and superpolyhedral set) increased. In general, the volume of the ellipsoid model established by this study was smaller than the state-of-the-art methods (i.e., cylinder set and superpolyhedral set), especially for the former, when the cylinder volume was large, the advantage was very obvious.
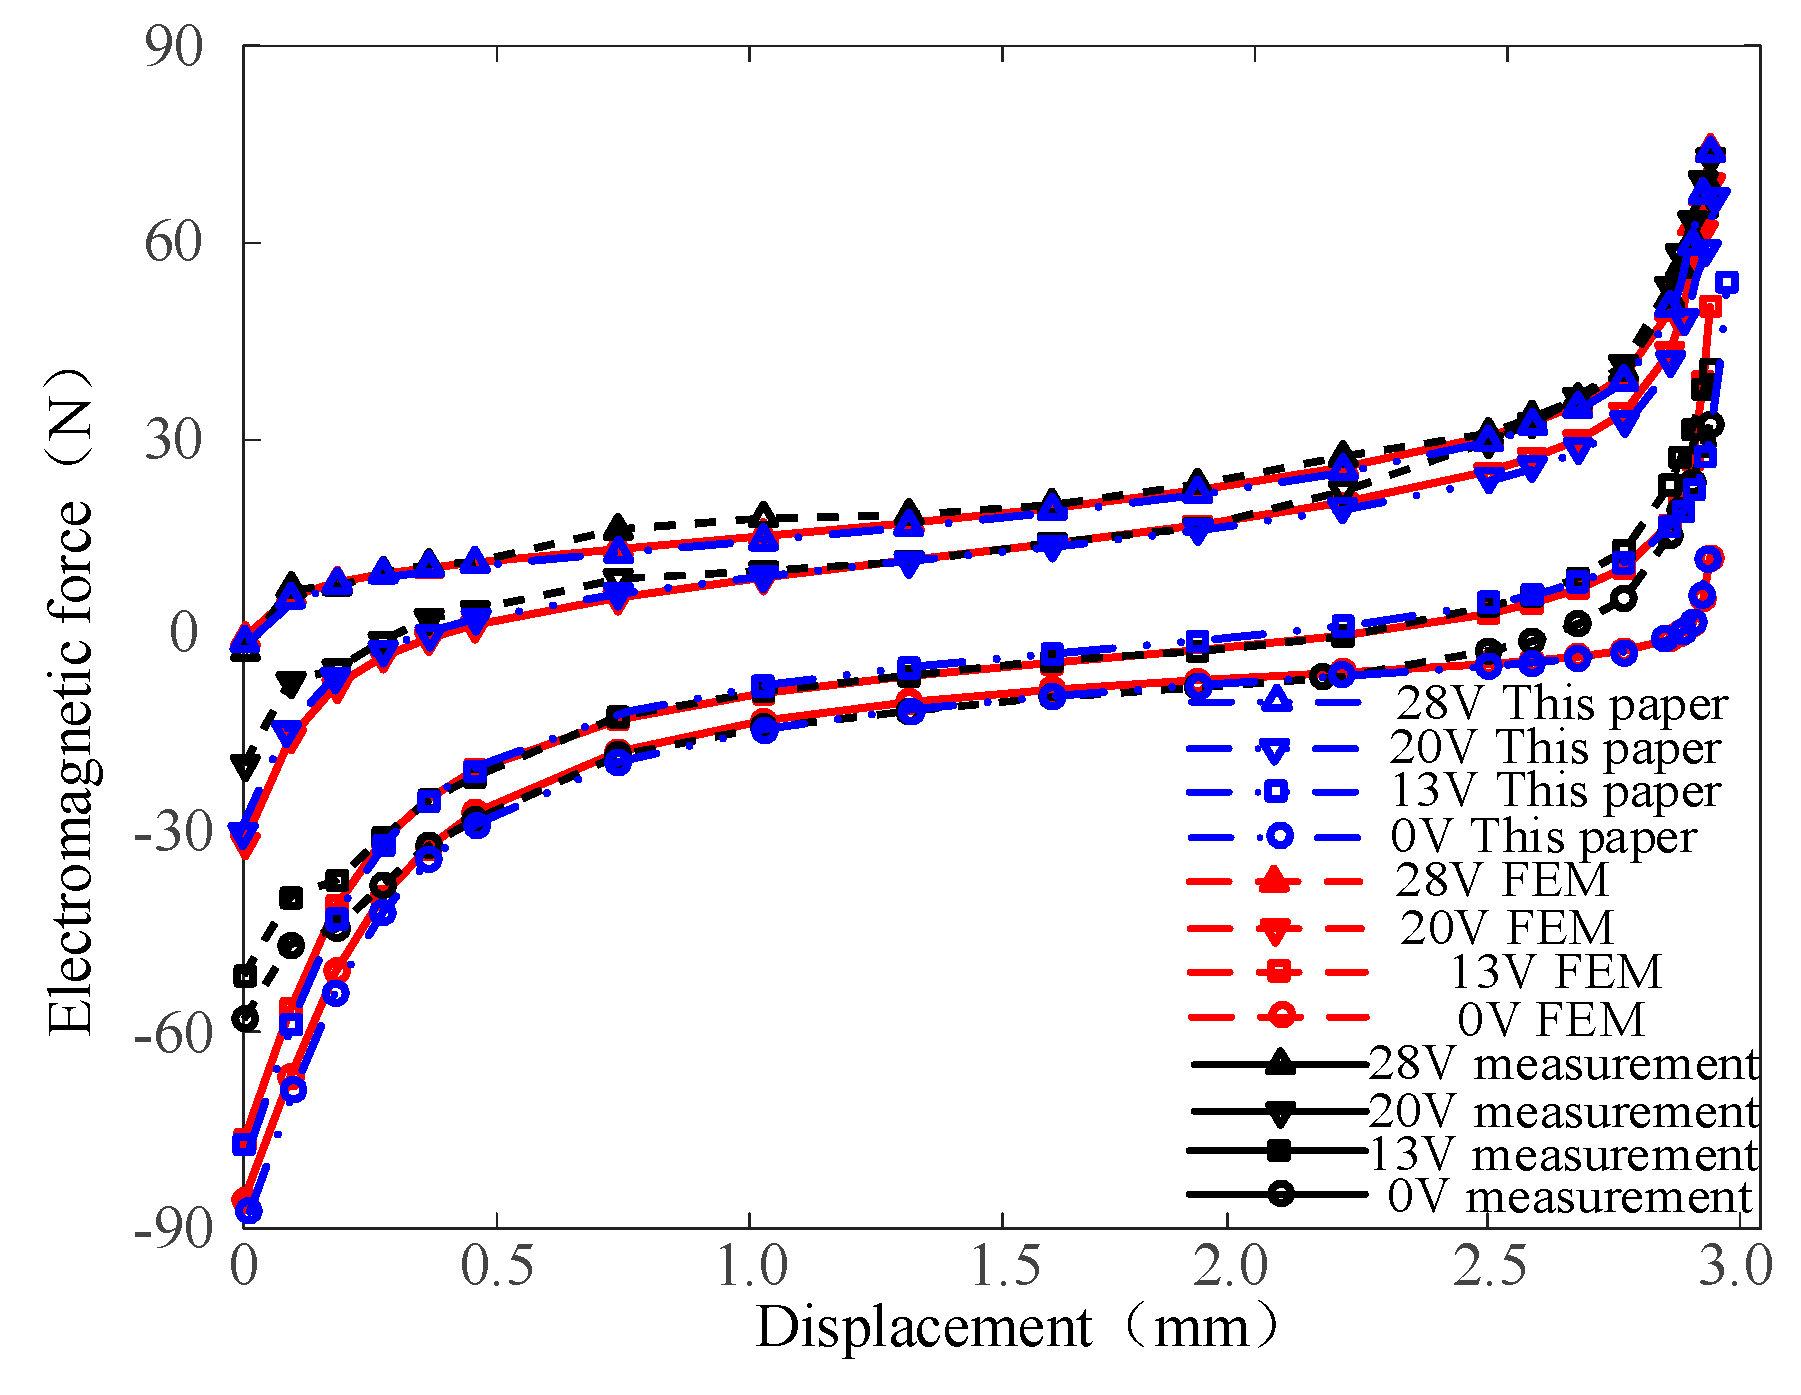
Finite element calculations were compared with the practical measurement results, as shown in the Figure 7. It can be seen that there was a large error between the finite element calculation and the practical measurement results in the initial and final positions; for example, the error reached 32.5% at a pull-in voltage of 13 V in the initial position.
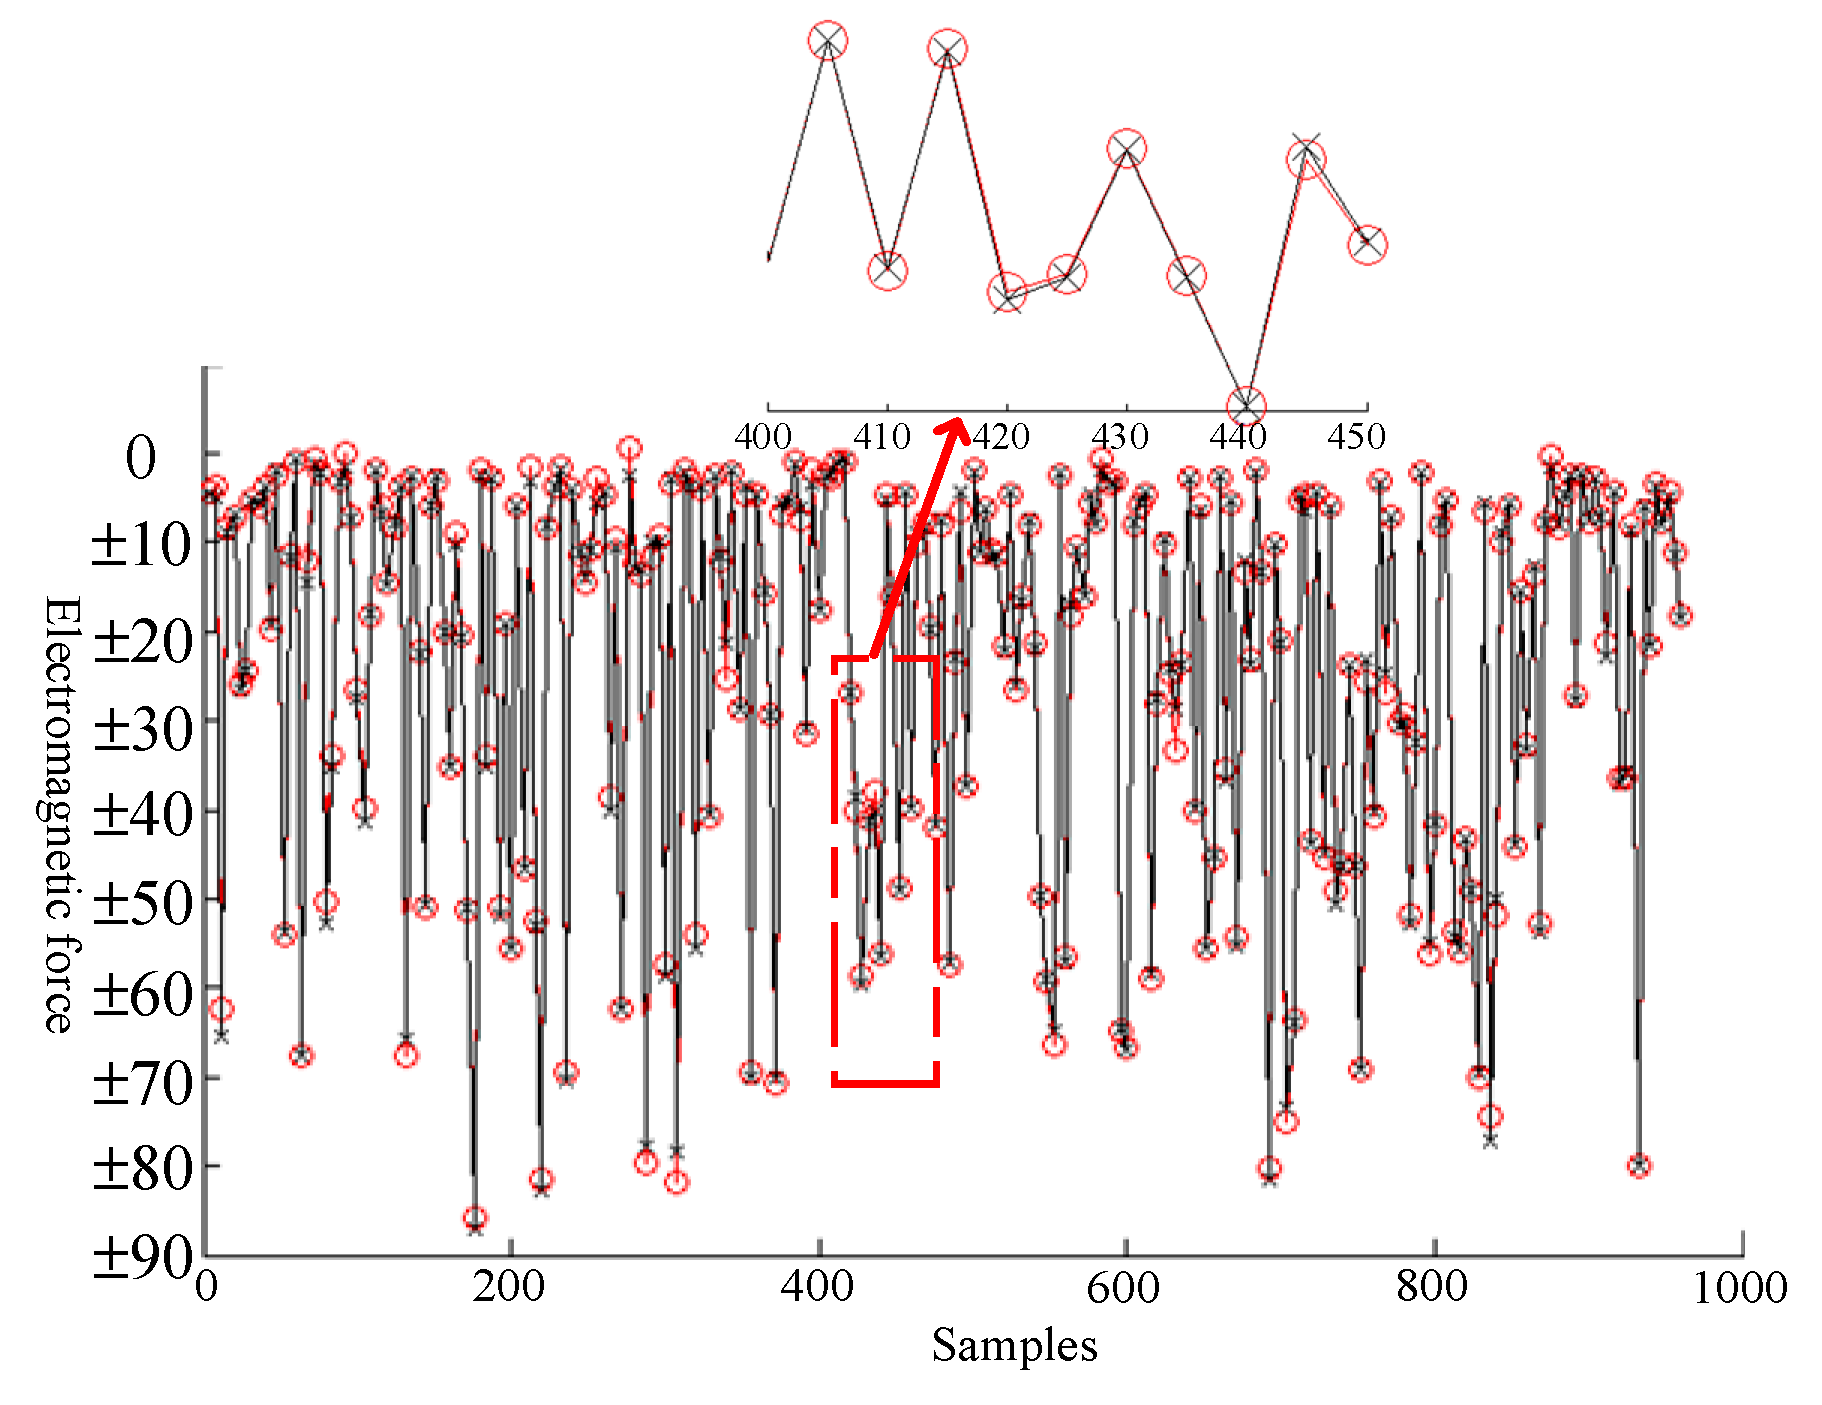
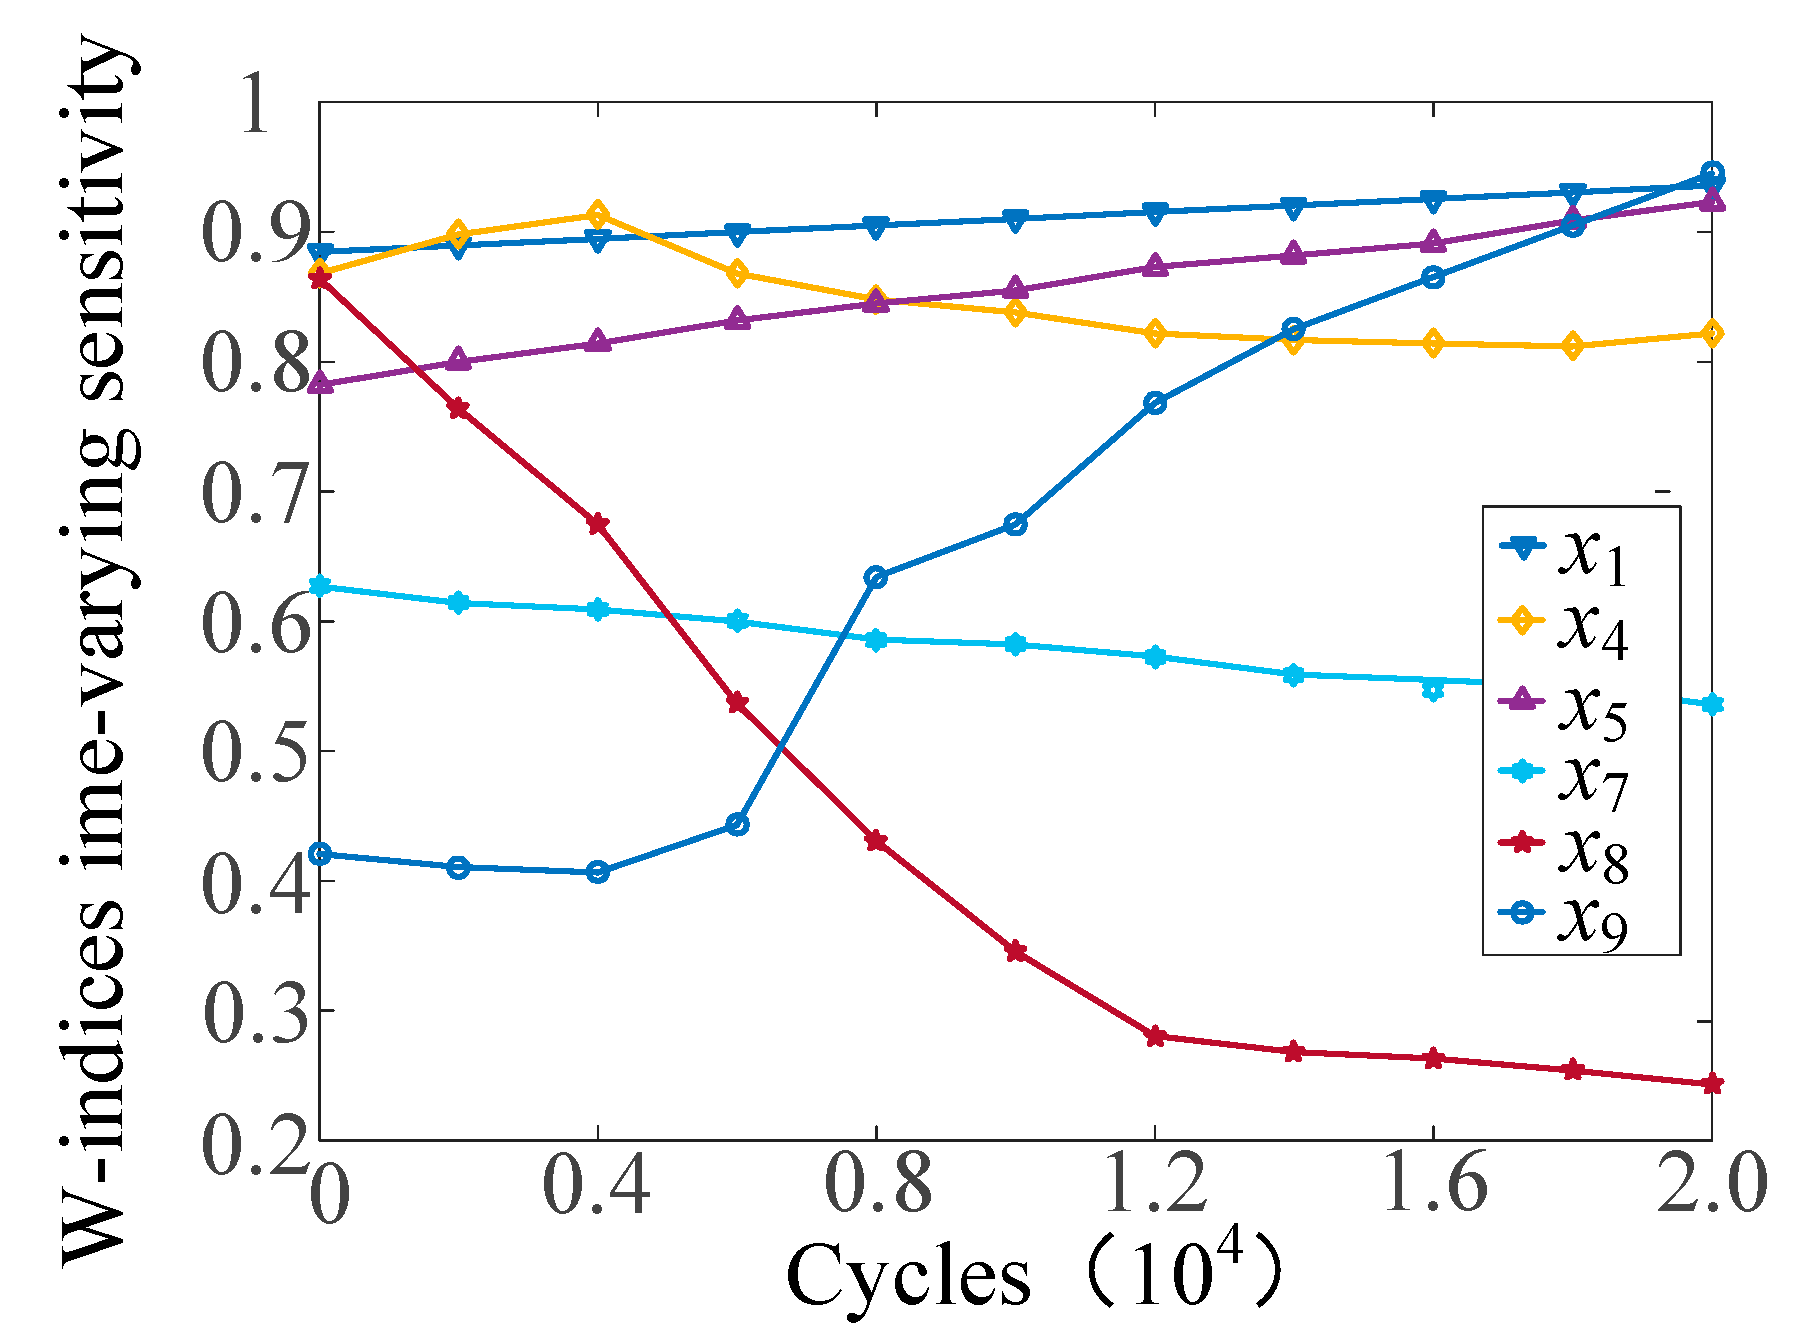
Within the variation range of the design parameters, 120 groups of samples were generated. The output characteristics of the samples were calculated using the substitution model. The W-index global sensitivity values of the design parameters at the initial time and the life cycle were calculated. The calculation results are shown in Figure 8. It can be clearly seen from Figure 8 that the sensitivity changes of γ 1 ,   γ 3 ,   γ 4 ,   γ 5 ,   γ 7 were small during the life cycle; therefore, these parameters can be used as the main design parameters. It also seemed obvious from the sensitivity changes during the life cycle that γ 1 and γ 3 changed dramatically; that is, these parameters were more sensitive to degradation, so the proportion of these parameters was weakened as much as possible during design.
This high-power DC actuator worked normally. F1 was best when large and no lower than 74 N. F2 was best when nominal and no lower than 42 N. F3 was best when small and no more than 4 N. Therefore, the following three constraints could be obtained:
g 1 ( x 1 , x 2 , , x 9 , B r , N , R ) = 74 F 1 0 g 2 ( x 1 , x 2 , , x 9 , B r , N , R ) = 42 F 2 0 g 4 ( x 1 , x 2 , , x 9 , B r , N , R ) = F 3 4 0
The reliability of this high-power DC actuator after 20,000 cycles of operation was no lower than 0.9. The higher the reliability, the better. The constraint was
P ( g i ( x 1 , x 3 , x 8 , x 2 ( t ) , B r ( t ) , N , R ) 0 , t [ 0 , 2 × 10 4 ] ) 0.9
The quality and reliability optimization model of this electromagnetic device was formed using Table 1 and Equations (15) and (16):
f 2 = min i = 1 n W i ( t ) s . t .   P ( g i ( γ 1 , γ 3 , , γ 9 , x 2 ( t ) , B r ( t ) , N , R ) 0 , t [ 0 , 2 × 10 4 ] ) 0.9 g i ( γ 1 , γ 3 , , γ 9 , B r , N , R ) + Δ g i ( γ 1 , γ 3 , , γ 9 , B r , N , R ) 0 ,   i = 1 , 2 , 3 5.22 γ 1 6.38 ( mm ) ,   4.59 γ 2 5.61 ( mm ) ,   4.41 γ 3 5.39 ( mm ) , 6.84 γ 4 8.36 ,   0.055 σ γ 1 0.075 , 0.16 σ γ 2 0.2 , 0.05 σ γ 3 0.07 , 0.06 σ γ 4 0.07 ,   2.97 γ 6 3.63 ( mm ) , 3.6 γ 7 4.4 ( mm ) ,   6.84 γ 8 8.36 ( mm ) ,   3.42 γ 9 4.12 , 0.13 σ γ 6 0.17 ,   0.045 σ γ 7 0.06 ,   0.13 σ γ 8 0.17 , 0.045 σ γ 9 0.055 , 1.1 B r 1.25 ( T ) ,   30 R 6 50 ( Ω ) B r ( t ) = B r ( 1 k 1 t ) , k 1 = 3.97 × 10 6 / Cycles γ 2 ( t ) = γ 2 ( 1 k 2 t ) ,   k 2 = 2.54 × 10 6 / Cycles
The optimization model (11) was solved by the particle swarm algorithm, and the solution of the optimization model obtained the optimal design parameters. The proposed method was compared with the method in Reference [28]. Comparison of the results before and after optimization is listed in Table 2 and Figure 9. In Reference [28], they considered the influence of design, manufacturing, and degradation uncertainties. For F1 and F3, which were the main effects of Br and γ 2 degradation, the reliability of the high-power DC actuator was conspicuously improved. However, the optimization process did not end with the correlations among the various uncertainties. In this study, the correlations among various uncertainties regarding design, manufacture, working environment, and degradation were considered comprehensively, which further improved F1 and F3 and considerably enhanced F2, which made the high-power DC actuator more insensitive to degradation factors and further improved its reliability. The reliability of the high-power DC actuator in an electric vehicle after 20,000 cycles of operation is shown in Figure 10. The proposed method increased the reliability of the original product from 0.516 to 0.907, which was better than the State-of-art method (0.8514). The optimization results provide a safety guarantee for the reference of electric vehicles. In the field of solar energy and wind power generation, high-power DC contactors are more widely used, and the improvement of life cycle time-varying reliability has a more significant impact on the reliability of the whole system and the stability of energy conversion and transmission.
The W-indices could more accurately characterize the impact of design parameter fluctuations on the output characteristics. The time-varying analysis results of the W-indices before and after optimization are shown in Figure 10. Obviously, the W-indices of the optimized products were not only significantly reduced compared with the original products, but the W-indices also slightly changed throughout the life cycle. As a result, the initial performance of the product after optimization was relatively enhanced, and anti-time-varying uncertainty performance improved significantly.
On the basis of the theoretical verification of the reliability optimization effect of the high-power DC actuator, according to the optimization results, 200 actuators of this type were made. We designed and constructed an experimental apparatus for the actuators, which included a high-power DC supply, a high-power DC load, a temperature and humidity chamber, an actuator control, and a protection and life information collection system. The experimental apparatus is shown in Figure 11. A life cycle test of the 200 actuators was carried out using the illustrated apparatus. When the life cycle test ended, the statistical actuator life cycle reliability information was gathered, and the experimental reliability was compared with the theoretical; the results are shown in Figure 12.
It can be seen from Figure 10 that the reliability of the 200 practical products during 20,000 cycles was very close to the theoretical value of the optimization results, which further validated the effectiveness of the proposed method. However, when the life cycle of the actuators reached 24,000 cycles, the experimental results greatly deviated from the theoretical, and some products did not reach the optimization theoretical result. This deviation was mainly due to the actuators in the production assembly process. It is difficult to ensure that the individual assembly parameters are strictly consistent. This indicates that the robust design of high-power DC actuators for renewable energy is necessary for subsequent research.

4. Conclusions

As power electronic devices with high transmission energy and high isolation depth, high-power DC actuators are widely used in renewable energy power generation and electric vehicles. Precise quantification of uncertainties of various sources and types, substitution models, and efficient and accurate analysis of time-varying parameters are crucial issues affecting design optimization. To address the issues regarding life cycle quality and reliability optimization for high-power DC actuators, orthogonal and time domain transformations were introduced into a hyperellipsoidal model for the efficient quantization of uncertainties. Practical measurement results were introduced into the error correction of the substitution model, and the W-index global sensitivity method was also improved to make it suitable for interval and time-varying uncertainty parameters. The results are as follows:
  • Quantification of uncertainties is inappropriate under certain conditions (e.g., correlation and high-dimensional parameters). Accurate quantification of uncertainties directly affects the optimization design effect. In this study, degradation uncertainties were introduced into the life cycle quality and reliability design process. The time domain and orthogonal transformations were introduced into the hyperellipsoidal method. The application example showed that the distribution space of the correlation uncertainties was reduced by 19%, effectively improving quality and reliability for optimizing the model’s accuracy and efficiency.
  • Calculation accuracy is the deficiency under certain conditions (e.g., initial and final position) when adopting the FEM to calculate the output characteristics of high-power DC actuators (especially with PMs). The precision of a substitution model established on this basis struggles to satisfy the demands of quality and reliability in design optimization. In this study, practical measures were introduced into the correction of the substitution model after establishing the basis function through the RSM. The application example calculation showed that the maximum error of calculation was reduced from 32.5% to 2.6% after adopting the RBF method and practical measurement results for error correction.
  • A modified W-index global sensitivity analysis method was proposed using sparse grid integration. The W-index time-varying sensitivity analysis method was extended from fixed points to the interval. This method can be used to calculate the variation of parameters under uncertainties and time-varying effects. The application example showed that the key parameters were the yoke diameter γ 1 , the armature diameter γ 3 , and the armature height γ 4 . Those parameters should be fully considered during design optimization and manufacturing to ensure the quality and reliability of the product during its life cycle.
  • Considering the time-varying reliability requirements of high-power DC actuators, a quality and reliability optimization model for the life cycle of high-power DC actuators was constructed. The output characteristics of the product improved by 28.9% after optimization. The initial and optimized values of the W-index time-varying global sensitivity of the product decreased significantly, indicating that the consistency of the product was significantly improved. Further, the reliability of the high-power DC actuators after 20,000 operations increased by 55.16%.

Author Contributions

Conceptualization, G.Z. and H.C.; methodology, J.D.; software, H.L.; validation, J.D., H.C. and X.Y.; formal analysis, G.Z.; investigation, J.D.; resources, H.C.; data curation, H.C.; writing—original draft preparation, H.C.; writing—review and editing, J.D.; visualization, H.C.; supervision, X.Y.; project administration, G.Z.; funding acquisition, G.Z.

Funding

This research was funded by National Key R&D Program of China (grant number 2017YFB1300800) and the National Natural Science Foundation of China (grant number 61671172) and the APC was funded by Harbin Institute of Technology.

Conflicts of Interest

The authors declare no conflict of interest.

References

  1. Yao, J.; Zhang, Y.; Yan, Z.; Li, L. A Group Approach of Smart Hybrid Poles with Renewable Energy, Street Lighting and EV Charging Based on DC Micro-Grid. Energies 2018, 11, 3445. [Google Scholar] [CrossRef]
  2. Astaneh, M.; Roshandel, R.; Dufo-López, R.; Bernal-Agustín, J.L. A novel framework for optimization of size and control strategy of lithium-ion battery based off-grid renewable energy systems. Energy Convers. Manag. 2018, 175, 99–111. [Google Scholar] [CrossRef]
  3. Hou, H.; Xue, M.; Xu, Y.; Tang, J.; Zhu, G.; Liu, P.; Xu, T. Multiobjective Joint Economic Dispatching of a Microgrid with Multiple Distributed Generation. Energies 2018, 11, 3264. [Google Scholar] [CrossRef]
  4. Da Luz CM, A.; Tofoli, F.L.; dos Santos Vicente, P.; Vicente, E.M. Assessment of the ideality factor on the performance of photovoltaic modules. Energy Convers. Manag. 2018, 167, 63–69. [Google Scholar] [CrossRef]
  5. Garoudja, E.; Chouder, A.; Kara, K.; Silvestre, S. An enhanced machine learning based approach for failures detection and diagnosis of PV systems. Energy Convers. Manag. 2017, 151, 236–249. [Google Scholar] [CrossRef]
  6. Liu, K.; Li, K.; Ma, H.; Zhang, J.; Peng, Q. Multi-objective optimization of charging patterns for lithium-ion battery management. Energy Convers. Manag. 2018, 159, 151–162. [Google Scholar] [CrossRef]
  7. Chen, K.; Zhao, F.; Hao, H.; Liu, Z. Synergistic Impacts of China’s Subsidy Policy and New Energy Vehicle Credit Regulation on the Technological Development of Battery Electric Vehicles. Energies 2018, 11, 3193. [Google Scholar] [CrossRef]
  8. Lyshevski, S.E. Microstepping and high-performance control of permanent-magnet stepper motors. Energy Convers. Manag. 2014, 85, 698–709. [Google Scholar] [CrossRef]
  9. Merchaoui, M.; Sakly, A.; Mimouni, M.F. Particle swarm optimisation with adaptive mutation strategy for photovoltaic solar cell/module parameter extraction. Energy Convers. Manag. 2018, 175, 1726–1739. [Google Scholar] [CrossRef]
  10. Nong, G.; Liu, Y.; Zhu, H.; Li, Y.; Li, P. Energy analysis for an artificial tree generating polymer fuels from water and CO2. Energy Convers. Manag. 2017, 151, 465–471. [Google Scholar] [CrossRef]
  11. Sun, Z.-Y.; Li, G.-X.; Wang, L.; Wang, W.-H.; Gao, Q.-X.; Wang, J. Effects of structure parameters on the static electromagnetic characteristics of solenoid valve for an electronic unit pump. Energy Convers. Manag. 2016, 113, 119–130. [Google Scholar] [CrossRef]
  12. Wang, L.; Li, G.-X.; Xu, C.-L.; Xi, X.; Wu, X.-J.; Sun, S.-P. Effect of characteristic parameters on the magnetic properties of solenoid valve for high-pressure common rail diesel engine. Energy Convers. Manag. 2016, 127, 656–666. [Google Scholar] [CrossRef]
  13. Lowther, D.A. The Development of Industrially-Relevant Computational Electromagnetics Based Design Tools. Ieee Trans. Magn. 2013, 49, 2375–2380. [Google Scholar] [CrossRef]
  14. Abdallh, A.A.; Dupré, L. The Influence of Magnetic Material Degradation on the Optimal Design Parameters of Electromagnetic Devices. IEEE Trans. Magn. 2014, 50, 1–4. [Google Scholar] [CrossRef] [Green Version]
  15. Di Barba, P.; Formisano, A.; Martone, R.; Repetto, M.; Salvini, A. A brief survey of robust optimization. Int. J. Appl. Electromagn. Mech. 2018, 56, 61–72. [Google Scholar] [CrossRef]
  16. Ye, X.; Lin, Y.; Wang, Q.; Niu, H.; Zhai, G. Manufactuing process based storage degradation modelling and reliability assessment. Microelectron. Reliab. 2018, 99–90, 1337–1340. [Google Scholar]
  17. Bai, Y.C.; Han, X.; Jiang, C.; Bi, R.G. A response-surface-based structural reliability analysis method by using non-probability convex model. Appl. Math. Model. 2014, 38, 3834–3847. [Google Scholar] [CrossRef]
  18. Erfani, T.; Utyuzhnikov, S.V. Control of robust design in multiobjective optimization under uncertainties. Struct. Multidisc. Optim. 2012, 55, 339–349. [Google Scholar] [CrossRef]
  19. Antoun, C.A.; Würsch, C.; Köchli, C.; Perriard, Y. Validity Tests of Superposition Principle Based on Forward Model for Electromagnetic Induction Scattering. IEEE Trans. Magn. 2015, 51, 1–4. [Google Scholar] [CrossRef]
  20. Dorica, M.; Giannacopoulos, D.D. Response Surface Space Mapping for Electromagnetic Optimization. IEEE Trans. Magn. 2006, 42, 1123–1126. [Google Scholar] [CrossRef]
  21. Brevault, L.; Balesdent, M.; Bérend, N.; Le Riche, R. Decoupled multidisciplinary design optimization formulation for interdisciplinary coupling satisfaction under uncertainty. Aiaa J. 2016, 541, 186–205. [Google Scholar] [CrossRef]
  22. Hwang, K.-Y.; Lin, H.; Rhyu, S.-E.; Kwon, B.-Y. A Study on the Novel Coefficient Modeling for a Skewed Permanent Magnet and Overhang Structure for Optimal Design of Brushless DC Motor. IEEE Trans. Magn. 2015, 48, 1918–1923. [Google Scholar] [CrossRef]
  23. Montgomery, D.C. Design and Analysis of Experiments; John Wiley & Sons: New York, NY, USA, 2009. [Google Scholar]
  24. Wahdame, B.; Candusso, D.; FranÇois, X.; Harel, F.; PÉra, M.C.; Hissel, D.; Kauffmann, J.M. Analysis of a fuel cell durability test based on design of experiment approach. IEEE Trans Energy Conver. 2018, 23, 1093–1104. [Google Scholar] [CrossRef]
  25. Rathod, V.; Yadav, O.P.; Rathore, A.; Jain, R. Reliability-Based Design Optimization Considering Probabilistic Degradation Behavior. IEEE Trans. Magn. 2013, 49, 2057–2060. [Google Scholar] [CrossRef]
  26. Albunni, M.N.; Rischmuller, V.; Fritzsche, T.; Lohmann, B. Multiobjective Optimization of the Design of Nonlinear Electromagnetic Systems Using Parametric Reduced Order Models. Qual. Reliab. Eng. Int. 2012, 45, 1474–1477. [Google Scholar] [CrossRef]
  27. Myers, R.H.; Montgomery, D.C.; Anderson-Cook, C.M. Response Surface Methodology: Process and Product Optimization Using Designed Experiments; John Wiley & Sons: Hoboken, NJ, USA, 2016. [Google Scholar]
  28. Kurniawan, E.; Cao, Z.; Man, Z. Design of Robust Repetitive Control with Time-Varying Sampling Periods. IEEE Trans Ind Electron. 2017, 64, 1647–1652. [Google Scholar] [CrossRef]
  29. Huang, X.; Zhang, Y. Reliability sensitivity analysis using dimension reduction methods and saddlepoint approximations. Int. J. Numer. Methods Eng. 2013, 93, 857–886. [Google Scholar] [CrossRef]
  30. Ammar, S.I.; Alharbi, Y.F. Time-dependent analysis for a two-processor heterogeneous system with time-varying arrival and service rates. Appl. Math. Model. 2018, 54, 743–751. [Google Scholar] [CrossRef]
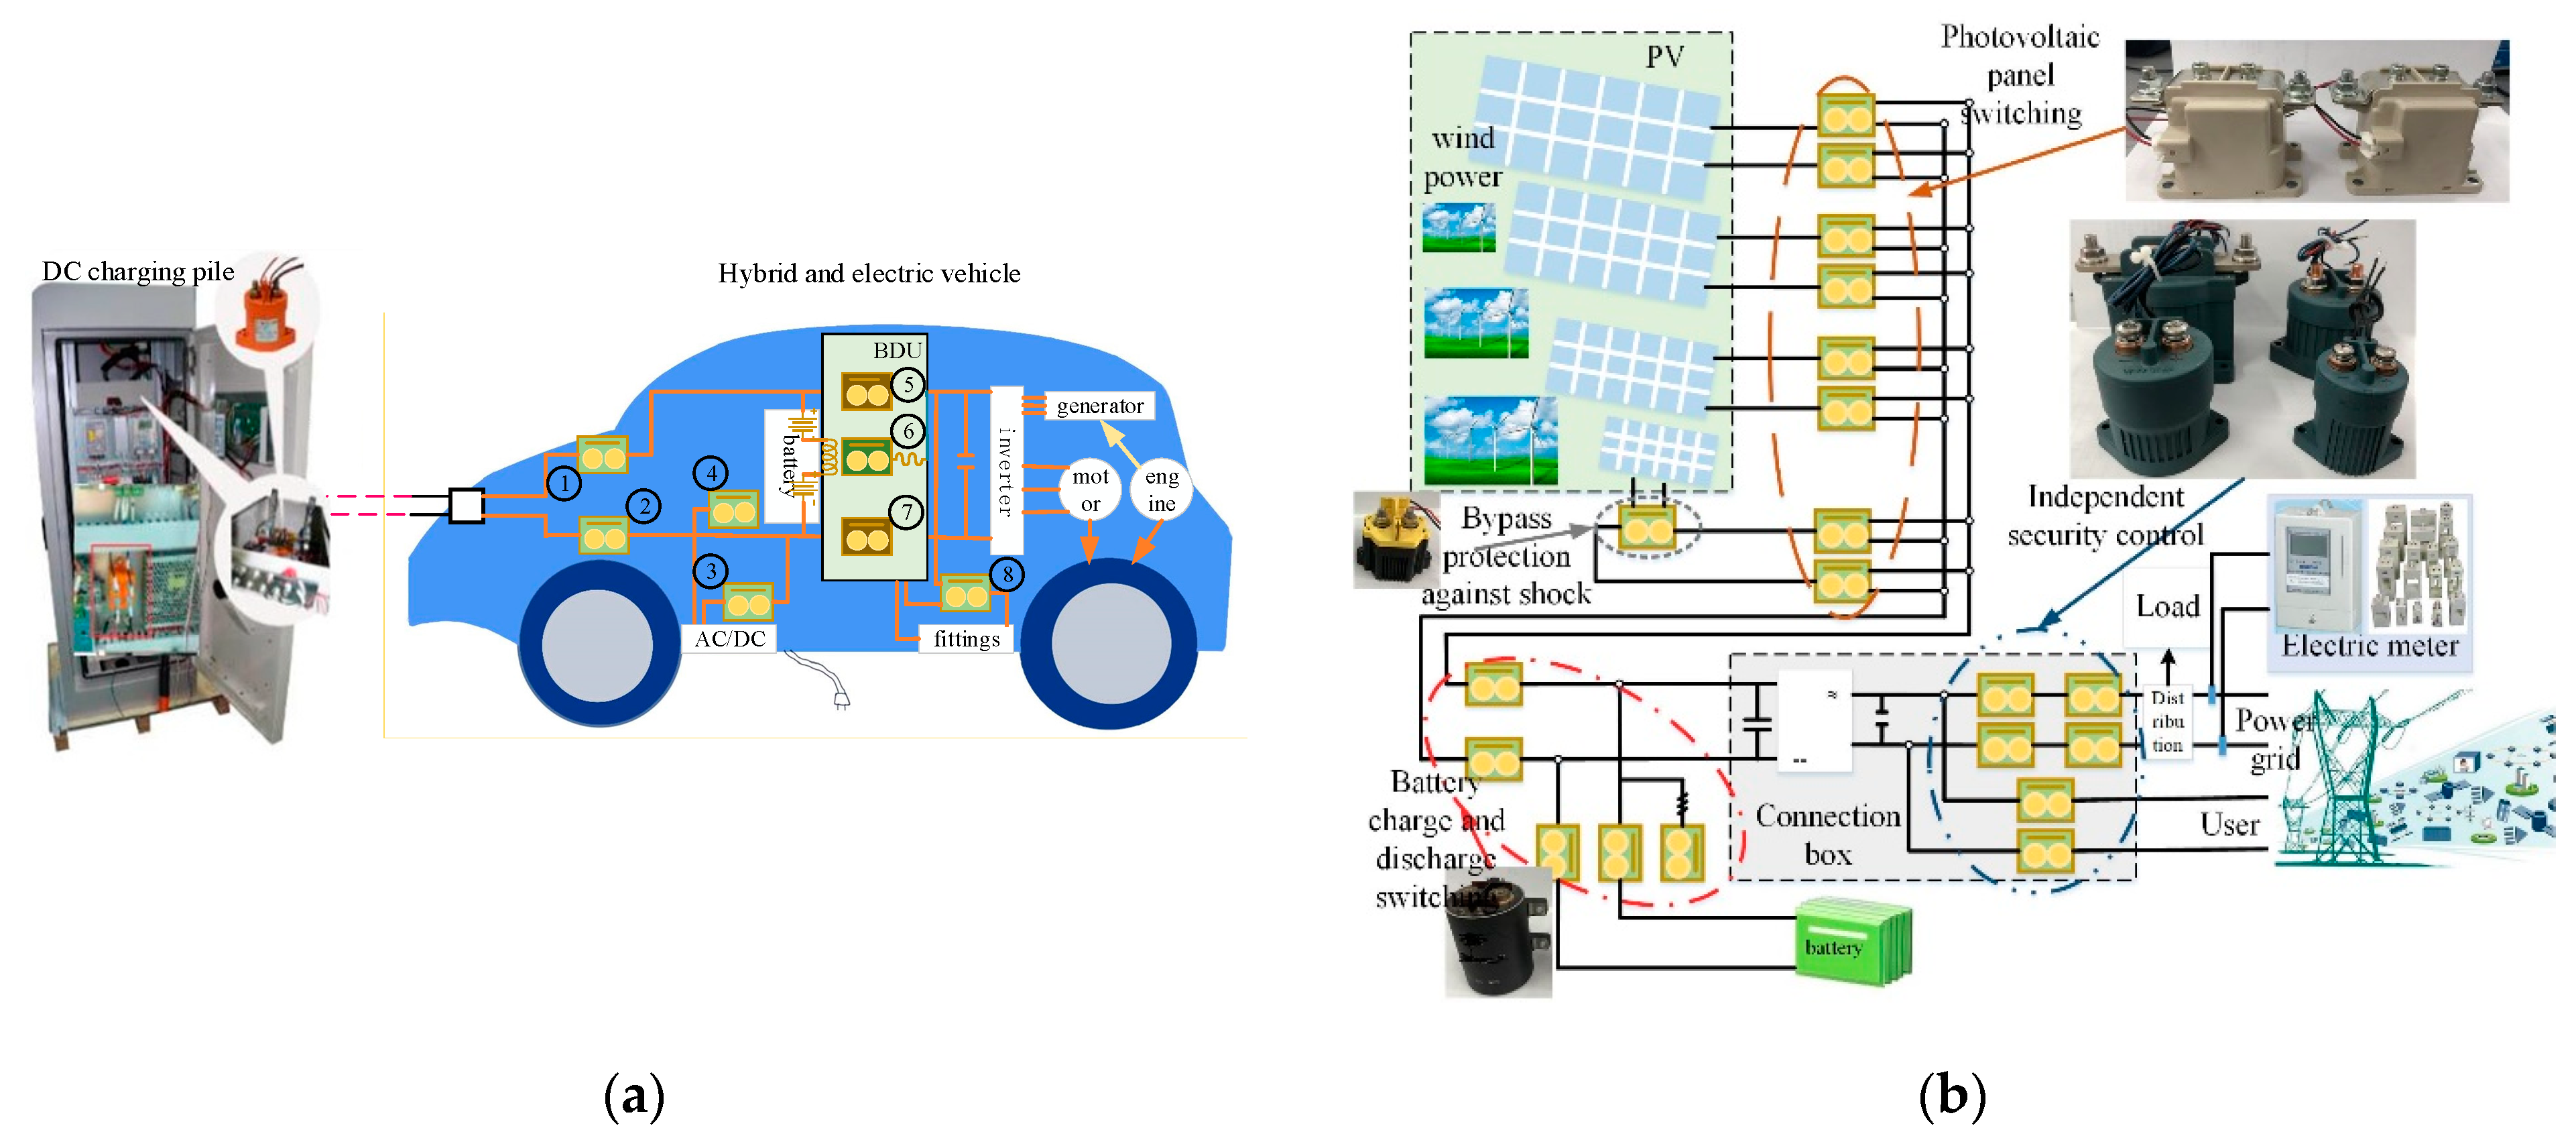
Figure 1. Application of high-voltage DC actuators: (a) application of high-voltage DC actuators in charging piles and electric vehicles; (b) application of high-voltage DC actuators in the field of new energy generation and electricity.
Energies 12 03633 g001
Figure 2. Processes optimization and design.
Energies 12 03633 g002
Figure 3. Hyperellipsoid set model.
Energies 12 03633 g003
Figure 4. Electromagnetic device with double magnet.
Energies 12 03633 g004
Figure 5. Correlations of uncertainties.
Energies 12 03633 g005
Figure 6. Different model volume comparisons: (a) model volume at different heights and (b) model volume at different radii.
Energies 12 03633 g006
Figure 7. Comparison between measurements and the substitution model.
Energies 12 03633 g007
Figure 8. Random error comparison.
Energies 12 03633 g008
Figure 9. Random error comparison.
Energies 12 03633 g009
Figure 10. Comparison of optimization results: (a) W-Indices comparison (b) Reliability comparison of different method.
Energies 12 03633 g010
Figure 11. The experimental apparatus.
Energies 12 03633 g011
Figure 12. Practical and theoretical comparison.
Energies 12 03633 g012
Table 1. Design parameters’ allowable range.
Design ParametersMean (mm)Variance
γ 1 5.80.068
γ 2 5.10.18
γ 3 4.90.063
γ 4 7.60.063
γ 5 5.80.068
γ 6 3.30.15
γ 7 4.00.052
γ 8 7.60.154
γ 9 3.80.05
Table 2. Comparison of optimization results.
MethodF1 (N)F2 (N)F3 (N)Reliability
Original product75.3 (0%)44.6 (0%)2.69 (0%)0.591
State-of-art (Rise Rate)92.2 (35.2%)47.2 (5.83%)1.78 (33.8%)0.854
Proposed Method (Rise Rate)87.6 (16.4%)57.5 (28.9%)2.12 (10.4%)0.917