Abstract
This study, firstly, provides an up-to-date global review of the potential, technologies, prototypes, installed capacities, and projects related to ocean renewable energy including wave, tidal, and thermal, and salinity gradient sources. Secondly, as a case study, we present a preliminary assessment of the wave, ocean current, and thermal gradient sources along the Brazilian coastline. The global status of the technological maturity of the projects, their different stages of development, and the current global installed capacity for different sources indicate the most promising technologies considering the trend of global interest. In Brazil, despite the extensive coastline and the fact that almost 82% of the Brazilian electricity matrix is renewable, ocean renewable energy resources are still unexplored. The results, using oceanographic fields produced by numerical models, show the significant potential of ocean thermal and wave energy sources in the northern and southern regions of the Brazilian coast, which could contribute as complementary supply sources in the national electricity matrix.
1. Introduction
Only 14% of the world’s primary energy matrix originates from renewable resources (based on the 2016 database), and this value is about 25% for the electrical energy sector [1]. The immediate needs to limit climate change and achieve sustainable growth are two key drivers of global energy transformation. Consequently, it is estimated that the share of renewable energy sources in the electrical energy sector will increase from 25% in 2017 to 85% in 2050 [1], in which ocean renewable energy sources including wave, tidal, thermal, and the salinity gradient will be responsible for the 4% of the total electricity generation. However, new approaches to power system planning, system and market operations, and regulations and public policy will be required to obtain that goal. As the contribution of low-carbon electricity becomes significant and it becomes the preferred energy carrier, the share of electricity consumed in the end-use sectors will need to increase from approximately 20% in 2015 to 40% in 2050 [1]. Electricity generation using coal, oil, gas, hydroelectric, nuclear, and bioenergy is predicted to decline from 2015 to 2050. On the other hand, a rapid evolution associated with the use of renewables like wind, geothermal, solar, ocean renewable energy, and concentrated solar power (CSP) will likely be observed. International Renewable Energy Agency (IRENA) showed that the sources of renewable electricity in 2050 will be dominated by solar and wind power plants, highlighting significant growth associated with the geothermal, CSP, and ocean renewables.
Although Brazil is currently one of the world´s cleanest energy suppliers, there are some concerns associated with the country´s energy sustainability. An increasing demand for energy, mainly fossil fuels, expanding oil production, a bioenergy sector struggling with expansion, fast growth of energy-related greenhouse gas emissions, and energy efficiency performance deterioration are the current trends that put the future of the country’s sustainable energy performance at risk [2].
Brazil is the world’s eighth-largest economy with a population of close to 210 million and a land area expansion the size of about two times the European Union [2,3]. With a domestic energy supply of about 292.1 million tons of oil equivalent (Mtoe) in 2017, it is one of the largest energy producers in the world [4]. The Energy Research Office (EPE) of Brazil estimated a domestic electricity supply of 624.3 TWh in 2017, and this was mainly produced by the hydropower plants.
The Brazilian electrical and energy matrices are predominately based on renewable energy sources, which means that, in addition to having lower operating costs, a much lower greenhouse gas effect is emitted in association with energy production and consumption. For instance, in 2017, the total anthropogenic emissions of the Brazilian energy mix was estimated at approximately 435.8 million tons of equivalent carbon dioxide (Mt CO2-eq), of which the transport sector emitted the largest part (199.7 Mt CO2-eq) [4]. Based on the data presented by the International Energy Agency (IEA) [5], each Brazilian issued an average of 2.1 t CO2-eq, considering the production and consumption of energy in 2017. This is three times less than that of a European or Chinese citizen and about seven times less than an American citizen.
By meeting almost 45% of its primary energy demand from renewable resources, Brazil has the least carbon-intensive energy sector in the world [6]. Figure 1a shows the domestic energy supply breakdown for Brazil for 2017. Petroleum and oil products, with a share of 36.4%, had the largest contribution to energy supply, followed by sugarcane biomass (17%). Natural gas (13%) and hydraulic energy were other players in the energy matrix of Brazil. Black liquor contributed 50.6% of the “other renewables” sector, followed by wind (21.3%), biodiesel (19.7%), other biomasses including rice husk, elephant grass, and vegetable oil (6.5%), charcoal industrial gas (0.4%), biogas (1.1%), and solar energy (0.4%). The Brazilian electrical matrix, as shown in Figure 1b, was dominated by hydropower resources with a contribution of approximately 65.2%. The main Brazilian hydroelectric reservoirs are located in the Paraná River basin, South region, featuring the Itaipu plant, which is the second-largest hydroelectric power plant in the world with a capacity of 14 GW [7]. The hydroelectric power plants in Brazil are mostly concentrated in the Midwest, South, and Southeast regions. Several studies have discussed the benefits and challenges of the hydroelectric plants in Brazil [7,8,9,10]. Nevertheless, the remoteness and environmental sensitivity of a large part of the remaining resources are two hurdles that constrain the continued expansion of hydroelectric plants in Brazil [6].
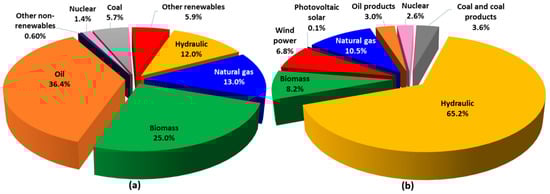
Figure 1.
(a) Domestic Brazilian energy supply and (b) electrical matrix breakdown in 2017.
Brazil already has a significant contribution of renewable energy in its energy and electricity matrix; however, there is an inestimable untapped potential for energy supply from the oceans. Although nearly 80% of the Brazilian population lives near the coast, there has been no in-depth survey on the utility of ocean energy and its conversion into electricity. There have only been a handful of studies associated with the ocean renewable energy potential along the Brazilian coastline, and these have mainly focused on the wave and ocean current energy in some specific regions. Some examples of the studies related to the wave and current energy include those in [11,12,13,14,15,16], which focused on the South and Southeast regions of the Brazilian coast. Moreover, ocean thermal energy conversion (OTEC) resource evaluation of the Southern Brazilian continental shelf is presented in [17]. The EPE, through the National Energy Plan [18,19], established some general roadmaps related to the long-term plan of the Brazilian energy sector. Accordingly, the ocean energy resources, among other alternative energy sources, were suggested as a way to expand the Brazilian energy matrix in the coming decades. This was also emphasized by the National Agency of Electric Energy through a roadmap project performed by the Center of Management and Strategic Studies of Brazil in 2017 [20].
2. Targets, Materials, and Methods
In Brazil, mapping of the ocean renewable energy resources through a detailed survey of all resources is required to identify potential areas for exploration and, consequently, encourage the development of technologies through the implementation of socio-economically feasible and acceptable projects. Using this perspective, this article firstly presents an overview of the global potential of ocean renewable energy resources and the associated technologies for harnessing such energy. Then, in the second part, the global status of technology maturity is presented through a wide survey of projects, which are at different stages of development. This shows the current global installed capacity for different energy sources, as well as pointing out the more promising technologies through the global interest trend. The third part presents an assessment of the ocean renewable energy resources including ocean currents, waves, and thermal gradients along the Brazilian coastline. This is a preliminary effort aimed at indicating the potential energetic regions. Further detailed works are required to investigate these locations. The methodology applied in this study consists of the use of oceanographic fields produced by hydrodynamic models to estimate the potential of the energy resources. Modeling is performed for a data resolution (one regular horizontal grid) of 1/12° (~9 km). The study reveals the theoretical potential (available energy at sea and not what can be captured) of the resources as well as their seasonal and temporal variability. Finally, the main Brazilian projects are presented, and the challenges are discussed.
2.1. Study Area
The Brazilian coastline is more than 7400 km in length and is situated between 04°52′45″N (Oiapoque River) and 33°45′10″S (Chuí River). The marine areas under Brazilian jurisdiction include the Territorial Sea, with a limit of 12 nautical miles; the Exclusive Economic Zone (EEZ), with 12 to 200 nautical miles; and the Continental Shelf, which comprises the seabed that extends beyond the Territorial Sea, along the natural extension of the land territory off the continental shelf.
The extent of the Brazilian continental shelf varies along the coast, with a few kilometers (~8 km) near Bahia and up to 300 km on the coast of the State of Pará, with a range between 60 and 180 m [21,22]. The Brazilian coastline is characterized by intraseasonal fluctuations in the upper ocean circulation due to several dynamic processes, such as the local forcing dynamics, the remote forcing of winds via waveguide dynamics, the average flow instability, and the resonance as a function of the coastline geometry [23,24]. The ocean circulation is dominated by the Subtropical Turn (Equatorial South Current, SEC) and the Antarctic Circumpolar Current [25]. The SEC is responsible for transporting the water from the Benguela Current to the Brazilian platform (about 10°S and 20°S), where it passes through a fork in the North Brazil Current (NBC) and the Brazil Chain (BC) to the south. Due to this circulation, the western margin of the tropical South Atlantic is a particularly interesting region for the observation of thermohaline circulation [21,22,23,24,26].
As illustrated in Figure 2, the study area included the Brazilian coastline inside the EEZ, which is divided into four regions A, B, C and, D, according to both hydrodynamic and atmospheric characteristics. Table 1 shows the regions and the corresponding latitudes.
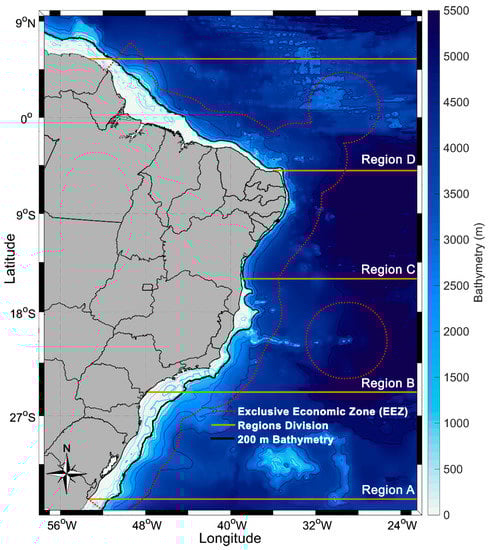
Figure 2.
Brazilian coastline and the main marine areas delimited.

Table 1.
Regions of the Brazilian coast considered in this study.
2.2. Model Description
2.2.1. Ocean Current and Thermal Gradient Energy
The datasets for ocean current velocities and temperature were obtained (surface down to 5500 m) from the numerical model product available for the CMEMS (Copernicus Marine Environment Monitoring Service) center. The applied product is a high-resolution global analysis and forecasting system that uses the NEMO (3.1) ocean model [27]. It consists of part of the Operational Mercator global ocean analysis and forecast daily system, which was initiated on December 27, 2006. The dataset has one regular horizontal grid with a 1/12° (~9 km) resolution based on the tripolar ORCA grid [28], 50 vertical levels with 22 layers within the upper 100 m from the surface, bathymetry from ETOPO1 [29], and atmospheric forcings from the ECMWF (European Centre for Medium-Range Weather Forecasts). Additionally, it uses a data assimilation scheme, in which the initial conditions for numerical ocean forecasting are estimated by joint assimilation of the altimeter data, in situ temperature, salinity vertical profiles, and satellite sea surface temperature.
- Ocean current energy
Near-surface (~5 to 50 m) u and v components of velocity from January 1, 2007 to December 31, 2017 were used as a subset of the area corresponding to the Brazilian coastline (25°W–55°W and 6°N–34°S).
The ocean current power can be calculated as the amount of marine-hydrokinetic energy that flows through a unit cross-sectional area oriented perpendicular to the current direction per unit time [30] expressed as follows:
where is the current power density in (), is the density of seawater (defined as 1025 kg/m3), and S is the flow speed (in m/s). In practice, only a fraction of this energy can be harnessed. The underwater turbine efficiency has a typical range from 35% to 50% [31]. Additionally, a mean peak current of more than 2 m/s is necessary for commercial power generation [32].
- Thermal gradient energy
Gridded daily seawater temperature (°C) model output with 50 vertical layers and ~9 km in horizontal resolution was used to analyze the temperature difference (ΔT (°C)) between the surface warm water and the deeper cold water. It was assumed that the superficial water intake pipe was located at about 20 m and the deepest point in the vertical depth stratification was approximately 1000 m. At specific locations (each grid cell), we calculated the gross power () following the methodology described by [33,34]. The OTEC gross power can be expressed as the product of the evaporator heat load and the conversion efficiency of the gross OTEC [34]:
where γ is the flow rate ratio calculated for a 10 MW OTEC plant in which and are the warm surface water and the cold deep water flow rates, respectively [35]. ΔT is the difference in temperature between the surface layers and deeper layers, and T is the absolute temperature at the surface (in Kelvin) (20 m). ρ and represent the water density, which was equal to , and the turbo-generator efficiency fixed at 0.75, respectively. is the specific heat of seawater and has a value of .
A considerable amount of the is consumed to pump the large seawater flow rates through the OTEC plant. The net power should be calculated, which is usually about 30% of the [36,37]. The can be expressed by the following equation considering and the other losses presented in [34]:
2.2.2. Wave Energy
The wave dataset was obtained using the operational global ocean analysis and forecast system of Météo-France that is available for the CMEMS (Copernicus Marine Environment Monitoring Service) center. The model had a horizontal resolution of 1/12° (~9 km) and 3-hourly instantaneous fields of integrated wave parameters. The global wave system of Météo-France is based on the third-generation wave model MFWAM. It uses the computing code ECWAM-IFS-38R2 with a dissipation term [38]. The 2-min gridded global topography data ETOPO2/NOAA were used to generate the model’s mean bathymetry. The dataset uses three years of data to estimate the wave climatology along the Brazilian coastline (between 2015 and 2018). The power density P was calculated using the significant wave height Hs and the wave energy period Te as follows:
where ρ and g represent the seawater density (1025 kg.m–3) and gravity acceleration (9.806 m.s–2), respectively; Hs is the significant height (m); and Te is the energy wave period (s). This simplified expression uses deep-water approximation [39], which fits well most of the modeled domains; however, more sophisticated techniques as well as in situ measurements are required to precisely determine the shallow water wave climate.
2.3. Metrics
The variability of the available ocean renewable energy in time is an important issue due to its impact on the capacity factor, which, consequently, affects the economy of the ocean energy system. Two different metrics were used to address the seasonal and temporal variability of the Brazilian coastline. The seasonal variability (SV) index [40] can be expressed as follows:
where and are the mean wave power of the least and the most energetic seasons, respectively, and the is the annual mean power. Greater values of SV imply a larger seasonal variability; however, it should be noted that this is the variability of the energy resources relative to their mean level on a three-month seasonal time scale [40]. The temporal variability of the energy at a site or region can be evaluated by the coefficient of variation (COV) [40], which is expressed as
where SD is the standard deviation, and the over-bar denotes the time-averaging. A COV equal to zero leads to a fictitious power time series with absolutely no variability, while COV (P) = 1 and 2 imply that the standard deviation of the time series is equal to and twice the mean value, respectively.
3. Literature on the Issue and State-of-the-Art Technology Related to Ocean Renewable Energy
3.1. Resource Potential
Ocean renewable energy, also referred to as marine renewable energy, is defined as energy captured by technologies that utilize the seawater’s motion or potential properties as the driving power or harness its heat or chemical potential. The ocean surface waves, tidal range, tidal current, ocean current, and thermal and salinity gradient are renewable sources of ocean energy that have different origins. Technologies associated with ocean energy convert these renewable energy sources into electricity or other desirable forms of energy.
Other renewable sources of energy can be exploited from the ocean environment that is excluded from the above definition. The production of biofuels from marine biomass, energy harnessing from submarine vents, and offshore wind are some examples that can be considered as forms of bioenergy, geothermal, and wind energy, respectively.
The highest level of potential is theoretical potential, which only takes into account the natural and climatic characteristic limitations. Reducing this potential due to the consideration of the technical limitations, such as the conversion efficiency and storage of electricity, results in technical potential, which varies with the development of technologies.
3.1.1. Wave Power
Temporal variations of the wave condition can be estimated by the use of long-term averages in modeling, applying global databases with reasonably long histories [41]. It can be observed that the most energetic waves exist in the region between latitudes of 30° and 60° of both hemispheres because of the extra-tropical storms [41].
Mørk et al. [42] calculated the theoretical potential of wave energy resources for areas with a wave power larger than 5 kW per meter and a lower latitude than 66.5°. Accordingly, they presented a total theoretical potential of about 3.37 TW (29,500 TWh/yr or 106.2 EJ/yr). An overall technical potential of 500 GW (around 16 EJ/yr) was estimated by Sims et al. [43], assuming an efficiency of 40% for wave energy converters installed in offshore regions with a wave power exceeding 30 kW/m. Krewitt et al. [44] presented a technical potential of 20 EJ/yr. Gunn and Stock-Williams estimated a global theoretical potential of about 2.11 TW, of which 4.6% was predicted to be extractable by deploying a specific wave energy converter (WEC) [45]. They considered the area between 30 nautical miles and the Exclusive Economic Zone (EEZ) for each region. Besides these global studies, some works have assessed the wave energy resource potential at national and regional levels in China [46,47], Italy [48], Spain [49], Ireland [50], and the USA [51].
3.1.2. Tidal Power
Tidal ranges can be forecasted accurately. The world’s largest tidal ranges occur in the Bay of Fundy, Canada (17 m), the Severn River Estuary, the United Kingdom (15 m), and the Bay of Monte Saint Michel, France (13.5 m) [52]. In addition, Argentina, Australia, China, India, Russia, and South Korea also have large amounts of tidal power.
The global theoretical potential of tidal energy (tidal ranges and currents) is estimated to be in the range of 500–1000 TWh/yr (1.8–3.6 EJ/yr) [52]. Sims et al. [43] estimated that tidal currents of more than 100 TWh/yr (0.4 EJ/yr) could be converted into electrical energy if major estuaries with large tidal fluctuations could be tapped [43].
The Ocean Energy System (OES) reported the worldwide theoretical potential of tidal energy, including tidal current, to be around 7800 TWh/yr (28.1 EJ/yr) [53]. Some studies of the regional tidal energy resource potential can be found in Scotland [54], Uruguay [55], Ireland [56], Taiwan [57], and Iran [58].
3.1.3. Ocean Current Power
The ocean current is the movement of seawater in the open sea generated by forces acting upon the water, including wind, the Coriolis effect, temperature and salinity differences, and so on. Compared with tidal currents, ocean currents are generally slower, relatively constant, flow in only one direction, and fluctuate seasonally. The currents off South Africa (Agulhas/Mozambique), the Kuroshio Current (off East Asia), the Gulf Stream (off eastern North America), and the East Australian Current are locations with potential ocean currents already identified [59]. Yang et al. [60] estimated a theoretical potential of about 163 TWh/yr for the Gulf Stream system, considering the entire area of the Gulf Stream within 200 miles of the US coastline between Florida and North Carolina as the extraction region. Besides that, they calculated a technical potential of about 49 TWh/yr, assuming a power conversion efficiency of 30%. Chang et al. [61] identified suitable sites for ocean current energy extraction near the coastlines of Japan, Vietnam, Taiwan, and the Philippines. Goundar and Ahmed [62] evaluated marine current resources for Fiji, presenting a peak velocity of about 2.5 m/s.
3.1.4. Ocean Thermal Energy
The resulting temperature difference between the upper layers and the colder layers of seawater—usually at a depth of more than 1000 m—can be converted through different oceanic thermal energy conversion (OTEC) methods [63]. In practice, a minimum temperature difference of 20 °C (or K) is required for the use of the temperature gradient in the generation of electricity. The tropical latitudes (0° to 30°) in both hemispheres, including the western and eastern coasts of the Americas, many islands of the Caribbean and Pacific, and the coasts of Africa and India, are the places with the greatest potential [59]. Although there is a little variation in the temperature gradient from summer to winter, the thermal gradient feature is continuously available. It is estimated that about 44,000 TWh/yr (159 EJ/yr) to 88,000 TWh/yr (318 EJ/yr) of power could be generated through OTEC devices [34,64]. Rajagopalan and Nihous [65] estimated that an annual OTEC net power of about 7 TW could be obtained, considering the small effect on the oceanic temperature field. Thus, ocean thermal energy has the highest potential among ocean renewable energy sources. However, the energy density of OTEC systems is quite low compared with that of other sources, such as waves and tidal currents. This issue may affect the low-cost OTEC operation [63], requiring further investigation.
3.1.5. Salinity Gradient Power
The salinity gradient power (osmotic power) is the potential energy from the difference in the salt concentrations of seawater and freshwater. Energy is released due to the mixing of fresh water with seawater. The entropy of the freshwater–seawater mixture can be exploited as pressure by using the semipermeable membrane. This pressure can be converted into the desired energy form. The freshwater rivers discharging into saltwater are distributed globally, with a volume of about 44,500 km3/yr. Assuming that only 20% of this discharge can be used for salinity gradient energy generation, the overall potential is approximately 2000 TWh/yr (7.2 EJ/yr) [44]. Skramesto et al. [66] estimated a technical potential of 1650 TWh/yr (5.9 EJ/yr) for the production of salinity gradient energy. Recently, in [67] it was shown that, practically, 625 TWh/yr of salinity gradient energy is globally extractable from river mouths. Some examples of the regional assessment of the salinity gradient potential can be found in Colombia [68], remote regions of Quebec [69], and the hypersaline Urmia Lake of Iran [70]. The potential for salinity gradient energy extraction from some major world rivers is presented in [71].
Figure 3 shows a summary of the potential of ocean renewable energy resources based on the references presented in this paper. The bars illustrate the range of estimated resource potential. Note that the technical potential of ocean current is shown as presented in [60] for the Gulf Stream.
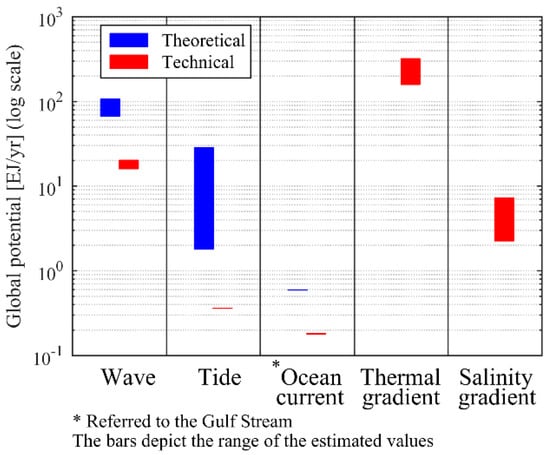
Figure 3.
Summary of the global ocean renewable energy resources.
3.2. Conversion Technologies
3.2.1. Wave Energy Conversion
Currently, there are a large number of concepts and patents on the use of wave energy. As illustrated in Figure 4, the process of the wave energy conversion can be divided into three main stages: the primary conversion stage, the secondary conversion stage, and the tertiary conversion stage [72]. In the primary conversion stage, the wave converter captures the kinetic energy of the waves through wave body interactions (e.g., buoy oscillation, air flow, or water flow). The secondary conversion stage converts the body motion energy into electricity through the power take-off (PTO) system, and the tertiary stage adapts the characteristics of the produced power to the grid requirements with power electronic interfaces.
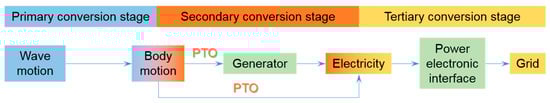
Figure 4.
Main stages of wave energy conversion.
Based on the working principles of the WEC, from the primary conversion stage to the secondary conversion stage, the general categories are classified as shown in Figure 5 [72,73,74,75]:
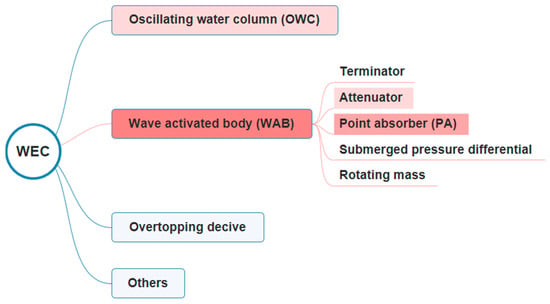
Figure 5.
Categories of wave energy converter (WEC) technology.
- The oscillating water column (OWC), which compresses or decompresses the air in a chamber using the wave elevation to drive a Wells or impulse turbine to convert wave power. Depending on the location of installation, OWC devices can be fixed onshore [76,77,78], as shown in Figure 6a, or floating, as shown in Figure 6b [79,80,81].
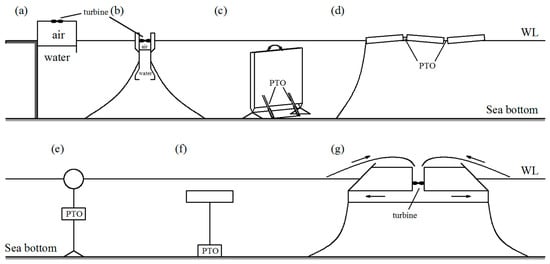 Figure 6. WEC technologies.
 - Wave activated bodies (WABs), which utilize the wave excitation motions between two bodies to convert wave power into electric power. According to their dimension and orientation, WABs can also be classified as terminators [82] (Figure 6c), positioned with large horizontal extensions perpendicular to the wave propagation direction); attenuators [83,84] (Figure 6d), which have a large horizontal extension parallel to the wave propagation direction; point absorbers [85,86] (Figure 6e), which have small dimensions compared to the predominant wavelength and are usually axisymmetric about their vertical axis; and submerged pressure differentials [87] (Figure 6f), which are submerged buoys with large dimensions.
- The overtopping device, which utilizes the overtopping phenomenon to the let the water fall through the turbine to converter the potential energy into electric power [88,89,90], as shown in Figure 6g.
- Others, describing concepts different from the above categories, e.g., the wave carpet [91] and the rotating mass [92,93], which uses the motion of a hull to accelerate and maintain the revolutions of a spinning mass inside.
There are different types of PTO systems adopted for different WEC devices, e.g., pneumatic [94,95], hydraulic [96,97,98,99], direct mechanical drive [100,101,102], and direct electrical drive [103,104,105]. An elaborated description of these systems can be found in [106,107,108].
A time-varying wave climate in real sea may deteriorate the power quality gained from a single device. In practice, some strategies, like short-term energy storage or PTO resistance control, can be utilized to smooth energy production. However, arrays of wave energy converters are more desirable because their cumulative energy generation will be smoother than the energy production of a single device [59]. Efficient power production is strictly dependent on the advanced control systems.
3.2.2. Tidal Range Energy Conversion
Tidal barrage power plants use the difference in the height of the water surface during ebbs and floods (tidal range) to drive common hydro turbines. The greater tidal range results in higher energy extraction by the power plant.
Figure 7 presents the principle of the tidal barrage power plant [109]. The shapes of structures are similar to dams and the structures are built in the estuary or bays to store water at high tide. A difference in water height at the internal and external sides of the dam occurs due to changes in the tidal regime. Three main tidal barrage schemes are
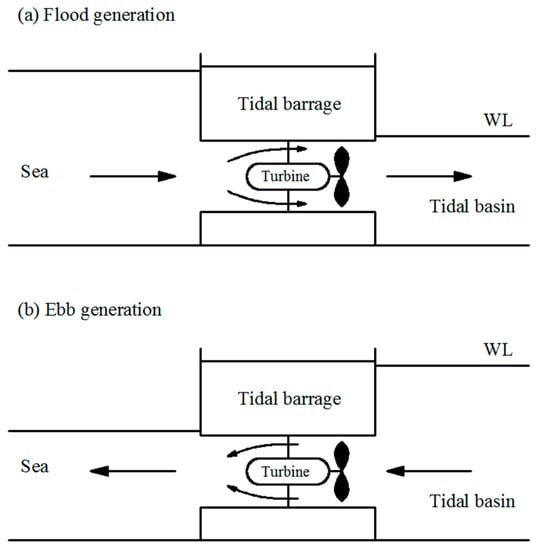
Figure 7.
Tidal barrage principles.
- Flood generation—the power production process starts as the water enters the tidal basin (flood tide);
- Ebb generation—power production starts as the water leaves the tidal basin (ebb tide);
- Two-way generation—the tidal power plant produces power during the flood and ebb tides.
The sluice gates on the barrages are utilized to control water levels and flow rates. In general, ebb generation is generally more efficient than flood generation. This is due to there being more kinetic energy in the upper half of the basin in which ebb generation operates. This is because of the effects of gravity and the second filling of the basin from inland rivers and streams connected to it via the land. The bi-directional tidal turbine generators are generally more expensive and less efficient than unidirectional tidal generators [110]. Some studies related to the tidal barrages’ dynamics, power performance, and economy can be found in [111,112,113,114,115].
3.2.3. Tidal Current and Ocean Current Energy Conversion
The kinetic energy of both tidal and ocean currents can be extracted with hydrokinetic turbines, which have similarities with wind turbines but are still submerged. Due to the higher density of water compared to that of air, the blades of current turbine devices have smaller dimensions and move slower than those of wind turbines while still providing a significant amount of energy. The main difference between tidal and ocean currents is that the tidal currents have bi-directional flows in contrast to the ocean currents which are unidirectional. This has implications for the design of a tidal current turbine, which must act in both directions of the water flow [59].
The four major types of current energy conversion devices are as follows, as shown in Figure 8:
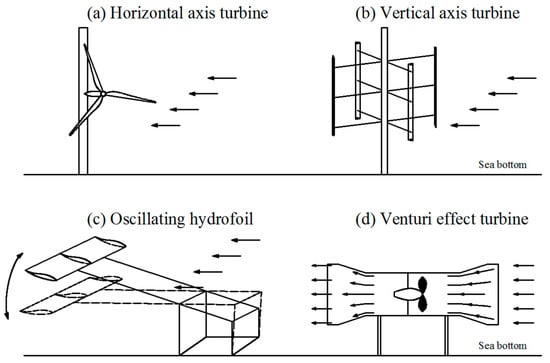
Figure 8.
Primary types of tidal and ocean current energy conversion devices.
- Horizontal axis turbine [116,117,118]—blades, driven by current energy, rotate around the horizontal axis;
- Vertical axis turbine [119,120,121,122,123,124]—blades, driven by current energy, rotate around the vertical axis;
- Oscillating hydrofoil [125,126,127,128]—currents passing the hydrofoil result in the lift force, which can drive the motion of the hydraulic system to generate electricity;
- Venturi effect turbines [129]—harness the kinetic energy of the current by amplifying the current velocity by the Venturi effect in the strangulated section of a tube [63].
Additionally, ducted channels are utilized to induce a sub-atmospheric pressure within a constrained area and, consequently, increase the flow velocity around the rotor [130,131,132]. The tidal kite is a novel technology, which uses wing carrying and pushes a turbine in an “8” shaped trajectory, sweeping a large area with a relative speed of more than the local current speed [133,134,135]. A review of the tidal current technology is presented in [136].
3.2.4. Ocean Thermal Energy Conversion (OTEC)
OTEC is a technology that converts the difference in temperature between the sea surface and large depths (around 1000 m) for use in heating, cooling, or to generate electricity. Closed-cycle technology requires a minimum temperature difference of 20 °C, which is possible in equatorial marine regions. Warm water from the upper layers is used to vaporize a secondary working fluid (e.g., ammonia), thus driving an electric generator. The resultant steam is then condensed by the cold water, which is brought, using pumps, from the bottom of the ocean and then discarded. Some works that studied the closed-cycle OTEC can be found in [137,138,139].
Open cycle technology uses the warm surface ocean water as the working fluid, which is drawn into a vacuum vessel, causing the working fluid to vaporize. The main benefit of the open cycle process is that it produces both electricity and desalinated fresh water. An investigation of the performance of a shore-based low temperature thermal desalination using an open-cycle OTEC is presented in [140]. Recently, a novel optimal open-cycle OTEC plant using multiple condensers was designed in [141].
The hybrid cycle combines both closed and open cycle technologies. Similar to the open cycle process, the warm surface water is flash-evaporated into steam. The steam is used to vaporize the ammonia working fluid of a closed-cycle loop and drives a turbine to produce electricity. Afterwards, the steam is condensed through a heat exchanger, providing desalinated water [142]. Such a cycle can realize the generation of both electricity and fresh drinking water simultaneously.
3.2.5. Salinity Gradient Energy Conversion
The salinity gradient takes advantage of the power that can be generated by the mixture of cold and salty water, for instance, at the mouth of a river that flows into the sea. There are two common methods for generating energy from the salinity gradient: pressure-retarded osmosis (PRO) [143,144,145,146] and reverse electrodialysis (RED) [147,148,149].
The PRO method is based on semipermeable membranes that allow only the traveling of water molecules. In this approach, water flows from the diluted solution (freshwater) to the concentrated solution (seawater) to provide a chemical potential equilibrium on both sides of the membrane. This occurs only when the pressure difference between the liquids is less than the difference in osmotic pressure. This flow of water can be used to power turbines that transform mechanical energy into electricity. The RED method is based on the transport of ions (salt) through membranes. Two fluids of different salinities (freshwater and seawater) pass through a series of specific membranes. The difference in chemical potential between membranes results in an electrical voltage. The brackish water is then discarded into the sea.
Additionally, some hybrid processes, such as the production of electricity from thermal energy using a closed-loop RED heat engine, low-energy desalination by integrating RED with desalination facilities, and the use of microbial RED cells with boosted power performance, have been proposed to facilitate energy extraction from salinity gradient resources [149,150].
3.3. Global Status of Development
3.3.1. Installed Capacity
Despite decades of development efforts, a large amount of the ocean’s renewable energy sources are still untapped [151]. In the last 10 years, the use of ocean energy sources has experienced significant growth globally. Since 2009, many devices have been deployed worldwide to capture the energy from currents, tidal ranges, thermal and salinity gradients, and waves. This progress is noticeable by the gradual increase in installed capacity in some continents, as shown in Figure 9 [152], demonstrating an expansion of marine energy in the world energy matrix. Globally, this growth has more than doubled from 244 MW in 2009 to 532 MW in 2018. However, more than 90% of this operating capacity is represented by two tidal barrages in La Rance, France and Sihwa Lake, South Korea.
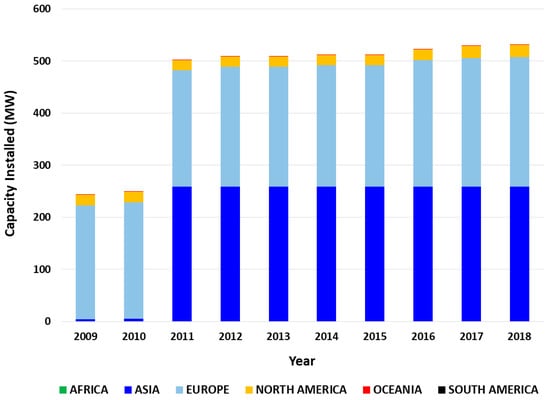
Figure 9.
Marine energy: capacity installed by continents, according to the International Renewable Energy Agency (IRENA) (2019) [152].
The contribution of Asia is led by China and South Korea, where extraordinary progress has been made since 2011, mainly because of the development of tidal barrage facilities. This is due to government support, through the adoption of economic policies, the reduction of tariffs and exemption, which includes financial subsidy policies to encourage scientific research and development, the development of new renewable energy technologies, prototype demonstration, and development of the renewable energy industry [153]. After France developed the La Rance tidal barrage, the United Kingdom led the way in terms of installation capacity followed by Spain, Sweden, the Netherlands, Norway, Portugal, and Italy. In North America, mainly in Canada and the United States, the development of these energy sources is in advanced stages, with the implementation of demonstration-scale commercial projects. Africa, Central America and the Caribbean, South America, and Oceania are in the early stages of deploying ocean resources as energy sources, with incipient projects and installed capacity.
3.3.2. Technology Status
The technology readiness level (TRL) presented by NASA has been adapted for ocean renewable energy technologies and presented by [154]. The TRL system quantifies the development of ocean energy devices from an initial stage of research and development (R&D) to industrial roll-out, which involves the mass production of off-the-shelf components and devices. Accordingly, the ocean renewable energy technologies are still at the conceptual, R&D, or demonstrative prototype stages. Nevertheless, in the case of waves and tidal currents, global commercial application is expected in the near to medium future. Based on reports, the extraction of energy from tidal ranges is still at the precommercial stage and the use of energy from tidal currents and waves is at the demonstration and prototype stages, respectively.
3.3.3. Deployed Devices
Large-scale (half- or full-scale) testing at sea is necessary for the pre-commercial stage of development. However, only a few devices have been constructed and tested at full scale. Oscillating water column devices have been employed as fixed onshore and floating offshore structures. Some examples of the fixed OWC prototypes have been deployed in Japan [155], Italy [156], Portugal [157], and Norway [158].
The Pelamis Wave power is the most mature wave-activated body device. It was installed for the first time in 2004 at the European Marine Energy Centre (EMEC) wave test site at Billia Croo. Later, its second generation, which comprised five connected sections, giving a total length of 180 m and a rated power of 750 kW, was installed at the same test site in 2010. AquaBuoy [159], Interproject Service (IPS) buoy [160], and Wave Bob [161] are examples of the wave-activated body devices that produce energy from the relative motion of two connected oscillating bodies.
Overtopping devices can be floating or fixed structures. The Wave Dragon [162] and the Seawave Slot-Cone Generator [163] are prototypes that represent overtopping with floating and fixed structures, respectively.
In contrast to the other sources, tidal energy can provide predictable and stable power to the electrical network. However, the tidal-current-generated electricity price is not yet competitive with the current wholesale prices of electricity due to the technical challenges associated with building, installing, operating, and maintaining the plant which affect the cost of the produced energy in energetic sub-sea environments [164].
Some important deployments of the horizontal axis tidal turbines are as follows: The Shetland tidal array was the first deployed tidal array. It includes three turbines of 100 kW each. Meygen, which is the largest operational tidal current array with four turbines of 1.5 MW, was developed by ANDRITZ HYDRO Hammerfest and Atlantis Resource Limited. The Sabella D10 tidal turbine has a capacity of 1 MW. The Cape Sharp Tidal project consists of two turbines of 2 MW and was developed by OpenHydro/Naval Energies.
The two largest tidal barrages are the 240 MW Rance barrage (1966) in France [165] and the 254 MW Sihwa Lake tidal barrage (2011) in South Korea [166,167]. Other countries, such as China, Russia, and the UK [168], are also focusing on tidal barrage technology. In particular, the former two countries have operated tidal barrage power plants in a mean range of 2.4 m with modern low-head turbines [169], which proves that relatively low tides (lower than 5 m, which is considered necessary for tidal barrages [170]) can also be utilized economically.
The extraction of energy from the ocean’s thermal gradient is being pursued by some countries including the United States, China, Japan, France, Taiwan, South Korea, India, and the Netherlands. However, two main projects that achieved the prototype phase are the onshore Okinawa 100 kW [171,172] and Hawaii 105 kW OTEC [173] power plants. The former prototype is a hybrid OTEC, developed by Saga University, which uses mixed water/ammonia as “working fluid”. It was installed in 2013 in Okinawa, Japan. The latter is a closed-cycle OTEC that was developed by Makai Ocean Engineering. It was installed and connected to the US electrical grid in 2015.
Salinity gradient power is still a concept under development [149,150]. The first PRO (pressure retarded osmosis) power plant was developed by Statkraft in 2006. The main project is a 5 RED pilot project that was developed by the REDStack and Fujifilm in 2005. They deployed a 50 RED pilot project in “Afsluitdijk” (the sea defense site and major causeway) in 2013.
3.3.4. Status of the Projects
- Project development phases
In general, numerous projects have been implemented in all continents, and some regions present a relatively high TRL compared with others. To address the current status of ocean renewable energy technologies, we integrated the data of 455 projects from five different databases as follows: OES 2019 (Ocean Energy System), EMODnet 2017 (The European Marine Observation and Data Network), UKMED 2019 (UK Marine Energy Database), and OpenEI 2019 (Open Energy Information) provided by the US Department of Energy’s Marine and Hydrokinetic Technology Database and PNNL 2019 (Pacific Northwest National Laboratory) [174,175,176,177,178]. Note that, in some cases, mainly related to the wave and current energy, each project may include more than one device unit, forming a farm; however, the numbers that are shown in this section represent the quantity of projects and not the number of the employed technology units. Since each database classifies projects based on its defined categories, unification of the stages of the project development is required. In this work, to unify the classifications of the databases, four different categories were defined based on the “guidelines for project development in the marine energy industry” presented by the EMEC [179]. Accordingly, each marine energy project was divided into seven stages, labelled 0, 1, 2, 3, 4, 5, and 6, associated with the project development strategy, site screening, project feasibility, project design and development, project fabrication and installation, operation and maintenance, and decommissioning, respectively. Table 2 shows a summary of the project stages.
Table 2.
Stages of ocean renewable energy project development.
- Geographical distribution of the projects
Figure 10a,b shows the geographical distribution of the projects over approximately 40 countries. It can be seen that, in terms of quantity, Europe has the largest contribution (about 60.66%), followed by North America, Asia, Oceania, Africa, Central America and the Caribbean, and South America with 17.10%, 13.35%, 5.62%, 1.64%, 0.94%, and 0.7%, respectively. As Figure 10b illustrates, the largest number of projects belong to the wave and current energy sector, and these are mostly located in Europe. Note that in this sector, the current energy projects include technologies that are utilized to harness current energy, independent of its type, including ocean and tidal currents.
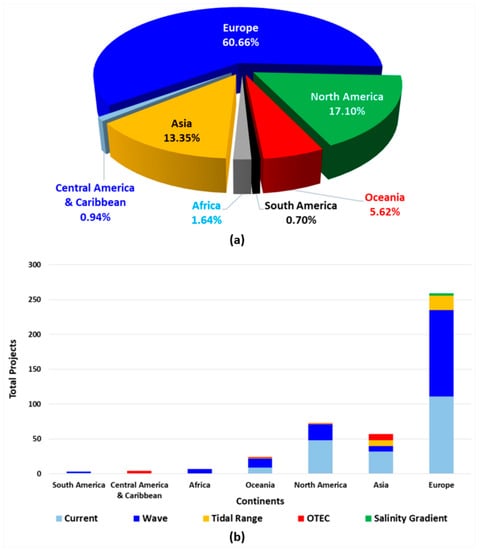
Figure 10.
Distribution of the ocean renewable energy projects by (a) continent and (b) source for each continent.
It is observed that although the ocean thermal gradient has the largest potential among the energy resources, there is a very low interest in harnessing such energy. This may be due to the technical complexities and high capital cost that decelerate the development process of OTEC technology [180]. Nevertheless, it can be inferred that wave and current energy are considered to be more promising energy resources than others.
Figure 11 illustrates a summary of the global status of ocean renewable energy projects. Approximately half of the projects are in the “planning” and “pre-deployment” stages, and these projects are dominated by the current and wave energy and mostly located in Europe. This means that there will be a significant evolution in ORE deployment in the next 5 years. Europe, Asia, North America, and Africa are the regions with operational projects. Asia may lead the future in OTEC technology having a larger number of “planning” and “pre-deployment” projects compared with other regions. These projects are mostly located on the eastern coast of Asia. Tidal range energy has been harnessed commercially since 1966 (Rance River north-western France); however, to date, only a handful of operational projects have been deployed. On the other hand, wave and current energy projects, which are operational or at an earlier stage of development, represent about 65% of all projects. This implies that tidal range technology has not drawn as much serious developmental interest as wave and current technologies. This may be due to the high cost and ecological impacts of such technology [181].
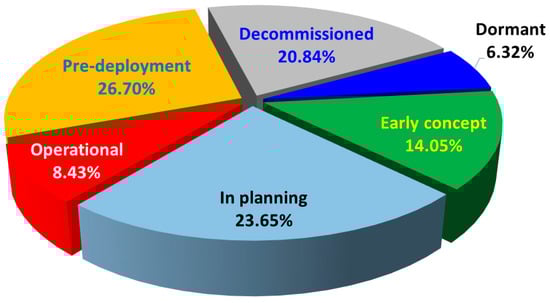
Figure 11.
Global status of the ocean renewable energy projects.
- Technology distribution
The databases were used to determine the technological distribution of the projects. As Figure 12 illustrates, and as was expected, the most employed technologies are current and wave energy technologies. Current energy technologies are closest to technological maturity showing a significant convergence with the use of horizontal axis turbines. Most projects use horizontal axis turbine technology, followed by vertical axis turbines, tidal kites, and oscillatory hydrofoils. On the other hand, more technology diversity can be observed for wave energy converters, partly due to the diversity of wave resources and the complexity of harnessing wave energy. The wave energy technologies are dominated by point absorber devices followed by OWC, oscillating wave surge converters, attenuators, rotating masses, overtopping devices, and submerged pressure differential devices (see Section 3). The OTEC technologies are limited to the use of closed and open cycle and hybrid systems with a tendency of deploying the closed cycle method. Tidal range energy is traditionally harnessed using tidal barrages installed in the estuaries, but this method is associated with important environmental issues. The use of tidal lagoons has been proposed and developed in the UK since 2008 as an alternative to reducing such environmental issues [168]. The technology for extracting the salinity gradient energy is still in the conceptual stage of development, and its evolution is highly dependent on membrane enhancement, which will be responsible for 50% to 80% of the total cost [182].
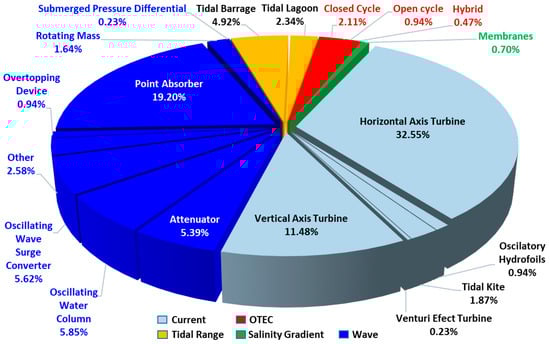
Figure 12.
Technology distribution among projects.
4. Case Study of Brazil
4.1. Resource Assessment Results
4.1.1. Ocean Current Energy
Figure 13 and Figure 14 show the spatial variation of the ocean current resources along the Brazilian coast in terms of the annual and seasonal average current speed () and power density (). As shown in Figure 13, the maximum annual average can be observed in the north equatorial margin of Brazil with a velocity of 1.52 m/s. This region is influenced by the NBC. These regions are located at a distance of between 120 and 300 km of the coastline. The same pattern can be observed considering the seasonal distribution. A maximum speed value of 1.67 m/s occurs during autumn. It can be seen that the speed values barely reach 2 m/s, which is recommended for commercial ocean current energy extraction [32]. The current speed values are not significant (less than 0.7 m/s) for the regions A and B. They occur due to the BC flow and are higher during the spring. Figure 14 shows the power density (), calculated using Equation (1), across the Brazilian coastline. As expected, following the speed values, region D represents the most energetic area, and power density values higher than 500 can be observed for some areas. Table 3 contains the average values of the seasonal mean power as well as the SV and COV values. The seasonal average values for regions D and C show that, in contrast to the regions A and B, the current power density is higher during austral autumn and winter compared to austral summer and spring. This is due to the seasonal climatological behavior of the NBC [25]. The fact that the power density of the region D is significantly higher than that of other regions indicates that the values of SV and COV are less important when the objective is to determine the best region for exploring the ocean current energy. However, these values are important for techno-economic studies of the corresponding energy extracting technologies in the North region.
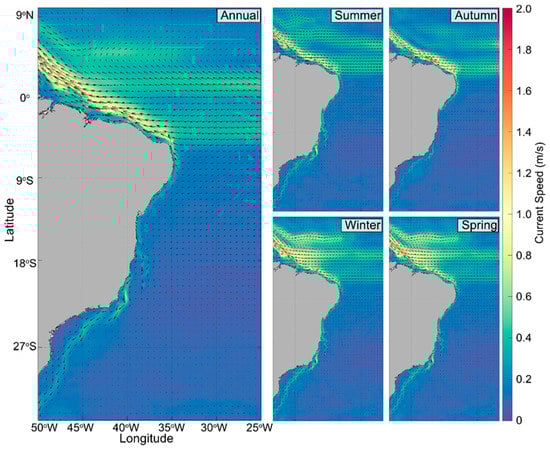
Figure 13.
Annual and seasonal (summer, autumn, winter, and spring) mean surface current speed (m/s) at the Brazilian coastline between January 1, 2007 and December 31, 2017.
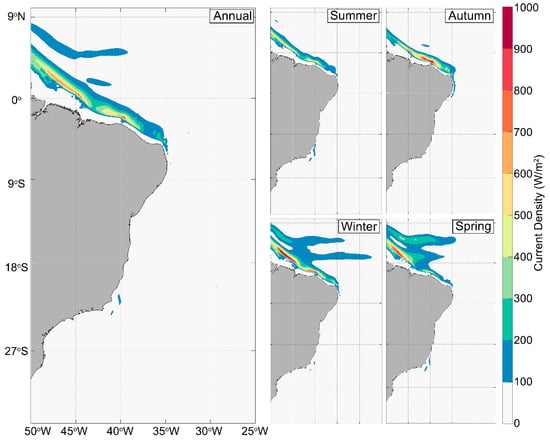
Figure 14.
Annual and seasonal (summer, autumn, winter, and spring) mean power density (W/m2) at the Brazilian coastline between January 1, 2007 and December 31, 2017.
Table 3.
Average values of the ocean current power density (W/m2), standard deviation (±), seasonal variability (SV), and coefficient of variation (COV) for each coastline region—A, B, C and D—for each season (summer, autumn, winter, and spring) between January 1, 2007 and December 31, 2017.
4.1.2. Wave Energy
Figure 15 shows the average annual and seasonal wave power density values. The hindcast shows the variability of the energy resource and provides a holistic view of the wave climate along the Brazilian coast. It can be observed that the most energetic wave areas are located near the regions A and B coasts with a power value between 20 and 25. This is intensified during the autumn and winter seasons. This fact is directly related to the increase in the occurrence of extratropical cyclones that generate larger waves that propagate toward these Brazilian regions. The nearshore areas of region A (areas with a water depth of less than 100 m) have values close to 20 kW/m for almost the entire year. This is mainly due to the preponderance of south winds combined with the shoreline orientation that induces strong swells near the coast. The average values of the SV and COV related to the wave power were calculated and are illustrated in Table 4 for five different bathymetries of 25, 50, 100, 150, and 200 m along the Brazilian coast. It can be observed that, independently of the water depth, the seasonal variability (SV) of the regions A and B is always smaller than that of the regions D and C. On the other hand, the minimum COV occurs in the region C, while the region D has a greater COV than the other regions. However, the differences between the COV values of the region C, when compared with those in the regions A and B, are small and decrease as the water depth increases from 25 to 200 m. The region C has the smallest wave power variability during the year, which may lead to a higher capacity factor, while the regions A and B are the areas with the most energetic waves, allowing the deployment of the devices with higher installed capacity. A trade-off between the WEC nominal power and capacity factor as well as other local characteristics such as water depth should be considered to determine the proper locations for deploying wave farms.
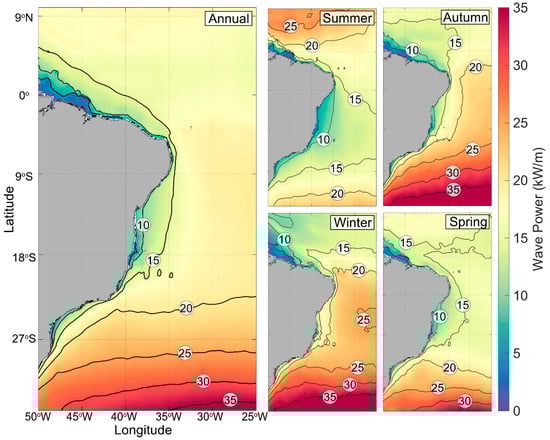
Figure 15.
Annual and seasonal (summer, autumn, winter and spring) mean wave power density (k W/m2) at the Brazilian coastline between January 1, 2015 and December 31, 2017.
Table 4.
Average values of wave seasonal variability (SV) and coefficient of variation (COV) considering five different bathymetries (25, 50, 100, 150 and 200 m) for each region—A, B, C and D—between January 1, 2015 and December 31, 2017.
The available wave power for the Brazilian coastline was calculated at an average distance of 128 km from the coast (Table 5). Accordingly, a total available wave power of approximately 91.8 GW was estimated considering a total coastline length of about 7491 km (an approximate value without coastline details). It should be noted that this value is an estimation of the theoretical potential of the Brazilian wave power. In practice, only a fraction of this value can be extracted by the wave energy devices, which depends on different issues such as technical challenges, environmental impacts, economy, deferent use of the sea area, and social impacts. Nevertheless, only one-fifth of this potential is equal to approximately 35% of the Brazilian electricity demand in 2017 [183].
Table 5.
Available wave power of the Brazilian coastline.
4.1.3. Ocean Thermal Energy
Figure 16a shows the annual average between the water depth of 20 and 1000 m along the Brazilian coast. The results show that, except for the extreme South below 27, the yearly average ΔT is always about 20 °C or higher along the Brazilian coast. The average gross power of a 10 MW OTEC plant (see Section 2.2.1) was calculated for 12 locations along the coastline. The selected points were located approximately at a distance between 30 and 200 km to the shore and had an annual average ΔT at between 20 and 1000 m of water depth of more than . Figure 16b illustrates the annual variation in the gross power for the considered points. A greater average annual gross power, represented by the red solid line, can be observed for the regions D and C comparing to the regions A and B. Moreover, the results show smoother power production for the regions D and C comparing to the regions A and B. Table 6 shows the characteristics of the selected points as well as the and .
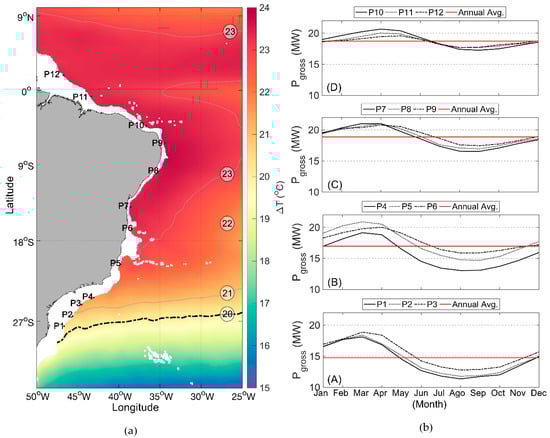
Figure 16.
(a) Annual mean ΔT (°C) between 20 and 1000 m and (b) the annual ocean thermal energy conversion (OTEC) Gross Power Density (PG in MW) at a depth of 1000 m considering the period between January 1, 2007 and December 31, 2017.
Table 6.
Gross and net power estimation for the selected points along the Brazilian coastline.
Figure 17 illustrates the seasonal mean ΔT () between the water depths of 20 and 1000 m, for a bathymetry of 1000 m, across the Brazilian coastline. The black line represents a ΔT of . It can be observed that, for the regions A and B, the water depth in which the mean ΔT = 20 °C is achieved, varies between 500 m in summer and 700–1000 m in other seasons. On the other hand, in the regions D and C, a mean ΔT of 20 °C can be reached in a water depth of about 500–700 m throughout the year. From a technical point of view, less structural challenges would be expected when bringing the cold water from a depth of 500 m rather than from 1 km.
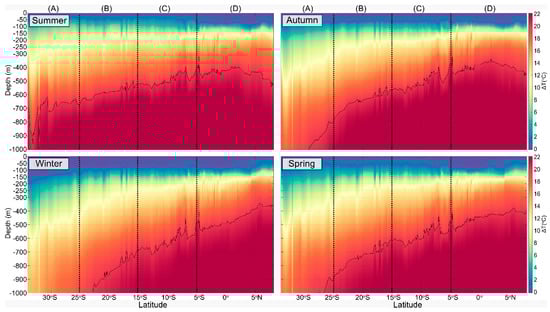
Figure 17.
Seasonal (summer, autumn, winter, and spring) mean ΔT (°C) between 20 and 1000 m for the bathymetry of 1000 m (for regions A, B, C and D) across the Brazilian coastline latitude considering the period between January 1, 2007 and December 31, 2017. The black line corresponds to a ΔT of 20 °C.
4.2. Deployments in Brazil
The first deployment of an ocean renewable energy converter in Brazil occurred in 1934 when the French engineer Georges Claude used an ocean thermal energy source to produce ice for the residents of Rio de Janeiro. His plant ran into problems and stopped working off the coast of Rio de Janeiro due to fatigue of its long intake tubes [184]. Studies associated with ocean renewable energy in Brazil began in 2001 at the Federal University of Rio de Janeiro (UFRJ), focusing on wave and tidal energy. Some other universities have also started working in this field, such as the Federal University of Maranhão (UFMA), the Federal University of Santa Catarina (UFSC), the Federal University of Pará (UFPA), and the Federal University of Itajubá (UNIFEI).
There are three main ocean renewable energy projects being carried out in Brazil with different technology readiness levels. The first one is the COPPE (The Alberto Luiz Coimbra Institute for Graduate Studies and Research in Engineering) hyperbaric wave converter developed by the UFRJ, which has reached the prototype stage. A full-scale single device of the technology was installed in 2011 in Pecém port of Ceará state located in the northeast of Brazil. The device was decommissioned after 6 months of operation due to the port extension project. The second project is a nearshore wave energy converter, also developed by the UFRJ, which will be installed in relatively shallow water (water depth of 25–30 m) off the Rio de Janeiro coast. The technology is at the R&D stage and is undergoing medium-scale laboratory tests. The last project is the tidal range project of the Bacanga River estuary located in São Luís of Maranhão state in North Brazil. Although the discussion about the tidal energy extraction in this region is relatively old, the project is still at an early stage of development as it is waiting for finance. The following sections describe the characteristics and statuses of the mentioned projects.
4.2.1. COPPE Hyperbaric Wave Converter
As illustrated in Figure 18, this device is composed of a floating body connected to the pumping modules, a hydrodynamic accumulator, a hyperbaric chamber, and a generating unit. The vertical motion of the floating body due to the wave body interactions drives the pump actuator which displaces the water inside the closed circuit to a hydro-pneumatic accumulator. The accumulator is connected to a hyperbaric chamber, which has previously been pressurized. Then, the pressurized water drives a hydraulic turbine coupled to an electrical generator. The hyperbaric chamber works as an energy storage system, which smooth the power fluctuations due to the oscillatory nature of sea waves. The applied pressure is in the range of 250−400 m of water column (m.wc) [185].
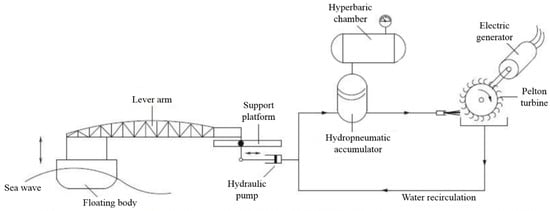
Figure 18.
A schematic of the COPPE/UFRJ (Federal University of Rio de Janeiro) hyperbaric wave converter [185].
Additionally, a discrete control scheme was applied to the system to improve power production by adjusting the PTO parameters without wave measurement [186]. The experimental tests were performed at the Ocean Technology Laboratory (LabOceano) of the UFRJ. Figure 19 shows the medium-scale model at a ratio of 1:10 which was tested under regular and irregular wave conditions corresponding to the predominant wave climate at the location of installation [187,188]. As a result of the experimental tests, a capture width ratio of between 19% and 36% was observed for the wave energy converter.
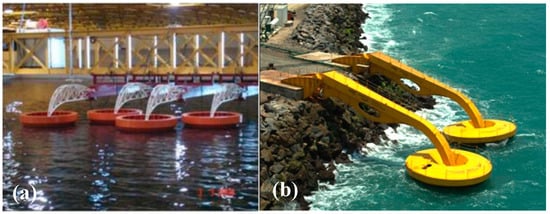
Figure 19.
COPPE hyperbaric wave converter: (a) medium-scale model with a ratio of 1:10 at LabOceano [187]: (b) installed full-scale prototype.
A full-scale prototype with a capacity of 100 kW was deployed at the Pecém port in Northeast Brazil (Figure 19b). The device was installed on two concrete bases, 12 m in length, built on a breakwater. The oscillating part, which consists of a floater, 10 m in diameter, and a mechanical arm, 22 m in length, is connected to two skids mounted on the concrete bases.
4.2.2. COPPE Nearshore WEC
The system is a point absorber WEC type with a capacity of 50 kW that consists of an oscillating body and a bottom-mounted support structure. The oscillating part is a floating conical cylinder which is allowed to move only in the heave direction (Figure 20). The fixed structure consists of four columns with very small diameters relative to the wavelengths (no diffraction). The structure is mounted on the seabed through a concrete base. Eight roller bearings facilitate oscillation of the buoy in the vertical direction (heave). They are placed on the top and bottom of the cylindrical section.
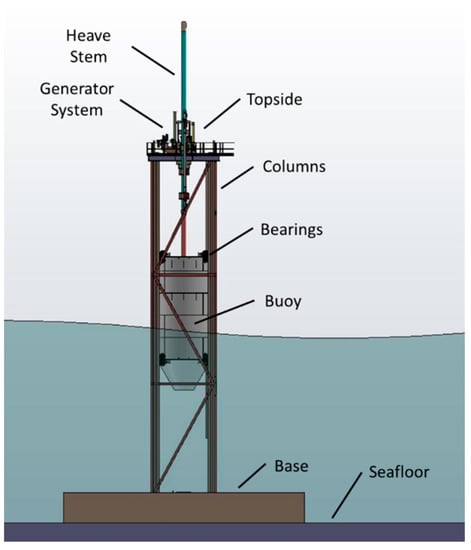
Figure 20.
Components of the COPPE nearshore WEC.
The PTO system is located on the topside deck and consists of a gearbox and a rotational generator (Figure 21). The vertical motion of the buoy is transferred through a central rod (heave stem) to the gearbox. Then, the pulley converts the vertical movement into rotation that is adequate for the electrical generator. A backstop system unifies the rotation direction using freewheels. This implies that the buoy can drive the PTO system either upwards or downwards. A solid cylindrical flywheel is used to amplify the rotational inertia as well as smooth the delivered energy to the generator. Additionally, the PTO system includes a gearbox that multiplies the rotational speed so that it is adequate for power generation.
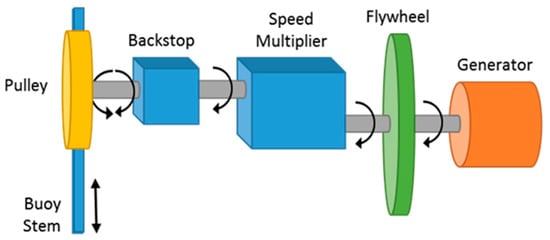
Figure 21.
Schematic view of the power take-off (PTO) system.
The location that has been considered for installation of the WEC is near to a small island called “Ilha Rasa”. The location’s water depth is about 20 m, and its distance from shore (Copacabana beach, Rio de Janeiro, Brazil) is about 14 km. The predominant wave climate of the region is a peak period of and a significant height of . Shadman et al. [189] showed that a very large buoy is required to maximize the power absorption in a region like nearshore Rio de Janeiro, where the predominate wave periods are beyond 7 s. This might lead to higher costs, which could make the project economically infeasible. Hence, a specific control called “latching”, presented originally by Budal and Falnes [190], was applied on the WEC to overcome this challenge. Latching is a mechanical control method that tunes the natural period of the buoy to the predominate wave period of the sea site by halting and releasing the buoy at its motion extremum. As a result, larger buoy motion amplitude and velocities can be achieved, leading to higher power production. Eventually, the latching control enables a smaller buoy with a smaller natural period to be tuned with such a wave climate [191]. A hydraulic system is designed and tested for latching the oscillating buoy.
Experimental tests of small-scale models, shown in Figure 22, were performed in a wave and current channel (LOC) at the COPPE/UFRJ. The hydrodynamic behavior of the buoy was studied by applying different modeling scales including 1:17, 1:20, 1:30, and 1:40. Additionally, a strategy was developed to investigate the effect of latching control on the WEC.
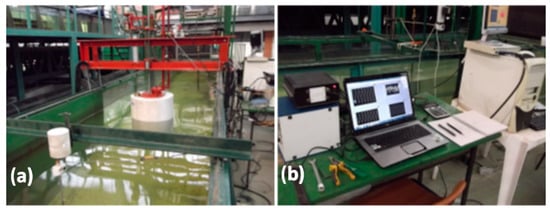
Figure 22.
Experimental tests of the COPPE nearshore WEC in a wave channel: (a) 1:17 scaled model, (b) instruments for data acquisition.
4.2.3. Tidal Power Plant of the Estuary of Bacanga
The largest tidal ranges in Brazil are located on the North coast including the coastal areas of Maranhão, Pará, and Amapá. For instance, a tidal energy potential of 22 TWh/year has been estimated for Maranhão state [192]. Some studies have addressed the exploitation of such energy in Brazil [193,194]. As Figure 23a illustrates, the Bacanga basin is 10,219 ha in size, which includes the estuarine body of water and the Bacanga lake. The reservoir capacity is about 40 million cubic meters at an elevation of +4.5 m, corresponding to the spring tide level [192]. As shown in Figure 23b, the dam includes an 800 m embankment rock which is filled with clay material. Additionally, the dam has two sluice gate systems types of radial and stop-log that were installed in 1974 and 1980, respectively. There are three radial sluice gates with widths of approximately 12.5 m. In the case of a fully open gate, a water height level of 4.5 m is registered for each radial gate. This value is about 3 m for the stop-log gates, which are flat and operate vertically, with widths of 2.85 m.
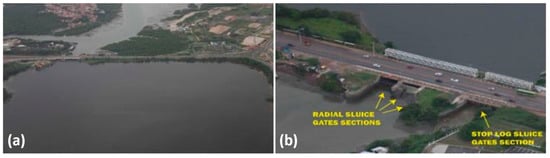
Figure 23.
(a) The Bacanga Estuary, and (b) aerial image of the radial and stop-log sluice gates [192].
Considering some restrictions, including a reservoir water level limit of +2.5 m, Neto et al. [192] proposed a new model for the tidal power plant in which the three radial sluice gates were replaced by the modern and appropriate version for automatic operation, which excluded the necessity of using stop-log type gates to control the reservoir maximum limit. Considering the Kaplan turbine with double regulation provided by ANDRITZ HYDRO [195], they estimated an annual energy production of slightly larger than 14 GWh/yr for the power plant.
5. Discussion and Open Question
The present cost of ocean renewable energy cannot complete with that of grid-connected renewables. The alternative, nowadays, in addition to the development of more optimized projects, is to look for new markets where electricity generation options are either scarce or expensive, for example the oil and gas industry, aquaculture, defense, and the demands from isolated communities. In the particular case of Brazil, there is a concentration of power generation, mostly from hydroelectric plants, located in the South and Southeast regions. It has been demonstrated that a significant amount of ocean renewable energy featuring an ocean thermal gradient is located in the regions D and C (see Figure 2). In these regions, an annual electricity production of 0.8 TWh per year has been calculated, considering only six OTEC plants with 10 MW installed power, as presented in this paper. Accordingly, considering an annual average of 15 MW, 20 OTEC plants would be sufficient to supply approximately 10% of the total residential electricity consumption of the Northeast region of Brazil, which was estimated to be approximately 27.059 TWh in 2017 [183]. This implies that such renewable energy resources could be harnessed as a supplementary alternative for these regions, especially when there is a power generation drop due to seasonal rain shortage. Additionally, the low seasonal and temporal variability of the ocean renewable resources along the Brazilian coast could provide stable power production throughout the year, with substantial capacity. The supply chain associated with ocean renewable technologies is still incipient worldwide. The increasing prototype deployments may promote the association of local supply chains with the global suppliers of specific equipment such as submarine cables, electrical connectors, turbines, and generators. In Brazil, the supply chain would consist of companies already operating in the offshore oil and gas sector. This is a very robust sector, which will be able to meet the demands of the ocean renewable energy sector. The synergy of the long-established offshore oil and gas sector and the new ocean renewable energy sources could represent a crucial factor for the success of the new industry. Updated technologies must be incorporated, especially digital ones associated with artificial intelligence, control, and robotics to provide competitive services for inspection and maintenance, reducing the operational costs. New materials, such as the composites associated with innovative floating structures and installation methods, can also contribute to the competitiveness of the new sector in terms of the electricity cost. In Brazil, the large number of hydropower plants and the complex grid system also present opportunities for the implementation of ocean renewable energy sources. Hydropower plants could be designed as storage components of the whole electrical system, combining a better water supply with clean and efficient power generation throughout the country. The substitution of oil and gas-based power plants for ocean renewables would modify the national energy matrix substantially, reinforcing sustainably oriented electricity generation.
6. Conclusions
This paper, as a preliminary approach, has presented an assessment of ocean renewable energy resources, including wave, ocean current and thermal gradient energy, along the Brazilian coastline. The results show considerable ocean currents, thermal gradients, and wave energy in the regions D, C and A, respectively. A maximum annual average velocity of 1.52 m/s, which represents a power density of approximately 500 , was observed for the ocean current energy in the region D near the equatorial margin of Brazil. However, the distance of the resource to the coastline, between 120 and 300 km, is an obstacle to its commercialization. The total theoretical potential of wave energy is estimated to be 91.8 GW along the coastline. The most energetic waves occur in the region A, following by the regions C, B, and D, with average power values of 21.1, 13.8, 12.4, and 7.4 kW/m, respectively. In the region C, the wave resource has the least temporal variability compared with the other regions; nevertheless, the differences are small, and they decrease with an increasing water depth. The results revealed an annual average ocean thermal gradient, between the water depths of 20 and 1000 m, of more than 20 °C for latitudes above 27. A mean thermal gradient of 20 °C between the upper layers and water depth between 500 and 700 m can be achieved throughout the year in the regions D and C. This could facilitate the process of bringing cold water from the deep sea, compared with the usual water depth of 1000 m.
The paper also presented an overview of the potential technologies and their statuses of development related to ocean renewable energy sources worldwide. Although available studies indicate different values for the global resource potential, they converge in presenting the ocean thermal gradient as being the most energetic resource followed by waves, salinity gradients, and tides. The TRL and the status of the current projects imply that the global interest tends toward tidal current and wave devices.
Large-scale installations, learning-curves, and innovation are necessary to make the cost of energy competitive with solar and onshore wind energy production. About 27% of the current projects are at the pre-deployment phase and, optimistically, will be deployed in the open sea in the next three years. Apart from tidal range technology, which is already close to the commercialization stage, research, development, and demonstration projects have been led by universities and startups, mostly by taking advantage of public financing. Nevertheless, in the last five years, large industry players and utilities have started carrying out activities and financing in the sector. This is an important step towards speeding up technology commercialization due to the new players’ capability to execute utility-scale projects.
Author Contributions
Conceptualization, M.S.; Formal analysis, M.S. and D.F.; Methodology, M.S. and D.F.; Project administration, M.S.; Resources, L.P.d.F.A.; Software, D.F.; Supervision, L.L., C.L. and S.F.E.; Visualization, C.S. and Z.W.; Writing—original draft, M.S., C.S. and Z.W.; Writing—review & editing, L.P.d.F.A., L.L., C.L. and S.F.E.
Funding
This research received no external funding.
Acknowledgments
The authors acknowledge CNPq, the Ministry of Science, Technology, Innovation and Communication/Brazil, for supporting the research activities of the authors. Additionally, the first author highly appreciates the Instituto Nacional de Ciência e Tecnologia—Energias Oceânicas e Fluviais (INEOF) for supporting his research activities. The third author acknowledges David Holland and the Center for Global Sea Level Change from New York University Abu Dhabi for supporting her research work.
Conflicts of Interest
The authors declare no conflict of interest.
References
- International Renewable Energy Agency (IRENA). Global Energy Transformation: A Roadmap to 2050; International Renewable Energy Agency: Abu Dhabi, UAE, 2018. [Google Scholar]
- Luomi, M. Sustainable Energy in Brazil: Reversing Past Achievements or Realizing Future Potential; The Oxford Institute for Energy Studies: Oxford, UK, 2014; Volume SP-34, ISBN 978-1-78467-005-4. [Google Scholar]
- International Monetary Fund (IMF). IMF Country Information. Available online: https://www.imf.org/en/Countries (accessed on 1 June 2019).
- Empresa de Pesquisa Energética (EPE). Brazilian Energy Balance—Summary Report: Year Base 2017; Empresa de Pesquisa Energética: Rio de Janeiro, Brazil, 2018.
- International Energy Agency. World Energy Outlook 2016; International Energy Agency: Paris, France, 2016. [Google Scholar]
- International Energy Agency. World Energy Outlook 2017; International Energy Agency: Paris, France, 2017. [Google Scholar]
- Dias, V.S.; da Luz, M.P.; Medero, G.M.; Nascimento, D.T.F. An overview of hydropower reservoirs in Brazil: Current situation, future perspectives and impacts of climate change. Water 2018, 10, 592. [Google Scholar] [CrossRef]
- Von Sperling, E. Hydropower in Brazil: Overview of positive and negative environmental aspects. Energy Procedia 2012, 18, 110–118. [Google Scholar] [CrossRef]
- Reggiani, M.C.P. Hydropower in Brazil-Development and Challenges. Master’s thesis, Norwegian University of Science and Technology, NTNU, Trondheim, Norway, December 2015. [Google Scholar] [CrossRef]
- Rocha Lessa, A.C.; Dos Santos, M.A.; Lewis Maddock, J.E.; Dos Santos Bezerra, C. Emissions of greenhouse gases in terrestrial areas pre-existing to hydroelectric plant reservoirs in the Amazon: The case of Belo Monte hydroelectric plant. Renew. Sustain. Energy Rev. 2015, 51, 1728–1736. [Google Scholar] [CrossRef]
- Beserra, E.R.; Mendes, A.; Estefen, S.F.; Parente, C.E. Wave climate analysis for a wave energy conversion application in Brazil. In Proceedings of the ASME 2007 26th International Conference on Offshore Mechanics and Arctic Engineering, San Diego, CA, USA, 10–15 June 2007; pp. 897–902. [Google Scholar]
- Oleinik, P.H.; Marques, W.C.; Kirinus, E.D.P. Estimate of the wave climate on the most energetic locations of the south-southeastern Brazilian shelf. Defect Diffus. Forum 2017, 370, 130–140. [Google Scholar] [CrossRef]
- Kirinus, E.D.P.; Marques, W.C. Viability of the application of marine current power generators in the south Brazilian shelf. Appl. Energy 2015, 155, 23–34. [Google Scholar] [CrossRef]
- Kirinus, E.D.P.; Oleinik, P.H.; Costi, J.; Marques, W.C. Long-term simulations for ocean energy off the Brazilian coast. Energy 2018, 163, 364–382. [Google Scholar] [CrossRef]
- Martins, J.C.; Goulart, M.M.; Gomes, M.N.; Souza, J.A.; Rocha, L.A.O.; Isoldi, L.A.; Santos, E.D. Geometric evaluation of the main operational principle of an overtopping wave energy converter by means of Constructal Design. Renew. Energy 2018, 118, 727–741. [Google Scholar] [CrossRef]
- Barbosa, D.V.E.; Santos, A.L.G.; Santos, E.D.; Souza, J.A. International journal of heat and mass transfer overtopping device numerical study: Openfoam solution verification and evaluation of curved ramps performances. Int. J. Heat Mass Transf. 2019, 131, 411–423. [Google Scholar] [CrossRef]
- Jung, J.Y.; Lee, H.S.; Kim, H.J.; Yoo, Y.; Choi, W.Y.; Kwak, H.Y. Thermoeconomic analysis of an ocean thermal energy conversion plant. Renew. Energy 2016, 86, 1086–1094. [Google Scholar] [CrossRef]
- Empresa de Pesquisa Energética (EPE). Plano Nacional de Energia—PNE 2030; Empresa de Pesquisa Energética: Rio de Janeiro, Brazil, 2007.
- Empresa de Pesquisa Energética (EPE). Plano Nacional de Energia—2050. Available online: http://www.epe.gov.br/pt/publicacoes-dados-abertos/publicacoes/Plano-Nacional-de-Energia-2050 (accessed on 18 April 2019).
- Agência Nacional de Energia Elétrica (ANEEL). Volume 3–8 Evolução Tecnológica Nacional no Segmento Geração de Energia Elétrica e Armazenamento de Energia; Agência Nacional de Energia Elétrica: Brasília, Brazil, 2017.
- Schmitz, W.J., Jr. On the interbasin-scale thermohaline circulation. Rev. Geophys. 1995, 33, 151–173. [Google Scholar] [CrossRef]
- Stramma, L.; England, M. On the water masses and mean circulation of the South Atlantic Ocean. J. Geophys. Res. Ocean. 1999, 104, 20863–20883. [Google Scholar] [CrossRef]
- Schott, F.A.; Dengler, M.; Zantopp, R.; Stramma, L.; Fischer, J.; Brandt, P. The shallow and deep western boundary circulation of the South Atlantic at 5°–11° S. J. Phys. Oceanogr. 2005, 35, 2031–2053. [Google Scholar] [CrossRef]
- Rodrigues, R.R.; Rothstein, L.M.; Wimbush, M. Seasonal variability of the South Equatorial Current bifurcation in the Atlantic Ocean: A numerical study. J. Phys. Oceanogr. 2007, 37, 16–30. [Google Scholar] [CrossRef]
- Peterson, R.G.; Stramma, L. Upper-level circulation in the South Atlantic Ocean. Prog. Oceanogr. 1991, 26, 1–73. [Google Scholar] [CrossRef]
- Soutelino, R.G.; Da Silveira, I.C.A.; Gangopadhyay, A.; Miranda, J.A. Is the Brazil Current eddy-dominated to the north of 20° S? Geophys. Res. Lett. 2011, 38, 1–5. [Google Scholar] [CrossRef]
- Madec, G. NEMO Ocean Engine; Note du Pôle Modélisation, Institut Pierre-Simon Laplace: Paris, France, 2011; pp. 1–332. [Google Scholar]
- Madec, G.; Imbard, M. A global ocean mesh to overcome the North Pole singularity. Clim. Dyn. 1996, 12, 381–388. [Google Scholar] [CrossRef]
- Amante, C.; Eakins, B.W. Arc-minute global relief model: procedures, data sources and analysis. NOAA Technical Memorandum NESDIS NGDC-24; National Geophysical Data Center NOAA: Boulder, CO, USA, 2018.
- Lowcher, C.F.; Muglia, M.; Bane, J.M.; He, R.; Gong, Y.; Haines, S.M. Marine hydrokinetic energy in the gulf stream off North Carolina: An assessment using observations and ocean circulation models. In Marine Renewable Energy: Resource Characterization and Physical Effects; Yang, Z., Copping, A., Eds.; Springer International Publishing: Cham, Switzerland, 2017; pp. 237–258. ISBN 978-3-319-53534-0. [Google Scholar]
- Myers, L.; Bahaj, A.S. Power output performance characteristics of a horizontal axis marine current turbine. Renew. Energy 2006, 31, 197–208. [Google Scholar] [CrossRef]
- Batten, W.M.J.; Bahaj, A.S.; Molland, A.F.; Chaplin, J.R. The prediction of the hydrodynamic performance of marine current turbines. Renew. Energy 2008, 33, 1085–1096. [Google Scholar] [CrossRef]
- Nihous, G.C. An order-of-magnitude estimate of ocean thermal energy conversion resources. J. Energy Resour. Technol. 2005, 127, 328. [Google Scholar] [CrossRef]
- Nihous, G.C. A preliminary assessment of ocean thermal energy conversion resources. J. Energy Resour. Technol. 2007, 129, 10. [Google Scholar] [CrossRef]
- Devis-Morales, A.; Montoya-Sánchez, R.A.; Osorio, A.F.; Otero-Díaz, L.J. Ocean thermal energy resources in Colombia. Renew. Energy 2014, 66, 759–769. [Google Scholar] [CrossRef]
- Nihous, G.C. Conceptual design of a small open-cycle OTEC plant for the production of electricity and fresh water in a Pacific Island. In Proceedings of the International Conference on Ocean Energy Recovery, Honolulu, HI, USA, 28–30 November 1989. [Google Scholar]
- Vega, L.A.; Nihous, G.C. Design of a 5 MWe OTEC pre-commercial plant. In Proceedings of the Oceanology International’94 Conference, Brighton, UK, 8–11 March 1994. [Google Scholar]
- Ardhuin, F.; Rogers, E.; Babanin, A.; Filipot, J.-F.; Magne, R.; Roland, A.; Van Der Westhuysen, A.; Queffeulou, P.; Lefevre, J.-M.; Aouf, L.; et al. Semi-empirical dissipation source functions for ocean waves: Part I, definition, calibration and validation. J. Phys. Oceanogr. 2010, 40, 1917–1941. [Google Scholar] [CrossRef]
- Nielsen, P. Coastal and Estuarine Processes, Advanced Series on Ocean Engineering, 29th ed.; World Scientific: Singapore, 2009; Volume 29, ISBN 978-981-283-711-0. [Google Scholar]
- Cornett, A. A global wave energy resource assessment. Proc. ISOPE 2008, 8, 318–326. [Google Scholar]
- Barstow, S.F.; Mørk, G.; Lønseth, L.; Mathisen, J.P. WorldWaves wave energy resource assessments from the deep ocean to the coast. J. Energy Power Eng. 2011, 5, 730–742. [Google Scholar]
- Mork, G.; Barstow, S.; Kabuth, A.; Pontes, M.T. Assessing the global wave energy potential. In Proceedings of the ASME 2010 29th International Conference on Ocean, Offshore and Arctic Engineering, Shanghai, China, 6–11 June 2010; pp. 447–454. [Google Scholar]
- Sims, R.E.H.; Schock, R.N.; Adegbululgbe, A.; Fenhann, J.; Konstantinaviciute, I.; Moomaw, W.; Nimir, H.B.; Schlamadinger, B.; Torres-Martínez, J.; Turner, C.; et al. Energy supply. In Climate Change 2007: Mitigation. Contribution of Working Group III to the Fourth Assessment Report of the Intergovernmental Panel on Climate Change; Cambridge University Press: Cambridge, UK; New York, NY, USA, 2007; pp. 252–322. ISBN 978-0-511-54601-3. [Google Scholar]
- Krewitt, W.; Nienhaus, K.; Kleßmann, C.; Capone, C.; Stricker, E.; Graus, W.; Hoogwijk, M.; Supersberger, N.; von Winterfeld, U.; Samadi, S. Role and Potential of Renewable Energy and Energy Efficiency for Global Energy Supply, 18th ed.; German Federal Environment Agency: Dessau-Roßlau, German, 2009; Volume 18. [Google Scholar]
- Izadparast, A.H.; Niedzwecki, J.M. Estimating the potential of ocean wave power resources. Ocean Eng. 2011, 38, 177–185. [Google Scholar] [CrossRef]
- Wu, S.; Liu, C.; Chen, X. Offshore wave energy resource assessment in the East China Sea. Renew. Energy 2015, 76, 628–636. [Google Scholar] [CrossRef]
- Mirzaei, A.; Tangang, F.; Juneng, L. Wave energy potential assessment in the central and southern regions of the South China Sea. Renew. Energy 2015, 80, 454–470. [Google Scholar] [CrossRef]
- Mentaschi, L.; Besio, G.; Cassola, F.; Mazzino, A. Performance evaluation of Wavewatch III in the Mediterranean Sea. Ocean Model. 2015, 90, 82–94. [Google Scholar] [CrossRef]
- Silva, D.; Bento, A.R.; Martinho, P.; Soares, C.G. High resolution local wave energy modelling in the Iberian Peninsula. Energy 2015, 91, 1099–1112. [Google Scholar] [CrossRef]
- Penalba, M.; Ulazia, A.; Ibarra-berastegui, G.; Ringwood, J.; Sáenz, J. Wave energy resource variation off the west coast of Ireland and its impact on realistic wave energy converters’ power absorption. Appl. Energy 2018, 224, 205–219. [Google Scholar] [CrossRef]
- Ahn, S.; Haas, K.A.; Neary, V.S. Wave energy resource classification system for US coastal waters. Renew. Sustain. Energy Rev. 2019, 104, 54–68. [Google Scholar] [CrossRef]
- Kerr, D. Marine energy. Philos. Trans. R. Soc. A Math. Phys. Eng. Sci. 2007, 365, 971–992. [Google Scholar] [CrossRef] [PubMed]
- Ocean Energy Systems (OES). Tidal & Currents. Available online: https://www.ocean-energy-systems.org/about-oes/what-is-ocean-energy/tidal-currents/ (accessed on 18 April 2019).
- Neill, S.P.; Vögler, A.; Goward-Brown, A.J.; Baston, S.; Lewis, M.J.; Gillibrand, P.A.; Waldman, S.; Woolf, D.K. The wave and tidal resource of Scotland. Renew. Energy 2017, 114, 3–17. [Google Scholar] [CrossRef]
- Alonso, R.; Jackson, M.; Santoro, P.; Fossati, M.; Solari, S.; Teixeira, L. Wave and tidal energy resource assessment in Uruguayan shelf seas. Renew. Energy 2017, 114, 18–31. [Google Scholar] [CrossRef]
- Lewis, M.; Neill, S.P.; Robins, P.E.; Hashemi, M.R. Resource assessment for future generations of tidal-stream energy arrays. Energy 2015, 83, 403–415. [Google Scholar] [CrossRef]
- Chen, W.B.; Liu, W.C.; Hsu, M.H. Modeling assessment of tidal current energy at Kinmen Island, Taiwan. Renew. Energy 2013, 50, 1073–1082. [Google Scholar] [CrossRef]
- Rashid, A. Status and potentials of tidal in-stream energy resources in the southern coasts of Iran: A case study. Renew. Sustain. Energy Rev. 2012, 16, 6668–6677. [Google Scholar] [CrossRef]
- Lewis, A.; Estefen, S.; Huckerby, J.; Lee, K.S.; Musial, W.; Pontes, T.; Torres-Martinez, J. Ocean energy. In IPCC Special Report on Renewable Energy Sources and Climate Change Mitigation; Edenhofer, O., Pichs-Madruga, R., Sokona, Y., Seyboth, K., Matschoss, P., Kadner, S., Zwickel, T., Eickemeie, P., Hansen, G., Schlömer, S., et al., Eds.; Cambridge University Press: Cambridge, UK; New York, NY, USA, 2011; pp. 497–534. [Google Scholar]
- Yang, X.; Haas, K.A.; Fritz, H.M. Evaluating the potential for energy extraction from turbines in the gulf stream system. Renew. Energy 2014, 72, 12–21. [Google Scholar] [CrossRef]
- Chang, Y.C.; Chu, P.C.; Tseng, R.S. Site selection of ocean current power generation from drifter measurements. Renew. Energy 2015, 80, 737–745. [Google Scholar] [CrossRef]
- Goundar, J.N.; Ahmed, M.R. Marine current energy resource assessment and design of a marine current turbine for Fiji. Renew. Energy 2014, 65, 14–22. [Google Scholar] [CrossRef]
- Mofor, L.; Goldsmith, J.; Jones, F. Ocean Energy: Technology Readiness, Patents, Deployment Status and Outlook; International Renewable Energy Agency (IRENA): Abu Dhabi, UAE, 2014. [Google Scholar]
- Pelc, R.; Fujita, R.M. Renewable energy from the ocean. Mar. Policy 2002, 26, 471–479. [Google Scholar] [CrossRef]
- Rajagopalan, K.; Nihous, G.C. An assessment of global ocean thermal energy conversion resources with a high-resolution ocean general circulation model. J. Energy Resour. Technol. 2013, 135, 041202. [Google Scholar] [CrossRef]
- Skråmestø, Ø.S.Ø.; Skilhagen, S.S.E.; Nielsen, W.K.W. Power production based on osmotic pressure. Waterpower XVI 2009, 1–9. Available online: https://www.statkraft.com/globalassets/old-contains-the-old-folder-structure/documents/waterpower_xvi_-_power_production_based_on_osmotic_pressure_tcm21-4795.pdf (accessed on 18 April 2019).
- Alvarez-Silva, O.A.; Osorio, A.F.; Winter, C. Practical global salinity gradient energy potential. Renew. Sustain. Energy Rev. 2016, 60, 1387–1395. [Google Scholar] [CrossRef]
- Alvarez-Silva, O.A.; Osorio, A.F. Salinity gradient energy potential in Colombia considering site specific constraints. Renew. Energy 2015, 74, 737–748. [Google Scholar] [CrossRef]
- Maisonneuve, J.; Pillay, P.; La, C.B. Osmotic power potential in remote regions of Quebec. Renew. Energy 2015, 81, 62–70. [Google Scholar] [CrossRef]
- Emdadi, A.; Gikas, P.; Farazaki, M.; Emami, Y. Salinity gradient energy potential at the hyper saline Urmia Lake—ZarrinehRud River system in Iran. Renew. Energy 2016, 86, 154–162. [Google Scholar] [CrossRef]
- Helfer, F.; Lemckert, C.; Anissimov, Y.G. Osmotic power with Pressure Retarded Osmosis: Theory, performance and trends—A review. J. Membr. Sci. 2014, 453, 337–358. [Google Scholar] [CrossRef]
- Rusu, E.; Venugopal, V. Offshore Renewable Energy—Ocean Waves, Tides, and Offshore Wind; Rusu, E., Venugopal, V., Eds.; MDPI: Basel, Switzerland, 2019; ISBN 978-3-03897-593-9. [Google Scholar]
- Li, Y.; Yu, Y.H. A synthesis of numerical methods for modeling wave energy converter-point absorbers. Renew. Sustain. Energy Rev. 2012, 16, 4352–4364. [Google Scholar] [CrossRef]
- EMEC European Marine Energy Centre Ltd. Wave Devices. Available online: http://www.emec.org.uk/marine-energy/wave-devices/ (accessed on 18 April 2019).
- López, I.; Andreu, J.; Ceballos, S.; Martínez De Alegría, I.; Kortabarria, I. Review of wave energy technologies and the necessary power-equipment. Renew. Sustain. Energy Rev. 2013, 27, 413–434. [Google Scholar] [CrossRef]
- Heath, T.V. A review of oscillating water columns. Philos. Trans. R. Soc. A Math. Phys. Eng. Sci. 2012, 370, 235–245. [Google Scholar] [CrossRef] [PubMed]
- Ning, D.Z.; Wang, R.Q.; Zou, Q.P.; Teng, B. An experimental investigation of hydrodynamics of a fixed OWC Wave Energy Converter. Appl. Energy 2016, 168, 636–648. [Google Scholar] [CrossRef]
- Fernandes, M.P.; Vieira, S.M.; Henriques, J.C.; Valério, D.; Gato, L.M. Short-term prediction in an Oscillating Water Column using Artificial Neural Networks. In Proceedings of the 2018 International Joint Conference on Neural Networks (IJCNN), Rio de Janeiro, Brazil, 8–13 July 2018; pp. 1–7. [Google Scholar]
- Bull, D.; Jenne, D.S.; Smith, C.S.; Copping, A.E.; Copeland, G. Levelized cost of energy for a Backward Bent Duct Buoy. Int. J. Mar. Energy 2016, 16, 220–234. [Google Scholar] [CrossRef]
- Sheng, W. Motion and performance of BBDB OWC wave energy converters: I, hydrodynamics. Renew. Energy 2019, 138, 106–120. [Google Scholar] [CrossRef]
- Falcão, A.F.O.; Henriques, J.C.C. Model-prototype similarity of oscillating-water-column wave energy converters. Int. J. Mar. Energy 2014, 6, 18–34. [Google Scholar] [CrossRef]
- Dias, F.; Renzi, E.; Gallagher, S.; Sarkar, D.; Wei, Y.; Abadie, T.; Cummins, C.; Rafiee, A. Analytical and computational modelling for wave energy systems: The example of oscillating wave surge converters. Acta Mech. Sin. 2017, 33, 647–662. [Google Scholar] [CrossRef] [PubMed]
- Yemm, R.; Pizer, D.; Retzler, C.; Henderson, R. Pelamis: Experience from concept to connection. Philos. Trans. R. Soc. A Math. Phys. Eng. Sci. 2012, 370, 365–380. [Google Scholar] [CrossRef]
- Zheng, S.; Zhang, Y. Analytical study on hydrodynamic performance of a raft-type wave power device. J. Mar. Sci. Technol. 2017, 22, 620–632. [Google Scholar] [CrossRef]
- Olaya, S.; Bourgeot, J.M.; Benbouzid, M. Optimal control for a self-reacting point absorber: A one-body equivalent model approach. In Proceedings of the 2014 International Power Electronics and Application Conference and Exposition, Shanghai, China, 5–8 November 2014; pp. 1–6. [Google Scholar]
- Todalshaug, J.H.; Ásgeirsson, G.S.; Hjálmarsson, E.; Maillet, J.; Möller, P.; Pires, P.; Guérinel, M.; Lopes, M. Tank testing of an inherently phase-controlled wave energy converter. Int. J. Mar. Energy 2016, 15, 68–84. [Google Scholar] [CrossRef]
- Sergiienko, N.Y.; Cazzolato, B.S.; Ding, B.; Arjomandi, M. Three-tether axisymmetric wave energy converter: Estimation of energy delivery. In Proceedings of the 3rd Asian Wave and Tidal Energy Conference (AWTEC 2016), Singapore, 24–28 October 2016; pp. 163–171. [Google Scholar]
- Kofoed, J.P.; Frigaard, P.; Friis-Madsen, E.; Sørensen, H.C. Prototype testing of the wave energy converter wave dragon. Renew. Energy 2006, 31, 181–189. [Google Scholar] [CrossRef]
- Musa, M.A.; Maliki, A.Y.; Ahmad, M.F.; Sani, W.N.; Yaakob, O.; Samo, K.B. Numerical simulation of wave flow over the overtopping breakwater for energy conversion (OBREC) device. Procedia Eng. 2017, 194, 166–173. [Google Scholar] [CrossRef]
- Liu, Z.; Shi, H.; Cui, Y.; Kim, K. Experimental study on overtopping performance of a circular ramp wave energy converter. Renew. Energy 2017, 104, 163–176. [Google Scholar] [CrossRef]
- Alam, M.R. Nonlinear analysis of an actuated seafloor-mounted carpet for a high-performance wave energy extraction. Proc. R. Soc. A Math. Phys. Eng. Sci. 2012, 468, 3153–3171. [Google Scholar] [CrossRef]
- Durand, M.; Babarit, A.; Pettinotti, B.; Quillard, O.; Toularastel, J.L.; Clément, A.H. Experimental validation of the performances of the SEAREV wave energy converter with real time latching control. In Proceedings of the 7th European Wave and Tidal Energy Conference, Porto, Portugal, 11–13 September 2007; pp. 1–8. [Google Scholar]
- Zhang, Z.; Chen, B.; Nielsen, S.R.K.; Olsen, J. Gyroscopic power take-off wave energy point absorber in irregular sea states. Ocean Eng. 2017, 143, 113–124. [Google Scholar] [CrossRef]
- Camporeale, S.M.; Filianoti, P.; Torresi, M. Performance of a Wells turbine in an OWC device in comparison to laboratory tests. In Proceedings of the 9th European Wave and Tidal Energy Conference (EWTEC), Southampton, UK, 5–9 September 2011; p. 9. [Google Scholar]
- Carrelhas, A.A.D.; Gato, L.M.C.; Henriques, J.C.C.; Falcão, A.F.O.; Varandas, J. Test results of a 30 kW self-rectifying biradial air turbine-generator prototype. Renew. Sustain. Energy Rev. 2019, 109, 187–198. [Google Scholar] [CrossRef]
- António, F.D.O. Phase control through load control of oscillating-body wave energy converters with hydraulic PTO system. Ocean Eng. 2008, 35, 358–366. [Google Scholar]
- Zhang, D.; Li, W.; Ying, Y.; Zhao, H.; Lin, Y.; Bao, J. Wave energy converter of inverse pendulum with double action power take off. Proc. Inst. Mech. Eng. Part C J. Mech. Eng. Sci. 2013, 227, 2416–2427. [Google Scholar] [CrossRef]
- Gaspar, J.F.; Calvário, M.; Kamarlouei, M.; Soares, C.G. Design tradeoffs of an oil-hydraulic power take-off for wave energy converters. Renew. Energy 2018, 129, 245–259. [Google Scholar] [CrossRef]
- Zhang, H.; Xu, D.; Ding, R.; Zhao, H.; Lu, Y.; Wu, Y. Embedded Power Take-Off in hinged modularized floating platform for wave energy harvesting and pitch motion suppression. Renew. Energy 2019, 138, 1176–1188. [Google Scholar] [CrossRef]
- Albert, A.; Berselli, G.; Bruzzone, L.; Fanghella, P. Mechanical design and simulation of an onshore four-bar wave energy converter. Renew. Energy 2017, 114, 766–774. [Google Scholar] [CrossRef]
- Liang, C.; Ai, J.; Zuo, L. Design, fabrication, simulation and testing of an ocean wave energy converter with mechanical motion rectifier. Ocean Eng. 2017, 136, 190–200. [Google Scholar] [CrossRef]
- Yin, X.; Li, X.; Boontanom, V.; Zuo, L. Mechanical motion rectifier based efficient power takeoff for ocean wave energy harvesting. In Proceedings of the ASME 2017 Dynamic Systems and Control Conference, Fairfax, VA, USA, 11–13 October 2017; p. 5. [Google Scholar]
- Mueller, M.A. Electrical generators for direct drive wave energy converters. IEE Proc. Gener. Transm. Distrib. 2002, 149, 446. [Google Scholar] [CrossRef]
- Polinder, H.; Mueller, M.A.; Scuotto, M.; Goden de Sousa Prado, M. Linear generator systems for wave energy conversion. In Proceedings of the 7th European Wave and Tidal Energy Conference, Porto, Portugal, 11–13 September 2007. [Google Scholar]
- Li, W.; Isberg, J.; Engström, J.; Waters, R.; Leijon, M. Parametric study of the power absorption for a linear generator wave energy converter. J. Ocean Wind Energy 2015, 2, 248–252. [Google Scholar] [CrossRef]
- Ozkop, E.; Altas, I.H. Control, power and electrical components in wave energy conversion systems: A review of the technologies. Renew. Sustain. Energy Rev. 2017, 67, 106–115. [Google Scholar] [CrossRef]
- Pecher, A.; Kofoed, J.P. Erratum to: Handbook of ocean wave energy. In Ocean Engineering & Oceanography; Pecher, A., Kofoed, J.P., Eds.; Springer: Cham, Switzerland, 2017; p. E1. ISBN 9783319398884. [Google Scholar]
- Wang, L.; Isberg, J.; Tedeschi, E. Review of control strategies for wave energy conversion systems and their validation: The wave-to-wire approach. Renew. Sustain. Energy Rev. 2018, 81, 366–379. [Google Scholar] [CrossRef]
- Alternative Energy Tutorials. Tidal Barrage Generation. Available online: http://www.alternative-energy-tutorials.com/tidal-energy/tidal-barrage.html (accessed on 18 April 2019).
- Waters, S.; Aggidis, G. Tidal range technologies and state of the art in review. Renew. Sustain. Energy Rev. 2016, 59, 514–529. [Google Scholar] [CrossRef]
- Xia, J.; Falconer, R.A.; Lin, B.; Tan, G. Estimation of annual energy output from a tidal barrage using two different methods. Appl. Energy 2012, 93, 327–336. [Google Scholar] [CrossRef]
- Li, Y.; Pan, D.Z. The ebb and flow of tidal barrage development in Zhejiang Province, China. Renew. Sustain. Energy Rev. 2017, 80, 380–389. [Google Scholar] [CrossRef]
- Angeloudis, A.; Falconer, R.A. Sensitivity of tidal lagoon and barrage hydrodynamic impacts and energy outputs to operational characteristics. Renew. Energy 2017, 114, 337–351. [Google Scholar] [CrossRef]
- Angeloudis, A.; Kramer, S.C.; Avdis, A.; Piggott, M.D. Optimising tidal range power plant operation. Appl. Energy 2018, 212, 680–690. [Google Scholar] [CrossRef]
- Harcourt, F.; Angeloudis, A.; Piggott, M.D. Utilising the flexible generation potential of tidal range power plants to optimise economic value. Appl. Energy 2019, 237, 873–884. [Google Scholar] [CrossRef]
- Keysan, O.; McDonald, A.S.; Mueller, M. A direct drive permanent magnet generator design for a tidal current turbine (SeaGen). In Proceedings of the 2011 IEEE International Electric Machines & Drives Conference (IEMDC), Niagara Falls, ON, Canada, 15–18 May 2011; pp. 224–229. [Google Scholar]
- Shirasawa, K.; Tokunaga, K.; Iwashita, H.; Shintake, T. Experimental verification of a floating ocean-current turbine with a single rotor for use in Kuroshio currents. Renew. Energy 2016, 91, 189–195. [Google Scholar] [CrossRef]
- Seo, J.; Yi, J.; Park, J.; Lee, K. Review of tidal characteristics of Uldolmok Strait and optimal design of blade shape for horizontal axis tidal current turbines. Renew. Sustain. Energy Rev. 2019, 113, 109273. [Google Scholar] [CrossRef]
- Li, Y.; Calisal, S.M. Three-dimensional effects and arm effects on modeling a vertical axis tidal current turbine. Renew. Energy 2010, 35, 2325–2334. [Google Scholar] [CrossRef]
- Jing, F.; Sheng, Q.; Zhang, L. Experimental research on tidal current vertical axis turbine with variable-pitch blades. Ocean Eng. 2014, 88, 228–241. [Google Scholar] [CrossRef]
- Fernandes, A.C.; Bakhshandeh Rostami, A. Hydrokinetic energy harvesting by an innovative vertical axis current turbine. Renew. Energy 2015, 81, 694–706. [Google Scholar] [CrossRef]
- Wang, S.Q.; Xu, G.; Zhu, R.Q.; Wang, K. Hydrodynamic analysis of vertical-axis tidal current turbine with surging and yawing coupled motions. Ocean Eng. 2018, 155, 42–54. [Google Scholar] [CrossRef]
- Chen, B.; Su, S.; Viola, I.M.; Greated, C.A. Numerical investigation of vertical-axis tidal turbines with sinusoidal pitching blades. Ocean Eng. 2018, 155, 75–87. [Google Scholar] [CrossRef]
- Gorle, J.M.R.; Chatellier, L.; Pons, F.; Ba, M. Modulated circulation control around the blades of a vertical axis hydrokinetic turbine for flow control and improved performance. Renew. Sustain. Energy Rev. 2019, 105, 363–377. [Google Scholar] [CrossRef]
- Kinsey, T.; Dumas, G.; Lalande, G.; Ruel, J.; Méhut, A.; Viarouge, P.; Lemay, J.; Jean, Y. Prototype testing of a hydrokinetic turbine based on oscillating hydrofoils. Renew. Energy 2011, 36, 1710–1718. [Google Scholar] [CrossRef]
- Ma, P.; Yang, Z.; Wang, Y.; Liu, H.; Xie, Y. Energy extraction and hydrodynamic behavior analysis by an oscillating hydrofoil device. Renew. Energy 2017, 113, 648–659. [Google Scholar] [CrossRef]
- Wang, Y.; Huang, D.; Han, W.; YangOu, C.; Zheng, Z. Research on the mechanism of power extraction performance for flapping hydrofoils. Ocean Eng. 2017, 129, 626–636. [Google Scholar] [CrossRef]
- Filippas, E.S.; Gerostathis, T.P.; Belibassakis, K.A. Semi-activated oscillating hydrofoil as a nearshore biomimetic energy system in waves and currents. Ocean Eng. 2018, 154, 396–415. [Google Scholar] [CrossRef]
- Chaudhari, C.D.; Waghmare, S.A.; Kotwal, A. Numerical analysis of venturi ducted horizontal axis wind turbine for efficient power generation. Int. J. Mech. Eng. Comput. Appl. 2013, 1, 90–93. [Google Scholar]
- Khan, M.J.; Bhuyan, G.; Iqbal, M.T.; Quaicoe, J.E. Hydrokinetic energy conversion systems and assessment of horizontal and vertical axis turbines for river and tidal applications: A technology status review. Appl. Energy 2009, 86, 1823–1835. [Google Scholar] [CrossRef]
- Belloni, C.S.K.; Willden, R.H.J.; Houlsby, G.T. An investigation of ducted and open-centre tidal turbines employing CFD-embedded BEM. Renew. Energy 2017, 108, 622–634. [Google Scholar] [CrossRef]
- Tampier, G.; Troncoso, C.; Zilic, F. Numerical analysis of a diffuser-augmented hydrokinetic turbine. Ocean Eng. 2017, 145, 138–147. [Google Scholar] [CrossRef]
- Tsao, C.C.; Han, L.; Jiang, W.T.; Lee, C.C.; Lee, J.S.; Feng, A.H.; Hsieh, C. Marine current power with cross-stream active mooring: Part I. Renew. Energy 2017, 109, 144–154. [Google Scholar] [CrossRef]
- Tsao, C.C.; Han, L.; Jiang, W.T.; Lee, C.C.; Lee, J.S.; Feng, A.H.; Hsieh, C. Marine current power with cross-stream active mooring: Part II. Renew. Energy 2018, 127, 1036–1051. [Google Scholar] [CrossRef]
- Minesto. The Future of Renewable Energy. Available online: https://minesto.com/our-technology (accessed on 18 April 2019).
- Qian, P.; Feng, B.; Liu, H.; Tian, X.; Si, Y.; Zhang, D. Review on configuration and control methods of tidal current turbines. Renew. Sustain. Energy Rev. 2019, 108, 125–139. [Google Scholar] [CrossRef]
- Faizal, M.; Ahmed, M.R. Experimental studies on a closed cycle demonstration OTEC plant working on small temperature difference. Renew. Energy 2013, 51, 234–240. [Google Scholar] [CrossRef]
- Aydin, H.; Lee, H.S.; Kim, H.J.; Shin, S.K.; Park, K. Off-design performance analysis of a closed-cycle ocean thermal energy conversion system with solar thermal preheating and superheating. Renew. Energy 2014, 72, 154–163. [Google Scholar] [CrossRef]
- Yang, M.H.; Yeh, R.H. Analysis of optimization in an OTEC plant using organic Rankine cycle. Renew. Energy 2014, 68, 25–34. [Google Scholar] [CrossRef]
- Mutair, S.; Ikegami, Y. Design optimization of shore-based low temperature thermal desalination system utilizing the ocean thermal energy. J. Sol. Energy Eng. 2014, 136, 041005. [Google Scholar] [CrossRef]
- Kim, A.S.; Kim, H.J.; Lee, H.S.; Cha, S. Dual-use open cycle ocean thermal energy conversion (OC-OTEC) using multiple condensers for adjustable power generation and seawater desalination. Renew. Energy 2016, 85, 344–358. [Google Scholar] [CrossRef]
- Octaviani, F.; Muslim, M.; Buwono, A.; Faturachman, D. Study of ocean thermal energy conversion (OTEC) generation as project of power plant in West Sumatera-Indonesia. Recent Adv. Renew. Energy Sources 2016, 10, 64–68. [Google Scholar]
- Thorsen, T.; Holt, T. The potential for power production from salinity gradients by pressure retarded osmosis. J. Membr. Sci. 2009, 335, 103–110. [Google Scholar] [CrossRef]
- Han, G.; Zhang, S.; Li, X.; Chung, T.S. Progress in pressure retarded osmosis (PRO) membranes for osmotic power generation. Prog. Polym. Sci. 2015, 51, 1–27. [Google Scholar] [CrossRef]
- Altaee, A.; Zhou, J.; Alanezi, A.A.; Zaragoza, G. Pressure retarded osmosis process for power generation: Feasibility, energy balance and controlling parameters. Appl. Energy 2017, 206, 303–311. [Google Scholar] [CrossRef]
- Altaee, A.; Cipolina, A. Modelling and optimization of modular system for power generation from a salinity gradient. Renew. Energy 2019, 141, 139–147. [Google Scholar] [CrossRef]
- Veerman, J.; Saakes, M.; Metz, S.J.; Harmsen, G.J. Electrical power from sea and river water by reverse electrodialysis: A first step from the laboratory to a real power plant. Environ. Sci. Technol. 2010, 44, 9207–9212. [Google Scholar] [CrossRef] [PubMed]
- Avci, A.H.; Tufa, R.A.; Fontananova, E.; Di, G.; Curcio, E. Reverse Electrodialysis for energy production from natural river water and seawater. Energy 2018, 165, 512–521. [Google Scholar] [CrossRef]
- Tufa, R.A.; Pawlowski, S.; Veerman, J.; Bouzek, K.; Fontananova, E.; Velizarov, S.; Goulão, J.; Nijmeijer, K.; Curcio, E. Progress and prospects in reverse electrodialysis for salinity gradient energy conversion and storage. Appl. Energy 2018, 225, 290–331. [Google Scholar] [CrossRef]
- Mei, Y.; Tang, C.Y. Recent developments and future perspectives of reverse electrodialysis technology: A review. Desalination 2018, 425, 156–174. [Google Scholar] [CrossRef]
- Renewable Energy Policy Network for the 21st Century (REN21). Renewable 2018: Global Status Report; REN21: Paris, France, 2018. [Google Scholar]
- International Renewable Energy Agency (IRENA). Renewable Energy Capacity Statistics 2019; IRENA: Abu Dhabi, UAE, 2019. [Google Scholar]
- Wang, S.; Yuan, P.; Li, D.; Jiao, Y. An overview of ocean renewable energy in China. Renew. Sustain. Energy Rev. 2011, 15, 91–111. [Google Scholar] [CrossRef]
- Neill, S.P.; Hashemi, M.R. Introduction. Fundam. Ocean Renew. Energy 2018, 1990, 1–30. [Google Scholar]
- Ohneda, H.; Igarashi, S.; Shinbo, O.; Sekihara, S.; Suzuki, K.; Kubota, H.; Morita, H. Construction procedure of a wave power extracting caisson breakwater. In Proceedings of the 3rd Symposium on Ocean Energy Utilization, Tokyo, Japan, 22–23 January 1991; pp. 171–179. [Google Scholar]
- Arena, F.; Romolo, A.; Malara, G.; Ascanelli, A. On design and building of a U-OWC wave energy converter in the Mediterranean Sea: A case study. In Proceedings of the ASME 2013 32nd International Conference on Ocean, Offshore and Arctic Engineering, Nantes, France, 9–14 June 2013; Volume 8. [Google Scholar]
- Falcão, A.D.O. The shoreline OWC wave power plant at the Azores. In Proceedings of the 4th European Wave Energy Conference, Aalborg, Denmark, 4–6 December 2000; pp. 42–48. [Google Scholar]
- Bønke, K.; Ambli, N. Prototype wave power stations in Norway. In Proceedings of the Utilization of Ocean Waves—Wave to Energy Conversion, San Diego, CA, USA, 16–17 June 1986; pp. 34–35. [Google Scholar]
- Weinstein, A.; Fredrikson, G.; Parks, M.J.; Nielsen, K. AquaBuOY-the offshore wave energy converter numerical modeling and optimization. In Proceedings of the Oceans ’04 MTS/IEEE Techno-Ocean ’04, Kobe, Japan, 9–12 November 2004; pp. 1988–1995. [Google Scholar]
- Salter, S.H.; Lin, C.-P. Wide tank efficiency measurements on a model of the sloped IPS buoy. In Proceedings of the 3rd European Wave Energy Conference, Patras, Greece, 30 September–2 October 1998; pp. 200–206. [Google Scholar]
- Weber, J.; Mouwen, F.; Parish, A.; Robertson, D. Wavebob—Research & development network and tools in the context of systems engineering. In Proceedings of the 8th European Wave and Tidal Energy Conference, Uppsala, Sweden, 7–10 September 2009; pp. 416–420. [Google Scholar]
- Tedd, J.; Peter Kofoed, J. Measurements of overtopping flow time series on the Wave Dragon, wave energy converter. Renew. Energy 2009, 34, 711–717. [Google Scholar] [CrossRef]
- Vicinanza, D.; Frigaard, P. Wave pressure acting on a seawave slot-cone generator. Coast. Eng. 2008, 55, 553–568. [Google Scholar] [CrossRef]
- Magagna, D.; Margheritini, L. Workshop on Identification of Future Emerging Technologies in the Wind Power Sector; European Commission, Publications Official of the European Union: Luxembourg, 2018; ISBN 9789279925870. [Google Scholar] [CrossRef]
- World Energy Council. 2010 Survey of Energy Resources; World Energy Council: London, UK, 2010. [Google Scholar]
- Bae, Y.H.; Kim, K.O.; Choi, B.H. Lake Sihwa tidal power plant project. Ocean Eng. 2010, 37, 454–463. [Google Scholar] [CrossRef]
- Worldsteel Association. Sihwa Tidal Power Station Worldsteel HR. Available online: https://stories.worldsteel.org/infrastructure/large-scale-tidal-power-reliant-steel/attachment/sihwa-tidal-power-station-worldsteel-hr/ (accessed on 1 March 2019).
- Hooper, T.; Austen, M. Tidal barrages in the UK: Ecological and social impacts, potential mitigation, and tools to support barrage planning. Renew. Sustain. Energy Rev. 2013, 23, 289–298. [Google Scholar] [CrossRef]
- Hammar, L.; Ehnberg, J.; Mavume, A.; Cuamba, B.C.; Molander, S. Renewable ocean energy in the Western Indian Ocean. Renew. Sustain. Energy Rev. 2012, 16, 4938–4950. [Google Scholar] [CrossRef]
- Hammons, T.J.; Member, S. Tidal power. Proc. IEEE 1993, 81, 419–433. [Google Scholar] [CrossRef]
- Kobayashi, H.; Jitsuhara, S.; Uehara, H. The present status and features of OTEC and recent aspects of thermal energy conversion technologies. In Proceedings of the 24th Meeting of the UJNR Marine Facilities Panel, Honolulu, HI, USA, 4–12 November 2001. [Google Scholar]
- Uehara, H. The present status and future of ocean thermal energy conversion. Int. J. Sol. Energy 1995, 16, 217–231. [Google Scholar] [CrossRef]
- Makai Ocean Engineering. Ocean Thermal Energy Conversion. Available online: https://www.makai.com/ocean-thermal-energy-conversion/ (accessed on 9 May 2019).
- Ocean Energy System (OES). Offshore Installations Worldwide. Available online: https://www.ocean-energy-systems.org/ocean-energy-in-the-world/gis-map/ (accessed on 18 April 2019).
- EMODnet—The European Marine Observation and Data Network. The European Marine Observation and Data Network. Available online: https://ec.europa.eu/maritimeaffairs/atlas/maritime_atlas/#lang=EN;p=w;bkgd=5;theme=2:0.75;c=1253866.2175874896,7033312.218247008;z=4 (accessed on 1 April 2019).
- RenewableUK. UK Marine Energy Database (UKMED). Available online: https://www.renewableuk.com/page/UKMED2/UK-Marine-Energy-Database.htm (accessed on 3 April 2019).
- National Renewable Energy Laboratory NREL. Marine and Hydrokinetic Technology Database. Available online: https://openei.org/wiki/Marine_and_Hydrokinetic_Technology_Database (accessed on 3 March 2019).
- Pacific Northwest National Laboratory (PNNL). Energy, U.S.D. of Ocean Energy Systems (OES); Wind, I. TETHYS: Marine Energy Content. Available online: https://tethys.pnnl.gov/map-viewer-marine-energy (accessed on 18 April 2019).
- EMEC (European Marine Energy Centre). Guidelines for Project Development in the Marine Energy Industry; EMEC: Stromness, Scotland, 2009. [Google Scholar]
- International Renewable Energy Agency (IRENA). Ocean Thermal Energy Conversion: Technology Brief; IRENA: Abu Dhabi, UAE, 2014. [Google Scholar]
- International Renewable Energy Agency (IRENA). Tidal Energy: Technology Brief; IRENA: Abu Dhabi, UAE, 2014. [Google Scholar]
- International Renewable Energy Agency (IRENA). Salinity Gradient Energy: Technology Brief; IRENA: Abu Dhabi, UAE, 2014. [Google Scholar]
- EPE. Anuário Estatístico de Energia Elétrica 2018 no Ano Base de 2017; EPE: Rio de Janeiro, Brazil, 2018. [Google Scholar]
- Hammar, L.; Gullström, M.; Dahlgren, T.G.; Asplund, M.E.; Goncalves, I.B.; Molander, S. Introducing ocean energy industries to a busy marine environment. Renew. Sustain. Energy Rev. 2017, 74, 178–185. [Google Scholar] [CrossRef]
- Garcia-rosa, P.B.; Paulo, J.; Soares, V.; Lizarralde, F.; Estefen, S.F.; Machado, I.R.; Watanabe, E.H. Wave-to-wire model and energy storage analysis of an ocean wave energy hyperbaric converter. IEEE J. Ocean. Eng. 2014, 39, 1–12. [Google Scholar] [CrossRef]
- Costa, P.R.; Garcia-Rosa, P.B.; Estefen, S.F. Phase control strategy for a wave energy hyperbaric converter. Ocean Eng. 2010, 37, 1483–1490. [Google Scholar] [CrossRef]
- Estefen, S.F.; Esperança, P.T.T.; Ricarte, E.; da Costa, P.R.; Pinheiro, M.M.; Clemente, C.H.P.; Franco, D.; Melo, E.; de Souza, J.A. Experimental and numerical studies of the wave energy hyperbaric device for electricity production. In Proceedings of the ASME 2008 27th International Conference on Offshore Mechanics and Arctic Engineering, Estoril, Portugal, 15–20 June 2008; pp. 811–818. [Google Scholar]
- Estefen, S.F.; da Costa, P.R.; Ricarte, E.; Pinheiro, M.M. Wave energy hyperbaric device for electricity production. In Proceedings of the ASME 2007 26th International Conference on Offshore Mechanics and Arctic Engineering, San Diego, CA, USA, 10–15 June 2007; pp. 627–633. [Google Scholar]
- Shadman, M.; Estefen, S.F.; Rodriguez, C.A.; Nogueira, I.C.M. A geometrical optimization method applied to a heaving point absorber wave energy converter. Renew. Energy 2018, 115, 533–546. [Google Scholar] [CrossRef]
- Budal, K.; Falnes, J. Interacting point absorbers with controlled motion. In Power from Sea Waves; Count, B.M., Ed.; Academic Press: London, UK, 1980; pp. 129–142. [Google Scholar]
- Budal, K.; Falnes, J.; Iversen, L.C.; Lillebekker, P.M.; Oltedal, G.; Hals, T.; Onshus, T.; Hoy, A. The Norwegian wave-power buoy project. In Proceedings of the 2nd International Symposium on Wave Energy Utilization, Trondheim, Norway, 22–24 June 1982; pp. 323–344. [Google Scholar]
- Neto, P.B.L.; Saavedra, O.R.; de Souza Ribeiro, L.A. Analysis of a tidal power plant in the estuary of Bacanga in Brazil taking into account the current conditions and constraints. IEEE Trans. Sustain. Energy 2017, 8, 1187–1194. [Google Scholar] [CrossRef]
- Ferreira, R.M.; Estefen, S.F. Alternative concept for tidal power plant with reservoir restrictions. Renew. Energy 2009, 34, 1151–1157. [Google Scholar] [CrossRef]
- Leite Neto, P.B.; Saavedra, O.R.; Souza Ribeiro, L.A. Optimization of electricity generation of a tidal power plant with reservoir constraints. Renew. Energy 2015, 81, 11–20. [Google Scholar] [CrossRef]
- Aggidis, G.A.; Feather, O. Tidal range turbines and generation on the Solway Firth. Renew. Energy 2012, 43, 9–17. [Google Scholar] [CrossRef]


© 2019 by the authors. Licensee MDPI, Basel, Switzerland. This article is an open access article distributed under the terms and conditions of the Creative Commons Attribution (CC BY) license (http://creativecommons.org/licenses/by/4.0/).