1. Introduction
In vertically integrated utility (VIU) generation, transmission and distribution are bundled together, where a consumer can buy electricity from the utility at a monopolistic price. The power flow and cash flow in a regulated or VIU market is unidirectional. Due to technical, political, economic, and financial reasons, the restructuring of vertically integrated utility leads to the unbundling of generation, transmission, and distribution. As a result of unbundling, the wholesale electricity market evolved with local utilities as a key player, where transmission and distribution are non-tradeable entities. In a wholesale deregulated electricity market, the bulk consumers can exercise their choice among the local utilities available, to trade with them under the supervision of the market operator. The deregulated wholesale electricity market allows the penetration of bulk renewable energy sources to lower the gap between increasing demand and conventional generation. With a limited number of local utilities, there is no competition among them to evolve and the consumer also has less choice. Ultimately, this leads to the local utility becoming a monopoly once more. With the decreasing feed-in tariff, the non-availability of a transmission corridor, and the delayed settlement of payments, the bulk of renewable energy producers lack motivation to participate in the wholesale deregulated market. This leads to further deregulation of the electricity sector to retail the electricity market at the distribution level with the evolution of microgrids and smart grids.
The deregulated retail electricity market encourages the penetration of rooftop solar photovoltaic (PV) systems for domestic, industrial, and commercial customers by providing increased subsidy. In a deregulated retail electricity market, the individual solar PV consumers who produce solar power for their self-consumption are called as prosumers. The prosumers can sell their solar energy when not in use back to the grid for their returns. The grid also suitably incentivizes the prosumers. However, with an increasing subsidy burden, several countries started curtailing the subsidy. With the decreased subsidy and feed-in tariff, and with the increased awareness of self-consumption and self-sustainability, a new paradigm of electricity trading evolved at the low-voltage distribution level in the deregulated retail electricity market. The surplus prosumers in a community hereinafter referred to as selling peers can share/sell their superfluous energy to the energy-starving consumer, i.e., the deficit prosumer or non-PV consumer in the community, locally for the collective individual and community welfare. This type of trading is called peer-to-peer (P2P) energy trading, leading to the diversification of the energy ecosystem at the edge of the distribution level.
P2P trading can be performed at the scale of an individual premise, microgrid, or a collection of microgrids or multiple connections of microgrids in either on-grid or off-grid mode [
1]. The prosumers at different levels can generate their own power for self-consumption from various sources like roof-top PV systems and wind. Prosumers become the key player in the energy ecosystem [
2]. In a P2P energy market, prosumers and consumers undertake a proactive role, which led to the concept of a federated power plant which combines the benefit of both a virtual power plant and P2P energy trading [
3]. The optimal value of generation from renewables is determined with the help of a P2P index, which is the proportion of renewable generation with respect to the gross system load [
4].
In conventional energy trading, the surplus energy is sold to the grid, hereinafter referred to as peer-to-grid (P2G). With the increasing deployment of renewable energy sources in P2G energy trading, the gain to access advantages like improved power quality, energy balance, and reliability is circumscribed by the congestion of transmission lines [
5]. However, P2P energy trading, in addition to the local energy balance, alleviates the congestion at the edge of the distribution level, eventually lessening the burden on transmission lines [
6,
7]. The energy flow and cash flow for P2G trading are shown in
Figure 1.
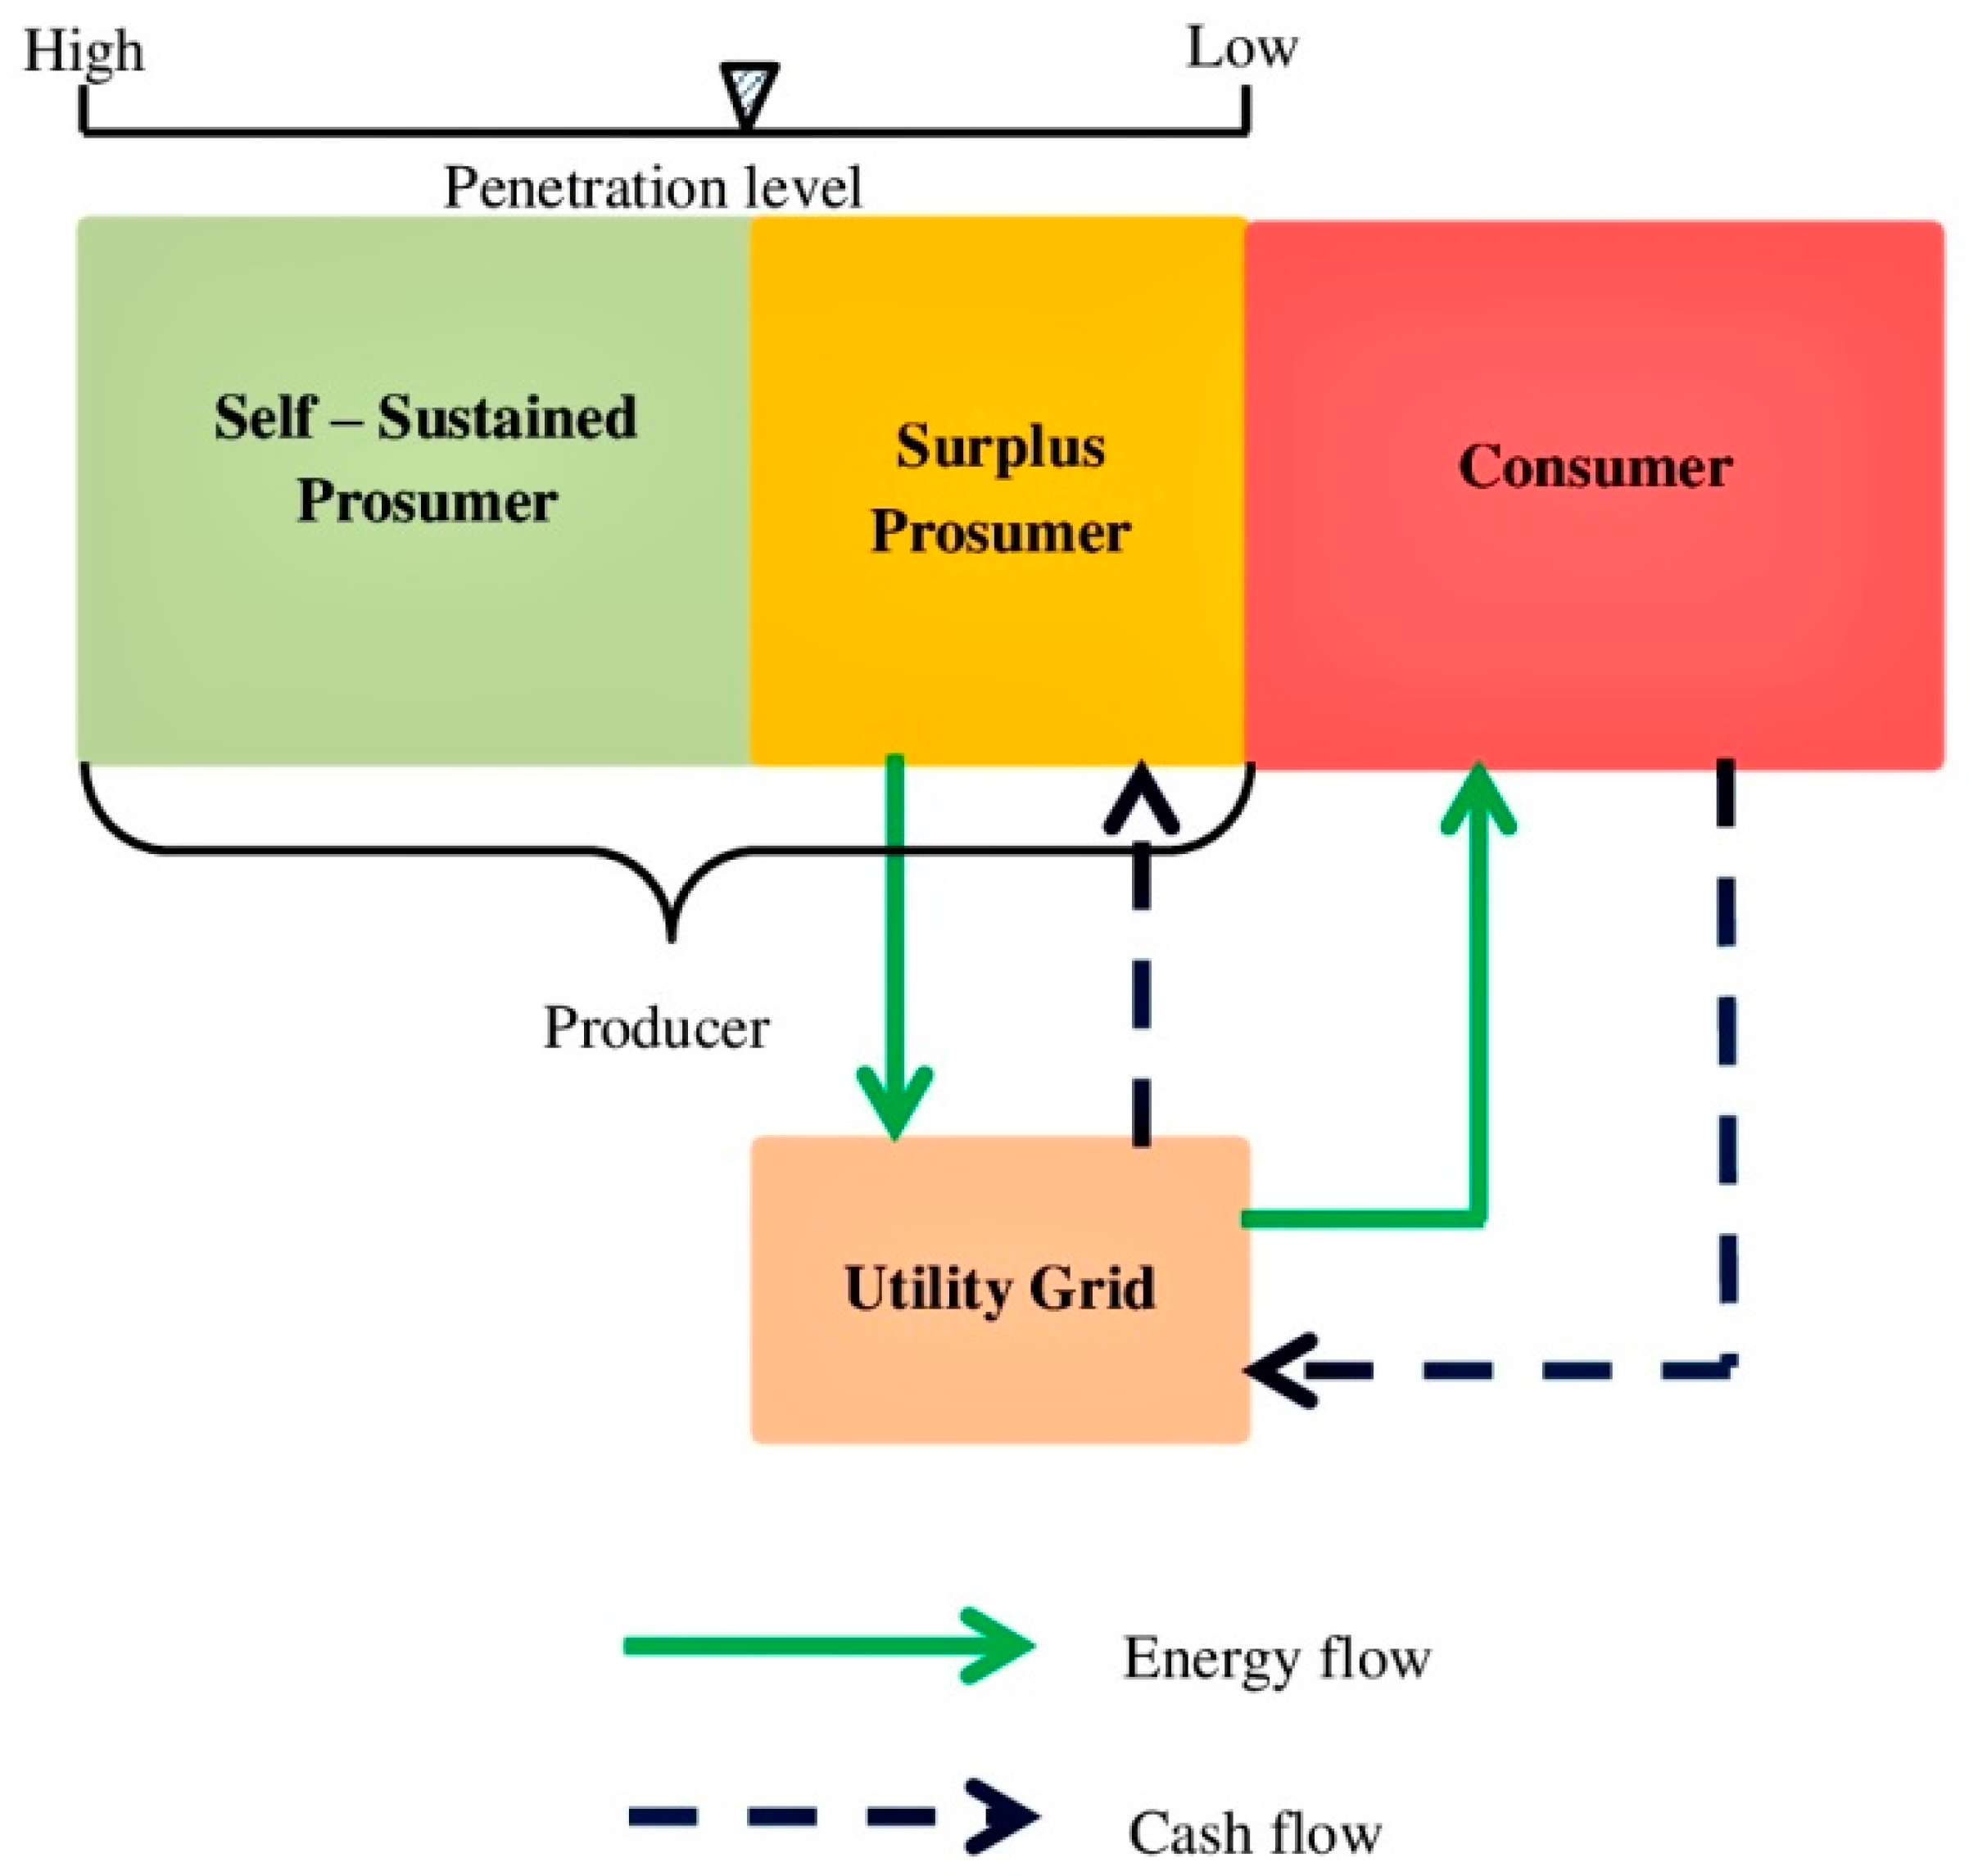
The prosumers are fitted with a bidirectional smart meter to assess the import and export of energy [
8]. After assessing the surplus of the prosumer, the superfluous energy is shared/traded with the deprived consumers in the community, which necessitates a sharing corridor within the community without violating the physical limits [
9,
10]. In a P2P energy market, the prosumers and consumers organize themselves at each instant in time and trade with each other, thereby reducing the overall demand of the community by slashing the upstream generation and transmission expenditure [
11]. The energy flow and cash flow for P2G trading are shown in
Figure 2.
Although P2P trials all over the world focused on a business model, the interaction between the prosumers and consumers necessitates innovative information and communication technologies (ICT) and electronic trading platforms such as cloud-based and block-chain-based technologies [
12,
13]. A robust, transparent, and innovative information system is required to link the consumers and prosumers to trade electricity within the community for local energy balance [
14].
A suitable market model was developed for P2P energy trading in a centralized or distributed manner [
15,
16]. A community-based electricity market was proposed with the concept of energy collectives [
17]. The energy cost model for the peer can not only be modeled from the economic perspective but can also include the complex process of socio-cultural understanding [
18]. Game theory was used for bidding in P2P energy trading by the prosumers and consumers [
19,
20,
21].
Internet of things (IoT)-based smart homes are the solution for the energy crisis, which connects the real physical world with the digital world [
22], a mandate for P2P energy trading. The usefulness of the smart home in achieving the optimized energy management between the utility and grid in a deregulated energy market can be adapted in a deregulated retail market at the distribution level to enable P2P energy trading [
23,
24]. A smart home is furnished with appliances with their own purpose to satisfy the consumer connected to the alternating current (AC) or direct current (DC) micro grid. Although AC dominates the entire world, in parallel with the revival of DC at the transmission and distribution levels, the integration of renewable energy sources such as solar, native DC, and wind, connected to the AC grid through a DC link led to the development of DC micro grids. With the spur of DC microgrids, several household appliances were developed with the operating supply as DC.
In a digitally electrified network and with the advancement of ICT technologies, P2P energy trading offers several advantages when operated with AC and DC home appliances in terms of the operational cost of an individual and community. Although there are several advantages in implementing P2P energy trading, there is no systematic methodology to evaluate the operational cost. A fair pricing methodology is required to implement P2P energy trading. Cintuglu et al. [
25] created a competitive market for independent power producers by designing a reverse auction model. Shamshi et al. [
26] proposed that prosumers can trade energy with others in a community-based energy market. However, the authors of References [
25,
26] did not consider flexible demand. Paolo et al. [
27] proposed a pricing-based scheme considering flexible demand but did not consider distributed generation. In this paper, the consumption profiles of individual homes are plotted without compromising the user convenience when the household appliances are operated using AC and DC supply with their respective power ratings. The operational costs for operating the homes using AC and DC home appliances are calculated from the perspective of P2P energy trading, and the results are compared.
5. System Description
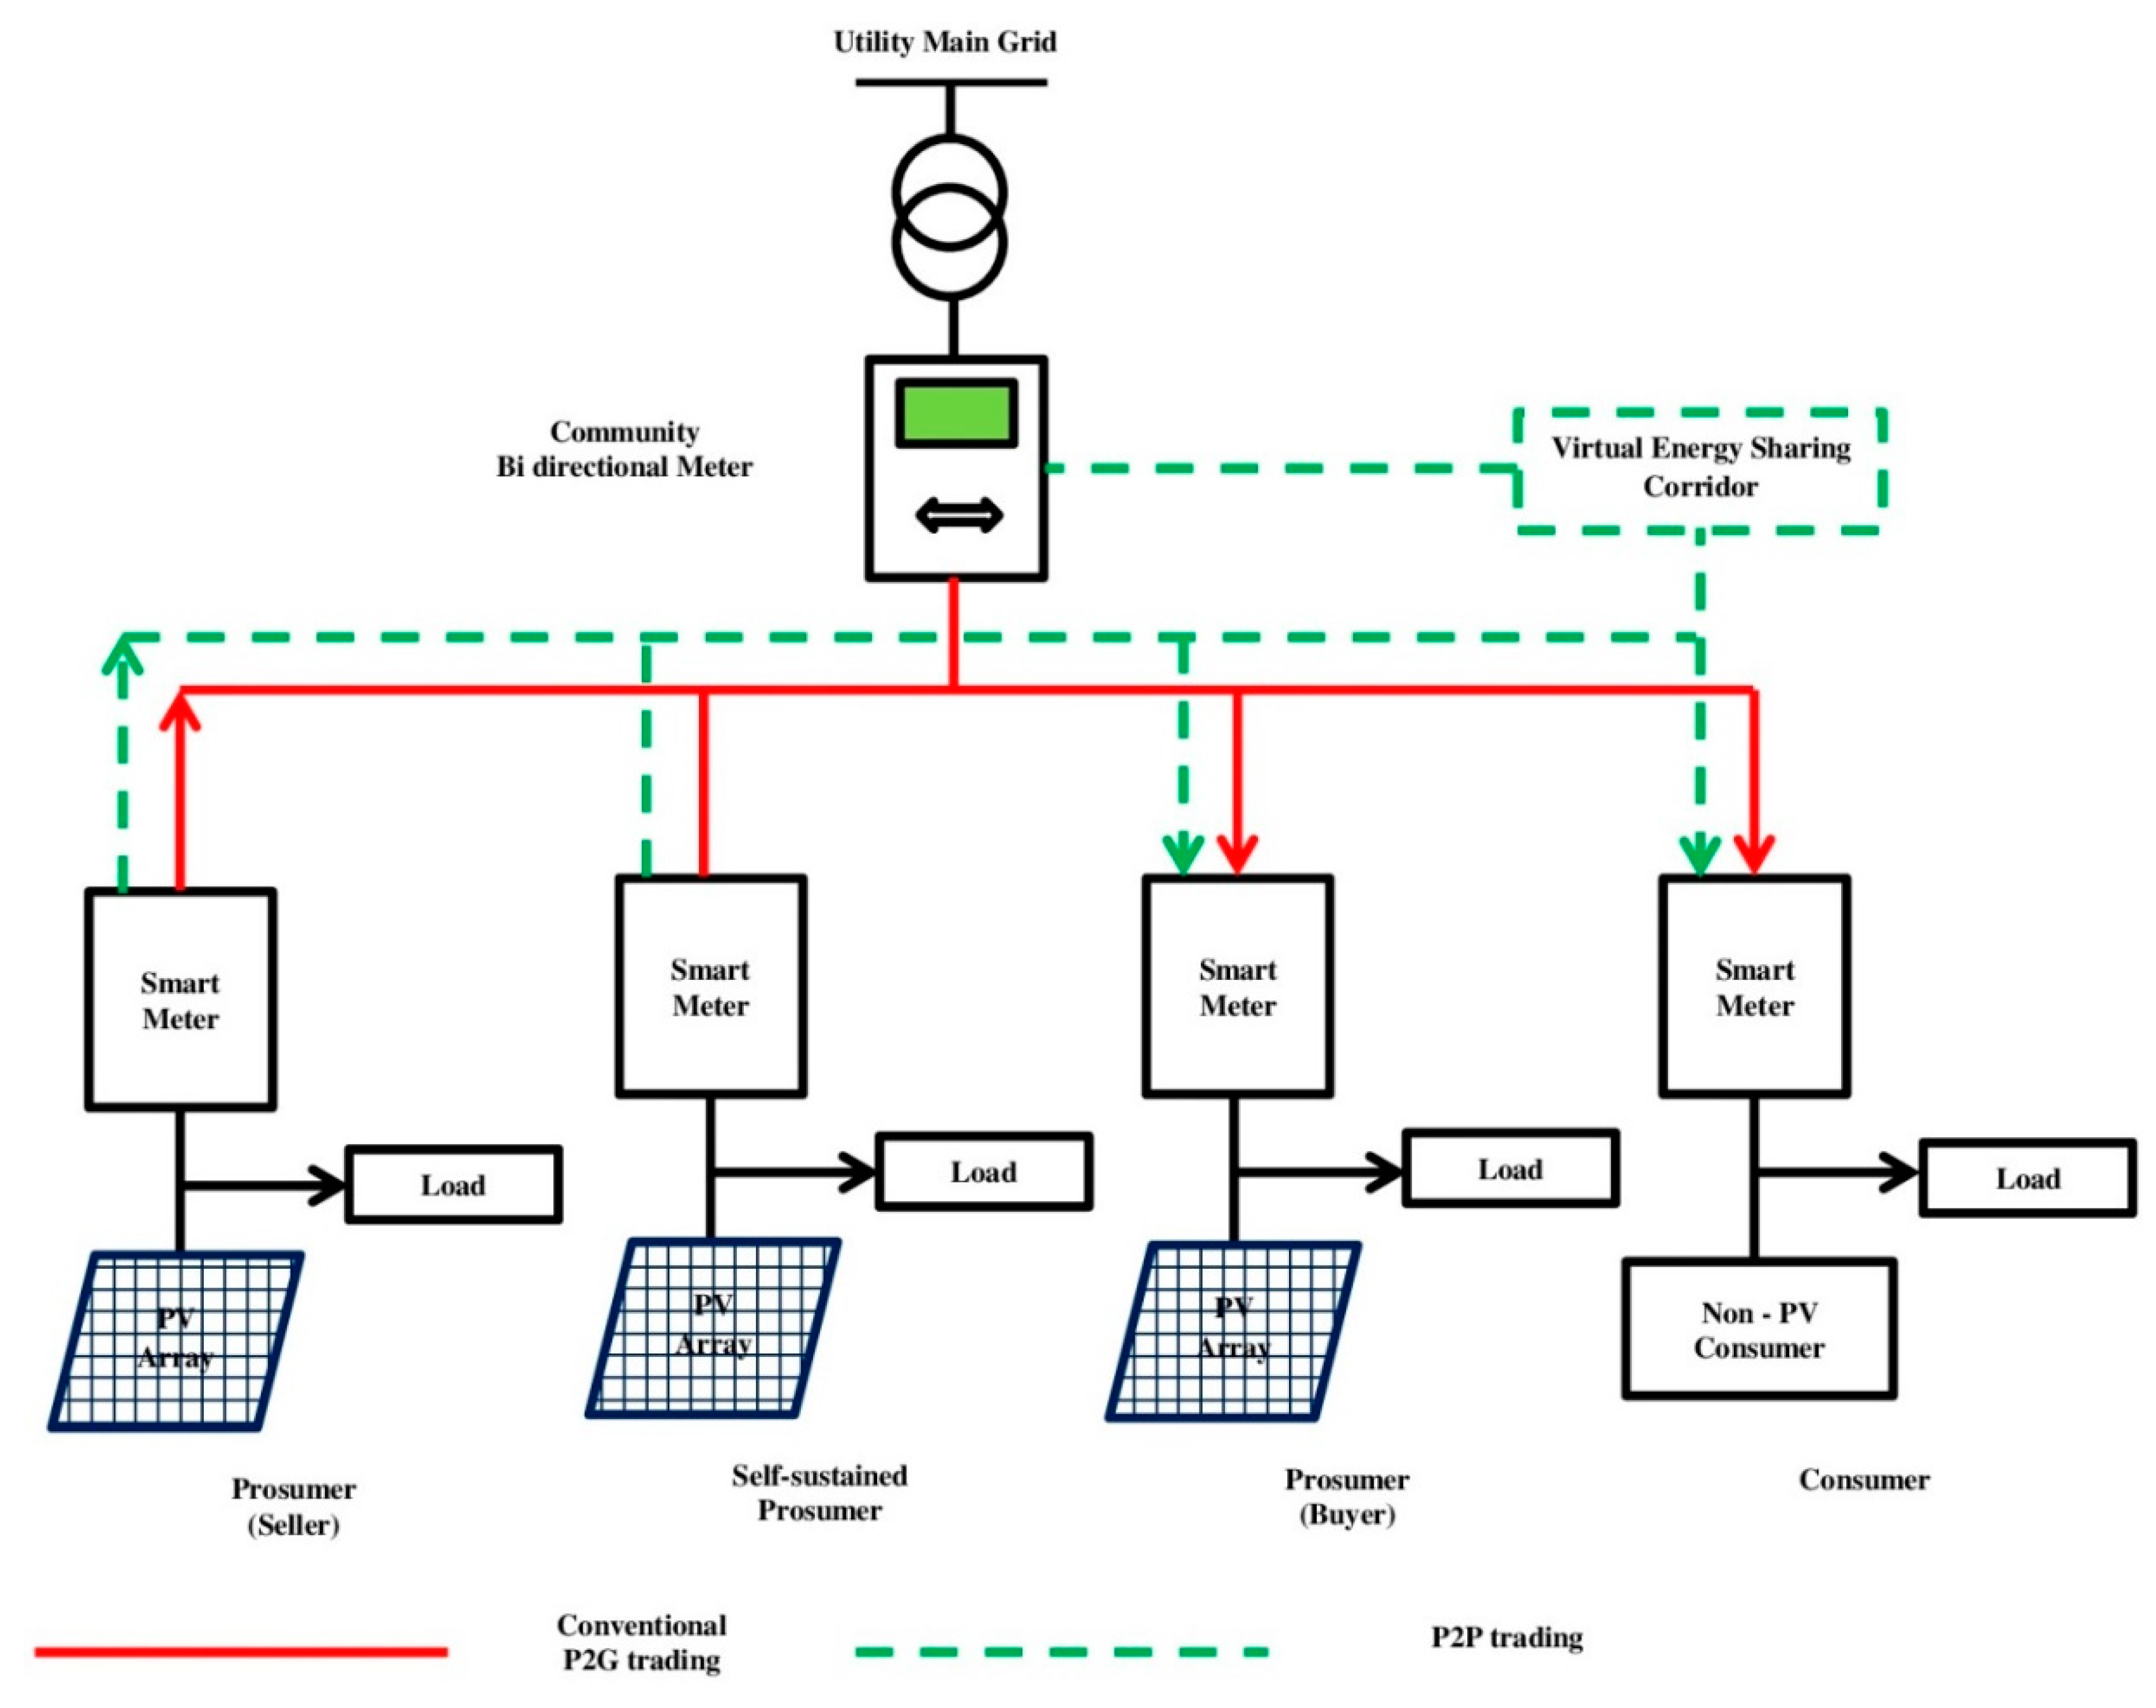
Figure 3 shows the structure of a community connected to the utility main grid.
There are a number of households connected together with power lines and to the main grid at the point of common coupling (PCC). A few of the households are equipped with rooftop solar PV panels as prosumers. The prosumers and consumers are equipped with a smart meter to assess the individuals’ import/export [
8]. The community as a whole is connected to the utility main grid through a bidirectional meter to assess the total community’s import/export. The prosumers managing themselves with on-site PV generation are termed self-sustained prosumers. The prosumers who, when they are in surplus, sell their excess energy to their peers are termed prosumers (sellers), whereas the prosumers who, when in deficit, buy energy from their peers are termed prosumers (buyers). The households with no rooftop solar PV are termed non-PV consumers. The solid lines in
Figure 3 show conventional P2G trading. The prosumer (seller) exports the surplus energy to the utility grid, while the self-sustained prosumer neither imports nor exports energy from the utility grid; lastly, the prosumer (buyer) and non-PV consumer import power from the utility grid. The dashed lines in
Figure 3 show P2P energy trading, where the self-organized prosumers and consumers in a community pursue their energy trade through the virtual energy sharing corridor. The virtual energy sharing corridor in a P2P environment enables the interaction between prosumer (seller), prosumer (buyer), and consumers with their surplus and deficit of energy to be traded among themselves for financial benefit and to reduce their grid dependency. The prosumers take different roles as sellers or buyers, or they are self-sustained based on their PV generation and load at a particular instant of time.
The depletion of conventional sources for electricity generation and the exponentially growing load demand with the increasing population led various countries to alter their energy policies toward promoting renewable energy sources. By 2023, 40% of global energy consumption will be satisfied with the continuing expansion of renewables. Among the renewables, solar PV capacity is forecasted to expand by 600 GW, which will be twice the total capacity of Japan of 1 TW. China will hold 40% of the global installed PV capacity by 2023 due to its policy changes. The second largest growth market for solar PV is the United States, followed by India, whose capacity will quadruple [
30]. In the post-world oil crisis, solar photovoltaic (SPV) research and development commenced in India. By 1995, 22 MW of SPV units were installed, making India the third largest user of solar PV. By 2002, the export had a share of almost 46%. Meanwhile, domestic solar rooftop PV systems were encouraged [
31]. The 2010 Jawaharlal Nehru National Solar Mission (JNNSM) aims to achieve 20 GW of grid-connected installed capacity. In 2015, the solar policy was accelerated to achieve 100 GW by 2022 [
32]. By 2030, India’s total electricity demand is expected to cross 950,000 MW. Two-thirds of rural India is still energy-starving. Being a tropical country with average sunshine of eight hours per day, depending on location, India can harness its enormous solar potential.
Of the available renewable energy sources, solar power gained more attention with the advancement of PV technology, even at the edge of the distribution level. Simultaneously, the solarization of grid-connected and off-grid communities, the advancement in power electronics, and the evolution of technology with respect to protection at the low-voltage distribution level increased.
A number of P2P projects and trails are carried out globally at the consumer/prosumer level and distribution grid level. At the consumer/prosumer level, P2P energy trading was done in apartments in western Australia [
33] and in east London [
34]. P2P energy projects were also deployed at a university campus at the North-western University Evanston campus in Illinois, which enables the university to trade clean energy within the campus and between campuses [
35]. At the distribution grid level, the Brooklyn microgrid provides a peer-to-peer energy trading marketplace for the locally generated renewable energy [
36,
37]. Countries like the United States of America (USA), United Kingdom (UK), Germany, Spain, Greece, Sweden, South Korea, Denmark, and Belgium focus on P2P energy trading at a consumer/prosumer level [
38]. Countries like Finland, Norway, Switzerland, Malta, and the Netherlands concentrate on implementing P2P energy trading at the distribution gird level. It is also observed that there is growing interest in P2P energy sharing in off-grid rural areas of countries like India, Bangladesh, and Kenya. The socio-cultural understanding and nature of human relationships in a rural off-grid village in India with P2P energy sharing were discussed in Reference [
18]. Progressively, the state of Uttar Pradesh (UP) in India issued rooftop solar PV grid interactive systems gross/net metering (RSPV) regulations in 2019, making UP the first state in India to propose peer-to-peer energy trading [
39]. The advent of DC home appliances at the end usage encourages exploring the benefits of a DC community connected to a DC grid [
40,
41,
42,
43]. The hourly load profiles of households were plotted for a day when operated with AC home appliances connected to an AC microgrid based on circumstantial conditions such as the time of use of appliances, the number of appliances, the time of activity, and occupancy. The hourly load profiles for the same set of households when operated with DC home appliances were obtained by considering the same set of circumstantial conditions with the corresponding power consumption values of DC appliances.
Table 1 shows the list of appliances and the AC and DC power consumption values considered for this study.
Figure 4 shows the hourly load curve for one day of one household. The household is equipped with four ceiling fans, six lights, two cell phones, and one television (TV), induction stove, refrigerator, mixer/grinder, and cooler, with an occupancy of four members. Based on the time of activity and use of appliances, the hourly load curve was obtained when the house was equipped with AC home appliances connected to an AC microgrid and DC home appliances connected to a DC microgrid.
In this paper, we considered 10 households in a community connected to the utility main grid. Two different methods of calculating the operational cost using a P2P trading mechanism were explored and applied to the community when the households were equipped with AC and DC home appliances, and the results are also presented for various degrees of PV penetration for two different conditions. The rooftop PV generation was assumed to have the same generation profile, as the households in a community are relatively close to each other.
Figure 5 shows the PV generation profile with a generation peak of 2 kWp considered for this study. The import cost of energy from the utility main grid (
) was taken as 6.6 Indian rupee (INR) per kWh, and the export cost to the utility main grid (
) was taken as 4 INR per kWh.
6. Results and Discussion
In a conventional P2G environment, non-PV consumers in a community rely on the utility grid for the electricity supply. Prosumers manage themselves from an individual perspective by exploiting self-consumption. If the prosumers are in surplus, then they sell the surplus energy to the utility grid. When the prosumers are in deficit, then they purchase energy from the utility grid as the consumers do. There is no interaction between prosumer and consumer in a P2G environment. The operational cost of the individual household in a conventional P2G environment when there is no prosumer or PV penetration ware calculated using Equation (9), and the results are shown in
Table 2. The community’s operational cost was computed by summing the operational costs of individual households.
With PV penetration, the prosumers are motivated to trade their surplus energy with the main utility grid in conventional P2G trading and with energy-starving consumers in a P2P energy trading-enabled community.
The level of PV penetration also plays an appreciable role in the operational cost of the individual and community.
Table 3 shows the operational costs of individual households for various levels of penetration using P2G trading. With various levels of penetration (number of solar PV prosumers to consumers), it was observed that the surplus prosumers are able to trade their energy with the main utility grid and generate a suitable income. It is evident from
Table 3 that the income is considerably more when the home appliances are operated with DC supply connected to a DC microgrid. In this paper, the various levels of penetration were taken as 10% for low, 50% for medium, and 100% for high.
As the main utility grid is not able to settle the surplus of prosumers due to increased financial burden, the prosumers and consumers are motivated to organize themselves in a community to form a P2P-enabled community where the surplus prosumers can trade their excess energy with their peers (consumers) and generate a suitable income, while reducing the technical and financial burden on the main utility grid.
Table 4 and
Table 5 show the operational costs of individual households for various levels of penetration using the bill sharing method of P2P trading.
It is evident from
Table 4 and
Table 5 that the incomes generated by prosumers are higher when using the mid-market rate method when compared to the bill sharing method. It is also evident that the income is higher when household appliances are operated with DC home appliances connected to a DC microgrid.
Table 6 shows the operational cost of the community when all household appliances in a community are operated with AC home appliances and DC home appliances connected to AC and DC microgrids, respectively.
It can be found from
Table 6 that the operational cost is reduced with an increased level of penetration, and the community starts generating income after a certain level of PV penetration. From 0% to 70% PV penetration, the operational cost of the community as expenditure is reduced. From 70% to 100%, the operational cost of the community as income increases. It is also evident from the results that the operational cost as expenditure shifts to income when a community consists of DC home appliances connected to a DC microgrid.


