Abstract
Microalgae have immense potential as biological sources to produce biofuels and high-value biomolecules. Biofilm-based microalgae cultivation has attracted much interest recently because of its high biomass productivity, reduced water use, and low cost of harvesting. This study aimed to understand the effect of photoperiod on three microalgae biofilms, including Nannochloris oculata, Chlorella sp., and Chlorella pyrenoidosa. The examined photoperiods were 3:3 s, 5:5 s, 30:30 min, 12:12 h (light-period-to-dark-period ratio), and continuous lighting. By determining the maximum quantum yield and relative electron transport rate of photosystem II, we found that photoperiods on the seconds scale improved photosynthetic performance of microalgae biofilm. Biomass yield and lipid content of these three microalgae cultured under the photoperiod with the seconds scale increased by 11%–24% and 7%–22%, respectively, compared with those cultured under continuous lighting. In addition, the photoperiods of 3:3 s, 5:5 s, 30:30 min, and 12:12 h were beneficial for protein synthesis. These results have important implications in establishing suitable light regimes for microalgae biofilm-based cultivation systems.
1. Introduction
Microalgae are able to perform photosynthesis to produce lipids and other valuable biological compounds. Because of their fast growth rate, low nutrient requirements, and high lipid contents, microalgae have immense potential as biological sources to produce biofuels, high-value biomolecules, and feeds [1,2,3,4]. Unfortunately, at present, the energy requirements and costs of microalgae-based commodities are still relatively high, which hinders their broad commercialization [5,6,7]. Recently, several studies have reported that cultivating microalgae as biofilm (where cells are attached to a solid surface) can substantially reduce energy requirement and enhance economic feasibility of microalgae-based biorefineries, owing to the high photosynthetic efficiency, high biomass productivity, and low cost of harvesting [8,9,10,11,12]. Accordingly, there is increasing interest in understanding factors that can improve the efficiency of biofilm-based microalgae systems.
To date, extensive studies have reported that many factors can affect performance of microalgae biofilms cultivation, such as light condition, amount of CO2 supplementation, both nutrient type and concentration, temperature, etc. [11,13,14]. Among these factors, light directly affects the photosynthesis of microalgae, and it was proved to be a crucial factor affecting microalgal growth. Generally, light-related parameters in microalgae cultivation include light intensity, light spectrum, photoperiod, source of illumination, light-switching strategy, and direction of light [11,15,16,17]. Among them, photoperiod plays an important role in microalgal photosynthesis and growth [6,15,18,19].
Recently, Martín-Girela et al. found that a multispecies microalgae biofilm culture (Chlorella sp. and Scenedesmus sp.) showed a higher CO2 fixation under photoperiods on the microsecond/millisecond scales than continuous lighting [20]. Toninelli et al. reported that biomass productivity of Scenedesmus dimorphus biofilm improved under photoperiods with a light period of 0.1–5 s compared with the same culture under continuous lighting [21]. These findings indicated that photoperiods on short timescales may be promising for improving growth of microalgae biofilm. However, to date, few researchers have studied the variations in the photosynthetic performance and cellular composition of microalgae biofilms cultivated under different photoperiods.
To address this gap, this work explored the effect of photoperiod on photosynthetic performance, biomass accumulation, and cellular composition of microalgae biofilms. Three widely used microalgae species, including Nannochloris oculata, marine Chlorella sp., and Chlorella pyrenoidosa, were cultured in a biofilm-based system under the photoperiods of 3:3 s, 5:5 s, 30:30 min, 12:12 h (light-period-to-dark-period ratio), and equivalent continuous lighting (CLeq). The chlorophyll content, typical photosynthetic parameters (maximum quantum yield and relative electron transport rate), biomass yield, and cellular composition (lipid, protein, and carbohydrate contents) of microalgae biofilms cultivated under different photoperiods were determined. This study has important implications in establishing appropriate light regimes for microalgae biofilm-based cultivation systems.
2. Materials and Methods
2.1. Microalgae Biofilm Cultivation
Three microalgae species, i.e., Nannochloris oculata (CCMA–325), marine Chlorella sp. (CCMA–309), and Chlorella pyrenoidosa (FACHB–9), were used in this study. The inoculum cells (Figure S1) for biofilm cultivation were pre-cultured in 500 mL flasks at 25 ± 1 °C for 6 days. The detailed composition of culture media is provided in the supporting information (SI, Tables S1–S3). After harvest, the pre-cultured cell suspensions were evenly vacuum-filtered onto cellulose acetate–nitrate membrane (diameter 50 mm, pore size 2 μm) to form a microalgae biofilm with an initial inoculum density of 5.0 ± 0.1 g·m−2. Then, as shown in Figure 1a, the membranes were placed into a biofilm cultivation bioreactor (400 × 200 × 200 mm), which contained culture medium solidified with 1% agar (see SI for the details).
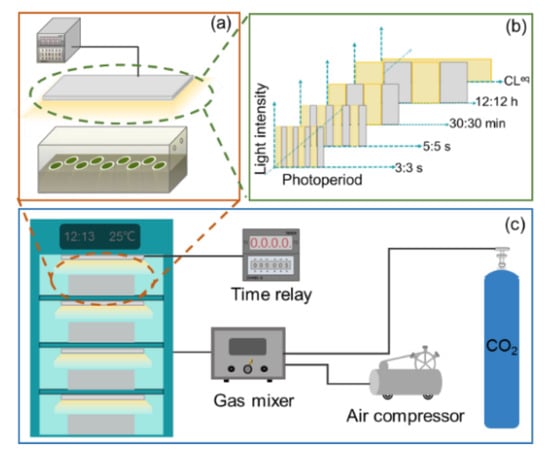
Figure 1.
Schematic of experimental setup. (a) Microalgae biofilm cultivated in a bioreactor. (b) The photoperiods were set to 3:3 s, 5:5 s, 30:30 min, 12:12 h (light-period-to-dark-period ratio), and equivalent continuous lighting (CLeq). (c) Biofilm cultivation bioreactors were kept in an incubator to maintain a constant growth temperature of 25 ± 1 °C.
During biofilm cultivation, a white light-emitting diode (LED; JK–W300200, J&K Photoelectric Technology, Shanghai, China) that was fixed above the bioreactor served as the light source for microalgal growth. The light spectrum of the white LED was characterized with a fiber spectrometer (USB4000, Ocean Optics Inc., Largo, FL, USA) (see Figure S2). The photoperiod was established by connecting the LED to a digital time relay, which was set to 3:3 s, 5:5 s, 30:30 min, 12:12 h, and equivalent continuous lighting (CLeq), as shown in Figure 1b. Note that, for the microalgae cultured under the photoperiods of 3:3 s, 5:5 s, 30:30 min, and 12:12 h, the photon flux densities of the LEDs at the biofilm surfaces were set to 200 μmol·photons·m−2·s−1, while, for microalgae cultured under CLeq, the photon flux density of the LED was set to 100 μmol·photons·m−2·s−1 to maintain the same total amount of light as the other four photoperiods. The photon flux densities of the LEDs were measured with a 4π quantum scalar sensor (QSL 2100, Biospherical Instruments Inc., San Diego, CA, USA).
In addition, as shown in Figure 1c, to maintain a steady temperature (25 ± 1 °C) for microalgal growth, biofilm cultivation bioreactors were kept in an incubator for a 6-day culture period. The insides of the bioreactors were aerated with compressed air enriched with 1% CO2 (vol/vol). To block the environmental light from entering the bioreactors, each entire bioreactor was wrapped with a black shade cloth during microalgal culture.
2.2. Determining the Chlorophyll Content and Photosynthetic Parameters of Microalgae
To understand the photosynthetic performance of microalgae cultivated under different photoperiods, the chlorophyll content and two typical photosynthetic parameters of microalgae were determined. After 6 days of culture, the chlorophyll content was measured according to the literature [22]. The chlorophylls were extracted in 80% acetone (vol/vol), and the absorbance of the mixture was measured at 646 and 663 nm, using a visible spectrophotometer (721, INESA, Shanghai, China). The chlorophyll a (chl–a) and chlorophyll b (chl–b) concentrations (mg/L) were calculated as follows:
chl–a = 12.21 × OD663 nm − 2.81 × OD646 nm
chl–b = 20.13 × OD663 nm − 5.03 × OD646 nm
The two typical photosynthetic parameters, including maximum quantum yield (Fv/Fm) and relative electron transport rate (rETR) of photosystem II in microalgae, were determined in situ by using a chlorophyll fluorometer (Imaging–PAM, Walz, Effeltrich, Germany). The Fv/Fm, which represents the maximum photosynthetic capacity of photosystem II, was calculated by Equation (3):
where F0 is the minimum fluorescence determined after dark adaptation for at least 30 min, and Fm is the maximum fluorescence determined by applying a 0.8 s saturating light pulse (3000 μmol·photons·m−2·s−1).
Fv/Fm = (Fm − F0)/Fm
The rETR approximates the rate of electrons pumped through the photosynthetic chain [23] and represents the real-time photosynthetic electron transport behavior of microalgae, which can be calculated based on the incident photosynthetically active radiation, as follows:
where ΦPSII is quantum yield of photosystem II, Qphar is amount of photosynthetically absorbed radiation in the measuring device, 0.84 is cell-specific absorption coefficient, and 0.5 represents the assumption that radiant energy is divided equally between photosystem I and photosystem II [24,25].
rETR = ΦPSII × Qphar × 0.84 × 0.5
For each microalga, the Fv/Fm and rETR of photosystem II were determined after 3 days of culture, by averaging the values measured for three biofilm samples (~5 points for each sample). Each measured biofilm sample was removed from random positions inside the bioreactor. The results are shown as mean ± 95% confidence intervals. The confidence intervals were obtained from the Student’s t distribution by determining the standard error of the mean.
2.3. Measurement of Biomass Yield
The biomass yield of microalgae cultured under different photoperiods was determined after 6 days of culture. The microalgae cells were collected by resuspending the microalgae biofilm in deionized water, followed by centrifugation at 1770× g for 4 min to remove cell debris and soluble nutrients. Then, the collected microalgae cells were dried to a constant weight at 105 °C. After cooling in a desiccator, microalgae biomass was weighed using an analytical balance (XS105, Mettler Toledo, Columbus, OH, USA). All measurements were repeated three times, and the results shown are mean ± standard deviation.
2.4. Quantification of Main Cellular Compositions of Microalgae
Cellular compositions of microalgae are critical evaluation parameters in various applications [26,27,28,29]. Generally, the main organic components of microalgae are lipid, protein, and carbohydrate, which represent approximately 90% of the microalgal dry biomass. In this study, the lipid, protein, and carbohydrate contents in microalgae cells were determined after 6 days of culture. In detail, the lipid was first qualitatively evaluated by observing the fluorescence of cells stained with Nile Red under a fluorescent microscope (BX61, Olympus, Tokyo, Japan) with excitation at 488 nm and emission at 580 nm. Then, the lipid content was quantitatively measured according to the literature [30], using chloroform as the solvent.
The protein content was determined using a colorimetric method [31,32], in which the microalgae biomass was pretreated with thermal alkaline, and the standard sample was bovine serum albumin (see Figure S3). The carbohydrate content was determined with the phenol–sulfuric method [33,34], with glucose as the standard sample (see Figure S4). These analyses of lipid, protein, and carbohydrate contents in microalgae cells were conducted in triplicate. All results shown are mean ± standard deviation.
3. Results and Discussion
3.1. Photosynthetic Performance
To evaluate the photosynthetic performance of microalgae cultured under different photoperiods, the chlorophyll content of microalgae, Fv/Fm, and rETR of photosystem II were measured. Figure 2(a1–a3) shows the chlorophyll contents in N. oculata, Chlorella sp., and C. pyrenoidosa cultivated under different photoperiods. It was found that the chlorophyll−a (chl–a) contents were much higher than the chlorophyll−b (chl–b) contents in these three microalgae, and the total chlorophyll contents were much lower in N. oculata and Chlorella sp. than in C. pyrenoidosa, which were consistent with the literature [35,36,37,38,39]. In addition, as shown in Figure 2(a1,a2), the chlorophyll contents in N. oculata and Chlorella sp. were almost the same among the five photoperiods (ranging from 0.9% to 1%). While, for C. pyrenoidosa, the chlorophyll contents were much higher under the photoperiods of 3:3 s and 5:5 s (~2.7%) than under the photoperiods of 30:30 min, 12:12 h, and CLeq (~1.8%). The different responses of microalgae cultured under these five photoperiods may be attributed to the differences in physiological characteristics of different microalgae.
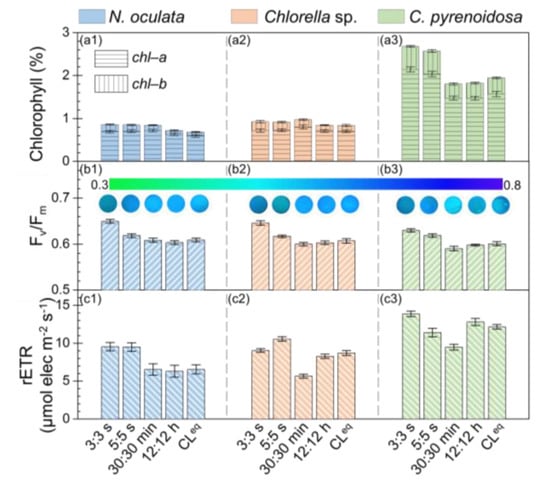
Figure 2.
Chlorophyll content, maximal quantum yield (Fv/Fm), and relative electron transport rate (rETR) for microalgae biofilms: Nannochloris oculata (a1,b1,c1), Chlorella sp. (a2,b2,c2), and Chlorella pyrenoidosa (a3,b3,c3).
Figure 2(b1–b3) shows the Fv/Fm values of photosystem II for microalgae biofilms. The insets are the representative Fv/Fm images of microalgae biofilms observed in situ. It was found that, for these three microalgae cultivated under the different photoperiods, the measured Fv/Fm values of photosystem II were >0.58, indicating that all these microalgae grew well under these light conditions. In addition, the Fv/Fm values of these three microalgae were ~12% higher under the photoperiod of 3:3 s (~0.65) than under the photoperiods of 30:30 min, 12:12 h, and CLeq (~0.58). This result indicated that the maximum photosynthetic capacity of the microalgae increased when cultivated under the photoperiod of 3:3 s.
Figure 2(c1–c3) shows the determined rETR of photosystem II for these three microalgae biofilms. It was found that the rETRs for these three microalgae were higher under the photoperiods of 3:3 s and 5:5 s than under the photoperiods of 30:30 min and CLeq. These results indicated that microalgae cultivated under the photoperiods of 3:3 s and 5:5 s had a faster photosynthetic electron transfer chain reaction, which may result in the increased photosynthetic performance, whereas, the photoperiod of 30:30 min did not appear to promote the photosynthetic performance of these microalgae.
The above results demonstrated that the Fv/Fm and rETR for these three microalgae were relatively higher under the photoperiods of 3:3 s and 5:5 s than under the photoperiods of 30:30 min, 12:12 h, and CLeq, which indicated that the seconds-scale photoperiods improved the photosynthetic performance of microalgae. Similarly, by evaluating the photo-efficiency via calculating the ratio of the energy contained in the biomass to the energy delivered by the light source, Toninelli et al. reported that the photo-efficiency of S. dimorphus biofilm cultivated under the photoperiods of 1:1 s and 5:5 s was higher than that cultivated under the photoperiods with scales of minutes and continuous lighting [21]. It was found that the results of this study were in good agreement with those reported by Toninelli et al.
3.2. Biomass Yield
To evaluate microalgal growth, the dry biomass yields of N. oculata, Chlorella sp., and C. pyrenoidosa biofilm cultivated under these five photoperiods were determined. As shown in Figure 3, the results indicated that the biomass yields of microalgae cultivated under different photoperiods were obviously different. In particular, Figure 3a indicates that the biomass yield of N. oculata was ~15% higher under the photoperiod of 3:3 s than under CLeq. Figure 3b shows that the biomass yields of Chlorella sp. were ~24% higher under the photoperiods of 3:3 s and 5:5 s than under CLeq. Similarly, Figure 3c indicates that the biomass yields of C. pyrenoidosa were ~18% higher under the photoperiods of 3:3 s and 5:5 s than under CLeq. Evidently, the biomass yields of these three microalgae were higher under the seconds-scale photoperiods (3:3 s and 5:5 s) than under the photoperiods of 30:30 min, 12:12 h, and CLeq.
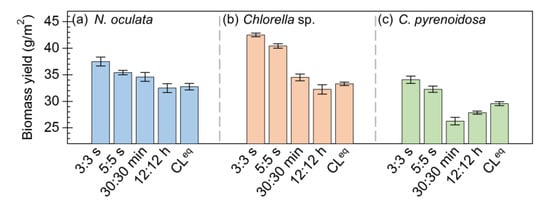
Figure 3.
The dry biomass yields of microalgae biofilms cultured under different photoperiods: Nannochloris oculata (a), Chlorella sp. (b), and Chlorella pyrenoidosa (c).
Together, these results revealed that the seconds-scale photoperiods (3:3 s and 5:5 s) can improve the biomass accumulation of microalgae. A previous study also found that the biomass productivity of S. dimorphus biofilm was ~9% higher under the photoperiods of 1:1 s and 5:5 than under continuous lighting [21]. From the photosynthetic parameters, it can be inferred that the increased biomass yield of microalgae cultivated under the seconds-scale photoperiods may be related to the improved photosynthetic performance.
3.3. Contents of Lipid, Protein, and Carbohydrate
Figure 4(a1–a5,b1–b5,c1–c5) shows the representative fluorescence images of N. oculata, Chlorella sp., and C. pyrenoidosa cultured under different photoperiods stained with Nile Red, respectively. It was found that these three microalgal species had relatively high lipid contents, and the lipid contents were higher under 3:3 s and 5:5 s than 30:30 min, 12:12 h, and CLeq. Furthermore, Figure 4(d1–d3) quantitatively depicts the lipid contents in N. oculata, Chlorella sp., and C. pyrenoidosa, indicating that these three microalgae were higher under 3:3 s and 5:5 s than the other three photoperiods. In particular, the lipid contents in N. oculata, Chlorella sp., and C. pyrenoidosa were 22%, 7%, and 9% higher, respectively, under 3:3 s than under CLeq. The lipid contents in Chlorella sp. and C. pyrenoidosa were 18% and 28% higher, respectively, under 3:3 s than 30:30 min. Evidently, the lipid contents of microalgae determined using the two methods were consistent, and both indicated that the seconds-scale photoperiod not only improved the photosynthetic performance and biomass yield of microalgae, but also increased their lipid contents. It is likely that the improved photosynthetic performance of microalgae cells cultivated under the seconds-scale photoperiod increased cell growth, thereby providing more substrate for lipid synthesis.
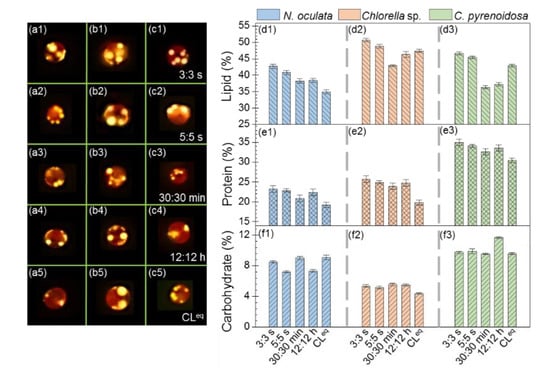
Figure 4.
Fluorescence images of microalgae cultivated under different photoperiods stained with Nile Red: Nannochloris oculata (a1–a5), Chlorella sp. (b1–b5), and Chlorella pyrenoidosa (c1–c5). The lipid, protein and carbohydrate contents in microalgae cultivated under different photoperiods: Nannochloris oculata (d1,e1,f1), Chlorella sp. (d2,e2,f2), and Chlorella pyrenoidosa (d3,e3,f3).
Moreover, Figure 4(e1–e3) shows the protein contents in these three microalgae, and it indicates that the protein contents in each microalga cultured under 3:3 s, 5:5 s, 30:30 min, and 12:12 h were comparable, and they were higher than those cultured under CLeq (N. oculata: ~16% higher, Chlorella sp.: ~25% higher; C. pyrenoidosa: ~11% higher). These above results suggested that the photoperiods of 3:3 s, 5:5 s, 30:30 min, and 12:12 h might be beneficial for protein synthesis in these three microalgae. Figure 4(f1–f3) depicts the carbohydrate contents in these three microalgae. Evidently, the carbohydrate contents were much lower than the lipid and protein contents, and this was consistent with another report [40]. In addition, we found that, for N. oculata and Chlorella sp., the carbohydrate contents of each microalga did not differ significantly among the five photoperiods. Whereas, for C. pyrenoidosa, the carbohydrate content of microalgae cultured under a photoperiod of 12:12 h was higher than those cultured under the other four photoperiods. This may be attributed to the different physiological characteristics of each microalga. Further studies should be conducted to understand this difference.
3.4. Implications for Selecting a Suitable Photoperiod in Biofilm-Based Microalgae Cultivation
The results of this study indicated that photoperiod regime can significantly affect the photosynthetic performance, biomass yield, and lipid and protein content of microalgae biofilm. In particular, the biomass yield and lipid content of these three microalgae were 11%–24% and 7%–22% higher, respectively, under the seconds-scale photoperiods (3:3 s and 5:5 s) than under continuous lighting. Analyses of the photosynthetic performance of microalgae suggested that a higher photosynthetic capacity was responsible for the improved biomass yield and lipid content under the photoperiods on the seconds scale. In addition, we found that the protein contents in these cultivated microalgae increased by 11%–25% under 3:3 s, 5:5 s, 30:30 min, and 12:12 h than continuous lighting, which indicated that the photoperiods with the scales of seconds/minutes/hours were beneficial for protein synthesis. Considering the simultaneous enhancement of biomass yield and both lipid and protein content in microalgae, the results suggested that the photoperiod on the seconds scale may be a promising light regime used in biofilm-based microalgae cultivation systems. However, it should be noted that artificial lights are required to apply photoperiods on the seconds scale, and they cost more than sunlight; therefore, in further studies, the energy consumption and costs of using artificial light to provide the seconds-scale photoperiod should be considered for better conclusions.
In addition, a previous study reported that, in a suspended microalgae cultivation system, photoperiods with scales of microseconds or milliseconds (i.e., a flashing light effect) generally enhanced the photosynthetic efficiency and cells’ growth of suspended cultured microalgae, and they also affected the contents of chlorophylls, carotenoids, lipids, proteins, and carbohydrates in cells [6,19]. Our results indicated that there are significant differences in the effects of photoperiods on the growth of microalgae between biofilm culture systems and suspended culture systems, which may be attributed to the differences in the characteristics of light transmission and refraction between these two culture systems.
4. Conclusions
The results of this study indicated that the photoperiods significantly influenced microalgae biofilms. The biomass yield and lipid content of three microalgae biofilms were 11%–24% and 7%–22% higher, respectively, under the seconds-scale photoperiods (3:3 s and 5:5 s) than under continuous lighting. Analyses of the photosynthetic parameters of microalgae suggested that a higher photosynthetic performance was responsible for the improved biomass yield and lipid content under the seconds-scale photoperiods. In addition, the results showed that photoperiods of 3:3 s, 5:5 s, 30:30 min, and 12:12 h were beneficial for protein synthesis. The results of this study suggested that it would be feasible to induce the synthesis of specific organic compounds in microalgae by adjusting the photoperiods in biofilm-based microalgae culture systems.
Supplementary Materials
The following are available online at https://www.mdpi.com/1996-1073/12/19/3724/s1. Tables S1–S3. The culture medium for microalgae. Figure S1. The morphology of microalgae cells and the cultivated microalgae biofilm. Figure S2. The light source and its light spectrum. Figure S3. The relationship between the bovine serum albumin content and the optical density of solution. Figure S4. The relationship between the glucose content and the optical density of solution.
Author Contributions
X.Z. (Xinru Zhang) designed and carried out the experiments, analyzed the data, and drafted the manuscript. H.Y., L.G., X.W. and Y.W. participated in experimental designs and carried out part of the experiments. Z.J. and X.Z. (Xinxin Zhang) designed the study and revised the manuscript. L.C. analyzed the data. All authors read and approved the final manuscript.
Funding
This work is supported by the National Science Foundation of China (No. 51706019) and the Fundamental Research Fund for the Central Universities (No. FRF–AS–17–001 and No. FRF–BD–18–015A).
Acknowledgments
We thank Zhang Chunyan from the Plant Science Facility of the Institute of Botany, Chinese Academy of Sciences, for technical assistance with chlorophyll fluorescence measurements.
Conflicts of Interest
The authors declare no conflict of interest.
References
- Hallenbeck, P.C.; Grogger, M.; Mraz, M.; Veverka, D. Solar biofuels production with microalgae. Appl. Energy 2016, 179, 136–145. [Google Scholar] [CrossRef]
- Zhou, W.; Wang, J.; Chen, P.; Ji, C.; Kang, Q.; Lu, B.; Li, K.; Liu, J.; Ruan, R. Bio-mitigation of carbon dioxide using microalgal systems: Advances and perspectives. Renew. Sustain. Energy Rev. 2017, 76, 1163–1175. [Google Scholar] [CrossRef]
- Milledge, J.J.; Nielsen, B.V.; Maneein, S.; Harvey, P.J. A Brief Review of Anaerobic Digestion of Algae for Bioenergy. Energies 2019, 12, 1166. [Google Scholar] [CrossRef]
- Benemann, J. Microalgae for Biofuels and Animal Feeds. Energies 2013, 6, 5869–5886. [Google Scholar] [CrossRef]
- Uduman, N.; Qi, Y.; Danquah, M.K.; Forde, G.M.; Hoadley, A. Dewatering of microalgal cultures: A major bottleneck to algae-based fuels. J. Renew. Sustain. Energy 2010, 2, 23–571. [Google Scholar] [CrossRef]
- Schulze, P.S.C.; Guerra, R.; Pereira, H.; Schuler, L.M.; Varela, J.C.S. Flashing LEDs for Microalgal Production. Trends Biotechnol. 2017, 35, 1088–1101. [Google Scholar] [CrossRef] [PubMed]
- Saad, M.G.; Dosoky, N.S.; Zoromba, M.S.; Shafik, H.M. Algal Biofuels: Current Status and Key Challenges. Energies 2019, 12, 1920. [Google Scholar] [CrossRef]
- Wang, Y.; Ho, S.H.; Cheng, C.L.; Guo, W.Q.; Nagarajan, D.; Ren, N.Q.; Lee, D.J.; Chang, J.S. Perspectives on the feasibility of using microalgae for industrial wastewater treatment. Bioresour. Technol. 2016, 222, 485–497. [Google Scholar] [CrossRef] [PubMed]
- Huang, Y.; Xiong, W.; Liao, Q.; Fu, Q.; Xia, A.; Zhu, X.; Sun, Y. Comparison of Chlorella vulgaris biomass productivity cultivated in biofilm and suspension from the aspect of light transmission and microalgae affinity to carbon dioxide. Bioresour. Technol. 2016, 222, 367–373. [Google Scholar] [CrossRef]
- Liu, T.; Wang, J.; Hu, Q.; Cheng, P.; Ji, B.; Liu, J.; Chen, Y.; Zhang, W.; Chen, X.; Chen, L.; et al. Attached cultivation technology of microalgae for efficient biomass feedstock production. Bioresour. Technol. 2013, 127, 216–222. [Google Scholar] [CrossRef]
- Zhuang, L.L.; Yu, D.; Zhang, J.; Liu, F.F.; Wu, Y.H.; Zhang, T.Y.; Dao, G.H.; Hu, H.Y. The characteristics and influencing factors of the attached microalgae cultivation: A review. Renew. Sustain. Energy Rev. 2018, 94, 1110–1119. [Google Scholar] [CrossRef]
- Wang, J.; Liu, J.; Liu, T. The difference in effective light penetration may explain the superiority in photosynthetic efficiency of attached cultivation over the conventional open pond for microalgae. Biotechnol. Biofuels 2015, 8, 49. [Google Scholar] [CrossRef] [PubMed]
- Schnurr, P.J.; Allen, D.G. Factors affecting algae biofilm growth and lipid production: A review. Renew. Sustain. Energy Rev. 2015, 52, 418–429. [Google Scholar] [CrossRef]
- Wang, J.; Liu, W.; Liu, T. Biofilm based attached cultivation technology for microalgal biorefineries-A review. Bioresour. Technol. 2017, 244, 1245–1253. [Google Scholar] [CrossRef] [PubMed]
- Ramanna, L.; Rawat, I.; Bux, F. Light enhancement strategies improve microalgal biomass productivity. Renew. Sustain. Energy Rev. 2017, 80, 765–773. [Google Scholar] [CrossRef]
- Wang, S.K.; Stiles, A.R.; Guo, C.; Liu, C.Z. Microalgae cultivation in photobioreactors: An overview of light characteristics. Eng. Life Sci. 2014, 14, 550–559. [Google Scholar] [CrossRef]
- Shen, Y.; Wang, S.; Ho, S.H.; Xie, Y.; Chen, J. Enhancing lipid production in attached culture of a thermotolerant microalga Desmodesmus sp. F51 using light-related strategies. Biochem. Eng. J. 2018, 129, 119–128. [Google Scholar] [CrossRef]
- Maroneze, M.M.; Siqueira, S.F.; Vendruscolo, R.G.; Wagner, R.; de Menezes, C.R.; Zepka, L.Q.; Jacob-Lopes, E. The role of photoperiods on photobioreactors - A potential strategy to reduce costs. Bioresour. Technol. 2016, 219, 493–499. [Google Scholar] [CrossRef] [PubMed]
- Abu-Ghosh, S.; Fixler, D.; Dubinsky, Z.; Iluz, D. Flashing light in microalgae biotechnology. Bioresour. Technol. 2016, 203, 357–363. [Google Scholar] [CrossRef]
- Martín-Girela, I.; Curt, M.D.; Fernández, J. Flashing light effects on CO2 absorption by microalgae grown on a biofilm photobioreactor. Algal Res. 2017, 25, 421–430. [Google Scholar] [CrossRef]
- Toninelli, A.E.; Wang, J.; Liu, M.; Wu, H.; Liu, T. Scenedesmus dimorphus biofilm: Photoefficiency and biomass production under intermittent lighting. Sci. Rep. 2016, 6, 32305. [Google Scholar] [CrossRef]
- Wellburn, A.R. The Spectral Determination of Chlorophylls A and B, as Well as Total Carotenoids, Using Various Solvents with Spectrophotometers of Different Resolution. J. Plant Physiol. 1994, 144, 307–313. [Google Scholar] [CrossRef]
- Short, F.T.; Coles, R.G. Global Seagrass Research Methods; Elsevier: Amsterdam, The Netherlands, 2001; Volume 33. [Google Scholar]
- Wagner, H.; Jakob, T.; Wilhelm, C. Balancing the energy flow from captured light to biomass under fluctuating light conditions. New Phytol. 2006, 169, 95–108. [Google Scholar] [CrossRef]
- Szabó, M.; Parker, K.; Guruprasad, S.; Kuzhiumparambil, U.; Lilley, R.M.; Tamburic, B.; Schliep, M.; Larkum, A.W.; Schreiber, U.; Raven, J.A. Photosynthetic acclimation of Nannochloropsis oculata investigated by multi-wavelength chlorophyll fluorescence analysis. Bioresour. Technol. 2014, 167, 521–529. [Google Scholar] [CrossRef][Green Version]
- Nguyen, T.D.P.; Nguyen, D.H.; Lim, J.W.; Chang, C.K.; Leong, H.Y.; Tran, T.N.T.; Vu, T.B.H.; Nguyen, T.T.C.; Show, P.L. Investigation of the Relationship between Bacteria Growth and Lipid Production Cultivating of Microalgae Chlorella Vulgaris in Seafood Wastewater. Energies 2019, 12, 2282. [Google Scholar] [CrossRef]
- López-Rosales, A.R.; Ancona-Canché, K.; Chavarria-Hernandez, J.C.; Barahona-Pérez, F.; Toledano-Thompson, T.; Garduño-Solórzano, G.; López-Adrian, S.; Canto-Canché, B.; Polanco-Lugo, E.; Valdez-Ojeda, R. Fatty Acids, Hydrocarbons and Terpenes of Nannochloropsis and Nannochloris Isolates with Potential for Biofuel Production. Energies 2018, 12, 130. [Google Scholar] [CrossRef]
- Sharma, K.K.; Schuhmann, H.; Schenk, P.M. High Lipid Induction in Microalgae for Biodiesel Production. Energies 2012, 5, 1532–1553. [Google Scholar] [CrossRef]
- El-Dalatony, M.M.; Salama, E.S.; Kurade, M.B.; Hassan, S.H.A.; Oh, S.E.; Kim, S.; Jeon, B.H. Utilization of Microalgal Biofractions for Bioethanol, Higher Alcohols, and Biodiesel Production: A Review. Energies 2017, 10, 2110. [Google Scholar] [CrossRef]
- Bligh, E.G.; Dyer, W.J. A rapid method of total lipid extraction and purification. Can. J. Biochem. Physiol. 1959, 37, 911–917. [Google Scholar] [CrossRef] [PubMed]
- Lowry, O.H.; Rosebrough, N.J.; Farr, A.L.; Randall, R.J. Protein measurement with the Folin phenol reagent. J. Biol. Chem. 1951, 193, 265–275. [Google Scholar]
- Dorsey, T.E.; McDonald, P.; Roels, O.A. Measurements of phytoplankton-protein content with the heated biuret-folin assay. J. Phycol. 1978, 14, 167–171. [Google Scholar] [CrossRef]
- Hellebust, J.A.; Stein, J.R.; Craigie, J. Handbook of Phycological Methods: Physiological and Biochemical Methods; Cambridge University Press: Cambridge, UK, 1978; Volume 2. [Google Scholar]
- Mercz, T.I. A Study of High Lipid Yielding Microalgae with Potential for Large-Scale Production of Lipids and Polyunsaturated Fatty Acids. Ph.D. Thesis, Murdoch University, Perth, Australia, Dubai, UAE, 1994. [Google Scholar]
- Sung, M.G.; Han, J.I.; Lee, B.; Chang, Y.K. Wavelength shift strategy to enhance lipid productivity of Nannochloropsis gaditana. Biotechnol. Biofuels 2018, 11, 70. [Google Scholar] [CrossRef]
- Mohsenpour, S.F.; Willoughby, N. Luminescent photobioreactor design for improved algal growth and photosynthetic pigment production through spectral conversion of light. Bioresour. Technol. 2013, 142, 147–153. [Google Scholar] [CrossRef] [PubMed]
- Li, J.; Bin, H.; Lin, J.; Chen, F.; Miao, X. Effects of light-emitting diodes under capped daily energy consumption with combinations of electric power and photoperiod on cultivation of Chlorella pyrenoidosa. Bioresour. Technol. 2016, 205, 126–132. [Google Scholar] [CrossRef] [PubMed]
- Fan, J.; Cui, Y.; Wan, M.; Wang, W.; Li, Y. Lipid accumulation and biosynthesis genes response of the oleaginous Chlorella pyrenoidosaunder three nutrition stressors. Biotechnol. Biofuels 2014, 7, 17. [Google Scholar] [CrossRef] [PubMed]
- Da Silva Ferreira, V.; Sant’Anna, C. Impact of culture conditions on the chlorophyll content of microalgae for biotechnological applications. World J. Microbiol. Biotechnol. 2017, 33, 20. [Google Scholar] [CrossRef]
- De Winter, L.; Cabanelas, I.T.D.; Martens, D.E.; Wijffels, R.H.; Barbosa, M.J. The influence of day/night cycles on biomass yield and composition of Neochloris oleoabundans. Biotechnol. Biofuels 2017, 10, 104. [Google Scholar] [CrossRef] [PubMed]


© 2019 by the authors. Licensee MDPI, Basel, Switzerland. This article is an open access article distributed under the terms and conditions of the Creative Commons Attribution (CC BY) license (http://creativecommons.org/licenses/by/4.0/).