1. Introduction
Model Predictive Control (MPC) is a mature technology that has been widely implemented for advanced control of many processes, such as oil refining, chemical, advanced manufacturing, energy, environment, aerospace, medicine [
1,
2]. At each control interval an MPC algorithm computes the future control actions by minimizing an objective function over a finite prediction horizon according to the historical information and future response of the process model [
3]. This type of control algorithm has the ability to handle multiple interacting variables, constraints, large delay and complex dynamic processes [
4].
MPC with good performance can achieve more efficient raw material and energy usage per unit of product [
5]. Studies have shown that it is very common to quote energy savings of 1–4% through implementation of advanced control and other process control technologies [
6]. However, in the investigated plants over the 600,000 loops, up to 75% of the control loops are not providing benefits due to the poor control performance [
7]. In industrial applications, MPC performance will gradually decrease over time due to various factors such as sensor failure and equipment wear, etc. [
8], which can lead to a decline in product quality and an increase in energy consumption [
5]. Thus, it is important to assess the MPC performance and maintain its performance in an optimal state.
In recent years, performance assessment techniques have received extensive attention and rapid development in different industrial fields, such as the processing industry [
9], energy and power fields [
10,
11]. Among them, the control performance assessment (CPA) technique for MPC in the process industry is an important branch and the number of CPM tools installed in the industrial process is increasing [
12]. Over the past three decades, various CPA methods or benchmarks for MPC have been proposed and developed. Among these methods, model-based CPA benchmarks were first proposed for evaluating MPC performance, such as generalized-minimum variance control benchmark [
13] and linear-quadratic Gaussian benchmark [
14]. Both benchmarks give a theoretical performance bound with respect to the system output variance and the controller output variance, which helps to focus on product quality and actuator wear. In addition, Julien et al. proposed two performance curves, an old-controller-new-model performance curve and a new-controller-new-model performance curve to assess the potential improvement performance of MPC [
15]. However, model-based benchmarks typically require a complete plant model to calculate performance index. Although the process model can be estimated from closed-loop data in some cases, this method usually requires a lot of cost and time [
16] and requires the additional information such as the knowledge of the time delay or an external excitation signal to create a sufficient signal-to-noise ratio [
5]. Therefore, user-specified CPA benchmarks were proposed to get rid of the dependence on the plant model. By comparing the actual MPC performance with the expected performance or design performance specified by the field engineer, the expectation-case performance index and design-case performance index were presented separately [
17,
18]. Similar to the knowledge-based system, user-specified benchmarks also require extensive knowledge and experience from the field engineer, which limits their range of applications.
Due to the development of sensor measurement and control technology, data-driven multivariate statistical methods, such as principle component analysis (PCA) [
19,
20] and partial least squares (PLS) [
21,
22], have been introduced into the CPA field and have been used to assess the MPC performance. The data-driven CPA methods assess the performance by deepening the performance information contained in the monitored variables. They have the advantages of simple implementation and wide application range, and have received more and more attention from researchers and engineers [
23]. Zhang and Li [
24] combine a PCA model and an autoregressive moving average filter to monitor MPC performance. Zhao et al. [
25] developed multiple PLS models for performance monitoring of processes with multiple operating modes. Through utilizing historical output data, a statistical covariance-based index was proposed by Yu and Qin [
26,
27]. Then, Tian et al. improved this index and proposed an improved covariance index based on 2-norm [
3]. In order to discover abnormal changes in the distribution features of covariance matrices, a dissimilarity analysis based method [
28] and a hypothesis test based method [
29] were proposed by Li et al. and Yan et al., respectively. Wu [
30] established performance monitoring index based on Kullback–Leibler divergence. Xu et al. [
31,
32] use distance similarity factor-based on mahalanobis distance to assess MPC performance.
However, above traditional CPA methods only considered the steady state information of the process data without deeper mining of the temporal dynamic information therein. In order to solve this problem, Shang et al. [
33,
34] proposed a method based on slow feature analysis (SFA) to monitor control performance in both of the steady state and temporal dynamic dimensions. This method was successfully applied to batch processes monitoring [
35], as well as soft sensor modeling [
36]. Zhao et al. [
37] proposed a fine-scale assessment method of glycemic control performance by analyzing the temporal changing speed of the monitored data. By analyzing the process dynamics directly related to closed-loop control from quality-relevant view for industrial processes, Qin and Zhao [
38] proposed a fine-scale monitoring method of process performance status. Although the SFA-based CPA method has the ability to monitor changes in control performance, it does not point the direction of performance changes, that is, whether the control performance is getting better or worse [
34]. For the purpose of overcoming this shortcoming, an SFA-based predictable index was presented by Shang et al. [
39]. The SFA-based predictable index assesses MPC performance on the basis of the relationship between the slowness of slow features (SFs) and the predictability of monitored variables. In industrial applications, MPC is usually applied to large time-delay systems, so that relevant temporal predictable information also exists between SFs with different step intervals. For example, if a process has two sample time delays, then the compensation control action will not take effect on the output until two steps later, which prevents the complete compensation of the predictable content of the output in time. However, due to the limitation of the traditional SFA model structure, the predictable index only extracts predictable information between adjacent points of SFs, that is, it essentially only extracts one-step predictability in monitored variables but ignores the multi-step predictable information.
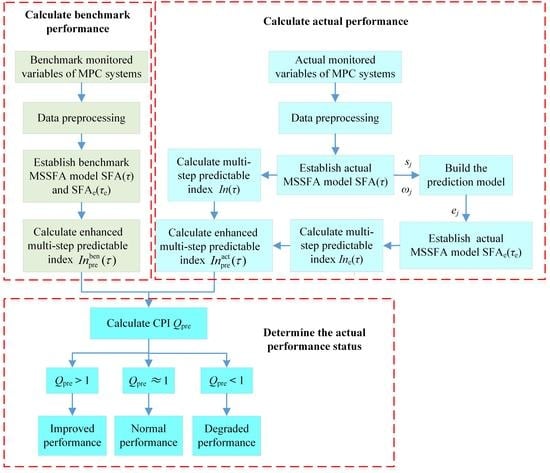
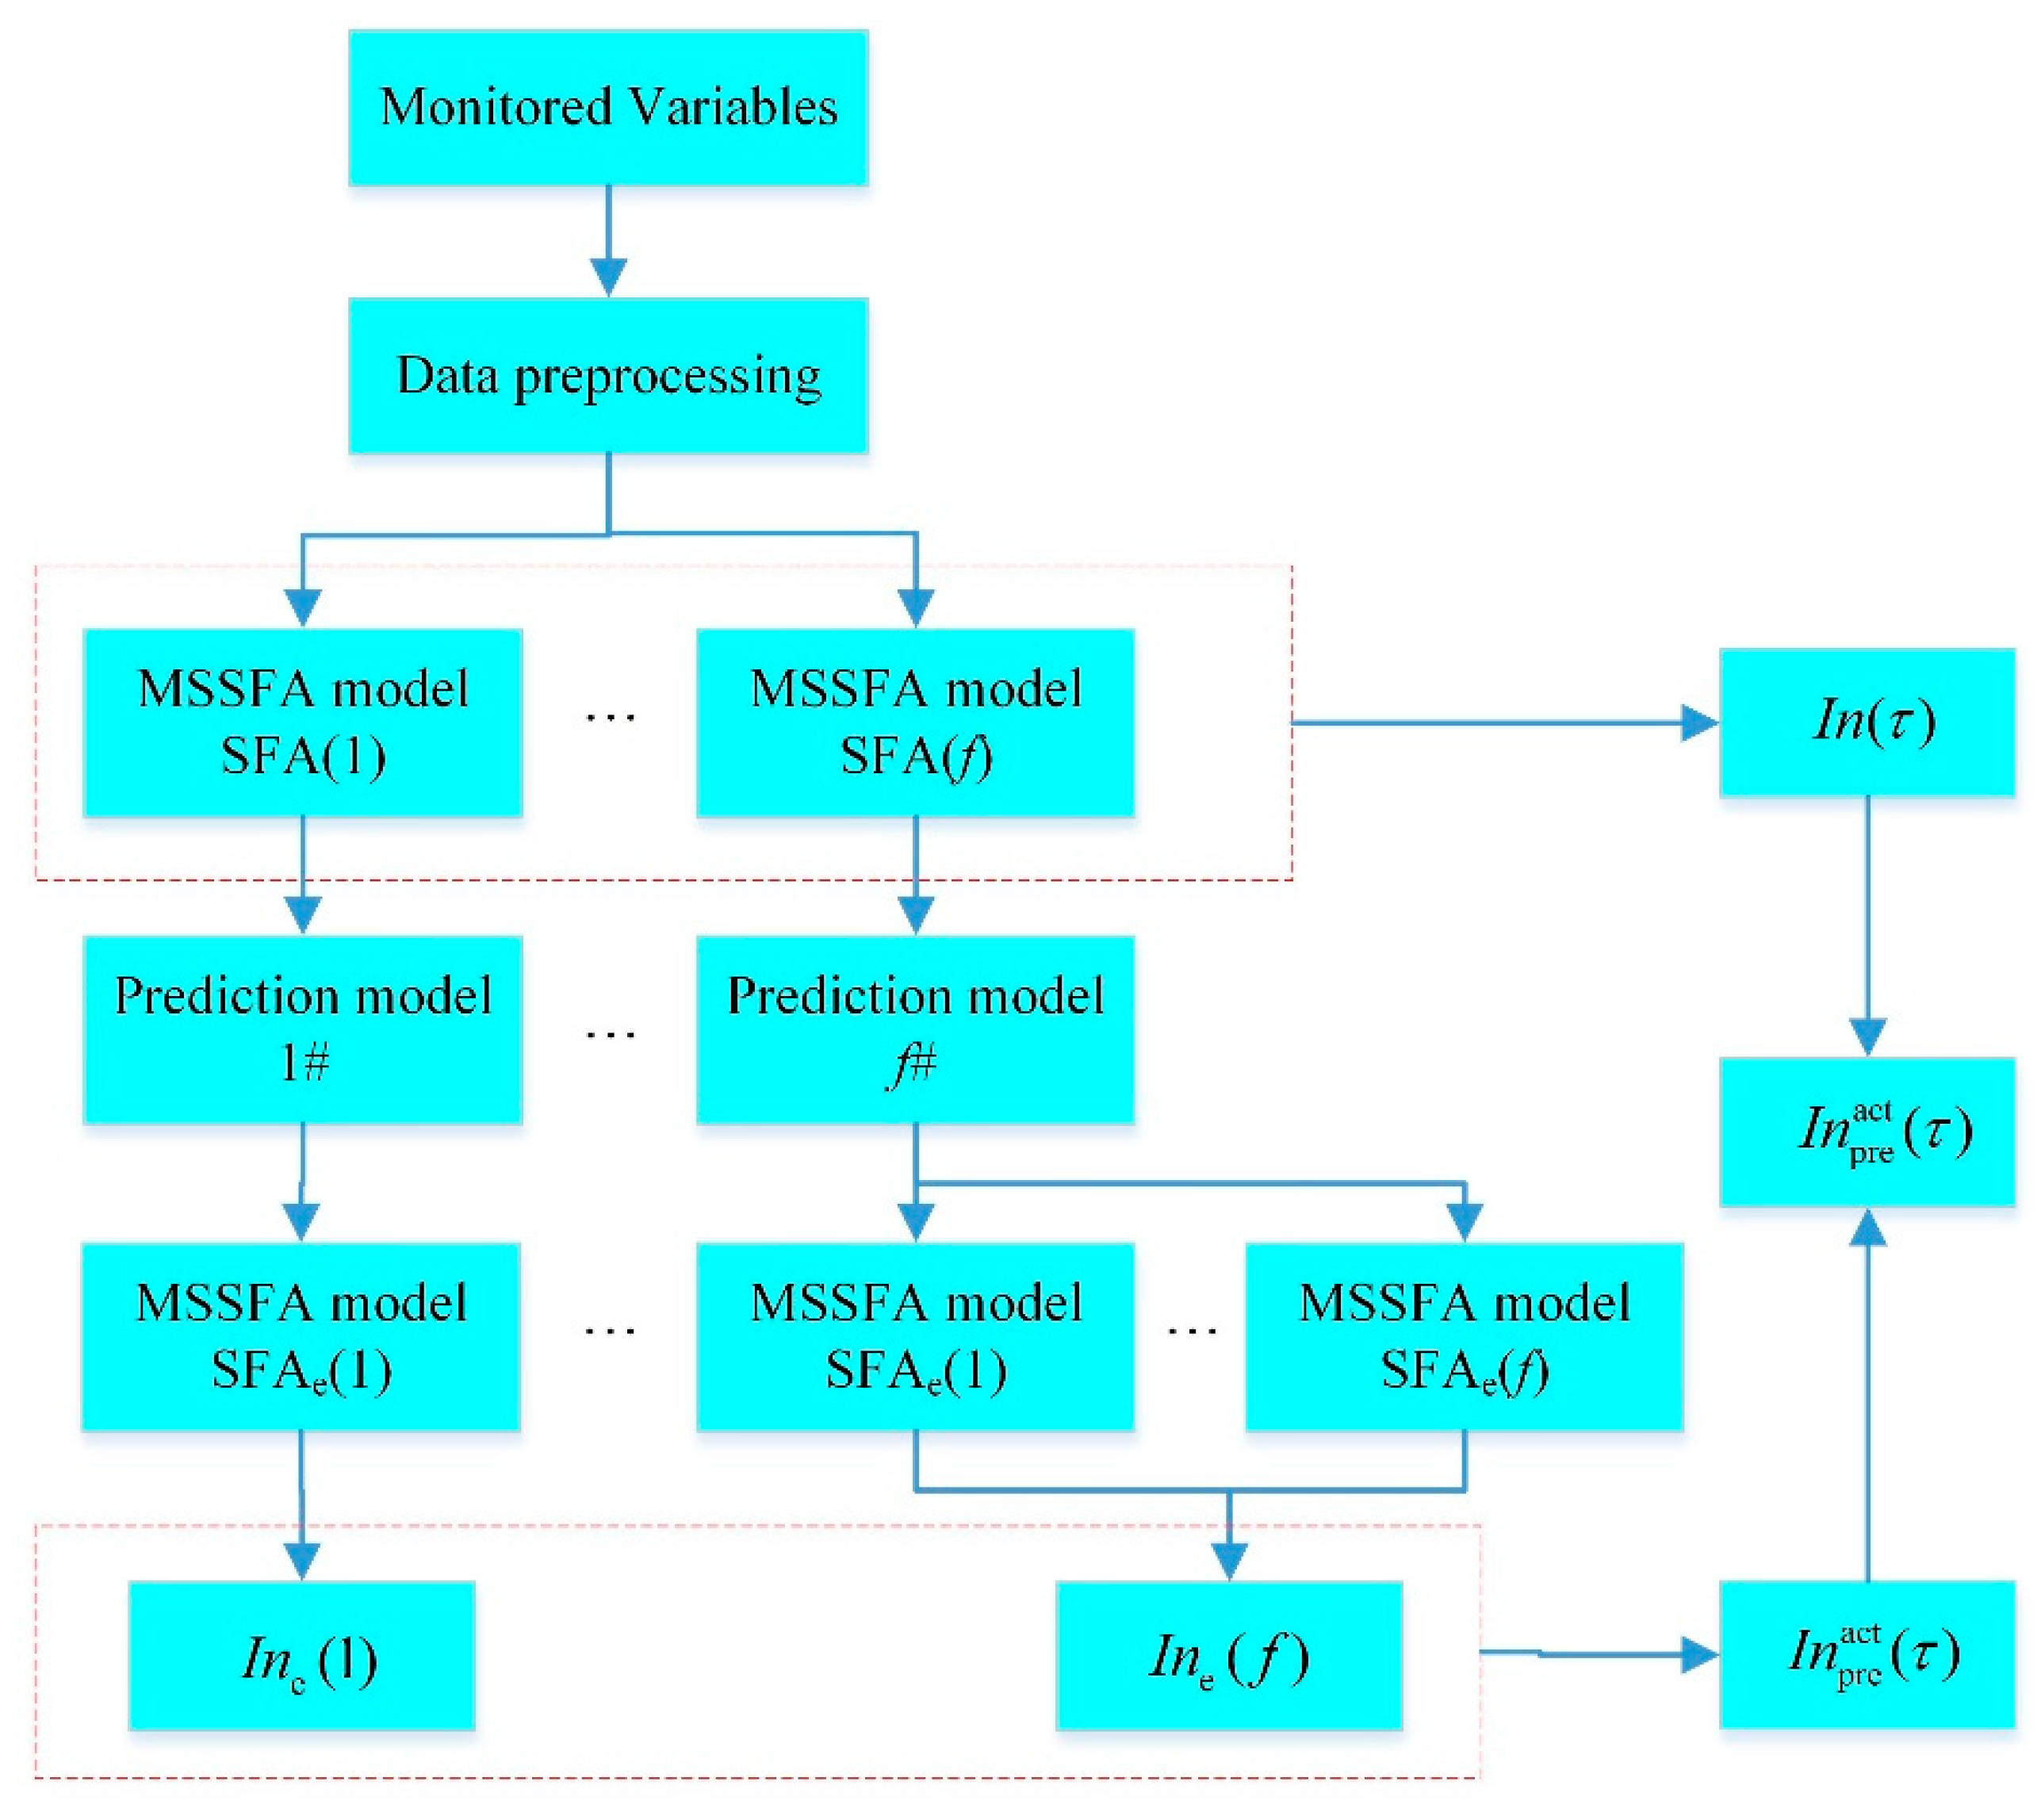
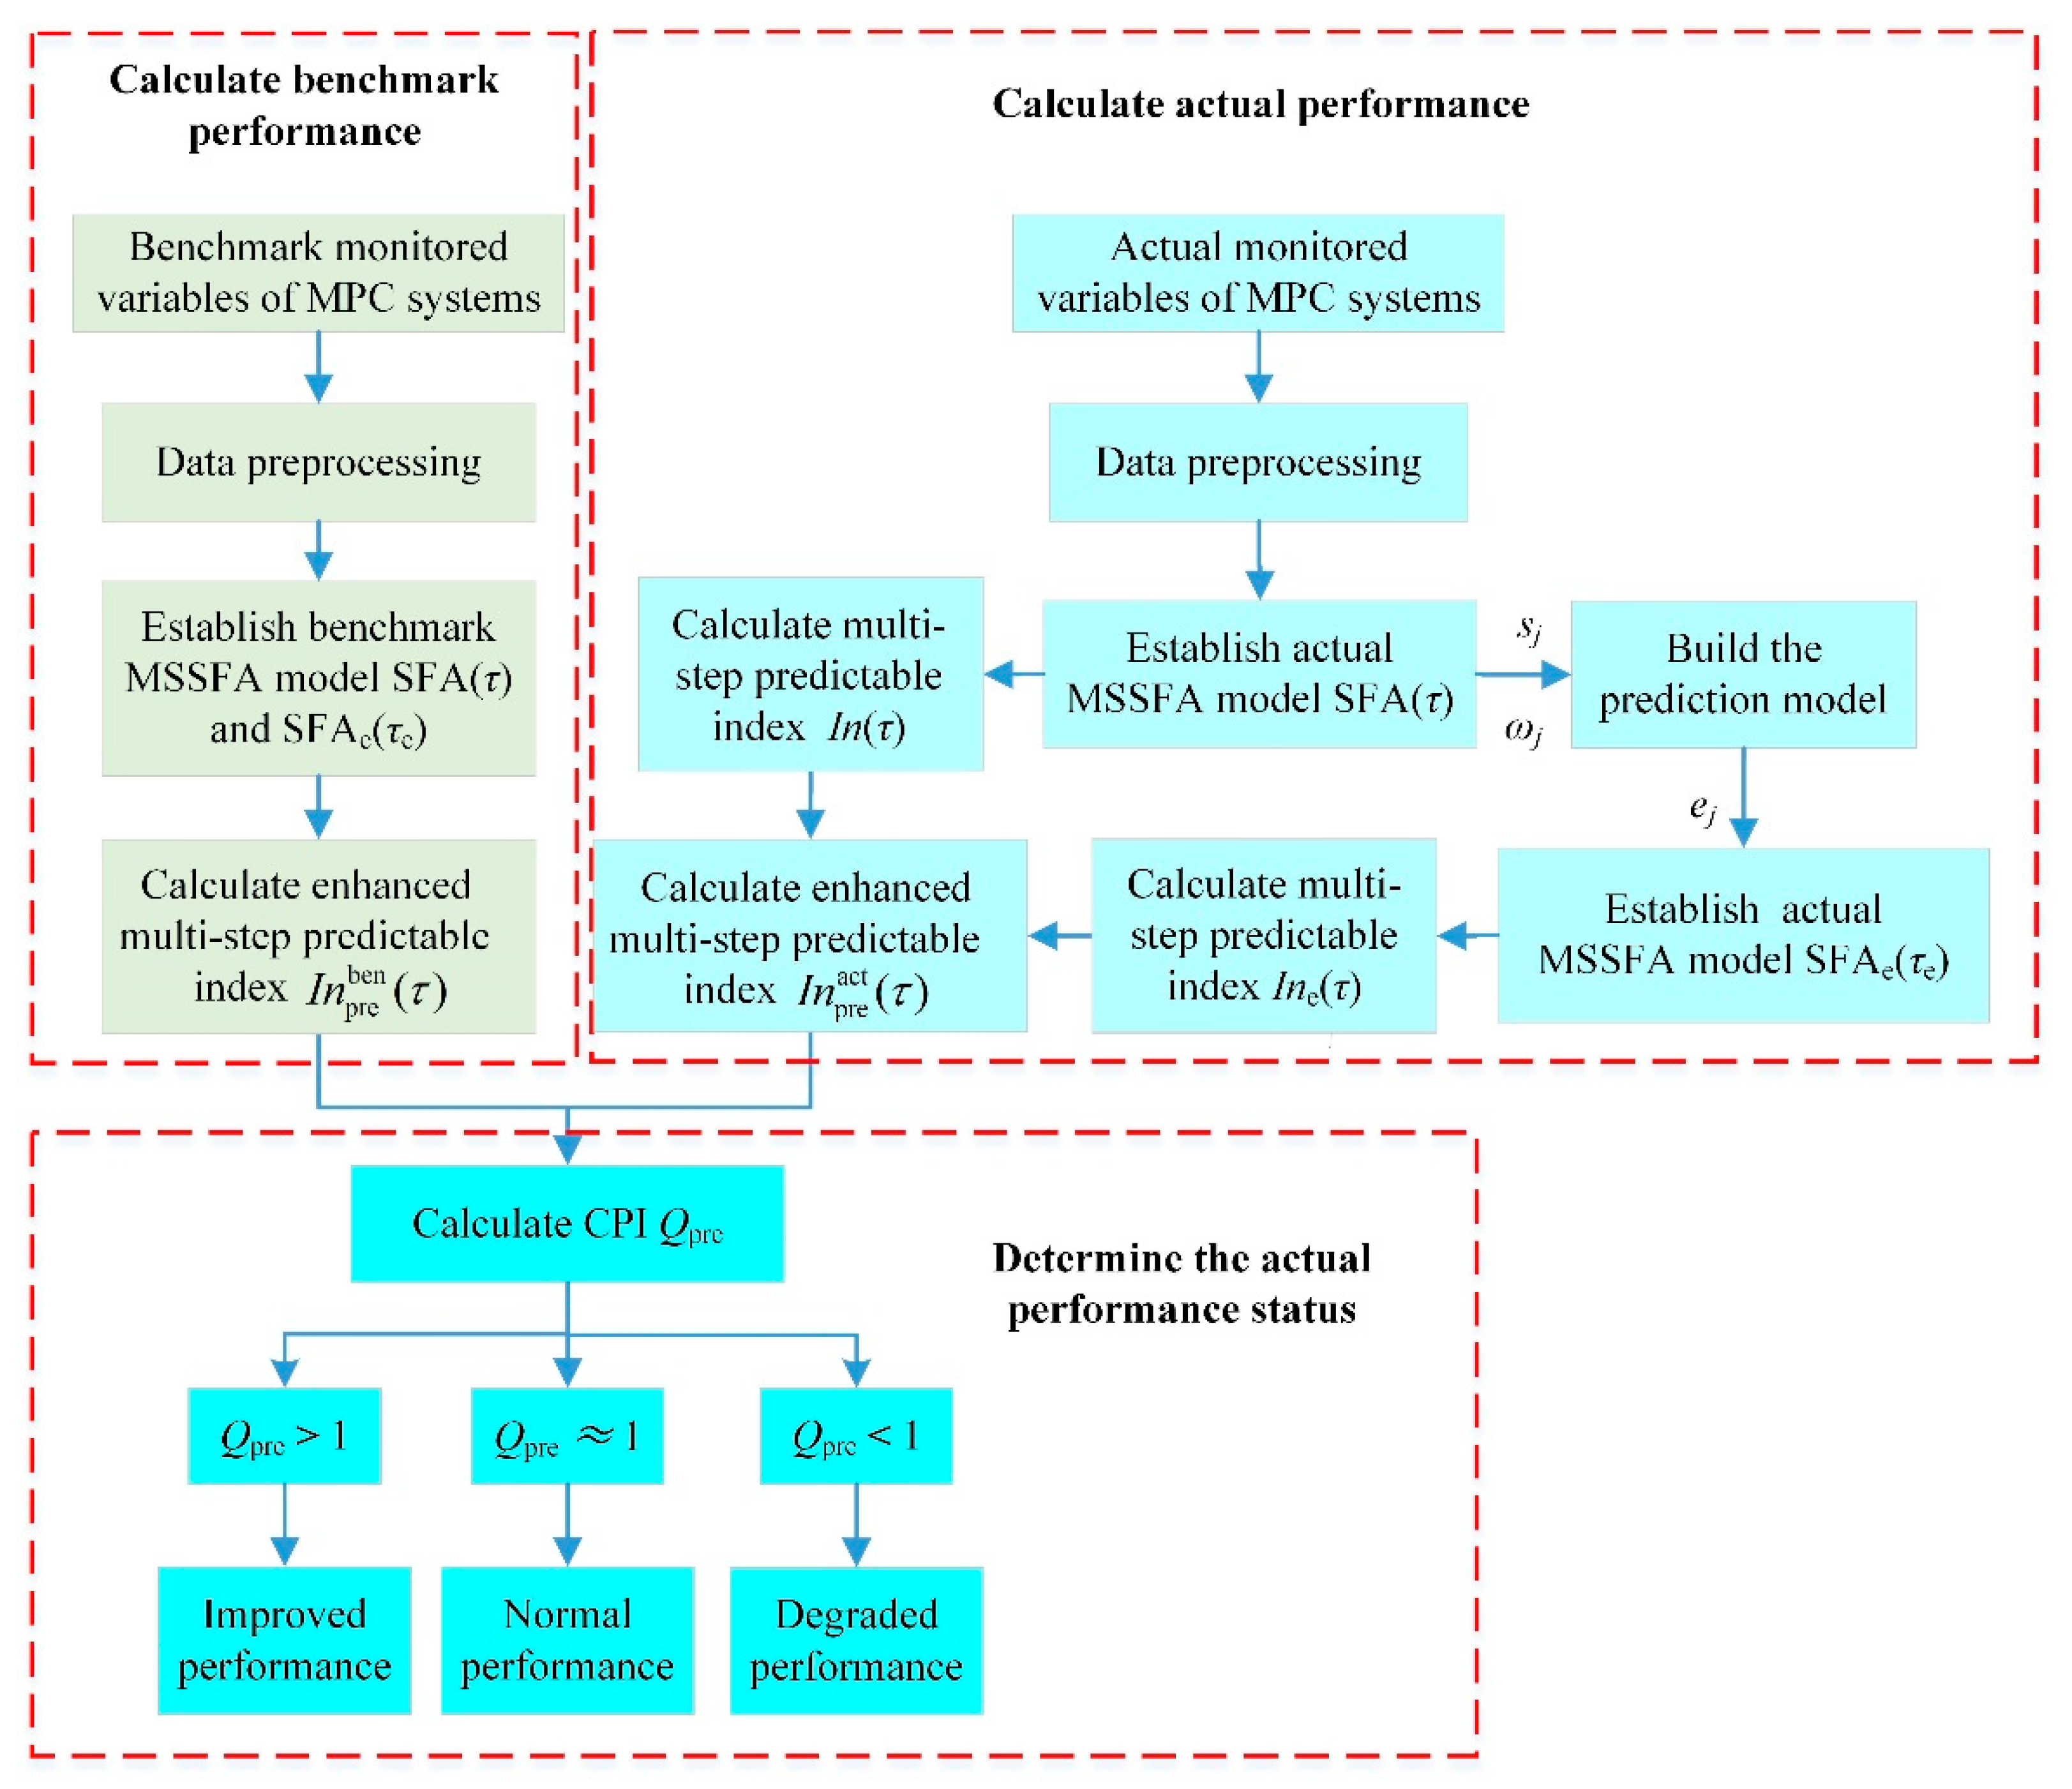
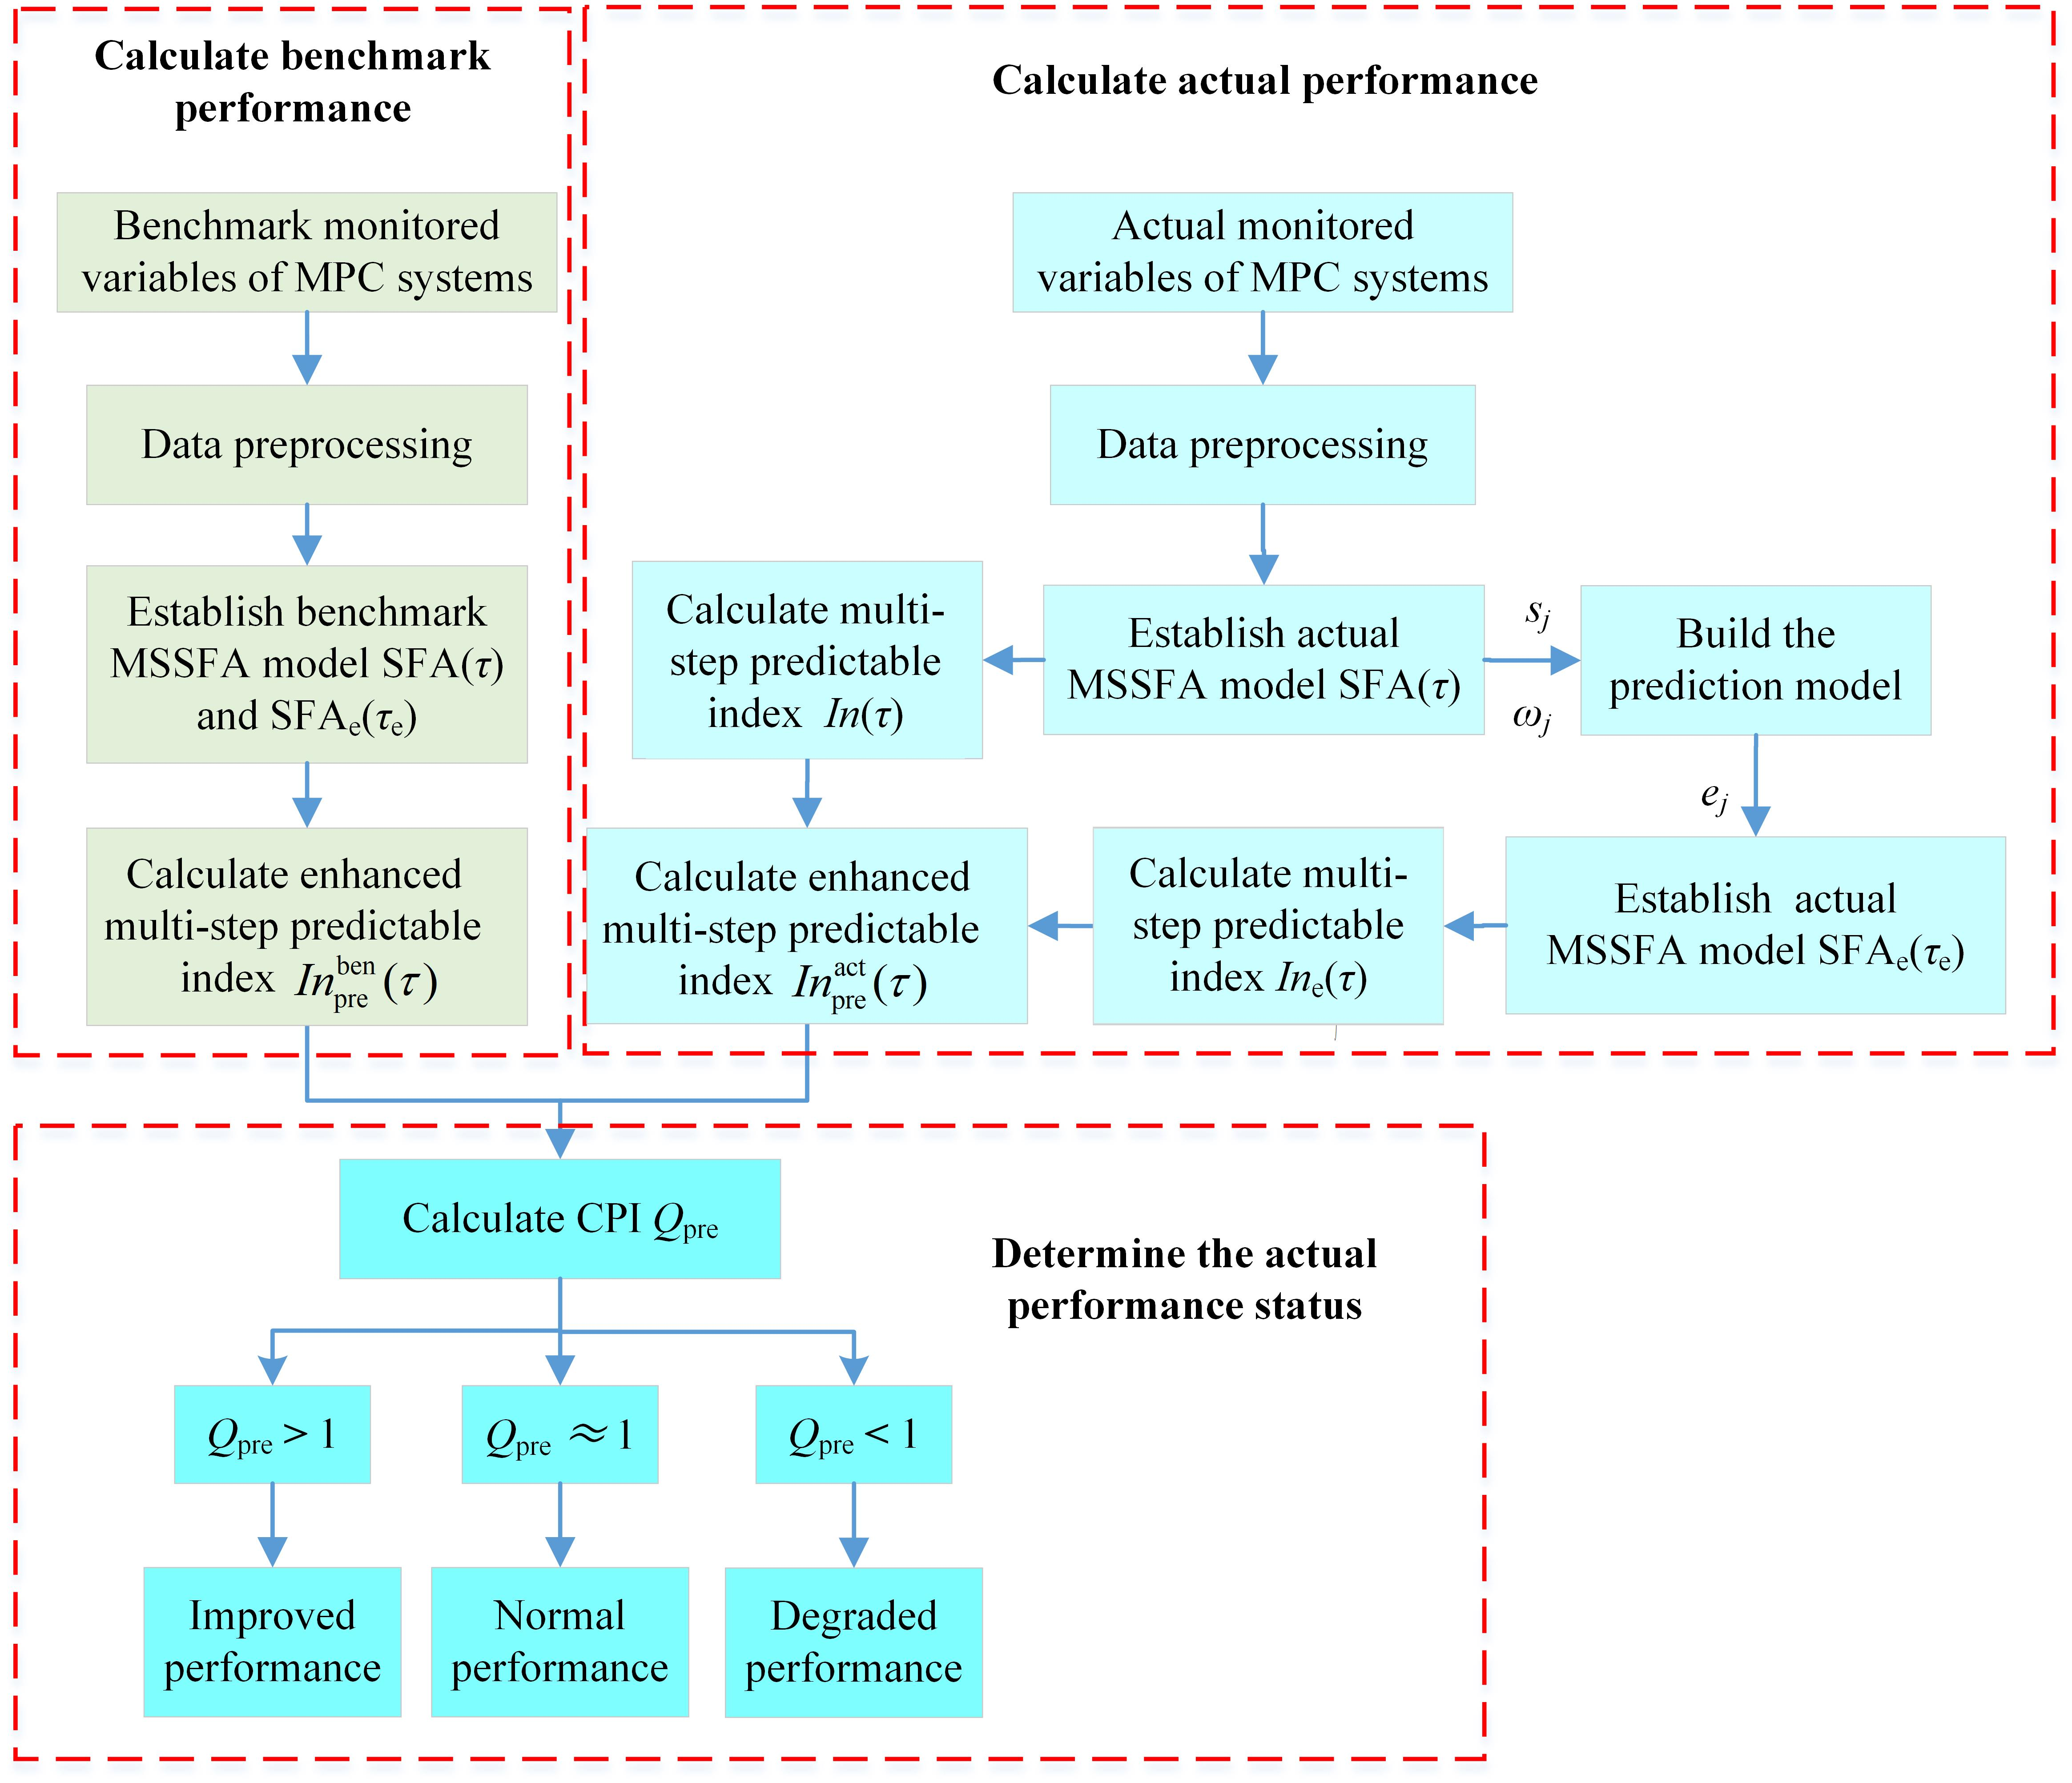
In order to extract the multi-step predictable information in monitored variables to overcome the shortcomings of the traditional SFA-based performance assessment method, a multi-step SFA (MSSFA) is proposed to assess MPC performance, which can be used to construct the multi-step predictable index. Firstly, by extending the temporal derivatives of the SFs from one step to multiple steps, an MSSFA model SFA(τ) is built and the corresponding multi-step predictable index In(τ) is constructed. Then, the SFs of SFA(τ) can be formulated as a prediction model similar to autoregressive (AR). This prediction model is used to predict SFs and the prediction error can be obtained. Thirdly, a new MSSFA model SFAe(τe) with the prediction error as input is developed and the corresponding multi-step predictable index Ine(τ) is built to extract the predictable information in prediction error. Finally, by incorporating In(τ) and Ine(τ), an enhanced multi-step predictable index Inpre(τ) is finally established. Considering the time-delay system that is common in industrial processes, the proposed method can effectively extract multi-step predictable information in data for assessment of MPC performance.
The rest of this article is organized as follows. Firstly, the traditional SFA-based predictable index is briefly reviewed. Subsequently, the multi-step predictable index for MPC performance assessment is introduced. Afterward, simulation studies and discussions are given. Finally, the conclusions are presented.
3. The Proposed Enhanced Multi-Step Predictable Index Based on Multi-Step SFA Method
However, according to Equation (6) and Equation (17), the traditional SFA method only focuses on the autocorrelation between adjacent points of SFs, that is, the traditional SFA-based predictable index only reveals one-step predictable information of monitored variables. In practice, for large time-delay systems, there is also predictable information between SFs with different step intervals. In order to mine the multi-step predictable information, a multi-step predictable index is proposed.
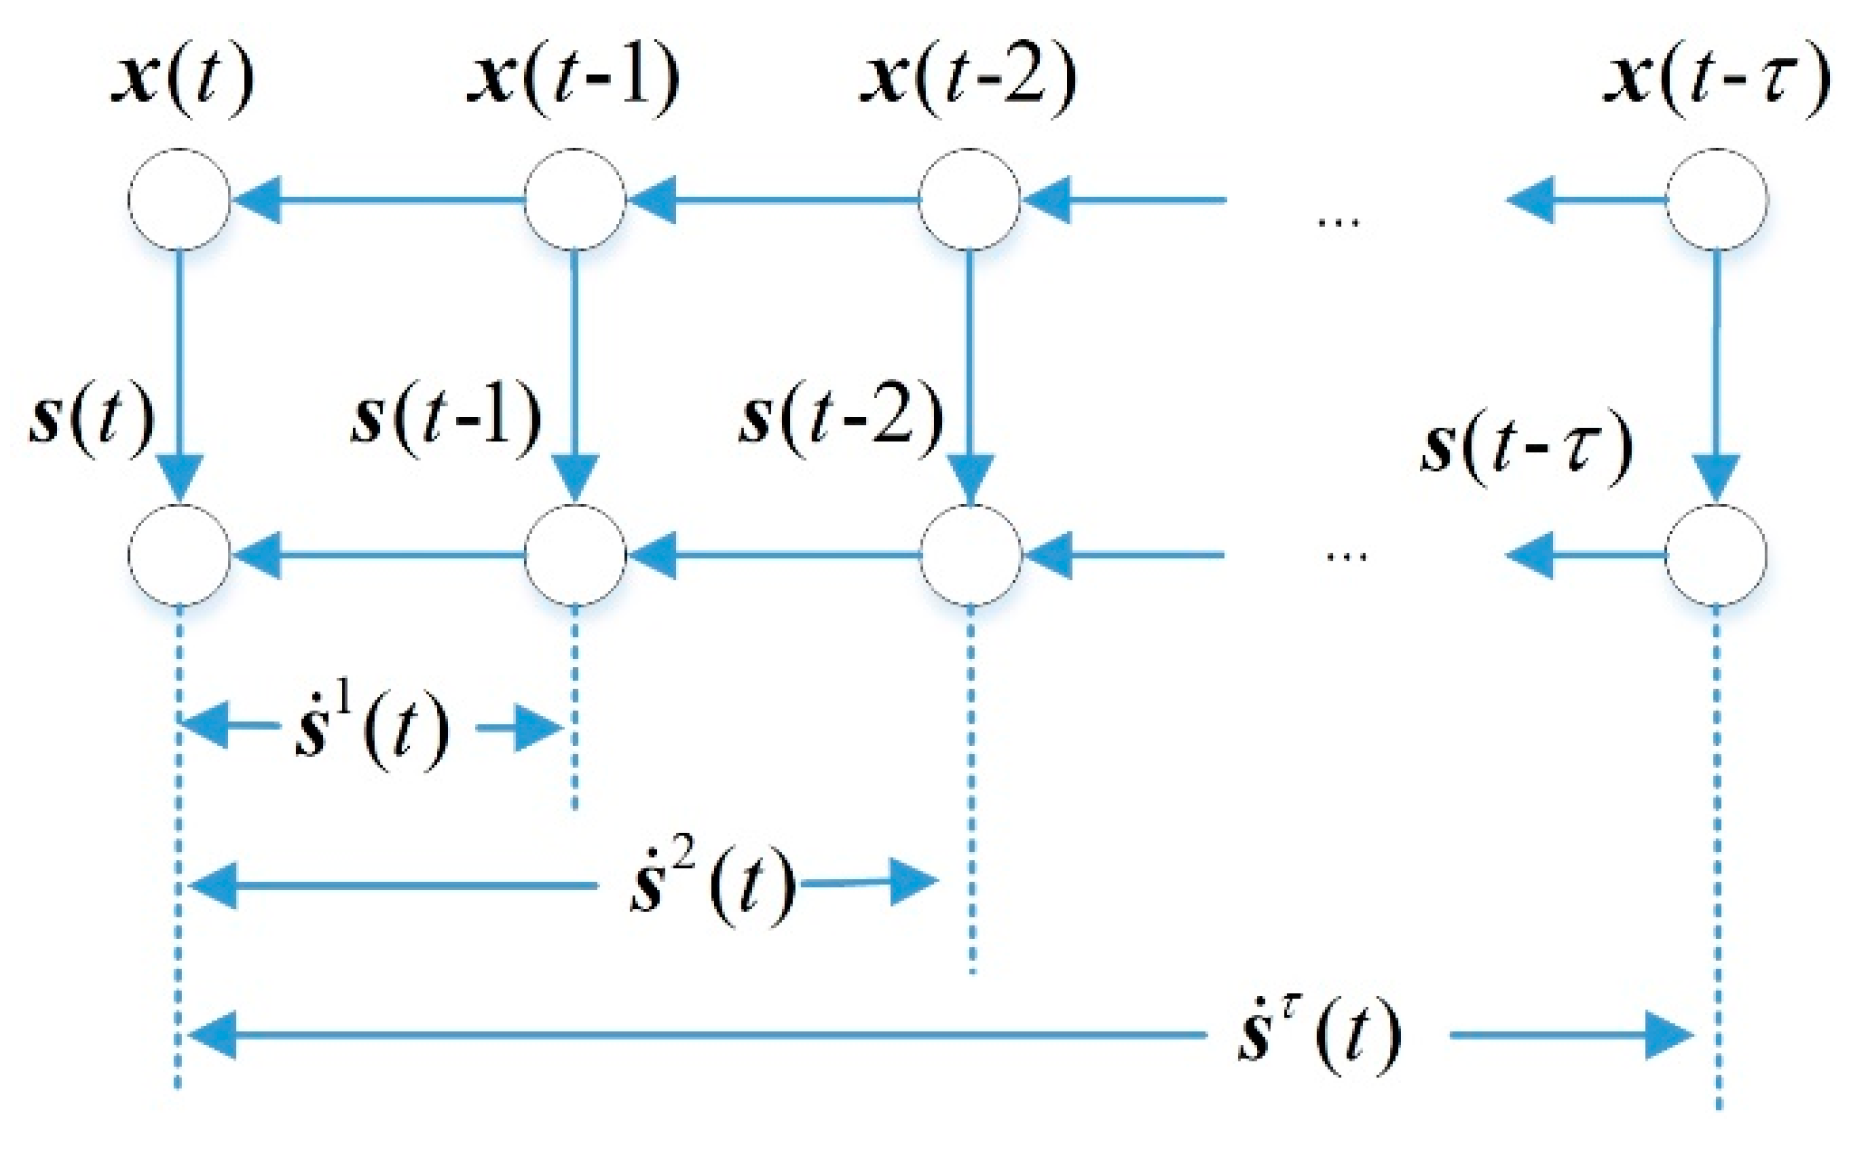
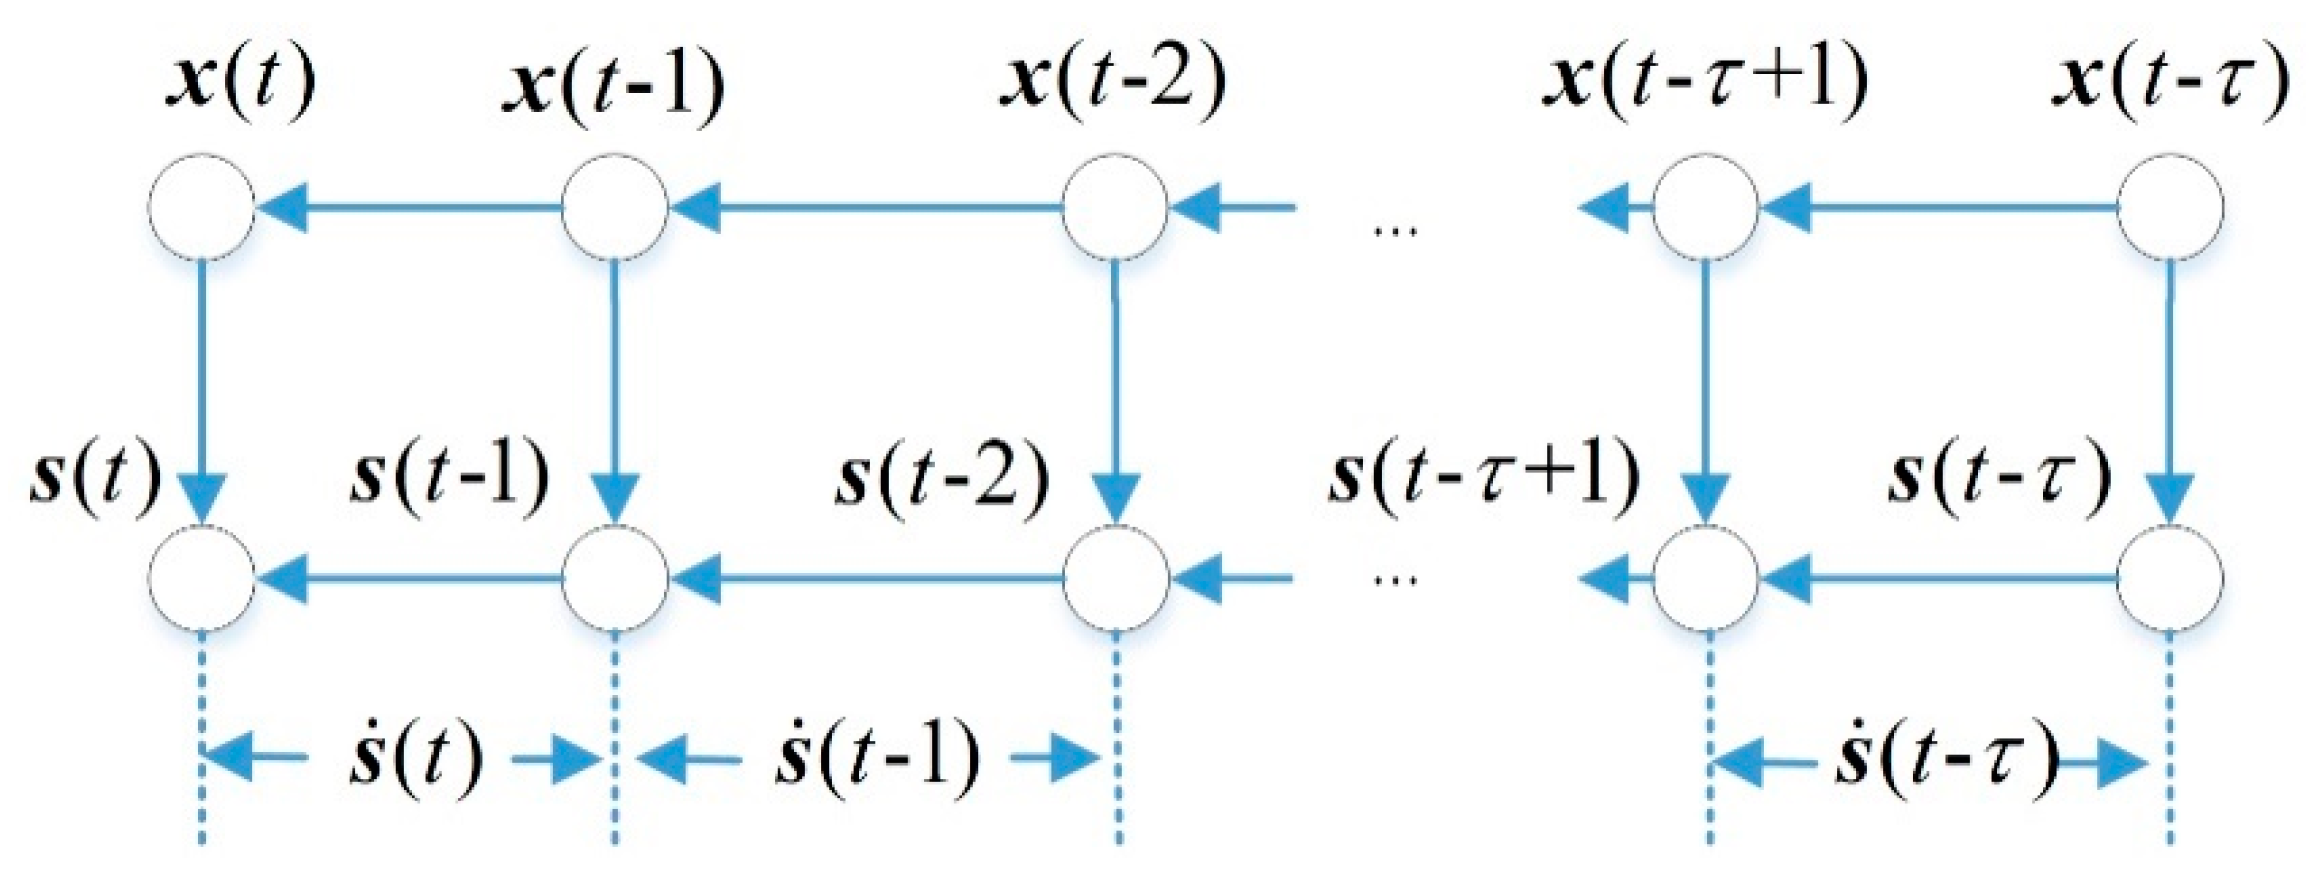
Firstly, the interval between the slow feature in Equation (6) is extended from one-step to multiple steps, and Equation (6) is redefined as:
where
τ is the interval step,
is the truncation step. Then multi-step SFA model SFA(
τ) is built as
where
is lag-
τ autocorrelation of
,
is the slowness of SFA(
τ). The equivalent objective function is as follows:
where
is the lag-
τ autocorrelation of
. The graphical structure of MSSFA is shown in
Figure 2.
Based on the MSSFA model SFA(
τ), the multi-step predictable index is defined as:
where
is the slowness of the slowest SF of SFA(
τ) and
.
Secondly, according to the relationship between the slowness
and the autocorrelation coefficients
of the SFs in Equation (20). The SF
of SFA(
τ) can be formulated as an AR-like prediction model:
where
is the real value,
is the prediction value, and
is the prediction error:
Similarly, predictable information is also included in prediction error
. If the prediction model in Equation (23) can predict the value of SFs well, then
is almost white noise and its predictability is very low, and vice versa. For a certain
τ value, prediction error
can be computed using Equation (24). Then, with
as input data, let
traverse the integer in interval
to create new MSSFA model SFA
e(
τe) and obtain the corresponding slowness
. Thus the multi-step predictable information in
can be extracted by
under different
. The multi-step predictable index based on prediction error
is built as:
where
is the slowness of the slowest SF in SFA
e(
τe),
,
.
Finally, based on the proposed MSSFA method, the enhanced multi-step predictable index is constructed by incorporating
In(
τ) and
Ine(
τ):
where,
. In this enhanced multi-step predictable index,
is a positive number less than one. Therefore, it can be used as a scaling factor to enhance sensitivity of
to control performance changes. According to the relationship between predictability and SFs autocorrelation, it can be known that as
τ increases, the amount of predictable information extracted from the data becomes less and less. After
τ reaches a certain value, there is very little predictable information that can be extracted. At this time, the predictable information extracted from the data is saturated. From the point of view of the multi-step predictable index, after
τ is greater than this value,
changes little and tends to be stable. Therefore, the value can be selected as the truncation step
[
41]. Calculation flow of the enhanced multi-step predictable index is shown in
Figure 3.
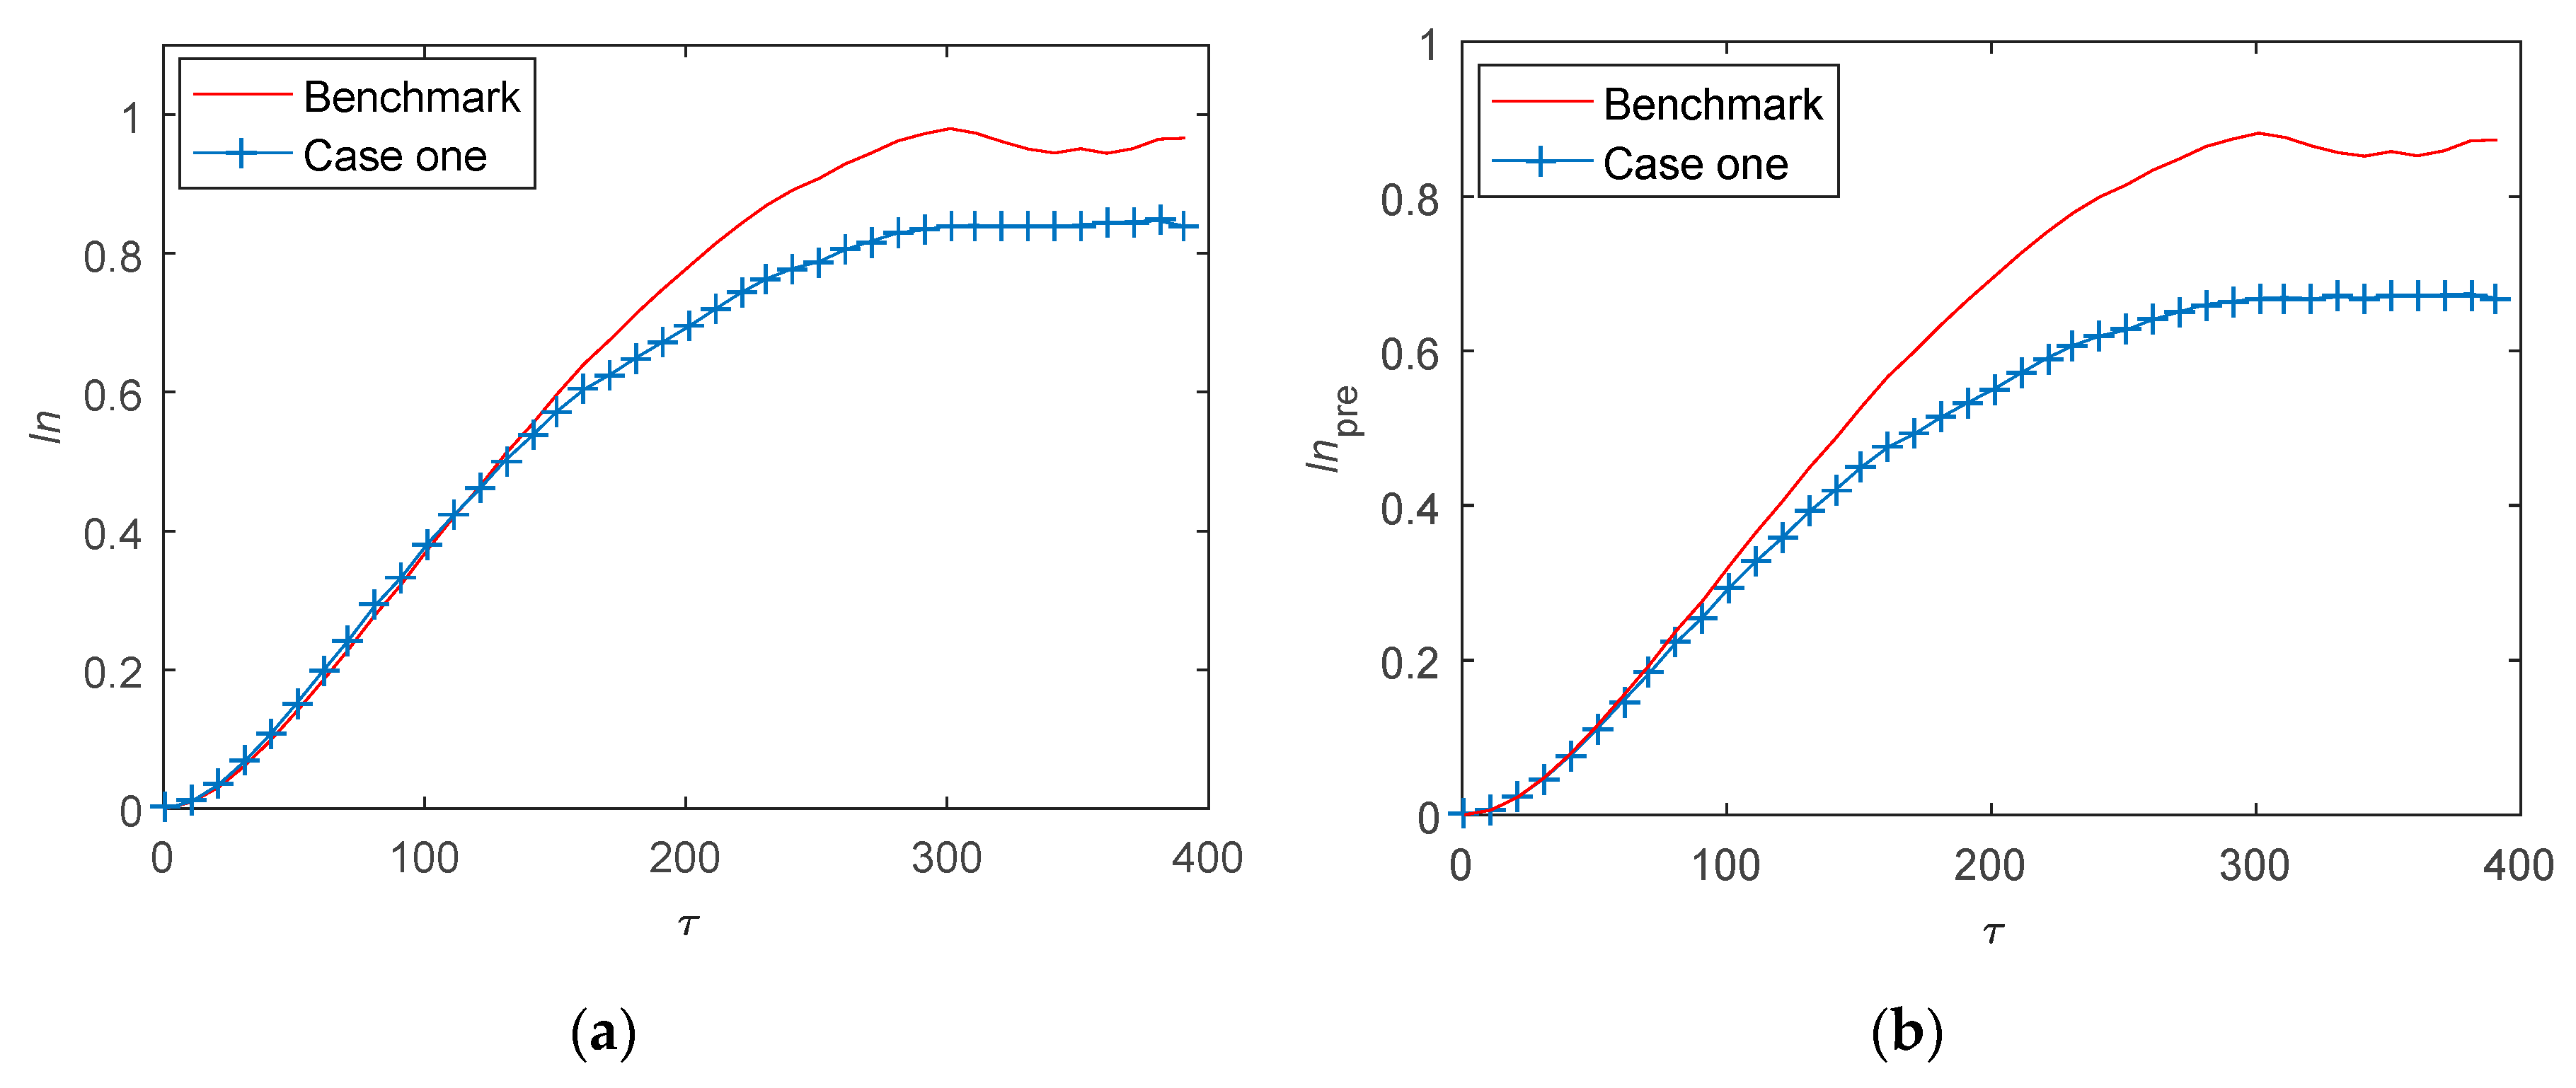
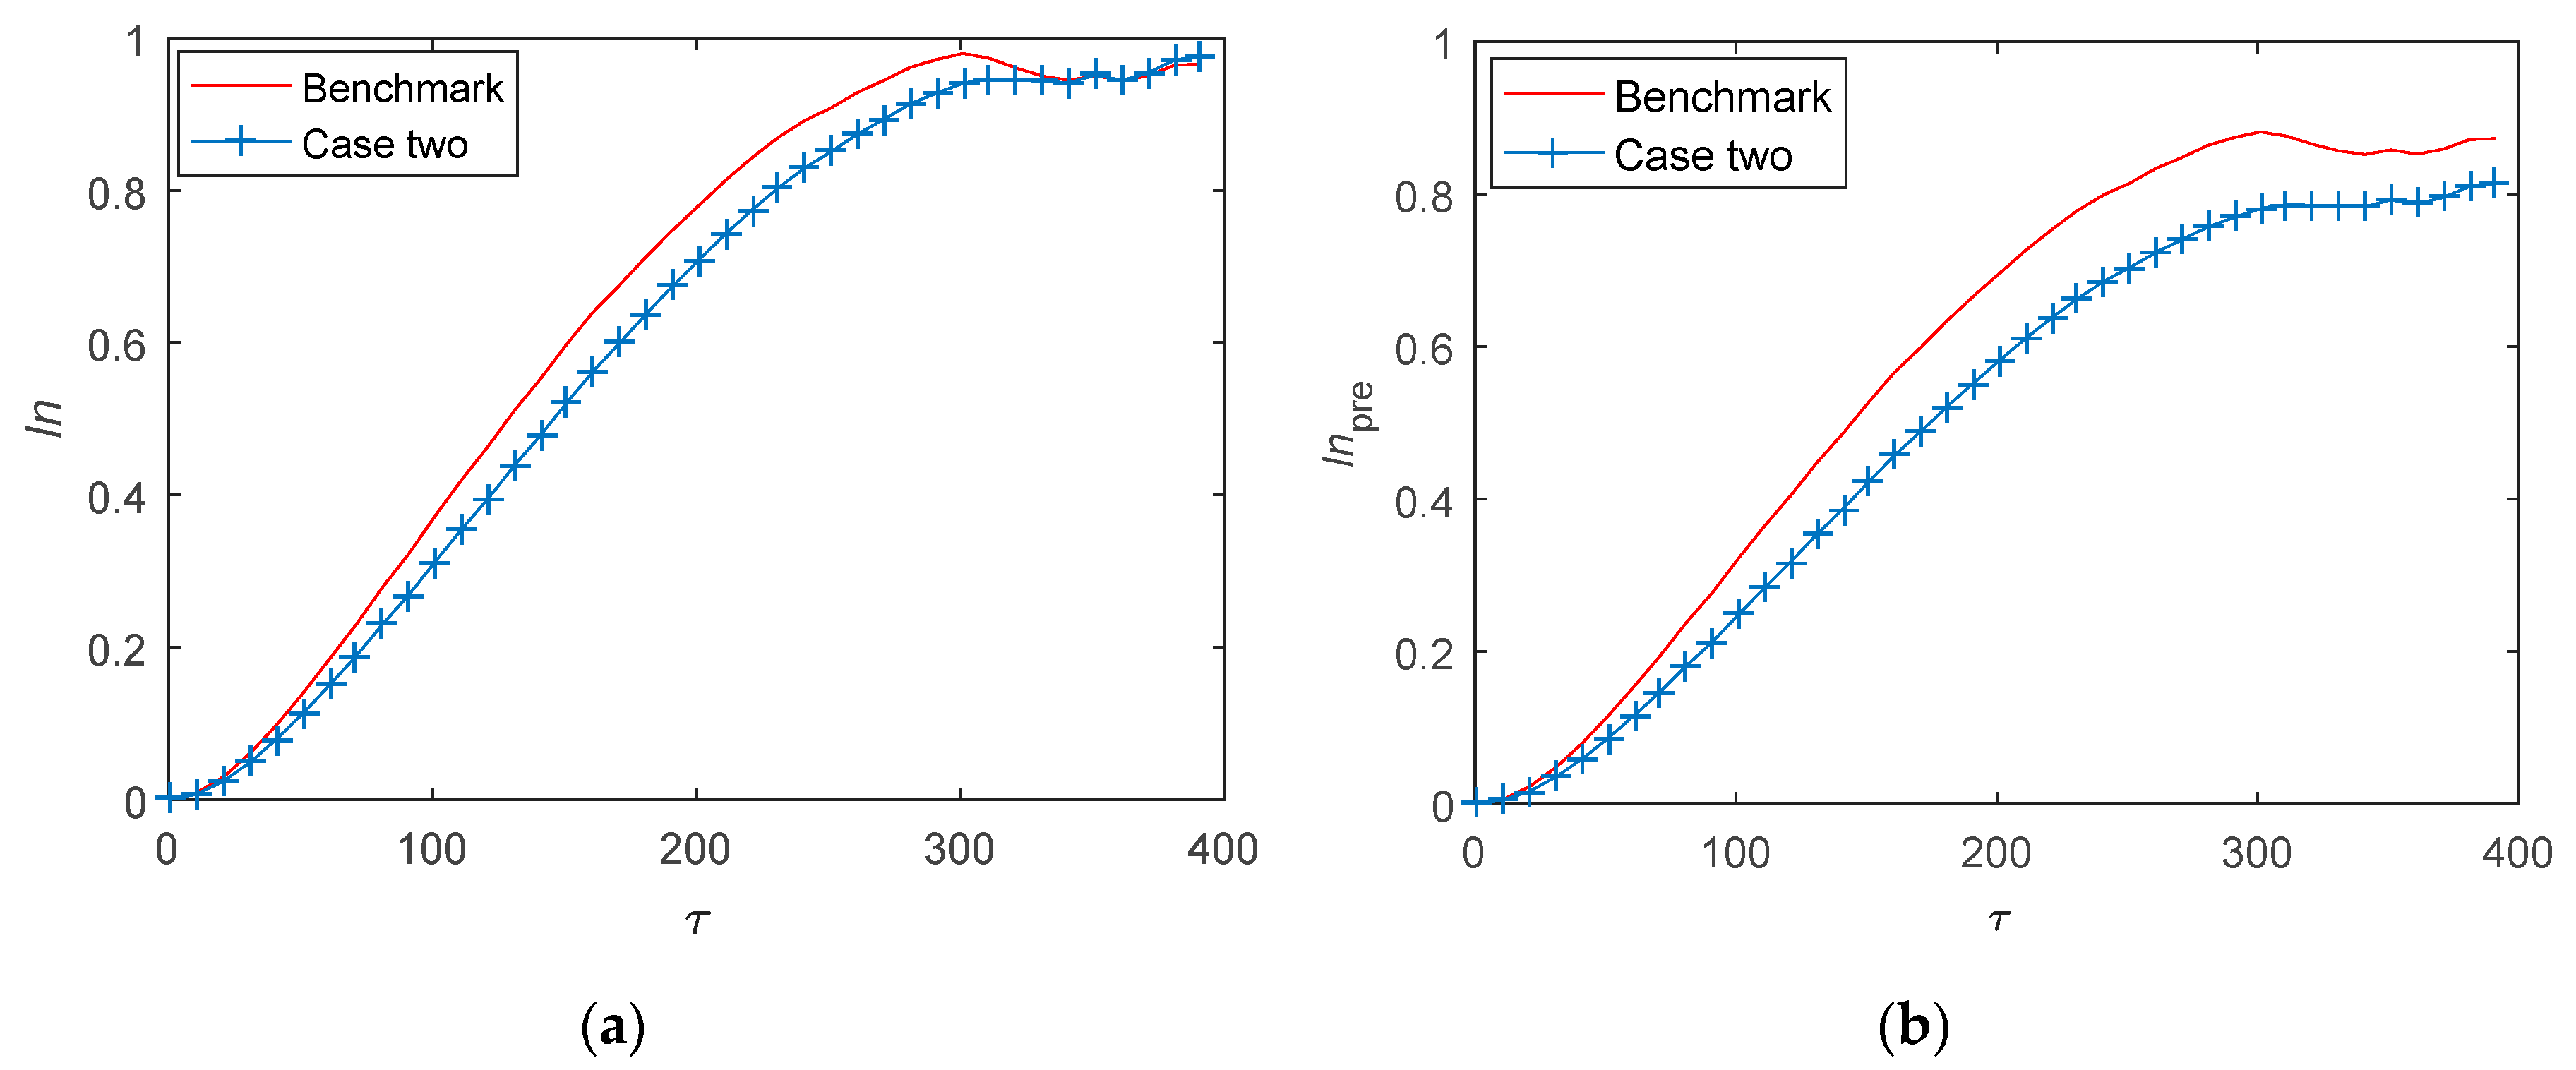
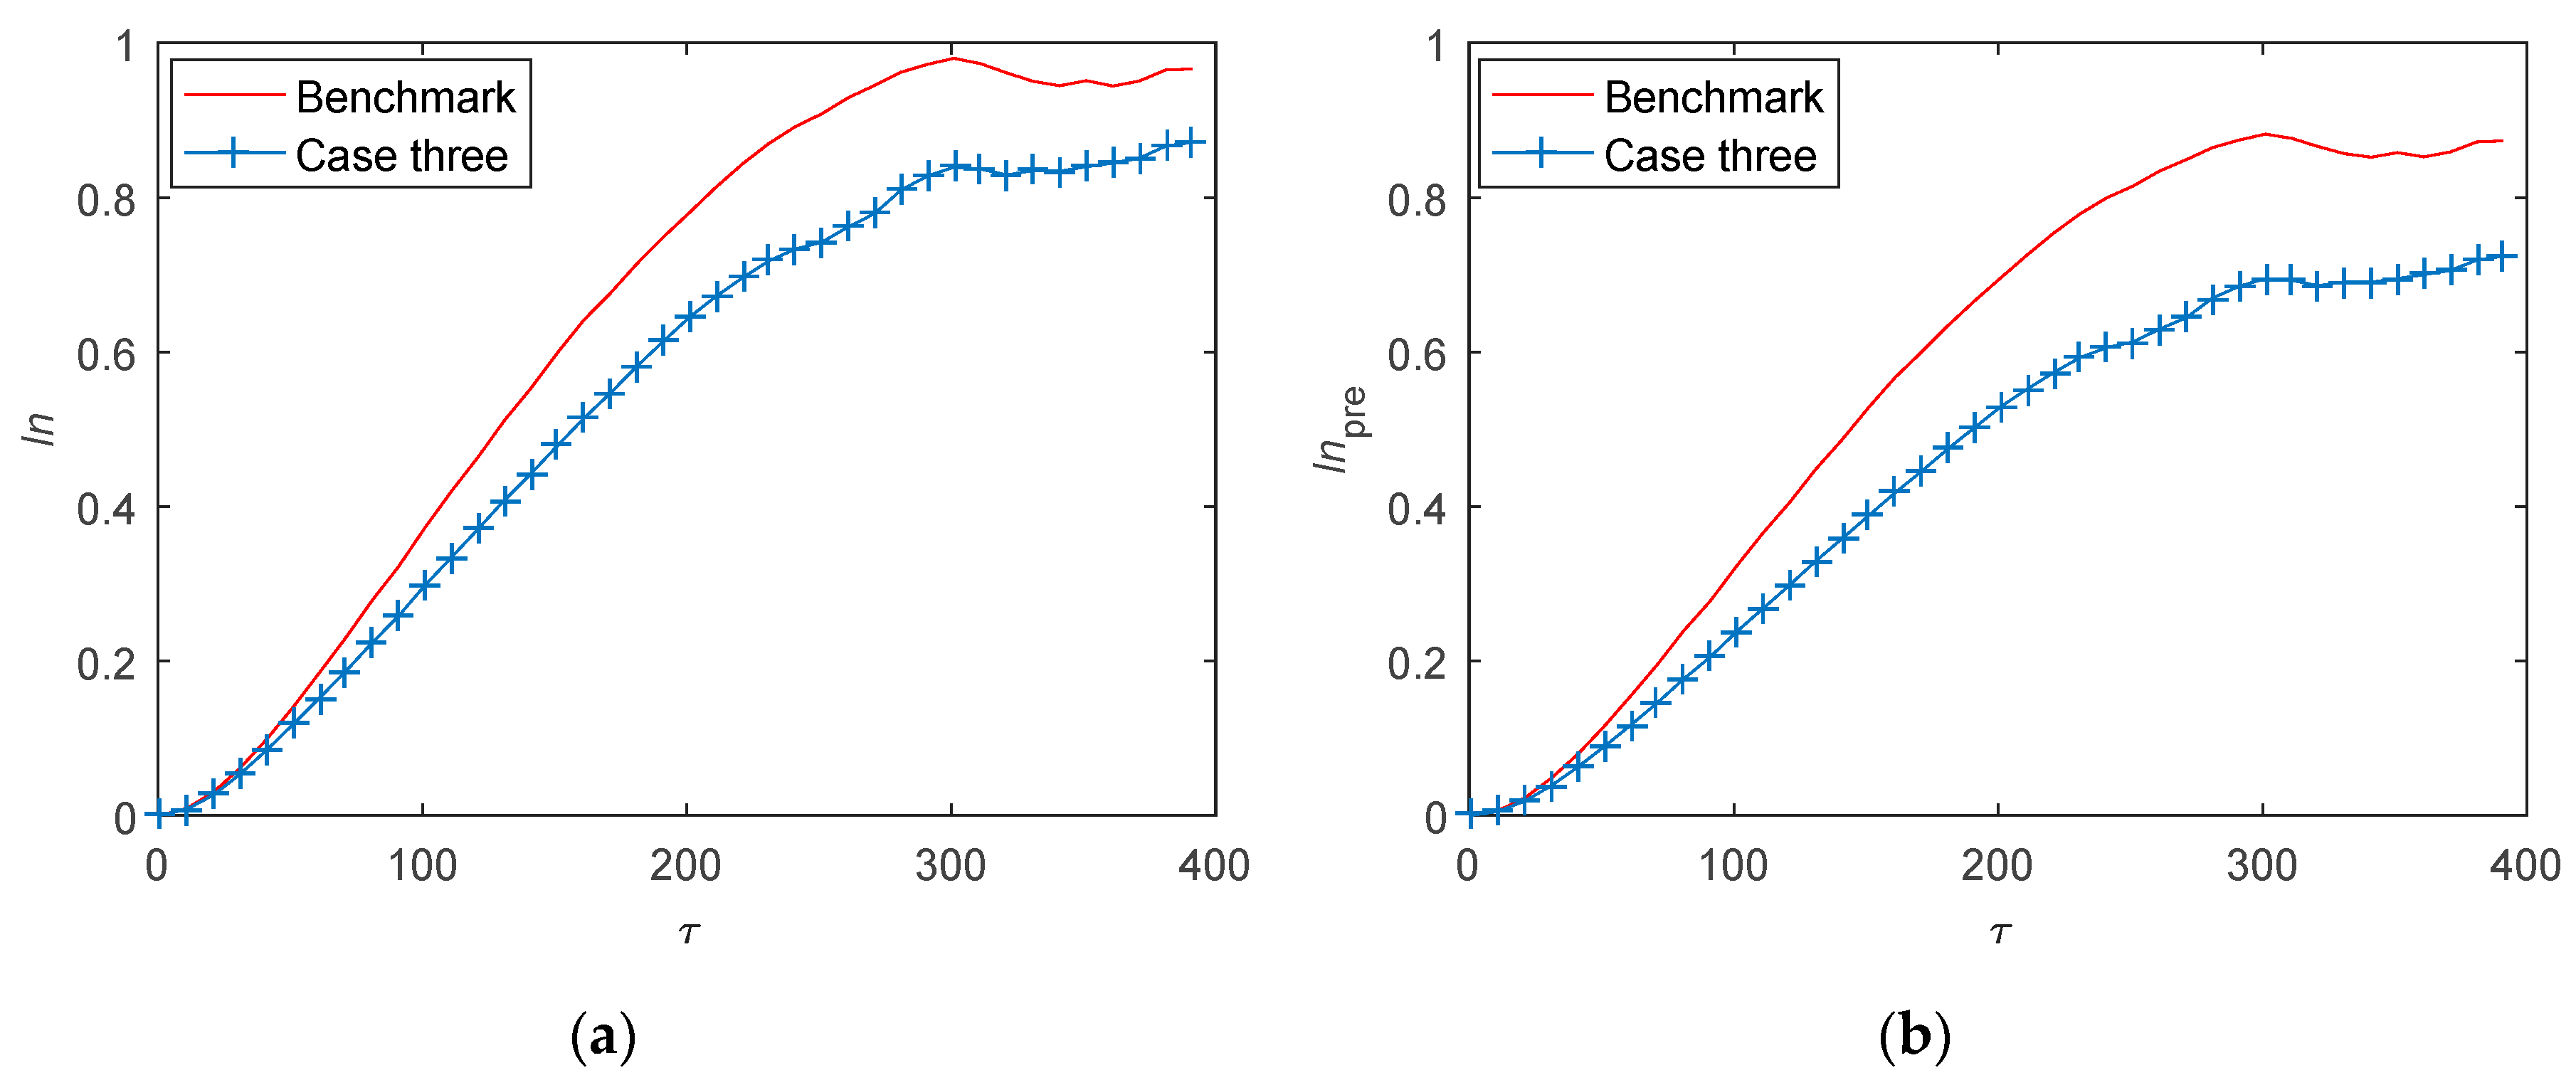
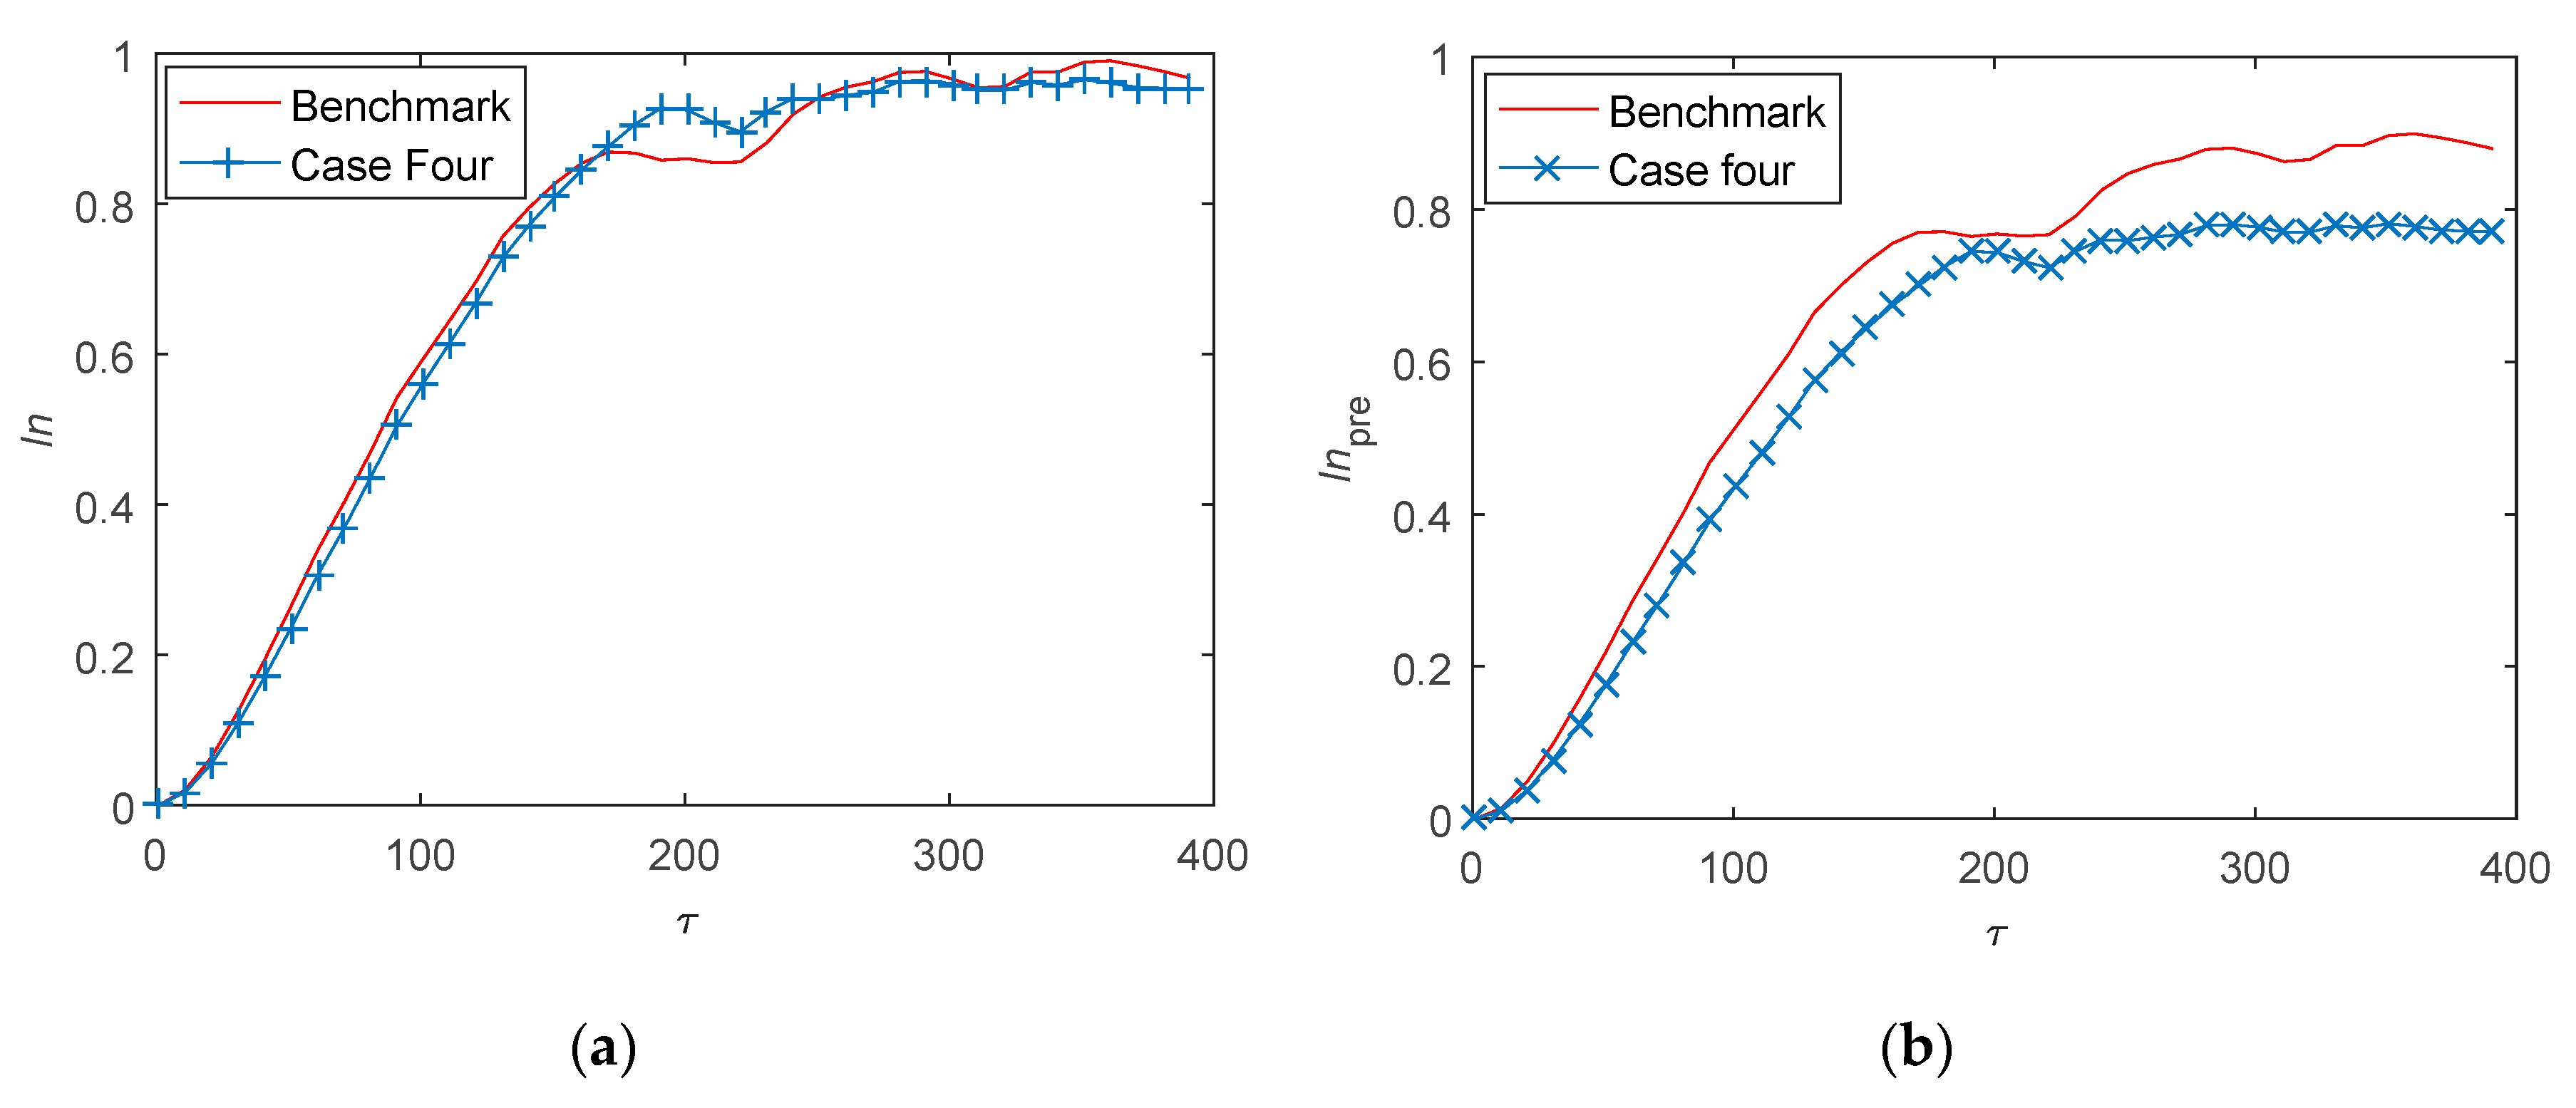
Within the CPM framework, the control performance index (CPI) is generally defined as a ratio of the actual and the benchmark performance [
3,
26,
28]. Thus, in order to compare the performance of
and
, two CPIs are constructed as:
where
and
are actual performance,
and
are benchmark performance.
and
are the ratios between actual performance and benchmark performance. When
and
are close to 1, the actual MPC performance is close to the benchmark performance. When
and
are greater than 1, the actual MPC performance is better than the benchmark performance. When
and
are less than 1, the actual MPC performance is degraded compared to the benchmark performance. The differences between these two CPIs and value 1 indicate the sensitivity of the two multi-step predictable indices to performance changes. For the same performance change, the greater the difference, the multi-step predictable index is more sensitivity to this performance change.
According to the above analysis, the predictable information extracted by the multi-step predictable index is based on the autocorrelation of monitored variables. Thus, the proposed CPA method does not depend on the data distribution characteristics of monitored variables and can be applied to the performance assessment where the data is non-Gaussian distribution.


