Energy Use Efficiency Past-to-Future Evaluation: An International Comparison


Abstract
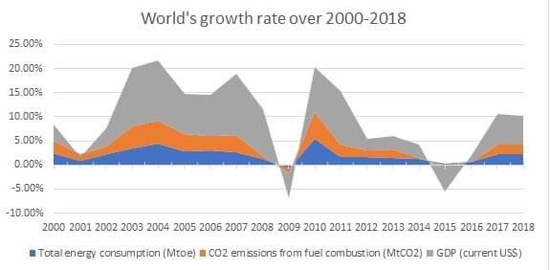
1. Introduction
2. Materials and Methods
2.1. Grey Model GM (1,1)
2.2. DEA Slack-Based Measure Model
3. Empirical Results
3.1. Data Collection
3.2. Energy Efficiency from 2008 to 2017
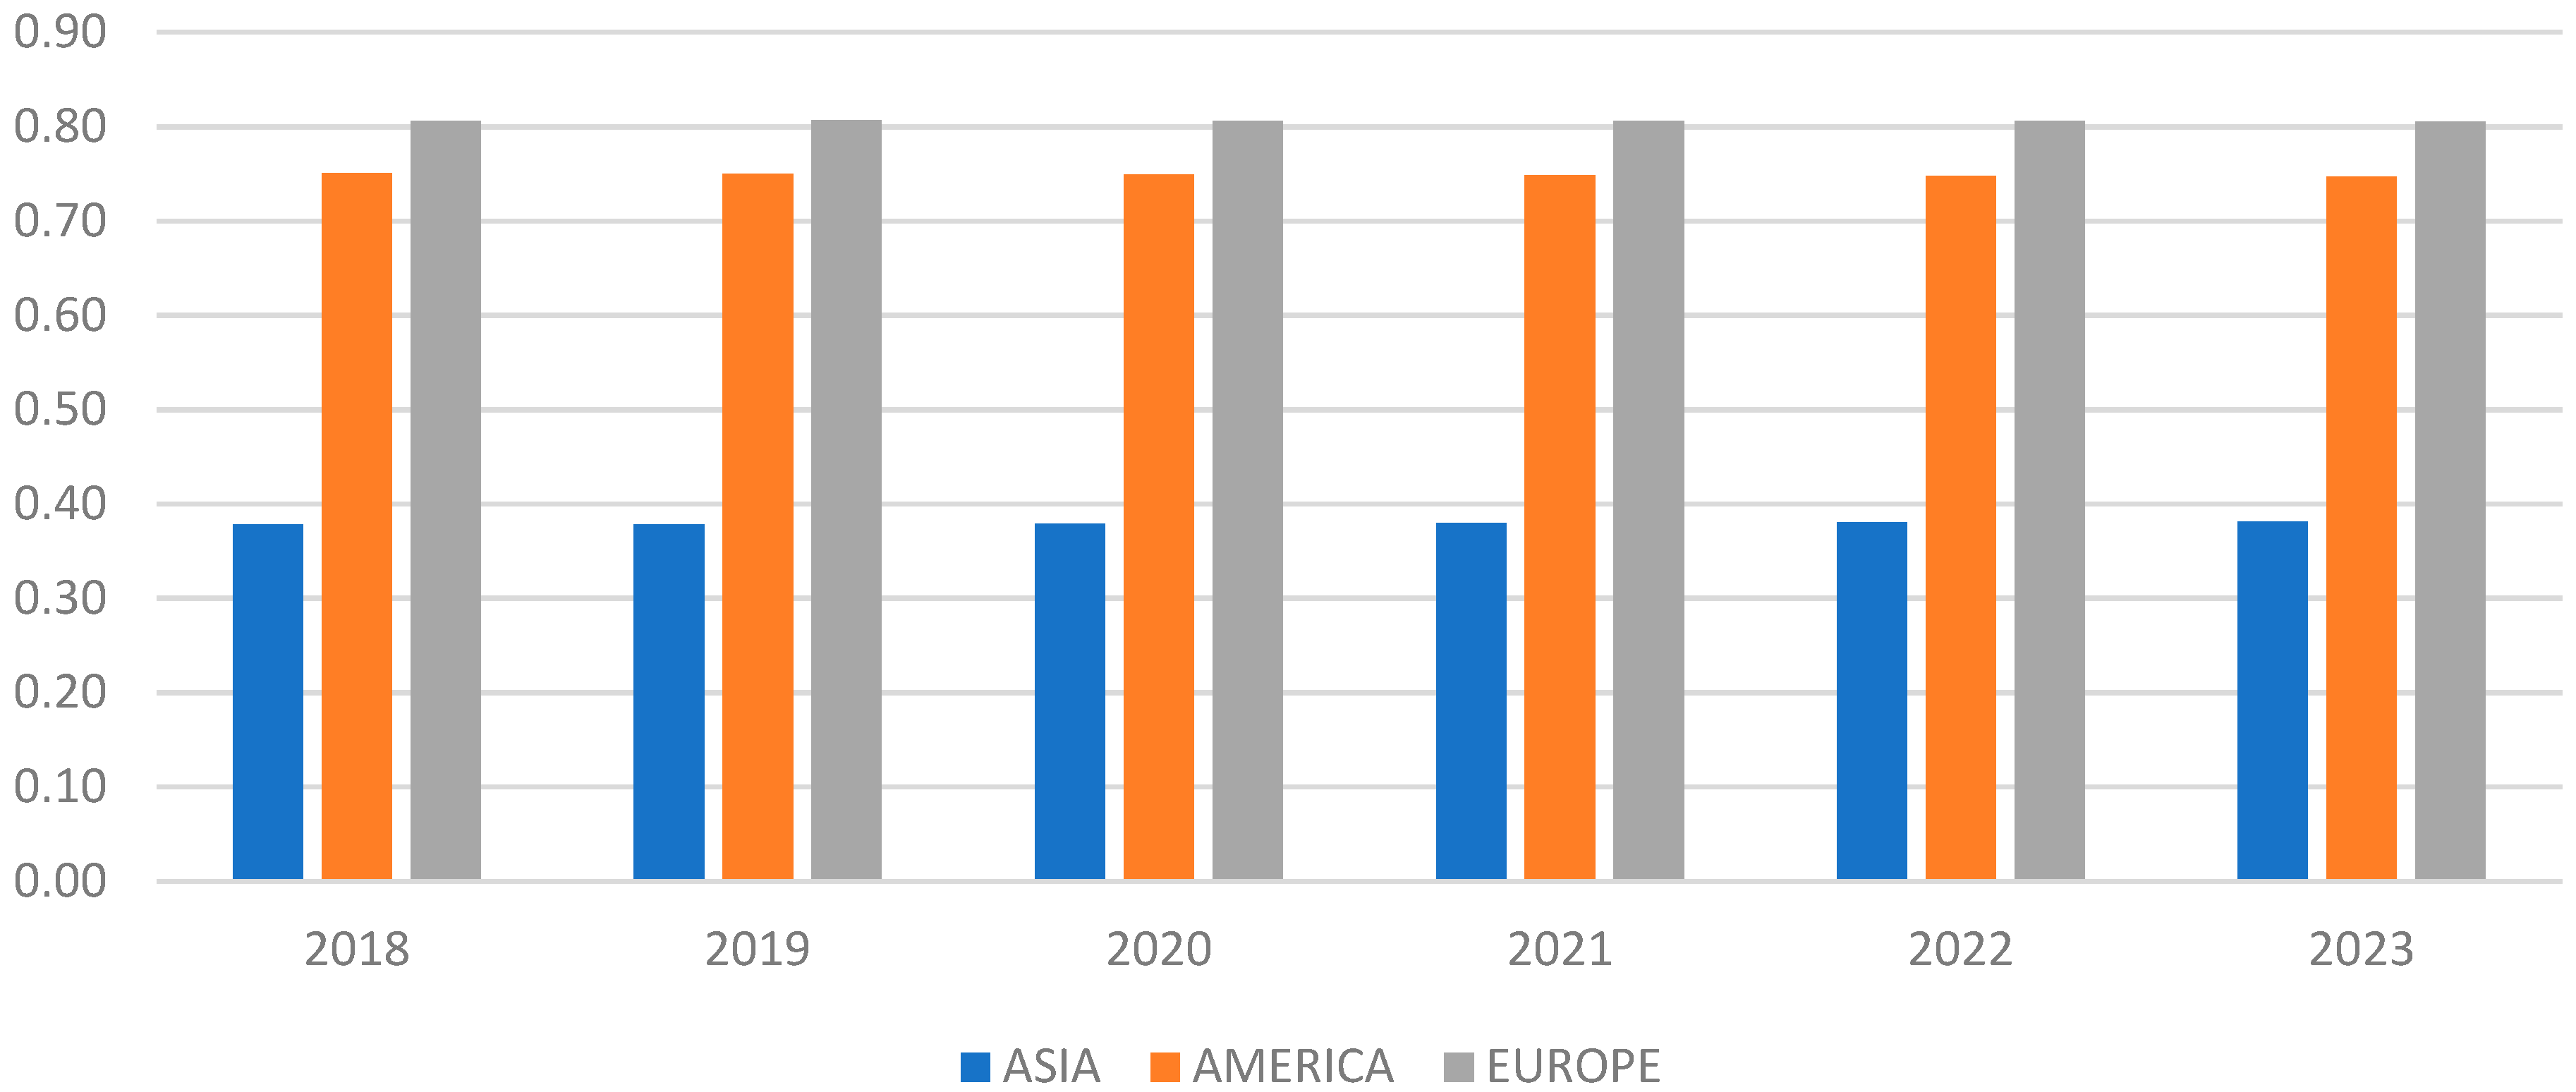
3.3. Forecasting Inputs and Output for 2018 to 2023
- -
- MAPE < 10% represents Excellent.
- -
- 10% < MAPE < 20% is Good.
- -
- 20% < MAPE < 50% is reasonable.
3.4. Energy Efficiency from 2008 to 2017
4. Discussions and Conclusions
Author Contributions
Funding
Acknowledgments
Conflicts of Interest
References
- Barney, F.; Franzi, P. The Future of Energy from Future Dilemmas: Options to 2050 for Australia’s Population, Technology, Resources and Environment; CSIRO Sustainable Ecosystems: Canberra, Australia, 2002; pp. 157–189.
- EPA. Sources of Greenhouse Gas Emissions. Available online: https://www.epa.gov/ghgemissions/sources-greenhouse-gas-emissions (accessed on 10 May 2019).
- IEA. Energy Efficiency 2018—Analysis and Outlook to 2040. Available online: https://www.iea.org/efficiency2018/ (accessed on 10 May 2019).
- Owusu, P.A.; Asumadu-Sarkodie, S. A review of renewable energy sources, sustainability issues and climate change mitigation. Cogent Eng. 2016, 3, 1167990. [Google Scholar] [CrossRef]
- Fawcett, T.; Killip, G. Re-thinking energy efficiency in European policy: Practitioners’ use of multiple benefits’ arguments. J. Clean. Prod. 2018. [Google Scholar] [CrossRef]
- Gomez-Calvet, R.G.; Conesa, D.; Gomez-Calvet, A.R.; Tortosa-Ausina, E. On the Dynamics of Environmental Performance in the European Union. Working Paper. 2014. Available online: https://ideas.repec.org/p/jau/wpaper/2014-20.html (accessed on 8 October 2019).
- Cornelis, E. History and prospect of voluntary agreements on industrial energy efficiency in Europe. Energy Policy 2019, 132, 5675–5682. [Google Scholar] [CrossRef]
- Hu, J.L.; Honma, S. A Comparative Study of Energy Efficiency of OECD Countries: An Application of the Stochastic Frontier Analysis. Energy Procedia 2014, 61, 2280–2283. [Google Scholar] [CrossRef][Green Version]
- Boroza, D. Technical and total factor energy efficiency of European regions: A two-stage approach. Energy 2018, 152, 5215–5232. [Google Scholar]
- Rosenow, J.; Bayer, E. Cost and benefits of Energy Efficiency Obligations: A review of European programmes. Energy Policy 2017, 107, 53–62. [Google Scholar] [CrossRef]
- Thonipara, A.; Runst, P.; Ochsner, C.; Bizer, K. Energy efficiency of residential buildings in Europe Union—An exploratory analysis of cross-country consumption patterns. Energy Policy 2019, 129, 1156–1167. [Google Scholar] [CrossRef]
- Marwwues, A.D.; Fuinhas, J.A.; Tomas, C. Energy efficiency and sustainable growth in industrial sectors in European Union countries: A nonlinear ARDL approach. J. Clean. Prod. 2019, 239, 118045. [Google Scholar]
- Makridou, G.; Andriosopoulos, K.; Doumpos, M.; Zopounidis, C. Measuring the efficiency of energy-intensive industries across European countries. Energy Policy 2016, 88, 5735–5783. [Google Scholar] [CrossRef]
- Gomez-Calvet, R.G.; Conesa, D.; Gomez-Calvet, A.R.; Tortosa-Ausina, E. Energy efficiency in the European Union: What can be learned from the joint application of directional distance functions and slacks-based measures? Appl. Energy 2014, 132, 137–154. [Google Scholar] [CrossRef]
- Cucchilla, F.; D’Adamo, I.; Gastaldi, M.; Miliacca, M. efficiency and allocation of emission allowances and energy consumption over more sustainable European economies. J. Clean. Prod. 2018, 182, 805–817. [Google Scholar] [CrossRef]
- Vieites, E.; Vassileva, I.; Arias, J.E. European Initiatives Towards Improving the Energy Efficiency in Existing and Historic Buildings. Energy Procedia 2015, 75, 1679–1685. [Google Scholar] [CrossRef]
- Yang, T.; Chen, W.; Zhou, K.; Ren, M. Regional energy efficiency evaluation in China: A super efficiency slack-based measure model with undesirable outputs. J. Clean. Prod. 2018, 198, 859–866. [Google Scholar] [CrossRef]
- Yu, J.; Zhou, K.; Yang, S. Regional heterogeneity of China’s energy efficiency in “new normal”: A meta-frontier Super-SBM analysis. Energy Policy 2019, 134, 110941. [Google Scholar] [CrossRef]
- Lin, B.; Zhang, G. Energy efficiency of Chinese service sector and its regional differences. J. Clean. Prod. 2017, 168, 614–625. [Google Scholar] [CrossRef]
- Feng, C.; Wang, M. Analysis of energy efficiency and energy savings potential in China’s provincial industrial sectors. J. Clean. Prod. 2017, 164, 15311–15541. [Google Scholar] [CrossRef]
- Yang, L.; Wang, K.L.; Geng, J.C. China’s regional ecological energy efficiency and energy saving and pollution abatement potentials: An empirical analysis using epsilon-based measure model. J. Clean. Prod. 2018, 194, 3003–3008. [Google Scholar] [CrossRef]
- Zhou, D.Q.; Meng, F.Y.; Bai, Y.; Cai, S.Q. Energy efficiency and congestion assessment with energy mix effect: The case of APEC countries. J. Clean. Prod. 2017, 142, 819–828. [Google Scholar] [CrossRef]
- Guo, X.; Lu, C.C.; Lee, J.H.; Chiu, Y.H. Applying the dynamic DEA model to evaluate the energy efficiency of OECD countries and China. Energy 2017, 134, 392–399. [Google Scholar] [CrossRef]
- Zhang, X.P.; Cheng, X.M.; Yuan, J.H.; Gao, X.J. Total-factor energy efficiency in developing countries. Energy Policy 2011, 39, 6446–6450. [Google Scholar] [CrossRef]
- Pang, Z.F.; Deng, Z.Q.; Hu, J.L. Clean energy use and total-factor efficiencies: An international comparison. Renew. Sustain. Energy Rev. 2015, 52, 1158–1171. [Google Scholar] [CrossRef]
- Wang, C.N.; Ho, T.H.X.; Hsueh, M.H. An Integrated Approach for Estimating the Energy Efficiency of Seventeen Countries. Energies 2017, 10, 1597. [Google Scholar] [CrossRef]
- Wang, L.W.; Le, K.D.; Nguyen, T.D. Assessment of the Energy Efficiency Improvement of Twenty-Five Countries: A DEA Approach. Energies 2019, 12, 1535. [Google Scholar] [CrossRef]
- Deng, J. Introduction to grey system theory. J. Grey Syst. 1989, 1, 12–14. [Google Scholar]
- Tone, K. A slacks-based measure of efficiency in data envelopment analysis. Eur. J. Oper. Res. 2001, 130, 498–509. [Google Scholar] [CrossRef]
- Tone, K. A slacks-based measure of super-efficiency in data envelopment analysis. Eur. J. Oper. Res. 2002, 143, 32–41. [Google Scholar] [CrossRef]
- Enerdata Yearbook. Available online: https://yearbook.enerdata.net (accessed on 5 April 2019).
- The World Bank. Available online: https://data.worldbank.org (accessed on 5 April 2019).
- Deng, J.L. Control problems of grey systems. Syst. Control Lett. 1982, 1, 288–294. [Google Scholar]


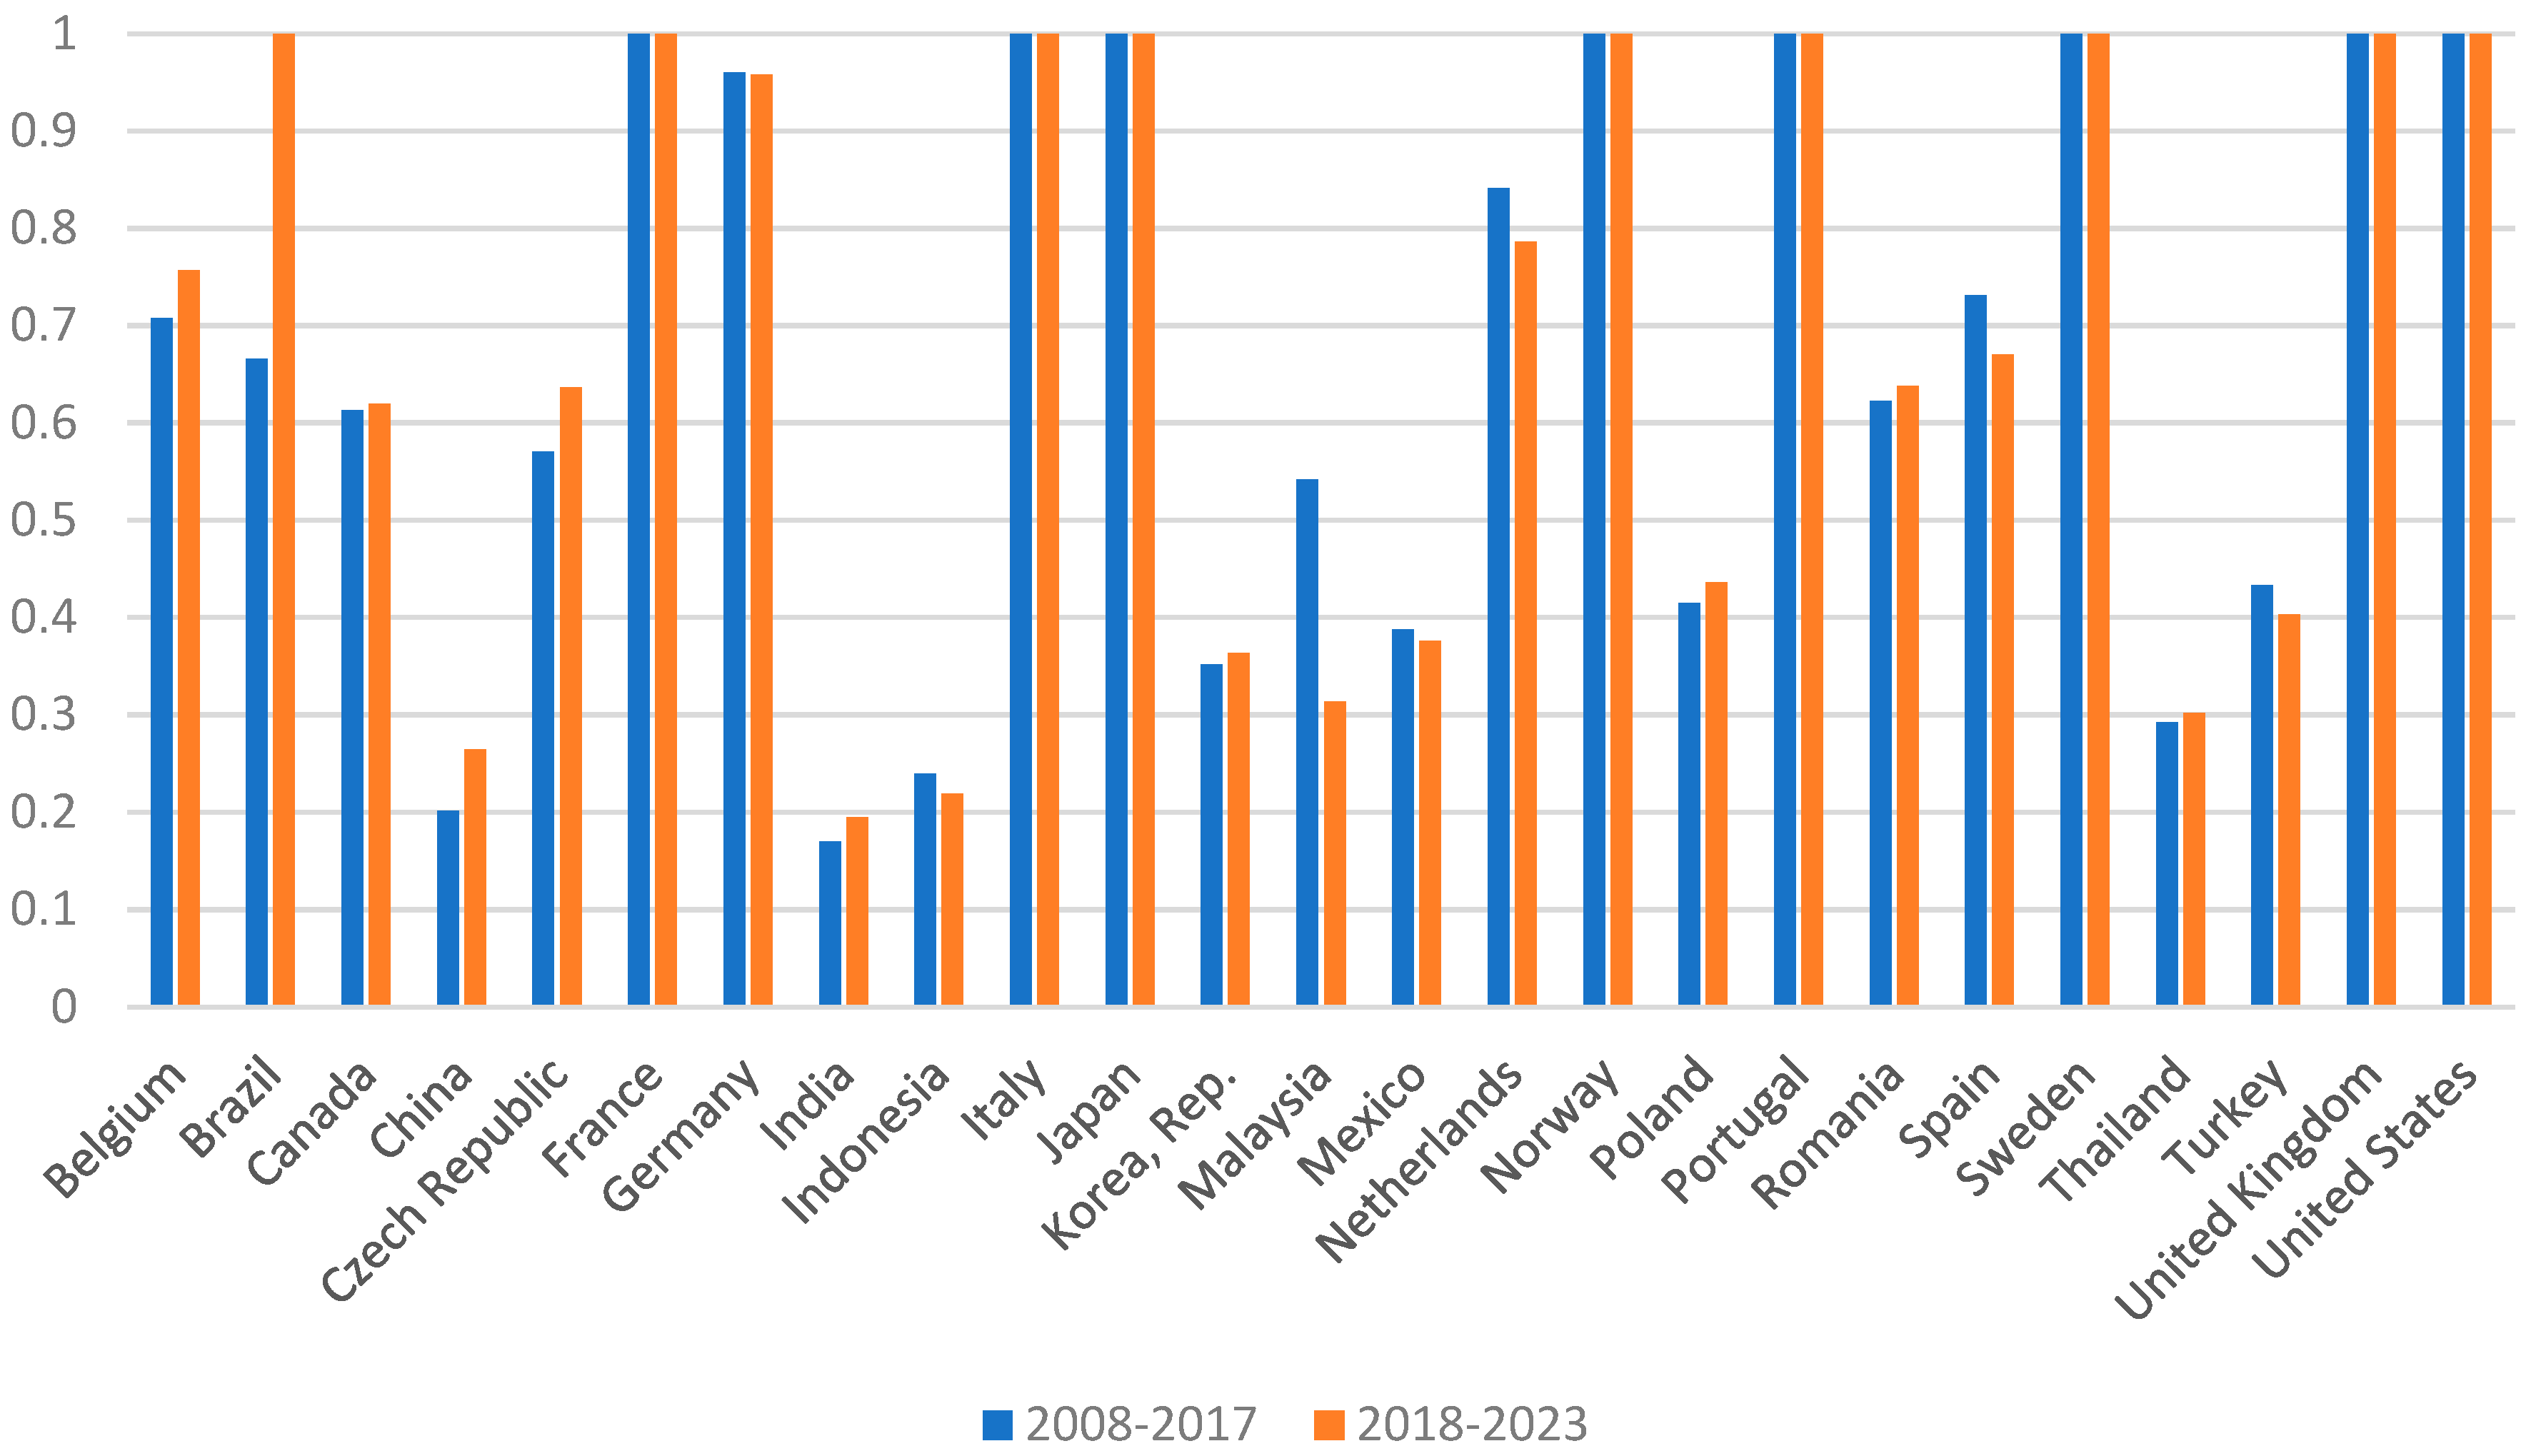
| Countries | 2008 | 2009 | 2010 | 2011 | 2012 | 2013 | 2014 | 2015 | 2016 | 2017 | Average |
|---|---|---|---|---|---|---|---|---|---|---|---|
| Belgium | 0.73 | 0.64 | 0.65 | 0.67 | 0.73 | 1.00 | 0.73 | 0.66 | 0.63 | 0.64 | 0.71 |
| Brazil | 0.66 | 0.64 | 0.64 | 0.57 | 0.56 | 0.54 | 0.51 | 0.53 | 1.00 | 1.00 | 0.67 |
| Canada | 0.62 | 0.61 | 0.62 | 0.60 | 0.60 | 0.60 | 0.61 | 0.63 | 0.63 | 0.61 | 0.61 |
| China | 0.20 | 0.18 | 0.19 | 0.18 | 0.19 | 0.20 | 0.21 | 0.22 | 0.22 | 0.23 | 0.20 |
| Czech Republic | 0.60 | 0.62 | 0.60 | 0.57 | 0.55 | 0.54 | 0.54 | 0.55 | 0.55 | 0.57 | 0.57 |
| France | 1.00 | 1.00 | 1.00 | 1.00 | 1.00 | 1.00 | 1.00 | 1.00 | 1.00 | 1.00 | 1.00 |
| Germany | 0.90 | 0.89 | 0.90 | 0.91 | 1.00 | 1.00 | 1.00 | 1.00 | 1.00 | 1.00 | 0.96 |
| India | 0.17 | 0.15 | 0.16 | 0.15 | 0.16 | 0.17 | 0.17 | 0.18 | 0.19 | 0.19 | 0.17 |
| Indonesia | 0.31 | 0.21 | 0.22 | 0.23 | 0.23 | 0.24 | 0.23 | 0.24 | 0.24 | 0.24 | 0.24 |
| Italy | 1.00 | 1.00 | 1.00 | 1.00 | 1.00 | 1.00 | 1.00 | 1.00 | 1.00 | 1.00 | 1.00 |
| Japan | 1.00 | 1.00 | 1.00 | 1.00 | 1.00 | 1.00 | 1.00 | 1.00 | 1.00 | 1.00 | 1.00 |
| Korea, Rep. | 0.35 | 0.35 | 0.36 | 0.34 | 0.35 | 0.36 | 0.36 | 0.36 | 0.35 | 0.33 | 0.35 |
| Malaysia | 1.00 | 1.00 | 1.00 | 0.38 | 0.34 | 0.33 | 0.33 | 0.34 | 0.34 | 0.35 | 0.54 |
| Mexico | 0.39 | 0.37 | 0.39 | 0.37 | 0.38 | 0.39 | 0.39 | 0.40 | 0.40 | 0.40 | 0.39 |
| Netherlands | 0.80 | 0.77 | 0.77 | 0.80 | 1.00 | 1.00 | 1.00 | 0.73 | 0.78 | 0.75 | 0.84 |
| Norway | 1.00 | 1.00 | 1.00 | 1.00 | 1.00 | 1.00 | 1.00 | 1.00 | 1.00 | 1.00 | 1.00 |
| Poland | 0.40 | 0.42 | 0.42 | 0.38 | 0.41 | 0.43 | 0.41 | 0.41 | 0.43 | 0.43 | 0.41 |
| Portugal | 1.00 | 1.00 | 1.00 | 1.00 | 1.00 | 1.00 | 1.00 | 1.00 | 1.00 | 1.00 | 1.00 |
| Romania | 0.52 | 1.00 | 1.00 | 0.51 | 0.49 | 0.51 | 0.52 | 0.54 | 0.55 | 0.57 | 0.62 |
| Spain | 0.71 | 0.73 | 0.75 | 0.73 | 0.75 | 0.78 | 0.75 | 0.72 | 0.72 | 0.69 | 0.73 |
| Sweden | 1.00 | 1.00 | 1.00 | 1.00 | 1.00 | 1.00 | 1.00 | 1.00 | 1.00 | 1.00 | 1.00 |
| Thailand | 0.30 | 0.34 | 0.34 | 0.27 | 0.25 | 0.25 | 0.27 | 0.28 | 0.31 | 0.30 | 0.29 |
| Turkey | 0.43 | 0.43 | 0.45 | 0.41 | 0.44 | 0.46 | 0.44 | 0.44 | 0.42 | 0.41 | 0.43 |
| United Kingdom | 1.00 | 1.00 | 1.00 | 1.00 | 1.00 | 1.00 | 1.00 | 1.00 | 1.00 | 1.00 | 1.00 |
| United States | 1.00 | 1.00 | 1.00 | 1.00 | 1.00 | 1.00 | 1.00 | 1.00 | 1.00 | 1.00 | 1.00 |
| Average | 0.68 | 0.69 | 0.70 | 0.64 | 0.66 | 0.67 | 0.66 | 0.65 | 0.67 | 0.67 | 0.67 |
| Countries | Labor Force | Gross Capital Formation | Energy Consumption | GDP | CO2 Emissions | Average |
|---|---|---|---|---|---|---|
| Belgium | 5.2% | 0.3% | 3.1% | 0.7% | 2.5% | 2.4% |
| Brazil | 3.1% | 0.4% | 8.2% | 3.4% | 5.5% | 4.1% |
| Canada | 3.7% | 0.1% | 4.7% | 0.8% | 7.8% | 3.4% |
| China | 3.4% | 0.1% | 4.0% | 1.4% | 3.6% | 2.5% |
| Czech Republic | 1.6% | 0.3% | 5.5% | 2.0% | 2.4% | 2.4% |
| France | 1.0% | 0.2% | 2.8% | 0.7% | 2.4% | 1.4% |
| Germany | 1.7% | 0.2% | 3.7% | 1.1% | 1.8% | 1.7% |
| India | 1.0% | 0.8% | 3.9% | 0.8% | 1.5% | 1.6% |
| Indonesia | 1.5% | 0.5% | 6.4% | 0.5% | 5.1% | 2.8% |
| Italy | 2.2% | 0.5% | 5.9% | 1.5% | 2.6% | 2.5% |
| Japan | 1.5% | 0.6% | 3.3% | 0.9% | 3.0% | 1.9% |
| Korea, Rep. | 2.8% | 0.4% | 4.0% | 0.6% | 2.8% | 2.1% |
| Malaysia | 1.5% | 1.0% | 3.7% | 0.9% | 2.3% | 1.9% |
| Mexico | 1.8% | 0.4% | 2.6% | 1.1% | 1.8% | 1.5% |
| Netherlands | 3.8% | 0.4% | 6.4% | 1.3% | 2.0% | 2.8% |
| Norway | 2.1% | 0.5% | 3.3% | 0.7% | 2.3% | 1.8% |
| Poland | 2.7% | 0.4% | 3.8% | 0.7% | 1.9% | 1.9% |
| Portugal | 3.2% | 0.5% | 8.8% | 2.0% | 4.8% | 3.9% |
| Romania | 1.6% | 0.5% | 6.2% | 3.4% | 4.8% | 3.3% |
| Spain | 2.3% | 0.7% | 8.2% | 2.5% | 3.8% | 3.5% |
| Sweden | 2.6% | 0.2% | 4.5% | 1.5% | 3.1% | 2.4% |
| Thailand | 2.4% | 0.8% | 6.7% | 1.1% | 1.7% | 2.5% |
| Turkey | 2.5% | 0.3% | 5.1% | 2.0% | 3.3% | 2.6% |
| United Kingdom | 1.5% | 0.1% | 4.3% | 1.2% | 2.8% | 2.0% |
| United States | 1.1% | 0.4% | 3.6% | 0.9% | 1.3% | 1.5% |
| Average | 2.3% | 0.4% | 4.9% | 1.3% | 3.1% | 2.4% |
| Countries | 2018 | 2019 | 2020 | 2021 | 2022 | 2023 | Average |
|---|---|---|---|---|---|---|---|
| Belgium | 0.77 | 0.77 | 0.76 | 0.75 | 0.75 | 0.74 | 0.76 |
| Brazil | 1.00 | 1.00 | 1.00 | 1.00 | 1.00 | 1.00 | 1.00 |
| Canada | 0.62 | 0.62 | 0.62 | 0.62 | 0.62 | 0.62 | 0.62 |
| China | 0.25 | 0.25 | 0.26 | 0.27 | 0.27 | 0.28 | 0.26 |
| Czech Republic | 0.62 | 0.63 | 0.63 | 0.64 | 0.64 | 0.65 | 0.64 |
| France | 1.00 | 1.00 | 1.00 | 1.00 | 1.00 | 1.00 | 1.00 |
| Germany | 0.97 | 0.97 | 0.96 | 0.96 | 0.95 | 0.94 | 0.96 |
| India | 0.18 | 0.19 | 0.19 | 0.20 | 0.20 | 0.21 | 0.19 |
| Indonesia | 0.23 | 0.22 | 0.22 | 0.22 | 0.21 | 0.21 | 0.22 |
| Italy | 1.00 | 1.00 | 1.00 | 1.00 | 1.00 | 1.00 | 1.00 |
| Japan | 1.00 | 1.00 | 1.00 | 1.00 | 1.00 | 1.00 | 1.00 |
| Korea, Rep. | 0.36 | 0.36 | 0.36 | 0.36 | 0.37 | 0.37 | 0.36 |
| Malaysia | 0.33 | 0.32 | 0.32 | 0.31 | 0.30 | 0.30 | 0.31 |
| Mexico | 0.38 | 0.38 | 0.38 | 0.37 | 0.37 | 0.37 | 0.38 |
| Netherlands | 0.79 | 0.79 | 0.79 | 0.79 | 0.79 | 0.79 | 0.79 |
| Norway | 1.00 | 1.00 | 1.00 | 1.00 | 1.00 | 1.00 | 1.00 |
| Poland | 0.43 | 0.43 | 0.44 | 0.44 | 0.44 | 0.44 | 0.44 |
| Portugal | 1.00 | 1.00 | 1.00 | 1.00 | 1.00 | 1.00 | 1.00 |
| Romania | 0.61 | 0.62 | 0.63 | 0.64 | 0.65 | 0.66 | 0.64 |
| Spain | 0.68 | 0.68 | 0.67 | 0.67 | 0.66 | 0.66 | 0.67 |
| Sweden | 1.00 | 1.00 | 1.00 | 1.00 | 1.00 | 1.00 | 1.00 |
| Thailand | 0.30 | 0.30 | 0.30 | 0.30 | 0.30 | 0.30 | 0.30 |
| Turkey | 0.41 | 0.41 | 0.40 | 0.40 | 0.40 | 0.40 | 0.40 |
| United Kingdom | 1.00 | 1.00 | 1.00 | 1.00 | 1.00 | 1.00 | 1.00 |
| United States | 1.00 | 1.00 | 1.00 | 1.00 | 1.00 | 1.00 | 1.00 |
| Average | 0.68 | 0.68 | 0.68 | 0.68 | 0.68 | 0.68 | 0.68 |
© 2019 by the authors. Licensee MDPI, Basel, Switzerland. This article is an open access article distributed under the terms and conditions of the Creative Commons Attribution (CC BY) license (http://creativecommons.org/licenses/by/4.0/).
Share and Cite
Wang, C.-N.; Nguyen, T.-D.; Yu, M.-C. Energy Use Efficiency Past-to-Future Evaluation: An International Comparison. Energies 2019, 12, 3804. https://doi.org/10.3390/en12193804
Wang C-N, Nguyen T-D, Yu M-C. Energy Use Efficiency Past-to-Future Evaluation: An International Comparison. Energies. 2019; 12(19):3804. https://doi.org/10.3390/en12193804
Chicago/Turabian StyleWang, Chia-Nan, Thi-Duong Nguyen, and Min-Chun Yu. 2019. "Energy Use Efficiency Past-to-Future Evaluation: An International Comparison" Energies 12, no. 19: 3804. https://doi.org/10.3390/en12193804
APA StyleWang, C.-N., Nguyen, T.-D., & Yu, M.-C. (2019). Energy Use Efficiency Past-to-Future Evaluation: An International Comparison. Energies, 12(19), 3804. https://doi.org/10.3390/en12193804