Article

Explosion Characteristics and Flame Propagation Behavior of Mixed Dust Cloud of Coal Dust and Oil Shale Dust

1
College of Mining and Safety Engineering, Shandong University of Science and Technology, Qingdao 266590, China
2
Key Laboratory of Ministry of Education for Mine Disaster Prevention and Control, Shandong University of Science and Technology, Qingdao 266590, China
3
College of Transportation, Shandong University of Science and Technology, Qingdao 266590, China
*
Author to whom correspondence should be addressed.
Energies 2019, 12(20), 3807; https://doi.org/10.3390/en12203807
Submission received: 4 September 2019 / Revised: 28 September 2019 / Accepted: 6 October 2019 / Published: 9 October 2019

Abstract

:
Coal and oil shale are often mined and utilized together, and mixed dust is easily formed in these processes. In order to ensure safe production in these processes, the explosion characteristics of mixed dust were studied. Using a Godbert-Greenwold (G-G) Furnace experimental device, Hartmann tube experimental device, and 20 L explosion vessel, the oil shale and coal mixed dust ignition sensitivity experiment, flame propagation experiment, and explosion characteristics experiment were carried out. The minimum ignition temperature (MIT), minimum ignition energy (MIE), maximum explosion pressure (Pmax), maximum rate of pressure rise ((dp/dt)max), and explosibility index (KSt) parameters and the flame propagation behavior of the mixed dust were analyzed in detail. A scanning electron microscope (SEM) analysis of the coal and oil shale dust before and after the explosion was carried out to study the changes in the microscopic morphology of the dust particles. The results show that due to the oil shale having a high volatile content and low moisture content, in the mixture, the greater the percentage of oil shale, the more likely the dust cloud is to be ignited and the faster the explosion flame is propagated; the greater the percentage of oil shale, the greater the (dP/dt)max and KSt will be and, under a high dust concentration, a greater Pmax will be produced. During explosion, coal dust will experience particle pyrolysis and the gas phase combustion of the volatile matter, followed by solid phase combustion of coal char, whereas oil shale dust will only experience particle pyrolysis and the gas phase combustion of the volatile matter.

Graphical Abstract

1. Introduction

Coal is an important fossil energy. Coal and oil shale are associated with mineralization in many regions of the world, both of which are exploited together [1]. Coal and oil shale are often fired together to generate power and, to improve oil recovery, they are also co-pyrolyzed to produce oil [2,3]. Both coal and oil shale dust have a large risk of explosion. On 27 November 2005, a large coal dust explosion occurred in the Dongfeng Coal Mine in Qitaihe, China, causing 171 deaths and 48 injuries. National Institute for Occupational Safety and Health (NIOSH) previously reported the risk of oil shale dust explosion. In the process of co-exploitation, transportation, storage, processing, and utilization of coal and oil shale, an explosive environment where coal powder and oil shale dust mix will be formed. Once a source of ignition is encountered, a mixed dust explosion can occur [4,5]. To ensure the safe utilization of coal and oil shale energy in a co-existence environment, it is of great significance to carry out explosion research on mixed dust explosion.
The investigation of dust explosion risk has long been centered round the ignition, flame propagation property, and explosibility of the dust cloud. Minimum ignition temperature (MIT), minimum ignition energy (MIE), flame propagation velocity (VF), maximum explosion pressure (Pmax), maximum rate of pressure rise ((dP/dt)max), and explosibility index (KSt), as essential measuring indicators providing a powerful basis for preventing and controlling dust explosion [6,7], have contributed greatly to research on coal dust explosion risk. Using a 20 L explosion vessel, Cashdollar [8] discussed dust explosibility and measured the minimum explosion concentration (MEC) and limit oxygen concentration (LOC) of coal dust. Li et al. [9,10] evaluated the explosion severity of six different ranks of coal dust with respect to Pmax, (dP/dt)max and compared the explosion severity of dust with different particle sizes and particle size dispersities. Cao et al. [11,12] observed the flame propagation of coal dust in a semi-closed glass tube. Mishra et al. [13] analyzed the MIT of coal dust for different particle sizes and concentrations. Comparatively, little has been reported on the dust explosion risk of oil shale, except for a few studies. Hamdan et al. [14,15] tested the MIT, MEC, and LOC of oil shale dust with a Godbert-Greenwold Furnace and a Hartmann tube. Sweis et al. [16] used a Hartmann tube to examine the MEC of oil shale dust and their mixture with inert dust. Interest in the explosion risk of coal dust or oil shale mixtures has mostly been concentrated on the explosion potential of coal or oil shale mixture with combustible gases. Bai [17], Ajrash [18], and Kundu [19] used a large tubular apparatus to observe the flame propagation of CH4/coal mixtures. Li [20] and Song [21] investigated the explosibility of CH4/coal mixtures and discovered that addition of CH4 can greatly intensify dust explosion. Yu et al. [22] explored the ignition of mixtures of oil shale dust and synthetic gases (CH4, H2, or CO) and revealed that the synthesis of gas and the oil shale dust mixture is easier to ignite.
Our previous efforts have involved a preliminary study on the oil shale dust explosion [23], yet no research reports regarding the explosion of coal–oil shale mixed dust and findings are available so far are not sufficient to get a good understanding of the explosion risk of oil shale–coal mixed dust. In view of this, we tested the ignition sensitivity parameters—MIT and MIE—and flame propagation and explosibility parameters—Pmax, (dP/dt)max, and KSt—of paragenetic coal and oil shale samples. We also examined the explosion mechanisms by observing the particle microstructures before and after explosion. Our research results can provide useful support for preventing the explosion of coal–oil shale mixed dust.

2. Experiment

2.1. Sample Preparation

The oil shale and coal we studied were from the oil shale-coal co-mining face of Longkou Liangjia Mine, China, which is a typical oil shale-coal paragenetic coal mine. The coal of this mine is long flame coal. As designed, the oil shale and coal samples were separately crushed. To prevent the potential impact of particle size distribution on the experimental results, the crushed dust was passed through a 200-mesh standard wire sieve (convenient to compare with standard data). Using Mastersizer 2000 laser particle size analyzer, we measured the particle size distribution (PSD) of the dust samples after sieving (using water as a dispersant). The results are shown in Figure 1. The particle size dispersity (σD) was calculated using Equation (1) [24]. From these diagrams, the two dust samples shared roughly the same D50 and σD, which eliminates the potential impact of particle size difference on the experimental results. Dust samples were dried for 2 h in a dryer under 50 °C to remove the moisture in them. The dried oil shale dust and coal dust were then mixed up and prepared into three mixtures with oil shale dust mass ratios of 25%, 50%, and 75% (25 wt% oil shale, 50 wt% oil shale and 75 wt% oil shale), respectively.
σ D = ( D 90 D 10 ) / D 50 .
Proximate analysis of dust samples is listed in Table 1. Compared with coal, oil shale has a high percentage of ash, since oil shale is hosted in sedimentary rock and contains large amounts of minerals. Oil shale has a high percentage of volatile matters and a low percentage of fixed carbon. This means that the organic matter in it is predominantly light volatile matter.
The thermal decomposition behavior of the dust samples was analyzed under a thermogravimetric analyzer. The experiment was performed by increasing the temperature from room temperature to 800 °C at 10 °C/min intervals. Figure 2 shows the thermogravimetric (TG) and derivative thermogravimetric (DTG) curves of the samples. In the low-temperature interval below 150 °C, both samples displayed a marginal decline in their TG curve. This is mainly attributable to moisture loss in the samples. The greater decline of the TG curve of the coal dust sample precisely agrees with its high moisture content. As temperature continued to rise (<300 °C), the TG curves of both samples began to flatten and almost no weight loss took place. In the high-temperature interval of up to 300 °C, the volatile matter in both samples began to pyrolyze—their TG curves both showed a remarkable decline. As temperature rose, the thermal decomposition of volatile matter quickened and the weight loss rate increased too. As temperature further rose, the fixed carbon in the samples also began to burn. The corresponding DTG curve also displayed a relatively strong spike. As coal contains much more fixed carbon than oil shale does, the peak of the coal’s DTG curve was very high too. When all the organic matter in the samples was burned, no weight loss occurred anymore. The remaining residues in the coal and shale samples were 5% and 40%, concurring with the ash content measurements by industrial analysis.

2.2. Ignition Sensitivity Test and Flame Propagation Experiment

The MIT of the oil shale–coal dust mixtures was tested in a G-G furnace, using the MIT test procedure for combustible dust cloud recommended by GB/T 16429-1996 and ASTM E1491-2006. The test apparatus (Figure 3) included a heating furnace, a dust storage chamber, a solenoid valve, an air storage chamber (0.5 L), a high-pressure gas cylinder, and an ignition temperature controller (with a temperature range from room temperature to 1000 ℃). During the experiment, a certain quality of dust was put into the dust chamber and the temperature set. When the furnace temperature reached the set temperature, the air storage chamber was pressurized to a certain pressure. Then, the solenoid valve was started. The dust cloud from the lower end of the furnace was observed to see whether it was ignited. According to the observation result, the mass of the dust sample and the dust spraying pressure were changed until no ignition had occurred over 10 repeated tests, and the MIT of the dust was determined.
The MIE of the dust mixtures was tested in a Hartmann tube, using the MIE test procedure for combustible dust cloud recommended by GB/T 16428-1996. This test system was the same as that used in our previous study [23]. The quartz glass tube had a diameter of 70 mm and a length of 300 mm. During the experiment, the dust was placed in the bottom of the glass tube and the pressure of air storage chamber was set as 0.2 MPa (gauge pressure). Then, the required ignition energy was set. Finally, the solenoid valve was started, and the dust was observed to determine if it ignited. The dust quality was changed according to whether the dust was ignited until no ignition had occurred over 20 repeated tests. To examine the flame propagation of the dust mixtures in the Hartmann tube, a high-speed camera (framing rate, 1000 fps) was used to record the flame propagation in the tube at a coal dust sample mass of 1 g and ignition energy of 10 J.

2.3. Explosibility Test

An explosibility experiment was conducted on the dust mixtures in a 20 L explosion vessel. This test system was the same as that used in our previous study [23]. The experiment was conducted in accordance with ASTM E1226 and GB/T 16426-1996. The pyrotechnic ignitor was made up of 40% zirconium, 30% barium nitrate, and 30% barium peroxide. The three powders were uniformly mixed in proportion, and then wrapped in a thin paper sheet on a 1 A electric fuse head to form a pyrotechnic ignitor. To prevent overdrive in testing, the experiment used a pyrotechnic ignitor with 5 kJ energy [25]. During the experiment, first, the pyrotechnic ignitor was connected to the ignition electrode, and then a certain quality of dust sample was added. The explosion tank was vacuumed to −0.06 MPa, and the dust injection pressure was 2 MPa (gauge pressure). Next, the computer was used to start the pressure recorder and open the solenoid valve. The dust sample was diffused into the 20 L explosion vessel by the dust diffusion system using high-pressure air, and then the computer collected pressure data (gauge pressure).

3. Results and Discussion

3.1. Ignition Sensitivity and Flame Propagation of Dust Cloud

Coal and oil shale dust are ignited because when they are exposed to an external high temperature or energy, their volatile matter will be thermally pyrolyzed. When the precipitated combustible volatile gases have reached a given concentration, they will be ignited, heating the surrounding dust particles, pyrolyzing and burning them, thus propagating the burning flames [12]. Table 2 compares the MIT and MIE test results of the dust mixtures. The oil shale dust has an obviously lower MIT and MIE than the coal dust. Hence, it is more likely to be ignited. Thermogravimetric analysis revealed that the raw oil shale dust and coal dust samples did not vary significantly in volatile pyrolysis temperature. Although the combustion of fixed carbon caused a very great weight loss rate for the coal dust sample, as the oil shale dust sample had a higher volatile content, more volatile gases could be produced at the moment the oil shale dust sample was exposed to a high temperature or ignition energy. Hence, it was more likely to be ignited. For the coal dust sample, higher ignition temperature or ignition energy will be needed if higher content of precipitated volatile is desired. This also verifies that the ignition of oil shale dust or coal dust is mainly determined by the precipitation rate of volatile matter. Furthermore, as coal dust has a relatively high moisture content, moisture evaporation will also absorb part of the heat or energy existing at the time of ignition. This is adverse for the ignition of the dust cloud, as it increases its MIT and MIE. As shown in Figure 4, the inclusion of a small amount of oil shale dust (25 wt%) in the coal dust greatly reduced the MIT and MIE of the dust cloud. This significantly adds to the risk of explosion accidents. Also, as the proportion of oil shale dust increased, the MIT and MIE of the dust cloud both decreased. That is, the higher the oil shale dust content is in the mixture, the more likely the dust cloud is to be ignited and the more likely a dust explosion accident is to take place.
Figure 5 compares the flame propagation processes of the dust mixtures after ignition. From this diagram, the flame propagation of pure coal dust was the slowest, which lasted 230 ms for the ignited dust cloud to propagate to the top of the glass tube. When a small amount of oil shale dust (25 wt%) was added into the coal dust, it took 60 ms less time for the flame to reach the top of the glass tube, meaning the flame propagation was significantly higher. As the proportion of oil shale dust increased, the time needed for the flame to propagate to the top of the glass tube gradually decreased, meaning that the flame propagation speed gradually increased. In the case of pure oil shale dust, it took only 90 ms for the flame to propagate to the top of the glass tube. As the percentage of oil shale dust increased, the burning flames were even more uniform and brighter. This is because oil shale has a relatively high volatile content. An increase in oil shale dust in the mixture causes the volatile matter from pyrolysis to increase too. This increases the burning reaction rate and intensifies the combustion, eventually accelerating flame propagation.

3.2. Explosion Severity of Mixed Dust Cloud

A 20 L explosion vessel is commonly used to study the explosibility of dust or combustible gases [26,27,28]. Figure 6 shows the explosion pressure history of coal dust measured at a concentration of 250 g/m3, and indicates two parameters used to evaluate the explosibility of dust: Pmax and (dP/dt)max. KSt, another important parameter, denotes the (dP/dt)max in a 1 m3-capacity explosion vessel. Using Formula (2), we have:
K s t = ( d p d t ) max V 1 / 3 .
The Kst measurement from the 20 L explosion vessel is an important parameter for the explosion-proof design of installations [7,25].
A series of explosibility tests was conducted on the dust mixtures within mass ratio 125–1250 g/m3. The measured raw data results are given in Table 3 and Table 4, respectively, for Pmax and (dP/dt)max. It can be seen from the table that the Pmax of the coal dust was between 0.45 and 0.51 MPa, and the (dP/dt)max was between 16.05 and 37.63 MPa/s. In the ASTM E1226 standard, the Pmax of Pittsburgh seam bituminous coal dust (~80% minus 200 mesh, 36% volatility) is 0.7 MPa, and the (dP/dt)max is 43 MPa. The coal dust explosion in this paper was weaker than the Pittsburgh coal dust. This may be because the coal dust had a lower volatile content and a larger moisture content. Figure 7 shows the Pmax and (dP/dt)max among the five dust samples as a function of dust concentration. At the beginning, as dust concentration increased, so did the burner content. Increasing the heat produced by explosion caused the Pmax of all five dusts to rise swiftly (Figure 7a). Pmax maximized when the dust concentration reached a limit. However, when dust concentration further increased, due to the limitation of oxygen content and the fact that excessive dust will absorb part of the burning heat, the Pmax began to drop. Roughly the same happened to (dP/dt)max (Figure 7b). The (dP/dt)max increase at the beginning was mainly caused by the increasing volatile matter, which increased the precipitation rate of volatile, thereby speeding up the burning rate. As concentration continued to increase, (dP/dt)max also experienced a decline due to the limitations of oxygen content and loss of heat.
More remarkably, at a low concentration, the Pmax decreased with increasing proportion of oil shale, but as the dust concentration increased, the Pmax level gradually exceeded that when oil shale had lower percentages in the mixture; as oil shale percentage in the mixture increased, the concentration at which Pmax maximized gradually increased too and so did the maximum Pmax. The relatively high ash content and low combustible organic content in oil shale account for the low oxygen consumption and heat production during explosion at low concentrations. As a result, higher dust concentrations are needed to achieve the maximum Pmax. This explains why oil shale dust has relatively low explosion pressure at low concentrations. As oil shale has a high volatile content, the addition of oil shale will increase the precipitation rate of volatile matter and, consequently, increase the burning rate during explosion. The higher the oil shale percentage is in the mixture, the greater the (dP/dt)max and, consequently, the greater the Pmax produced (Figure 7b). From Figure 8 one can clearly see that Kst gradually increased with increasing oil shale percentage in the mixture under all dust concentrations. This validates that higher oil shale percentages in the mixture will mean higher explosion risks.

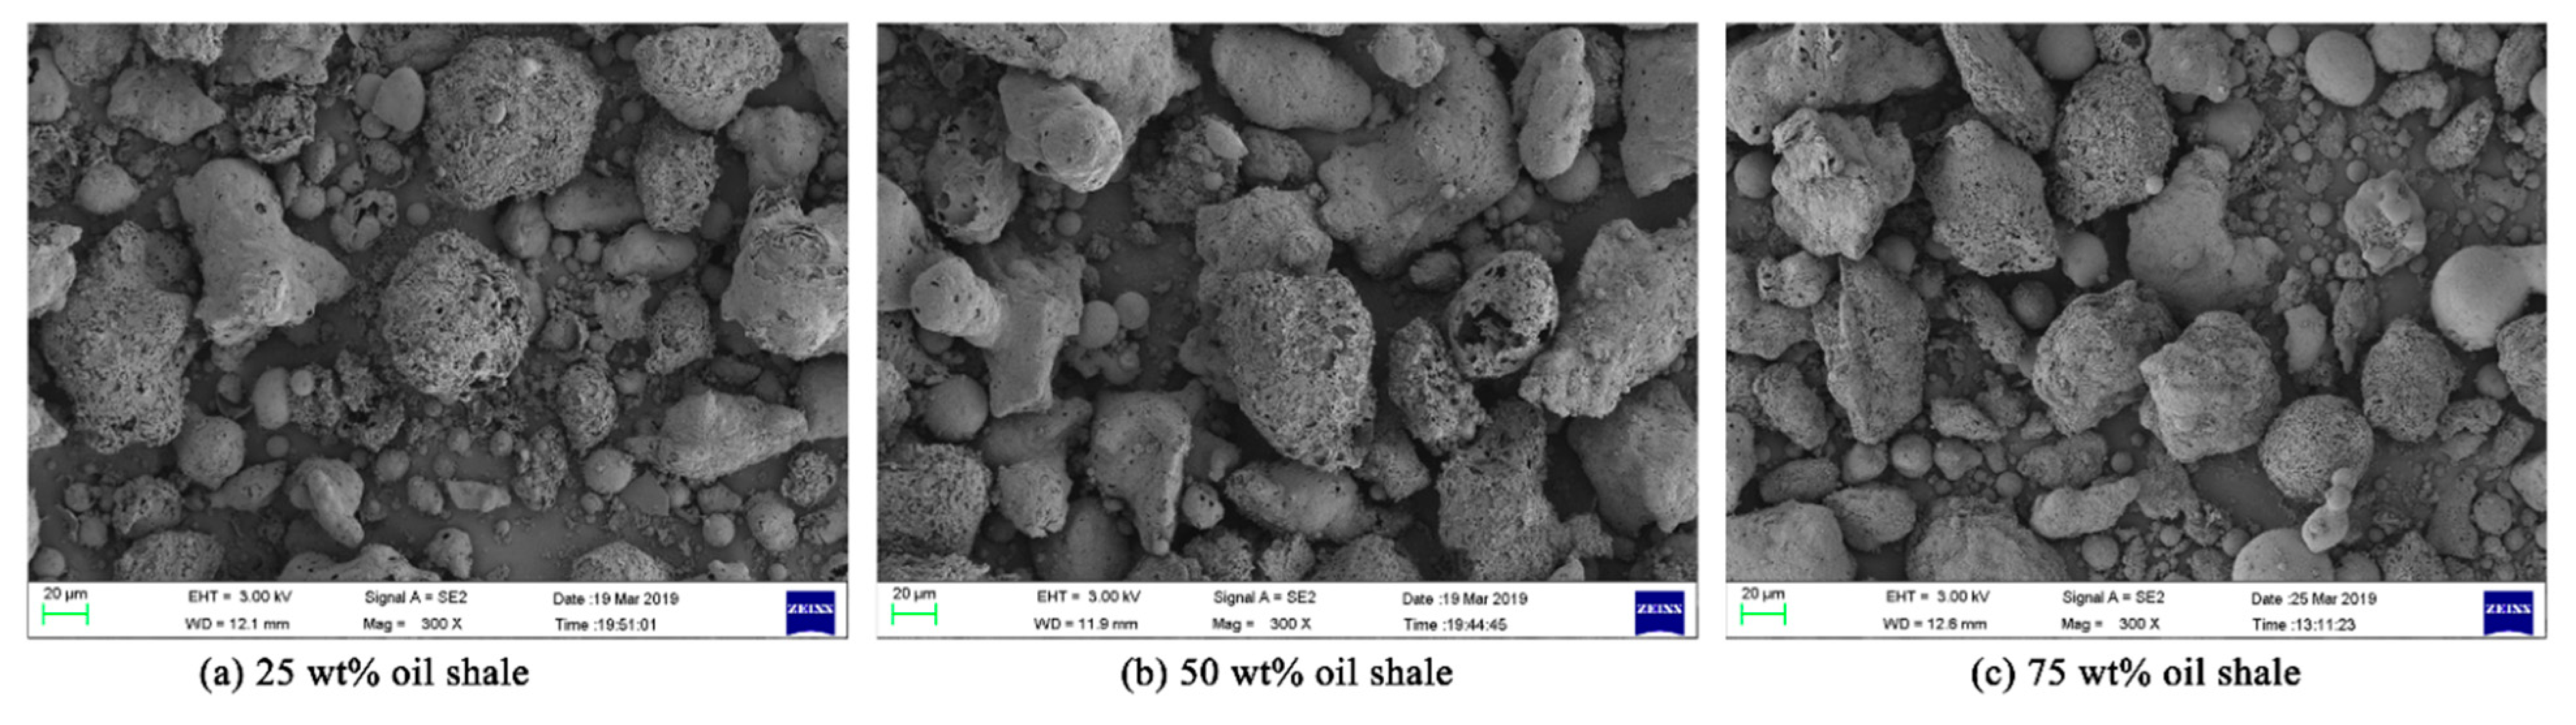
3.3. Product Microstructure and Explosion Mechanism

The microstructure of the dust explosion product constitutes important evidence for investigating dust explosion mechanism [29,30]. To explore the explosion process and mechanism of mixed dust, we used a scanning electron microscope (SEM) to characterize the microstructures of the dust samples and their explosion products.
Figure 9 compares the SEM images of the coal and oil shale dust. From these images, the particles of both samples were unequally sized and irregularly shaped with obvious edges and corners. The particles were relatively smooth on the surface with no visible pore structure. Figure 10 compares the SEM images between the coal dust and oil shale dust explosion products. The particles of both samples displayed remarkably different microstructures. After the coal dust exploded, the majority of the dust particles lost their edges and corners and became rounded sub-spheroids. They contained many pores and some of them had even become broken porous shells, as illustrated by Figure 10a,b; after the oil shale dust exploded, in contrast, the particles only turned into rounded sub-spheroids and no visible pores are observed in them, as illustrated by Figure 10c,d.
Figure 11 compares the SEM images the oil shale–coal mixture after explosion under different oil shale dust mass ratios. From these images, after explosion, the mixture contained two kinds of sub-spherical particles—one contained visible pores and the other contained no visible pores; quite a few particles containing visible pores were found in the mixture with a smaller oil shale percentage, whereas very few were found in the mixture with a higher oil shale percentage.
The SEM results and our findings on explosion mechanisms of coal dust will cast light on the explosion mechanisms. As shown in Figure 12, during explosion, coal dust particles will experience two different stages. First, when coal dust particles are exposed to energy from the ignition head or heated by the burning flames, they are pyrolyzed. Volatile matters are precipitated from the inside of the coal particles through micro pores and form rounded, sub-spherical coal tar. Next, the fixed carbon fraction in the coal tar continues to participate in the burning reaction. Burning of the solid fraction in the coal tar produces many pores in the coal particles. When exposed to thermal stresses and explosion shock waves, the completely burned particles will become broken, spherical shells. In the case of oil shale, the explosion mainly consists of the first stage, since oil shale is hosted in sedimentary rock. As revealed by the proximate analysis result of the oil shale dust sample, it has a high percentage of ash, close to 40%, whereas its fixed carbon percentage is very low; its organic content is typically volatile matter. As a result, its explosion mainly involves pyrolysis of the oil shale particles and combustion of the volatile. Due to the low fixed carbon content and high incombustible rock content in oil shale, it is hardly possible for the modest amount of fixed carbon to participate in the burning reaction. That explains why no visible pores were produced after oil shale particles participated in the explosion.

4. Conclusions

The MIT and MIE of the raw oil dust and coal dust samples and three oil shale-coal mixtures were tested. The results show that the oil shale dust cloud has an obviously lower MIT and MIE and is easier to ignite than coal dust. The reason for this is the high volatile content and low moisture content in the oil shale dust sample. The inclusion of a small amount of oil shale dust in the coal dust can greatly reduce the MIT and MIE of the coal dust and increase the risk of an explosion accident. With increasing oil shale dust percentage in the mixture, the MIT and MIE of the dust cloud both gradually decreased and the flame propagation speed gradually increased in all cases. According to the measured MIT and MIE of mixed dust, the ignition source can be further analyzed and controlled to avoid an explosion accident caused by the mixed dust cloud being ignited.
The explosion severity of the oil shale–coal dust mixtures was examined, with a focus on their Pmax, (dP/dt)max, and KSt. The results show that with increasing dust concentration, their Pmax and (dP/dt)max both displayed an increase-and-decrease profile. At a low dust concentration, the greater the oil shale percentage in the mixture, the smaller the Pmax; as dust concentration increases, the Pmax gradually exceeded that when the oil shale percentage in the mixture was small; as oil shale percentage in the mixture increased, the concentration at which Pmax maximized gradually increased and so did the maximum Pmax. The relatively low combustible organic content in oil shale accounts for the limited oxygen consumption and heat production during explosion at low concentrations. Hence, higher dust concentrations are needed to achieve the maximum Pmax. As oil shale has a high volatile content, the greater the oil shale percentage in the mixture, the greater the (dP/dt)max and KSt and, consequently, the greater the maximum Pmax produced. According to the parameters of Pmax, (dP/dt)max and KSt of mixed dust, the explosion-proof facilities can be further designed to prevent the occurrence of explosion accidents.
The microstructures of the post-explosion products were compared to investigate the explosion mechanisms. During explosion, coal dust particles will experience two different stages. The first stage involves pyrolysis of coal particles and the combustion of the volatile. They form rounded, sub-spherical coal char because the particles soften and melt at high temperatures. In the next stage, the fixed carbon fraction in the coal char continues to participate in the burning reaction, producing many visible pores in the particles. In contrast, the explosion for oil shale dust, due to its high ash content, its organic matter predominantly consisting of volatile matter, and its low fixed carbon content, is mainly involved the first stage, namely, pyrolysis of particles and the gas phase combustion of the volatile matter.

Author Contributions

Investigation, J.W., Y.Z. (Yuyuan Zhang) and B.L.; data curation, J.C. and Y.Z. (Yansong Zhang); writing-original draft preparation, J.W. and J.C.; writing-review and editing, B.L. and Y.Z. (Yansong Zhang); project administration, H.S.

Funding

This research was funded by the Key Research and Development Project of Shandong Province (2018GSF120016 and 2018GGX109004), the National Key Research and Development Plan (2017YFC0805200) and the China Postdoctoral Science Foundation (2018M632693).

Conflicts of Interest

The authors declare no conflict of interest.

References

  1. Lv, D.; Wang, D.; Li, Z.; Liu, H.; Li, Y. Depositional environment, sequence stratigraphy and sedimentary mineralization mechanism in the coal bed- and oil shale-bearing succession: A case from the Paleogene Huangxian Basin of China. J. Petrol. Sci. Eng. 2017, 148, 32–51. [Google Scholar] [CrossRef]
  2. Li, S.; Ma, X.; Liu, G.; Guo, M. A TG–FTIR investigation to the co-pyrolysis of oil shale with coal. J. Anal. Appl. Pyrol. 2016, 120, 540–548. [Google Scholar] [CrossRef]
  3. Miao, Z.; Wu, G.; Li, P.; Meng, X.; Zheng, Z. Investigation into co-pyrolysis characteristics of oil shale and coal. Int. J. Min. Sci. Technol. 2012, 22, 245–249. [Google Scholar] [CrossRef]
  4. Yuan, Z.; Khakzad, N.; Khan, F.; Amyotte, P. Dust explosions: A threat to the process industries. Process Saf. Environ. Prot. 2015, 98, 57–71. [Google Scholar] [CrossRef]
  5. Li, G.; Yang, H.X.; Yuan, C.M.; Eckhoff, R.K. A catastrophic aluminium-alloy dust explosion in China. J. Loss Prev. Process Ind. 2016, 39, 121–130. [Google Scholar] [CrossRef]
  6. Kalejaiye, O.; Amyotte, P.R.; Pegg, M.J.; Cashdollar, K.L. Effectiveness of dust dispersion in the 20-L Siwek chamber. J. Loss Prev. Process Ind. 2010, 23, 46–59. [Google Scholar] [CrossRef]
  7. Miranda, J.T.; Camacho, E.M.; Latorre, C.H.; Galdo, M.I.L. A Simple Methodology Based on the Pittsburgh Coal Method for Assessing Specific Explosion Risks in Dust-Generated Explosive Atmospheres: A Case Study from Galicia (NW Spain). Dry Technol. 2015, 33, 301–314. [Google Scholar] [CrossRef]
  8. Cashdollar, K.L. Coal dust explosibility. J. Loss Prev. Process Ind. 1996, 9, 65–76. [Google Scholar] [CrossRef]
  9. Li, Q.Z.; Yuan, C.C.; Tao, Q.L.; Zheng, Y.N.; Zhao, Y. Experimental analysis on post-explosion residues for evaluating coal dust explosion severity and flame propagation behaviors. Fuel 2018, 215, 417–428. [Google Scholar] [CrossRef]
  10. Li, Q.Z.; Wang, K.; Zheng, Y.N.; Ruan, M.L.; Mei, X.N.; Lin, B.Q. Experimental research of particle size and size dispersity on the explosibility characteristics of coal dust. Powder Technol. 2016, 292, 290–297. [Google Scholar] [CrossRef]
  11. Cao, W.G.; Gao, W.; Liang, J.Y.; Xu, S.; Pan, F. Flame-propagation behavior and a dynamic model for the thermal-radiation effects in coal-dust explosions. J. Loss Prevent. Proc. 2014, 29, 65–71. [Google Scholar] [CrossRef]
  12. Cao, W.G.; Gao, W.; Peng, Y.H.; Liang, J.Y.; Pan, F.; Xu, S. Experimental and numerical study on flame propagation behaviors in coal dust explosions. Powder Technol. 2014, 266, 456–462. [Google Scholar] [CrossRef]
  13. Mishra, D.P.; Azam, S. Experimental investigation on effects of particle size, dust concentration and dust-dispersion-air pressure on minimum ignition temperature and combustion process of coal dust clouds in a G-G furnace. Fuel 2018, 227, 424–433. [Google Scholar] [CrossRef]
  14. Hamdan, M.A.; Qubbaj, A. Inhibition effect of inert compounds on oil shale dust explosion. Appl. Therm. Eng. 1998, 18, 221–229. [Google Scholar] [CrossRef]
  15. Hamdan, M.A.; Sakhrieh, A. Dust explosion of oil shale and olive cake solid fuels: A comparison study. Int. J. Energy Res. 2005, 29, 871–878. [Google Scholar] [CrossRef]
  16. Sweis, F.K. The effect of admixed material on the minimum explosible concentration of oil shale. J. Loss Prev. Process Ind. 2006, 19, 701–704. [Google Scholar] [CrossRef]
  17. Bai, C.H.; Gong, G.D.; Liu, Q.M.; Chen, Y.H.; Niu, G.T. The explosion overpressure field and flame propagation of methane/air and methane/coal dust/air mixtures. Saf. Sci. 2011, 49, 1349–1354. [Google Scholar] [CrossRef]
  18. Ajrash, M.J.; Zanganeh, J.; Moghtaderi, B. Methane-coal dust hybrid fuel explosion properties in a large scale cylindrical explosion chamber. J. Loss Prev. Process Ind. 2016, 40, 317–328. [Google Scholar] [CrossRef]
  19. Kundu, S.K.; Zanganeh, J.; Eschebach, D.; Moghtaderi, B. Explosion severity of methane-coal dust hybrid mixtures in a ducted spherical vessel. Powder Technol. 2018, 323, 95–102. [Google Scholar] [CrossRef]
  20. Li, Q.Z.; Lin, B.Q.; Dai, H.M.; Zhao, S. Explosion characteristics of H-2/CH4/air and CH4/coal dust/air mixtures. Powder Technol. 2012, 229, 222–228. [Google Scholar] [CrossRef]
  21. Song, S.X.; Cheng, Y.F.; Meng, X.R.; Ma, H.H.; Dai, H.Y.; Kan, J.T.; Shen, Z.W. Hybrid CH4/coal dust explosions in a 20-L spherical vessel. Process Saf. Environ. 2019, 122, 281–287. [Google Scholar] [CrossRef]
  22. Yu, L.F.; Li, G.; Liu, W.C.; Yu, J.N.; Yuan, C.M. Experimental investigations on ignition sensitivity of hybrid mixtures of oil shale dust and syngas. Fuel 2017, 210, 1–7. [Google Scholar] [CrossRef]
  23. Wang, J.F.; Meng, X.B.; Ma, X.S.; Xiao, Q.; Liu, B.; Zhang, G.Y. Experimental study on whether and how particle size affects the flame propagation and explosibility of oil shale dust. Process Saf. Prog. 2019. [Google Scholar] [CrossRef]
  24. Castellanos, D.; Carreto-Vazquez, V.H.; Mashuga, C.V.; Trottier, R.; Mejia, A.F.; Mannan, M.S. The effect of particle size polydispersity on the explosibility characteristics of aluminum dust. Powder Technol. 2014, 254, 331–337. [Google Scholar] [CrossRef]
  25. Abbasi, T.; Abbasi, S.A. Dust explosions–Cases, causes, consequences, and control. J. Hazard. Mater. 2007, 140, 7–44. [Google Scholar] [CrossRef]
  26. Skřínský, J.; Ochodek, T. Explosion Characteristics of Propanol Isomer–Air Mixtures. Energies 2019, 12, 1574. [Google Scholar] [CrossRef]
  27. Wang, Y.; Meng, X.; Ji, W.; Pei, B.; Lin, C.; Feng, H.; Zheng, L. The Inhibition Effect of Gas–Solid Two-Phase Inhibitors on Methane Explosion. Energies 2019, 12, 398. [Google Scholar] [CrossRef]
  28. Zhang, Y.; Wang, Y.; Zheng, L.; Yang, T.; Gao, J.; Li, Z. Effect of Pristine Palygorskite Powders on Explosion Characteristics of Methane-Air Premixed Gas. Energies 2018, 11, 2496. [Google Scholar] [CrossRef]
  29. Liu, Z.T.; Lin, S.; Zhang, S.S.; Wang, E.Y.; Liu, G.H. Observations of microscopic characteristics of post-explosion coal dust samples. J. Loss Prev. Process Ind. 2016, 43, 378–384. [Google Scholar] [CrossRef]
  30. Sen, H.S.; Liu, Z.T.; Zhao, E.L.; Lin, S.; Qiu, L.M.; Qian, J.F.; Liu, H.X.; Xia, S.K. Comparison of behavior and microscopic characteristics of first and secondary explosions of coal dust. J. Loss Prev. Process Ind. 2017, 49, 382–394. [Google Scholar] [CrossRef]
Figure 1. Particle size distributions of oil shale dust sample versus coal dust sample: (a) coal dust; (b) oil shale.
Energies 12 03807 g001
Figure 2. Thermogravimetric and derivative thermogravimetric (TG-DTG) curves of oil shale dust sample versus coal dust sample: (a) coal; (b) oil shale.
Energies 12 03807 g002
Figure 3. Godbert-Greenwald (G-G) furnace.
Energies 12 03807 g003
Figure 4. MIT and MIE curves of the dust cloud.
Energies 12 03807 g004
Figure 5. High-speed photos of flame propagation of the dust cloud in the vertical glass tube: (a) only oil shale; (b) 75 wt% oil shale; (c) 50 wt% oil shale; (d) 25% oil shale; (e) only coal.
Energies 12 03807 g005
Figure 6. Explosion pressure time history.
Energies 12 03807 g006
Figure 7. Pmax and (dP/dt)max of the dust cloud relative to dust concentration: (a) Pmax versus dust concentration; (b) (dP/dt)max versus dust concentration.
Energies 12 03807 g007
Figure 8. KSt of the dust cloud versus percentage of oil shale in the mixture under different concentrations.
Energies 12 03807 g008
Figure 9. Scanning electron microscope (SEM) images of oil shale dust and coal dust before explosion: (a) coal dust; (b) oil shale dust.
Energies 12 03807 g009
Figure 10. SEM images of dust after explosion: (a) coal dust (100 X); (b) coal dust (300 X); (c) oil shale dust (100 X); (d) oil shale dust (300 X).
Energies 12 03807 g010
Figure 11. SEM images of the oil shale-coal dust mixture after explosion under the maximum explosion pressure: (a) 25 wt% oil shale; (b) 50 wt% oil shale; (c) 75 wt% oil shale.
Energies 12 03807 g011
Figure 12. The explosion process and mechanism.
Energies 12 03807 g012
Table 1. Proximate analyses of the coal and oil shale.
SampleProximate Analyses (%)
MadAadVadFCad
Coal17.125.2432.744.94
Oil shale3.5337.1740.8618.44
Mad: moisture; Aad: ash; Vad: volatile matters; FCad: fixed carbon.
Table 2. Minimum ignition temperature (MIT) and minimum ignition energy (MIE) of the dust cloud.
SampleOnly Coal25 wt% Oil Shale50 wt% Oil Shale75 wt% Oil ShaleOnly Oil Shale
MIT (°C)570520505500490
MIE (J)1.70.10.040.0350.025
Table 3. The maximum explosion pressure (Pmax) (MPa) of mixed dust.
Cdust (g/m3)Only Coal25 wt% Oil Shale50 wt% Oil Shale75 wt% Oil ShaleOnly Oil Shale
1250.4520.4380.4260.4140.392
2500.5100.4890.4700.4530.432
3750.4890.5350.5150.4970.470
5000.4750.5150.5600.5420.51
7500.4630.4920.5320.5910.572
10000.4560.4820.5160.5630.612
12500.450.4760.5060.5520.592
Table 4. The maximum rate of pressure rise ((dP/dt)max) (MPa/s) of mixed dust.
Cdust (g/m3)Only Coal25 wt% Oil Shale50 wt% Oil Shale75 wt% Oil ShaleOnly Oil Shale
12516.0521.1523.025.3227.07
25028.833.635.837.8840.15
37536.1340.642.7645.6247.67
50037.6343.946.449.4652.05
75036.143.548.252.255.92
100034.3241.0646.551.857.02
125032.7839.544.850.055.6

