Article

Research on CBM of the Intelligent Substation SCADA System

1
Department of Electrical Engineering, National Taiwan University of Science and Technology, 43, Sec. 3, Keelung Road, Taipei 10607, Taiwan
2
Department of Electrical Engineering, St. John’s University, 499, Sec. 4, Tam King Road, Tamsui District, New Taipei City 25135, Taiwan
*
Author to whom correspondence should be addressed.
Energies 2019, 12(20), 3892; https://doi.org/10.3390/en12203892
Submission received: 22 August 2019 / Revised: 3 October 2019 / Accepted: 14 October 2019 / Published: 15 October 2019

Abstract

:
An equipment status management and maintenance platform of an intelligent substation monitoring and control system is built in the Tai-Tam substation of the Taipower company. The real-time operating status of the equipment, such as the server, supervisory control and data acquisition (SCADA) human–machine interface (HMI) software, switches, intelligent electronic devices (IEDs), merging units (MUs), as well as the entire SCADA system, are evaluated comprehensively. First, the status information of all equipment is collected, and the theory of relative deterioration degree (RDD) and fuzzy theory (FT) are applied to calculate the fuzzy evaluation matrix of the equipment influencing factors. Then, the subjective analytic hierarchy process (AHP) and the objective entropy method for weighting are combined to calculate the comprehensive weights of the equipment influencing factors. Finally, the result of the equipment status evaluation is obtained using the fuzzy comprehensive evaluation (FCE) method and is presented at the equipment status management and maintenance platform. Such equipment status evaluation results can be used by the inspection and maintenance personnel to determine the priority for equipment maintenance and repair. The result of this study may serve as a valuable reference to utility companies when making maintenance plans.

1. Introduction

Condition-based maintenance (CBM) is a preventive maintenance (PM) policy, which uses information and communication technologies to monitor equipment status and to inspect and test the degree of interior deterioration of equipment. Based on equipment reliability, and with the equipment operating status and other importance factors taken into consideration, CBM is more target-specific, rational, and scientific when making equipment inspection, maintenance, and repair decisions [1,2].
Maity et al. point out that time-based maintenance (TBM) may easily lead to over-maintenance or under-maintenance of electrical equipment. If equipment status information can be taken real-time and on-line by sensors and be provided to back-end platforms, data can be analyzed and actual equipment operating condition can be assessed. Thus, a maintenance plan based on the deterioration degree of individual equipment can be made, and proper maintenance can be achieved [3]. Unnecessary maintenance is one of the major causes of power grid failures. To avoid this from happening, Ohlen built a power system monitor and control platform for on-site measurement and on-line real-time monitoring in order to provide data needed by CBM. The goal is to achieve best balance between operation and maintenance based on field equipment status information [4]. The working environment, operation data, inspection and maintenance records, and conditions of internal parts of power transformers are included in a multistage hierarchical assessment index system. The relative deterioration degree (RDD) method is used to assess the degree of similarity between actual equipment operating status and fault condition, and the analytic hierarchy process (AHP) method and the fuzzy comprehensive evaluation (FCE) method are used to evaluate the health status of power transformers. The result may serve as the basis of preventive maintenance practices [5]. A circuit breaker (CB) maintenance research focused on reliability is proposed which integrates intelligent electronic devices (IEDs) in an intelligent maintenance model. IEDs are used to build a CB status monitoring system and to collect relevant maintenance information. The fuzzy set theory, the AHP method, and the Dempster–Shafer evidence theory are applied to analyze and evaluate CB status. In addition, important influencing factors of CBs are collected, and the Delphi method is applied to calculate the weights of the importance factors and to analyze and evaluate the importance of CBs. Finally, reliability-focused maintenance decision analysis is performed based on the result of CB status and importance evaluation [6]. The multistage FCE method is applied to evaluate the operating status of the protection system of a power grid. A multistage status index model is built based on equipment status data, actual system operating status, and the experience of operation personnel and experts. The output of the model is the comprehensive evaluation result. Finally, a maintenance strategy, including status evaluation result, maintenance grades, optimal maintenance time, and maintenance suggestions, is proposed and can be adopted by the inspection and maintenance personnel to perform CBM on power grid protection systems [7,8]. Qian et al. proposed a CBM approach for wind turbines based on long short-term memory (LSTM) algorithms to improve defect detection from supervisory control and data acquisition (SCADA). LSTM algorithms have the capability of capturing long-term dependencies hidden within a sequence of measurements, which can be exploited to increase the prediction accuracy for CBM [9]. Some research works presented the discrete Markov chain model as a simplified probabilistic model for damages in wind turbine blades. The classic Bayesian pre-posterior decision theory is applied for the decision-making of the CBM strategy [10,11,12]. Tian et al. presented a transformer assessing model for CBM by employing a Cauchy membership function for fuzzy grade division, and then a fuzzy evidence fusion method was represented to handle the fuzzy evidences fusion processes. This approach can recommend the condition-based maintenance of power transformer [13].
An intelligent substation is an important link in the realization of a smart grid and is responsible for electric power delivery, power dispatch, power flow, and equipment monitoring and control. As the intelligent substation evolves along with the announcement of IEC 61,850 communication standards, more equipment can be easily integrated into power monitoring and control systems, and innovative and intelligent CBM strategies can be proposed for power equipment maintenance and replacement. There are many studies on equipment maintenance and management on the substation primary side, but few on the reliability evaluation of intelligent substation SCADA systems. The goal of this study is to improve the existing maintenance methods of substation SCADA system equipment, and to propose a condition-based equipment inspection and maintenance strategy. In this study, substation equipment status information is collected following the IEC 61,850 communication protocol, equipment operating status is analyzed through status inspection and testing platform in real time, and a SCADA system maintenance and management platform applying intelligent inspection and maintenance strategy is realized. The result of this study may serve as a valuable reference to the inspection and maintenance personnel and the operation and management personnel of a power utility when making a maintenance plan, and may help to improve the stability and reliability of the utility power supply.
The objective of this paper is to propose the CBM evaluation model of a smart substation control system through a SCADA platform where the real-time health condition of substation equipment can be monitored. The result of the evaluation can be categorized into four degrees: Good Condition, Attention Required, Critical Condition, as well as Immediate Inspection and Maintenance. The maintenance staff can analyze the equipment condition and make the maintenance plan in priority order.
In this paper, an equipment status evaluation method is proposed, and a reliability evaluation model of an integrated intelligent substation SCADA system consisting of a server, SCADA human–machine interface (HMI) software, switches, IEDs, and merging units (MUs) is built in this study. First, the relative deterioration degree (RDD) method is applied to process the relevant parameters of performance-influencing factors. Then the comprehensive weighting method is applied to analyze the degree of importance of equipment. Finally, the fuzzy comprehensive evaluation (FCE) method is applied to perform comprehensive equipment status evaluation. The flowchart of the proposal is shown in Figure 1. The evaluation result serves as a useful guide for system maintenance and management personnel, equipment manufacturers, and power equipment repair crews when maintenance is made. Eventually, an intelligent substation SCADA system example platform is built in the Tai-Tam substation of the Taipower company. Two operation cases of this platform have been applied for validation.

2. Architecture of the Proposed SCADA System of an Intelligent Substation

The example configuration of the proposed intelligent substation SCADA system is shown in Figure 2. The SCADA system of the control center is at the station level, which integrates the important information of all equipment, issues controlling commands, and performs remote monitoring. The bay level is composed mainly of IEDs, which receive the power parameters and status information of the equipment, perform protection functions such as overcurrent protection and voltage differential protection, control the tripping and reclosing of CBs, and upload all status messages and event records to the SCADA system. The merging units (MUs) are the core devices at the process level, which convert analog voltage/current signals to digital signals and transmit the signals to bay level equipment through optical fibers. This study focuses on the status evaluation of the server, SCADA human–machine interface (HMI) software, switches, IEDs, and MUs.

2.1. Server

The server is the hardware equipment of the intelligent substation SCADA system which is capable of running various application software. The server manages the substation automation system efficiently and ensures the power quality provided by the power grid is high. The maintenance and management personnel can monitor the substation operating status, look up both real-time and historical alarms, and print out event records on-line merely through the server of the SCADA system.

2.2. SCADA HMI Software

The SCADA HMI software is a key element in the realization of intelligent substation automatic control and logical analysis. The main functions of the SCADA HMI software include equipment data collecting, system status monitoring and testing, power flow calculation, short circuit analysis, power grid energy dispatch and management, sending control commands, and security control. Statistical data show that 65% of computer system failures are caused by HMI software malfunction; HMI software abnormality may lead to system crash and even casualties and great economic loss [14].

2.3. Switch

Switches are very important in communication and equipment messages exchange. There are many real-time messages inside the substation, such as the manufacturing message specification (MMS) message from IEDs to the SCADA system, generic object-oriented substation events (GOOSE) messages among IEDs, sampling values (SVs) of power parameter messages from MUs to IEDs, and the SNTP/IRIG-B/IEEE 1588 time synchronizing messages for equipment timing accuracy adjustment. Switches can also implement virtual local area network (VLAN), reduce network traffic jam caused by a large amount of data flowing through one single path, increase performance efficiency, and improve information security [15]. A switch must communicate and transmit data in real time and with accuracy, be resistant to electromagnetic interference (EMI), avoid long delay time which may expose the system in dangerous conditions, tolerate ambient temperature variation, and not malfunction or fail due to high temperature.

2.4. IEDs

IEDs are core protection and control devices in a power system. Parameters are set and protection logics are programmed differently depending on the needs and operating conditions of different systems. IEDs receive various electrical data from potential transformers (PTs), current transformers (CTs), MUs, and other equipment. IEDs send dispatch control commands and transmit power operating data to the SCADA system at the station level, or other related equipment through network communication, thus effectively reducing power outages and harm caused by power system abnormal operation.

2.5. MUs

According to the IEC 60044-7 and IEC 60044-8 standards published by the International Electrotechnical Commission (IEC), an MU may be defined preliminarily as “an electronic transformer which replaces a conventional electromagnetic equipment, converts analog voltage/current signals to digital signals to avoid EMI to conventional analog SVs and transmit the digital signals to bay level equipment through optical fibers, thus improves the accuracies of power parameters effectively” [16].

3. Fuzzy Comprehensive Evaluation Method for Equipment Maintenance Strategy

3.1. Establishment of the Evaluation Factors of an Intelligent Substation SCADA System

When evaluating the status of an intelligent substation SCADA system, equipment influencing the normal operation of the SCADA system must be inspected and tested. Because equipment may have many attributes and characteristics, the SCADA system is inevitably affected by many uncertain factors and by many different types of equipment [7].
An intelligent substation SCADA system consists of a lot of equipment, and each performance index of individual equipment reflects the performance status of individual equipment and the system as a whole. Server (u1), SCADA HMI software (u2), Switch (u3), IED (u4), and MU (u5) are analyzed in this study. Equipment availability (u11), communication port failure rate (u12), CPU usage rate (u13), memory usage rate (u14), and transmission load rate (u15) are included in the server reliability evaluation model [17,18]. Software availability (u21), data receiving rate (u22), data access time (u23), and failure repair time (u24) are included in the SCADA HMI software reliability evaluation model [19]. Equipment availability (u31), communication port failure rate (u32), packet lost rate (u33), transmission load rate (u34), and CPU usage rate (u35) are included in the switch reliability evaluation model [16]. Equipment availability (u41), operation failure rate (u42), communication failure rate (u43), operating environment (u44), and CPU usage rate (u45) are included in the IED reliability evaluation model [20]. Equipment availability (u51), SV packet lost rate (u52), SV code error rate (u53), transmission time (u54), time synchronization accuracy (u55), and CPU usage rate (u56) are included in the MU reliability evaluation model [20].
Different comments are needed to describe different equipment status, and five ratings of influencing factor status are chosen according to the equipment operating status: Excellent, Good, Average, Poor, and Worst. The corresponding numerical values are 100, 75, 50, 25, and 0, respectively. The comment set V of intelligent substation SCADA system is shown below.
V = { Excellent, Good, Average, Poor, Worst } = { 100, 75, 50, 25, 0 }

3.2. Establishment of the Equipment Status Evaluation Matrix

The difference between current equipment status and its failure status is represented by the numerical value of the relative deterioration degree (RDD), with values ranging from 0 to 1. Two types of indices are defined in Equations (1) and (2), and either may be chosen depending on the index characteristic [21]. The larger-is-better type of index may be applied to equipment availability with values closer to 1, implying less degree of deterioration. The less-is-better type of index may be applied to equipment failure rate with values closer to 1, implying a higher degree of deterioration and more urgency for maintenance.
The larger-is-better type:
x i = X m x u X m i n X i n t X m i n
The less-is-better type:
x i = X m x u - X i n t X m a x - X i n t
where xi is the RDD of the i-th evaluation factor, Xint is the initial test value of the factor, Xmin is the minimum limit of the factor, Xmax is the maximum limit of the factor, and Xmxu is the measured value of the factor.
The equipment influencing factors of the intelligent substation SCADA system are evaluated by trapezoidal and triangular membership functions to determine their degrees of membership in the evaluation comment set V, as shown in Figure 3. The membership functions of the linguistic variables “Excellent”, “Good”, “Average”, “Poor”, and “Worst” are defined in Equations (3)–(7), with the parameters defined and evenly distributed as α = 0.1, β = 0.3, γ = 0.5, δ = 0.7, and ε = 0.9, respectively.
m 1 ( x ) = { 1 , x α ( β x ) ( β α ) , α < x β 0 , other
m 2 ( x ) = { ( x α ) ( β α ) , α < x β ( γ x ) ( γ β ) , β < x γ 0 , other
m 3 ( x ) = { ( x β ) ( γ β ) , β < x γ ( δ x ) ( δ γ ) , γ < x δ 0 , other
m 4 ( x ) = { ( x γ ) ( δ γ ) , γ < x δ ( ε x ) ( ε δ ) , δ < x ε 0 , other
m 5 ( x ) = { ( x δ ) ( ε δ ) , δ < x ε 1 , ε < x 0 , other
where mk(x) is the membership function of the k-th status comment, and x is the RDD of the evaluation factor.
The evaluation results of the evaluation factors are put together to form the fuzzy evaluation matrix R, as shown in Equation (8):
R = ( r 11 r 1 j r i 1 r i j )   i = 1 , 2 , , m ; j = 1 , 2 , , n
where i is the number of evaluation factors, j is the number of status comments, and rij is the membership degree of the j-th comment of the i-th evaluation factor.

3.3. Calculation of Equipment Weights

The importance of individual equipment in an intelligent substation SCADA system is different depending on its functionality. Therefore, it is scientifically crucial in status evaluation to assign proper weight to equipment according to its degree of importance. Subjective weighting relies heavily on human thinking pattern and is not very scientific, while objective weighting depends on parameter variation. A comprehensive weighting method is proposed in this study, which combines the subjective analytic hierarchy process (AHP) method and the objective entropy weighting method. Because the proposed comprehensive weighting method inherits the field experiences of experts and is in compliance with parameter authenticity, it can be applied to evaluate equipment status effectively.

3.3.1. Calculation of the Subjective Weights

The AHP method resolves a complex problem to a configuration of concise factor levels. Evaluation tables are formed to assess the importance degree of each factor and to serve as reference during the weighting process [22,23]. Researchers, manufacturers, and utility personnel are consulted on the importance degrees of the equipment and influencing factors of the intelligent substation SCADA system. The geometric means of their opinions are calculated to obtain the subjective weights. The steps of calculations are as follows.
Step 1: Construct a hierarchy structure model: Group the factors in the problem according to their interrelationship into three layers—ultimate target layer, evaluation item layer, and index layer. Sublayers may be formed to simplify the computation if there are too many factors in a layer.
Step 2: Construct a comparison judgement matrix: The judgement matrix A is formed by pairwise comparisons between factors of the same level to evaluate their relative degree of importance, as shown in Equation (9). The definitions and explanations of the evaluation scales are shown in Table 1.
A = ( a 11 a 1 j a i 1 a i j )   i = 1 , 2 , , m ;   j = 1 , 2 , , n
Step 3: Calculate the weights: After the judgement matrix A is derived from the opinions of experts, numerical analysis is applied to calculate the maximum eigenvalue and its corresponding eigenvector, as shown in Equation (10). The relative importance or weight distribution of the factors may be sorted by analyzing the eigenvector. The relationship between the eigenvector and the weight is shown in Equation (11).
A E = i = 1 m j = 1 n a i j e i = λ max E
W a = E i = 1 m e i
where Wa is the subjective weight, aij is an element of the judgment matrix A, λmax is the maximum eigenvalue of A, and ei is an element of eigenvector E corresponding to λmax.
The purpose of a consistancy test is to check if the respondents’ answers to the questionnaire comply with transitivity, which is the basis to verify the validity of the questionnaire to avoid the wrong decision of evaluation. The consistanct test is the important factor to verify the accuracy of the subjective weighting.
The validity of the questionnaire is based on the Consistency Index (CI), as shown in Equation (12). The tolerance value is CI ≤ 0.1. In addition, to further test whether the hierarchical structure of the judgment matrix complies with the consistency standard, the consistency ratio (CR) is tested. In Equation (13), the tolerance value CR ≤ 0.1. If CI and CR fail the test, the steps of analytic hierarchy process must be re-executed.
C I = λ max n n 1
C R = C I R I
where
  • CI: Consistency Index (CI) of judgement matrix
  • RI: Random Index (RI) of judgement matrix
  • n: Matrix order
The random index value (RI) increases as the matrix order increases. For the 1–10 order pairing matrix, the RI values are shown in Table 2.
If CR ≤ 0.1, the calculated weight value can be accepted. Otherwise, if the CR value is larger, the judgment matrix filled in by the respondent may be inconsistent due to the complexity of the problem and the diversity of subjective cognition.

3.3.2. Calculation of the Objective Weights

The concept of entropy is employed by the entropy weighting method in information theory to assess the degree of decision information the value of a parameter of an evaluation item can carry when a target is evaluated, and the relative weight of an index is determined based on the variation or degree of difference of a parameter. In general, an evaluation factor with higher entropy is assigned a less weight. The steps of the calculation are as follows [24].
Step 1: Standardize the parameters: Parameter values of different orders of magnitude of evaluation items are converted to relative quantities by the standardization rule shown in Equation (14). A standardization matrix Z = [ zij ]m×n can be built for a system with m evaluation index data and n semantic variables.
z i j = r i j r min r max r min
where rij is the original value of membership degree, rmax is the maximum value and rmin is the minimum value of the evaluation factor, respectively.
Step 2: Calculate the message entropy: By the definition of message entropy, the standardization matrix Z is used to calculate the value of entropy Hi of the evaluation factors, as shown in Equations (15) and (16):
H i = 1 ln n ( j = 1 n f i j ln f i j )   i = 1 , 2 , , m
f i j = z i j + 1 j = 1 n ( z i j + 1 )
where Hi is the entropy of the i-th evaluation factor, zij is the standardized index of the j-th semantic variable of the i-th evaluation factor, m is the number of the evaluation factors, and n is the number of the semantic variables.
Step 3: Calculate the weights: After the values of the message entropies are obtained as described above, the degrees of difference of all the evaluation factors are known and the corresponding weights are calculated according to the entropy values, as shown in Equation (17):
W e = 1 H i m i = 1 m H i
where We is the objective weight.

3.3.3. Calculation of the Comprehensive Weights

The subjective weights of the AHP method and the objective weights of the entropy weighting method are integrated in the comprehensive weighting method. The comprehensive weighting method is applied in this study to obtain the equipment weight. The mathematical model of the comprehensive weighting method is shown in Equation (18):
w i = W a i W e i i = 1 m W a i W e i
where wi, Wai, and Wei are the comprehensive weight, subjective weight, and objective weight of the i-th evaluation factor, respectively.

3.4. Establishment of the Equipment FCE Matrix

Te fuzzy linear transform principle and the maximum membership principle are applied in the FCE method. The relationships among the evaluation problem and the relevant factors are considered, and rational comprehensive evaluations are made [7,25]. The steps of evaluation are as follows.
Only one single value of equipment evaluation with equal importance degree can be obtained by the fuzzy evaluation matrix. To effectively improve the accuracy of the evaluation matrix, the concept of weight is introduced into the evaluation matrix, and the mathematical representation of the FCE matrix is shown in Equation (19):
B i = w i R i = [ b i 1 , b i 2 , b i 3 , , b i n ]   i = 1 , 2 , , m
where bij is the weighted membership degree of the j-th comment of the i-th evaluation factor.
The FCE method is applied to integrate the evaluation matrix of each factor, assign the weight of relative importance, and calculate the overall evaluation result of each factor on the final evaluation target. The mathematical representation is shown in Equation (20):
S = w B T = w [ B 1 , B 2 , , B n ] T
where S is the membership degree of the n evaluation factors.

3.5. Numerical Calculations of the Evaluation

The result of the FCE matrix calculation is the membership degrees of evaluation ratings of the evaluation target. Because the analyzing personnel cannot determine the real-time status of the evaluation target quickly enough, a numerical value is assigned to each evaluation rating in order to simplify the analytical evaluation result. The assessment result of the FCE matrix, Ti and T, are shown in Equations (21) and (22), respectively. The equipment status ratings and the corresponding numerical evaluation ranges are summarized in Table 3.
T i = B i v T = [ b i 1 , b i 2 , , b i n ] [ 100 ,   75 ,   50 ,   25 ,   0 ] T
T = S v T = [ S 1 , S 2 , , S n ] [ 100 ,   75 ,   50 ,   25 ,   0 ] T

4. Case Study

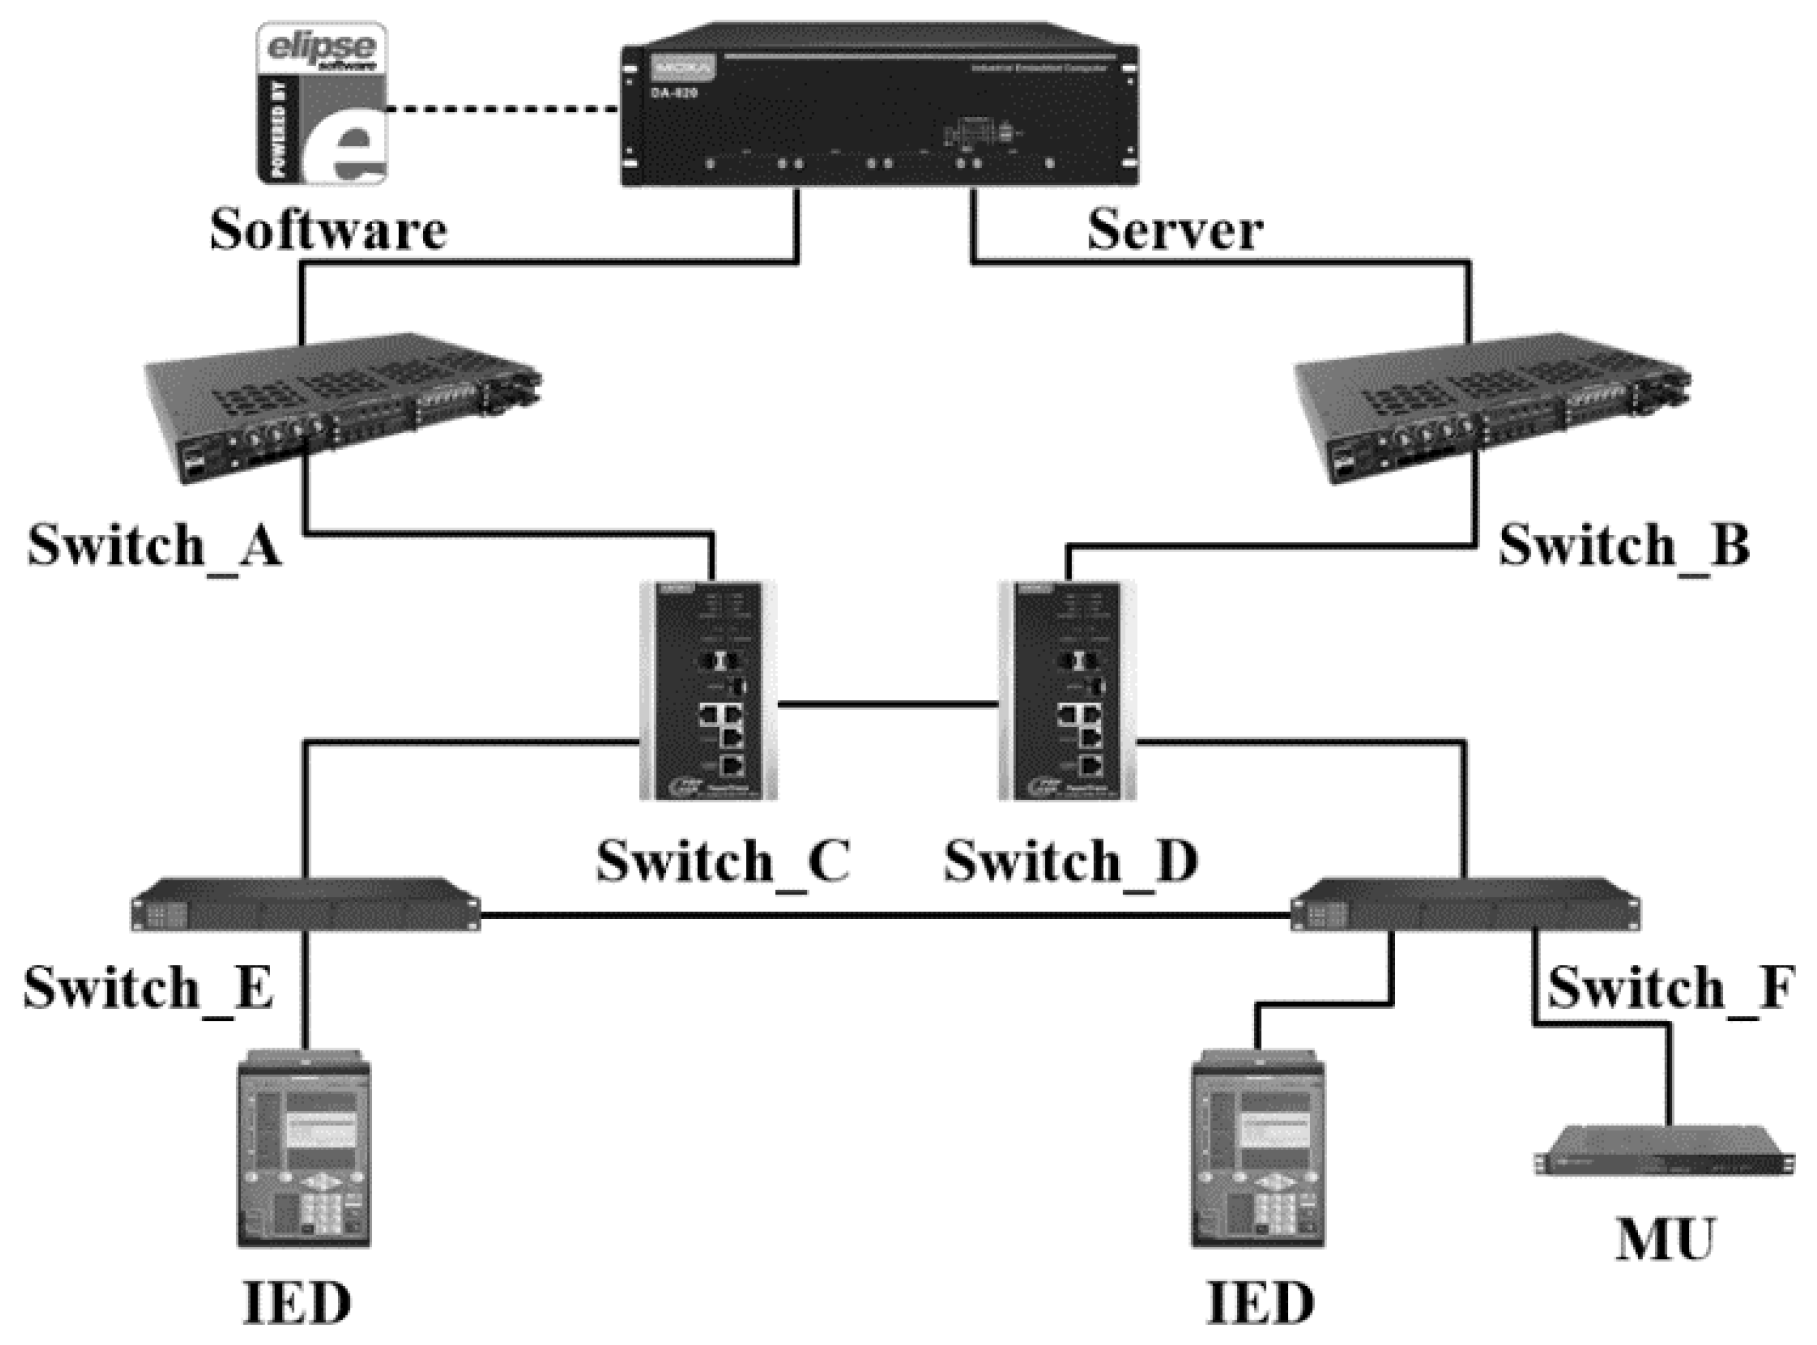
An intelligent substation SCADA system example platform is built in the Tai-Tam substation of the Taipower company. The hardware configuration of this platform is shown in Figure 4. Two operation cases of this platform have been explored and analyzed to determine the priority for equipment maintenance and repair. For case 1, the actual measured values of equipment influencing factors and the corresponding fuzzified RDDs are shown in Table 4, Table 5, Table 6, Table 7 and Table 8. The membership degrees of the equipment influencing factors are shown in Table 9, Table 10, Table 11, Table 12 and Table 13.
The analytic hierarchy process (AHP) method is applied in the intelligent substation SCADA system analysis to calculate the equipment subjective weights, as shown in Table 14. The maximum eigenvalue and the corresponding eigenvector are λ max = 5.0438 and E = [0.7149 0.2241 0.3732 0.5170 0.1794], respectively. The consistency index and the consistency ratio are CI = 0.0110, n = 5, RI = 1.12, and CR = 0.0098, respectively. Since CR ≦ 0.1, the weights are acceptable.
The subjective, objective, and comprehensive weights of the server status evaluation are shown in Table 15. The AHP method is applied and the maximum eigenvalue and the corresponding eigenvector are λ max = 5.0164 and E = [0.2240 0.3262 0.1863 0.0854 0.1781], respectively. The consistency index and the consistency ratio are CI = 0.0041, n = 5, RI = 1.12, and CR = 0.0037, respectively. Since CR ≦ 0.1, the weights are acceptable.
The subjective, objective, and comprehensive weights of the SCADA HMI software status evaluation are shown in Table 16. The AHP method is applied and the maximum eigenvalue and the corresponding eigenvector are λ max = 4.0803 and E = [0.8001 0.4425 0.2237 0.3376], respectively. The consistency index and the consistency ratio are CI = 0.0268, n = 4, RI = 0.9, and CR = 0.0297, respectively. Since CR ≦ 0.1, the weights are acceptable.
The subjective, objective, and comprehensive weights of the switch status evaluation are shown in Table 17, Table 18, Table 19 and Table 20. The AHP method is applied and the maximum eigenvalue and the corresponding eigenvector are λ max = 5.0494 and E = [0.4118 0.7113 0.4775 0.2052 0.2331], respectively. The consistency index and the consistency ratio are CI = 0.0124, n = 5, RI = 1.12, and CR = 0.0110, respectively. Since CR ≦ 0.1, the weights are acceptable.
The subjective, objective, and comprehensive weights of the IED status evaluation are shown in Table 21 and Table 22. The AHP method is applied and the maximum eigenvalue and the corresponding eigenvector are λ max = 5.0096 and E = [0.2105 0.6576 0.6058 0.2915 0.2671], respectively. The consistency index and the consistency ratio are CI = 0.0024, n = 5, RI = 1.12, and CR = 0.0021, respectively. Since CR ≦ 0.1, the weights are acceptable.
The subjective, objective, and comprehensive weights of the MU status evaluation are shown in Table 23. The AHP method is applied and the maximum eigenvalue and the corresponding eigenvector are λ max = 6.0210 and E = [0.1981 0.5283 0.4586 0.4479 0.4720 0.2187], respectively. The consistency index and the consistency ratio are CI = 0.0042, n = 6, RI = 1.24, and CR = 0.0034, respectively. Since CR ≦ 0.1, the weights are acceptable.
As a demonstration, the procedures and the numerical calculations of the FCE matrix for case 1 in this study are described in detail as follows.
(1)
Server FCE matrix B1 and its numerical value T1:
B 1 = w 1 R u 1 = [ 0.1435 , 0.3600 , 0.2056 , 0.0943 , 0.1966 ]   [ 0.5938 1.0000 1.0000 1.0000 1.0000 0.4062 0 0 0 0 0 0 0 0 0 0 0 0 0 0 0 0 0 0 0 ] = [ 0.9417 ,   0.0583   ,   0 ,   0 ,   0 ]
T 1 = B 1 V T = [ 0.9417 , 0.0583 , 0 , 0 , 0 ] [ 100 75 50 25 0 ] = 98.54
(2)
SCADA HMI software fuzzy evaluation matrix B2 and its numerical value T2:
B 2 = w 2 R u 2 = [ 0.4664 , 0.2580 , 0.0788 , 0.1969 ] [ 1.0000 1.0000 0.6667 1.0000 0 0 0.3333 0 0 0 0 0 0 0 0 0 0 0 0 0 ] = [ 0.9738 ,   0.0262 ,   0 ,   0 ,   0 ]
T 2 = B 2 V T = 99.35
(3)
Switches fuzzy evaluation matrix B3:
The PT-G7828_A fuzzy evaluation matrix B31 and its numerical value T31:
B 31 = w 31 R u 31    = [ 0.1944 , 0.3659 , 0.2456 , 0.0742 , 0.1199 ] [ 0.9706 1.0000 1.0000 0.8158 1.0000 0.0294 0 0 0.1842 0 0 0 0 0 0 0 0 0 0 0 0 0 0 0 0 ]    = [ 0.9806 ,   0.0194 ,   0 ,   0 ,   0 ]
T 31 = B 31 V T = 99.52
The PT-G503_A fuzzy evaluation matrix B33 and its numerical value T33:
B 33 = w 33 R u 33    = [ 0.2005 , 0.3695 , 0.2480 , 0.0610 , 0.1210 ] [ 0.9774 1.0000 1.0000 0.5000 1.0000 0.0226 0 0 0.500 0 0 0 0 0 0 0 0 0 0 0 0 0 0 0 0 ]    = [ 0.9651 ,   0 . 0349 ,   0 ,   0 ,   0 ]
T 33 = B 33 V T = 99.13
In order to improve the data transmission reliability, parallel redundancy protocol (PRP) and high-availability seamless redundancy (HSR) are introduced in the network communication configuration, where PRP is followed using switches PT-G7828_A and PT-G7828_B, while HSR is achieved using PT-G503_A, PT-G503_B, PT-7728_A, and PT-7728_B. The six switches are represented by one equivalent switch to simplify the calculation with fuzzy evaluation matrix B3 and its numerical value T3:
B 3 = 0.5 [ 0.5 ( B 31 + B 32 ) + 0.25 ( B 33 + B 34 + B 35 + B 36 ) ]    = [ 0.9806 ,   0.0194 ,   0 ,   0 ,   0 ]
T 3 = B 3 V T = 99.52
(4)
IEDs fuzzy evaluation matrix R4:
The IED_A fuzzy evaluation matrix B41 and its numerical value T41:
B 41 = w 41 R u 41    = [ 0.1083 , 0.3419 , 0.3149 , 0.1515 , 0.0834 ] [ 0.9887 1.0000 1.0000 1.0000 0.6579 0.0113 0 0 0 0.3421 0 0 0 0 0 0 0 0 0 0 0 0 0 0 0 ]    = [ 0.9702 ,   0 . 0298 ,   0 ,   0 ,   0 ]
T 41 = B 41 V T = 99.25
B 42 = w 42 R u 42    = [ 0.1047 , 0.3401 , 0.3133 , 0.1507 , 0.0911 ] [ 0.9887 1.0000 1.0000 1.0000 0.7632 0.0113 0 0 0 0.2368 0 0 0 0 0 0 0 0 0 0 0 0 0 0 0 ]    = [ 0.9772 ,   0 . 0228 ,   0 ,   0 ,   0 ]
T 42 = B 42 V T = 99.43
The equivalent IED fuzzy evaluation matrix B4 and its numerical value T4:
B4 = 0.5(B41 + B42) = [0.9737, 0.0263, 0, 0, 0]
T4 = B4·V T = 99.34
(5)
The MU fuzzy evaluation matrix R5 and its numerical value T5:
B 5 = w 5 R u 5 = [ 0.0831 , 0.2279 , 0.1978 , 0.1932 , 0.2036 , 0.0943 ] [ 0.9925 1.0000 1.0000 1.0000 1.0000 0.0075 0 0 0 0 0 0 0 0 0 0 0 0 0 0 0 0 0 0 0 ] = [ 0.9994 ,   0 . 0006 ,   0 ,   0 ,   0 ]
T 5 = B 5 V T = 99.99
(6)
The fuzzy evaluation matrix S and its numerical value T:
S = w B T = [ 0.3559 , 0.1116 , 0.1858 , 0.2574 , 0.0893 ] [ 0.9417 0.9738 0.9806 0.9737 0.9994 0.0583 0.0262 0.0194 0.0263 0.0006 0 0 0 0 0 0 0 0 0 0 0 0 0 0 0 ] = [ 0.9659 ,   0 . 0341 ,   0 ,   0 ,   0 ]
T = S v T = 99.15
The equipment FCE result of case 1 is shown in Table 24. All of the equipment is newly purchased in case 1. The status evaluation of the intelligent substation SCADA system of case 1 is 99.15 or “in Good Condition” and no inspection or maintenance schedule is required. Taipower company Tai-Tam substation CBM platform of the intelligent substation SCADA system is shown in Figure 5.
The system in case 2 is old and has run for years, with all of the switches functioning in abnormal status, as shown in Table 25. The status evaluation of the SCADA system of case 2 is 69.07 or “Immediate Inspection and Maintenance Required”, as shown in Table 24. Although the SCADA system has a high reliability network configuration, its reliability is reduced drastically due to the serious deterioration of the switch, and immediate maintenance of all switches is required. The recommended maintenance order for the switches is Switch_C → Switch_A, Switch_B, Switch_E, and Switch_F → Switch_D. If the system is still in critical condition after the communication problem is resolved, the SCADA HMI software should be maintained too.

5. Conclusion

Smart substations play a vital role in power systems. However, the installation of a large number of secondary equipment makes the traditional correct maintenance and time base maintenance unable to meet the system requirements. It is imperative to develop a new equipment maintenance management strategy. In recent years, equipment maintenance strategies have been further developed and optimized by monitoring equipment abnormalities and considering the importance of equipment. Implementing a CBM system for a smart substation can effectively avoid over-maintenance or lack of maintenance of equipment, reducing unnecessary power outage tests, as well as the maintenance workload and cost. It can significantly improve the system operational reliability and economic efficiency.
In contrast to a conventional maintenance strategy, a condition-based maintenance and management strategy is proposed in this study, where equipment status information is gathered through the IEC 61,850 communication protocol. The relative deterioration degree theory (RDD) and fuzzy theory (FT) are used to evaluate the condition of the equipment, combining the subjective analytic hierarchy process (AHP) method with the objective entropy weighting method to analyze the important factor of equipment. The fuzzy comprehensive evaluation (FCE) method is applied to evaluate the equipment of an intelligent substation SCADA system based on the equipment condition and their importance. The evaluated equipment includes the server, SCADA HMI software, switch, IED, and MU.
Each equipment in the substation plays a different role according to its function. Assigning them reasonable weights by the scientific approach is an important process for state evaluation. The comprehensive weighting method proposed in this paper that combines the subjective analytic hierarchy process (AHP) method and the objective entropy weighting method can inherit the advantages of two kinds of weighting methods. This approach not only presents the subjective professional experience of decision makers, but also considers the truth of the objective facts. It can accurately evaluate equipment status in the smart substation control system.
The result shows that the equipment status maintenance and management platform developed in this study can diagnose the equipment operating status in real time. The inspection and maintenance personnel can analyze the overall equipment condition by knowing which one of the four status ratings, i.e., "in Good Condition", "Attention Required", "in Critical Condition", and "Immediate Inspection and Maintenance Required", the equipment status has, and can determine the priority for equipment maintenance. The evaluation result can serve as a valuable reference to utility companies when making maintenance plans.

Author Contributions

Conceptualization, J.-C.G. and C.-H.L.; methodology, J.-C.G. and C.-H.L.; software, C.-H.L.; validation, K.-Y.C. and M.-T.Y.; formal analysis, M.-T.Y.; investigation, K.-Y.C.; resources, C.-H.L.; data curation, M.-T.Y.; writing—original draft preparation, K.-Y.C. and C.-H.L.; writing—review and editing, M.-T.Y.; supervision, J.-C.G.; project administration, J.-C.G.

Funding

This research received no external funding.

Conflicts of Interest

The authors declare no conflicts of interest.

Nomenclature

AHPAnalytic Hierarchy Process
CBCircuit Breaker
CBMCondition-based Maintenance
CTCurrent Transformer
EMIElectromagnetic Interference
FCE Fuzzy Comprehensive Evaluation
FT Fuzzy Theory
GOOSEGeneric Object-Oriented Substation Events
HMI Human-machine Interface
HSR High-Availability Seamless Redundancy
IEC International Electrotechnical Commission
IED Intelligent Electronic Device
MMSManufacturing Message Specification
MU Merging Unit
PM Preventive Maintenance
PRP Parallel Redundancy Protocol
PT Potential Transformer
RDD Relative Deterioration Degree
SCADA Supervisory Control and Data Acquisition
SV Sampling Value
TBM Time-Based Maintenance
VLAN Virtual Local Area Network

References

  1. Orlowska, T.; Balzer, G.; Halfmann, M. Lifecycle management of circuit breaker by application of reliability centered maintenance. CIGRE 2000 Sess. 2000, 13–103. Available online: https://www.semanticscholar.org/paper/Life-cycle-management-of-circuit-breakers-by-of-Orlowska-Balzer/8e7501a7e6561108aa232a8f062fef369651d829 (accessed on 14 October 2019).
  2. Ye, Y.B.; Xie, M.; Huang, T.G. Research on condition-based maintenance in relay protection. In Proceedings of the 2017 4th International Conferences on Information Science and Control Engineering, Changsha, China, 21–23 July 2017; pp. 1627–1631. [Google Scholar]
  3. Maity, A.; Zaremby, D.; McMullen, D. Automated scheduling using condition based maintenance. In Proceedings of the 2011 IEEE Conferences on Prognostics and Health Management, Montreal, QC, Canada, 20–23 June 2011; pp. 1–8. [Google Scholar]
  4. On-Line Diagnostics for Condition Based and Reliability Centered Maintenance. Available online: http://www.stri.se/wwwpublic/GRIDTECH-On-line-Diagnostics.pdf (accessed on 1 March 2017).
  5. Liao, R.J.; Wang, Q.; Luo, S.J. Condition assessment model for power transformer in service based on fuzzy synthetic evaluation. Autom. Electr. Power Syst. 2008, 32, 70–75. [Google Scholar]
  6. Lin, P.C.; Gu, J.C.; Yang, M.T. Intelligent maintenance model for condition assessment of circuit breakers using fuzzy set theory and evidential reasoning. IET Gener. Transm. Distrib. 2014, 8, 1244–1253. [Google Scholar] [CrossRef]
  7. Li, Z.; Dai, Z.; Jiao, Y. Research on condition-based maintenance strategy of protection systems based on multistage fuzzy comprehensive evaluation. In Proceedings of the 2014 11th International Conferences on Fuzzy Systems and Knowledge Discovery, Xiamen, China, 19–21 August 2014; pp. 268–272. [Google Scholar]
  8. Zhao, D.; Liang, W.; Zhang, X. Relay protection condition assessment based on variable weight fuzzy synthetic evaluation. In Proceedings of the 2014 IEEE Conferences on Technologies for Sustainability, Portland, OR, USA, 24–26 July 2014; pp. 115–120. [Google Scholar]
  9. Qian, P.; Tian, X.; Kanfoud, J.; Lee, J.L.Y.; Gan, T. A novel condition monitoring method of wind turbines based on long short-term memory neural network. Energies 2019, 12, 3411. [Google Scholar] [CrossRef]
  10. Yang, Y.; Sørensen, J.D. Cost-optimal maintenance planning for defects on wind turbine blades. Energies 2019, 12, 998. [Google Scholar] [CrossRef]
  11. Asgarpour, M.; Sørensen, J.D. Bayesian based diagnostic model for condition based maintenance of offshore wind farms. Energies 2018, 11, 300. [Google Scholar] [CrossRef]
  12. Nielsen, J.S.; Sørensen, J.D. Bayesian estimation of remaining useful life for wind turbine blades. Energies 2017, 10, 664. [Google Scholar] [CrossRef]
  13. Tian, F.; Jing, Z.; Zhao, H.; Zhang, E.; Liu, J. A synthetic condition assessment model for power transformers using the fuzzy evidence fusion method. Energies 2019, 12, 857. [Google Scholar] [CrossRef]
  14. Zeng, F.F.; Sun, J.H.; Wu, X. Software reliability modeling, measuring and forecasting in computer supervisory system. Chin. Comput. Eng. Applications 2002, 38, 95–97. [Google Scholar]
  15. Wang, C. Research on Reliability of Digital Substation Relay Protection System. Master’s Thesis, National Chekiang University, Hangzhou, China, 2013. [Google Scholar]
  16. Pascal, J.; Zurfluh, F. Sensor interface suitable for IEC 60044-7 and 8 metering accuracy class 0.1 and protection class 5P. In Proceedings of the 2013 IEEE International Symposium on Industrial Electronics, Taipei, Taiwan, 28–31 May 2013; pp. 1–4. [Google Scholar]
  17. Zhao, D.L.; Liu, S.L. Failure model analysis of communication system in intelligent substation. J. Jiyuan Vocat. Tech. Coll. 2014, 13, 9–12. [Google Scholar]
  18. Qiu, J.; Wang, H.F.; Chen, Z.G. Effectiveness evaluation model of smart substation automation system. Autom. Electr. Power Syst. 2013, 37, 87–94. [Google Scholar]
  19. Schneidewind, N.F. Software reliability model with optimal selection of failure data. IEEE Trans. Soft. Eng. 1993, 19, 1095–1104. [Google Scholar] [CrossRef]
  20. Peng, Z.F. Research of Secondary Equipment Performance Evaluation Methods in Smart Substation. Master’s Thesis, North China Electric Power University, Beijing, China, 2014. [Google Scholar]
  21. Liao, R.; Zheng, H.; Grzybowski, S. An integrated decision-making model for condition assessment of power transformers using fuzzy approach and evidential reasoning. IEEE Trans. Power Deliv. 2011, 26, 1111–1118. [Google Scholar] [CrossRef]
  22. Satty, T.L. What is the analytic hierarchy process? Math. Model. Decis. Support 1988, 48, 109–121. [Google Scholar]
  23. Satty, T.L. The seven pillars of the analytic hierarchy process. Mult. Criteria Decis. Mak. New Millenn. 2001, 7, 15–37. [Google Scholar]
  24. Shannon, C.E. A mathematical theory of communication. ACM SIGMOBILE Mob. Comput. Commun. Rev. 2001, 5, 3–55. [Google Scholar] [CrossRef]
  25. Deng, C.; Liu, J.; Liu, Y. A fuzzy comprehensive evaluation for metropolitan power grid risk assessment. In Proceedings of the 2016 International Conferences on Smart Grid and Clean Energy Technologies, Chengdu, China, 19–22 October 2016; pp. 1–5. [Google Scholar]
Figure 1. The flowchart of the FCE method.
Energies 12 03892 g001
Figure 2. The example configuration of the proposed intelligent substation SCADA system.
Energies 12 03892 g002
Figure 3. Figure 3. The membership functions of the linguistic variables.
Energies 12 03892 g003
Figure 4. The hardware configuration of the example platform.
Energies 12 03892 g004
Figure 5. The CBM platform of the intelligent substation SCADA system.
Energies 12 03892 g005
Table 1. The definition and explanation of the evaluation scales.
Evaluation ScaleDefinitionExplanation
1Equally importantThe two factors are equally important.
3Slightly more importantOne factor is only slightly more important than the other.
5Significantly more importantOne factor is significantly more important than the other.
7Highly more importantOne factor is highly more important than the other.
9Absolutely more importantOne factor is absolutely more important than the other.
2,4,6,8In-between scalesThe degree of relative importance lies between the two adjacent scales.
Table 2. Order of AHP method and relative random index values.
Order (n)12345678910
RI0.000.000.580.901.121.241.321.411.451.49
Table 3. Equipment status ratings and the corresponding numerical evaluation ranges.
Numerical EvaluationEquipment Status
90~100In Good Condition
80~90Attention Required
70~80In Critical Condition
0~70Immediate Inspection and Maintenance Required
Table 4. Server status data and status evaluation.
Influencing FactorIndex TypeMeasured ValueRDD/Status Membership
u11 Equipment availabilityLarger-is-better0.96640.8188/Excellent
u12 Communication port failure rate (%) Less-is-better00/Excellent
u13 CPU usage rate (%)Less-is-better320/Excellent
u14 Memory usage rate (%)Less-is-better630.0750/Excellent
u15 Transmission load rate (%)Less-is-better110/Excellent
Table 5. SCADA human–machine interface (HMI) software status data and status evaluation.
Influencing FactorIndex TypeMeasured ValueRDD/Status Membership
u21 Software availabilityLarger-is-better0.99980.9990/Excellent
u22 Data receiving rate (%)Larger-is-better1001.0000/Excellent
u23 Data access time (s)Less-is-better100.1667/Excellent
u24 Failure repair time (hr)Less-is-better240/Excellent
Table 6. Switches status data.
Influencing FactorMeasured Values
ABCDEF
u31 Equipment availability0.94980.98720.99010.99010.98720.9872
u32 Communication port failure rate (%)000000
u33 Packet lost rate (%)000000
u34 CPU usage rate (%)1818242399
u35 Transmission load rate (%)332126191615
Influencing FactorRDD/Status Membership
ABCDEF
u31 Equipment availability0.5845/Excellent0.8941/Excellent0.8955/ Excellent0.8955/Excellent0.8941/Excellent0.8941/Excellent
u32 Communication port failure rate (%)0/Excellent0/Excellent0/Excellent0/Excellent0/ Excellent0/Excellent
u33 Packet lost rate (%)0/Excellent0/Excellent0/Excellent0/Excellent0/Excellent0/Excellent
u34 CPU usage rate (%)0.1368/ Excellent0.1368/Excellent0.2/ Excellent0.1895/ Excellent0.0421/ Excellent0.0421/ Excellent
u35 Transmission load rate (%)0/Excellent0/Excellent0/Excellent0/Excellent0/Excellent0/Excellent
A: PT-G7828_A, B: PT-G7828_B, C: PT-G503_A, D: PT-G503_B, E: PT-7728_A, F: PT-7728_B.
Table 7. Intelligent electronic device (IED) status data and status evaluation.
Influencing FactorIndex TypeMeasured ValueRDD/Status Membership
ABAB
u41 Equipment availabilityLarger-is-better0.99500.99500.8977/Excellent0.8977/Excellent
u42 Operation failure rate (%)Less-is-better000/Excellent0/Excellent
u43 Communication failure rate (%)Less-is-better000/Excellent0/Excellent
u44 Operating environment (°C)Less-is-better27270/Excellent0/Excellent
u45 CPU usage rate (%)Less-is-better21190.1684/Excellent0.1474/Excellent
Table 8. Merging unit (MU) status data and status evaluation.
Influencing FactorIndex TypeMeasured ValueRDD/Status Membership
u51 Equipment availabilityLarger-is-better0.99670.8985/Excellent
u52 SV packet lost rate (%)Less-is-better00/Excellent
u53 SV code error rate (%)Less-is-better00/Excellent
u54 Transmission time (μs)Less-is-better10/Excellent
u55 Time synchronization accuracy (μs)Less-is-better0.10.1000/Excellent
u56 CPU usage rate (%)Less-is-better200.1000/Excellent
Table 9. Membership degrees of server influencing factors (Ru1).
IndexMembership Degree
R1R2R3R4R5
u110.59380.4062000
u121.00000000
u131.00000000
u141.00000000
u151.00000000
Table 10. Membership degrees of SCADA HMI software influencing factors (Ru2).
IndexMembership Degree
R1R2R3R4R5
u211.00000000
u221.00000000
u230.66670.3333000
u241.00000000
Table 11. Membership degrees of switch influencing factors (Ru3).
IndexMembership Degree
R1R2R3R4R5
u3110.97060.0294000
u3121.00000000
u3131.00000000
u3140.81580.1842000
u3151.00000000
u3210.97060.0294000
u3221.00000000
u3231.00000000
u3240.81580.1842000
u3251.00000000
u3310.97740.0226000
u3321.00000000
u3331.00000000
u3340.50000.500000
u3351.00000000
u3410.97740.0226000
u3421.00000000
u3431.00000000
u3440.55260.4474000
u3451.00000000
u35100.93190.068100
u3521.00000000
u3531.00000000
u3541.00000000
u3551.00000000
u3610.97060.0294000
u3621.00000000
u3631.00000000
u3641.00000000
u3651.00000000
Table 12. Membership degrees of IED influencing factors (Ru4).
IndexMembership Degree
R1R2R3R4R5
u4110.98870.1113000
u4121.00000000
u4131.00000000
u4141.00000000
u4150.65790.3421000
u4210.98870.1113000
u4221.00000000
u4231.00000000
u4241.00000000
u4250.76320.2368000
Table 13. Membership degrees of MU influencing factors (Ru5).
IndexMembership Degree
R1R2R3R4R5
u510.99250.0075000
u521.00000000
u531.00000000
u541.00000000
u551.00000000
u561.00000000
Table 14. The subjective weights of the intelligent substation SCADA system influencing factors.
Influencing Factoru1u2u3u4u5Subjective Weight (w)
u11.00002.89142.47211.46123.14680.3559
u20.34591.00000.51090.43911.34570.1116
u30.40451.95731.00000.63712.51960.1858
u40.68442.27741.56961.00002.81430.2574
u50.31780.74310.39690.35531.00000.0893
Table 15. The weights of the server influencing factors.
Influencing Factoru11u12u13u14u15Subjective WeightIndex EntropyObjective WeightComprehensive Weight (w1)
u111.00000.61771.42252.51891.22440.2240h110.41970.12670.1435
u121.61891.00001.68614.01451.63290.3262h1200.21830.3600
u130.70300.59311.00002.12271.21390.1863h1300.21830.2056
u140.39700.24910.47111.00000.47640.0854h1400.21830.0943
u150.81670.61240.82382.09921.00000.1781h1500.21830.1966
Table 16. The weights of the SCADA HMI software influencing factors.
Influencing Factoru21u22u23u24Subjective WeightIndex EntropyObjective WeightComprehensive Weight (w2)
u211.00002.46623.55691.71000.4435h2100.27740.4664
u220.40551.00002.46621.44220.2453h2200.27740.2580
u230.28110.40551.00000.84340.1240h230.39550.16770.0788
u240.58480.69341.18571.00000.1872h2400.27740.1969
Table 17. The subjective weights of the switch influencing factors.
Influencing Factoru31u32u33u34u35Subjective Weight
u311.00000.61770.70032.51891.61660.2020
u321.61891.00001.47632.82573.98570.3489
u331.42800.67741.00002.12271.83720.2342
u340.39700.35390.47111.00000.81810.1006
u350.61860.25090.54431.22241.00000.1143
Table 18. The objective and comprehensive weights of the influencing factors of Switch A and Switch B.
Influencing FactorSwitch ASwitch B
Index EntropyObjective WeightComprehensive Weight (w31)Index EntropyObjective WeightComprehensive Weight (w32)
u31h3110.08250.19860.1944h3210.08250.19860.1944
u32h31200.21640.3659h32200.21640.3659
u33h31300.21640.2456h32300.21640.2456
u34h3140.29680.15220.0742h3240.29680.15220.0742
u35h31500.21640.1199h32500.21640.1199
Table 19. The objective and comprehensive weights of the influencing factors of Switch C and Switch D.
Influencing FactorSwitch CSwitch D
Index EntropyObjective WeightComprehensive Weight (w33)Index EntropyObjective WeightComprehensive Weight (w34)
u31h3310.06720.20720.2005h3410.06720.20700.1997
u32h33200.22100.3695h34200.22190.3698
u33h33300.22100.2480h34300.22190.2482
u34h3340.43070.12650.0610h3440.42720.12710.0611
u35h33500.22100.1210h34500.22190.1212
Table 20. The objective and comprehensive weights of the influencing factors of Switch E and Switch F.
Influencing FactorSwitch ESwitch F
Index EntropyObjective WeightComprehensive Weight (w35)Index EntropyObjective WeightComprehensive Weight (w36)
u31h3510.15460.17450.1763h3610.08250.18660.1855
u32h35200.20640.3601h36200.20340.3548
u33h35300.20640.2417h36300.20340.2382
u34h35400.20640.1038h36400.20340.1023
u35h35500.20640.1180h36500.20340.1162
Table 21. The subjective weights of IED influencing factors.
Influencing Factoru41u42u43u44u45Subjective Weight
u411.00000.28180.35550.80110.78640.1036
u423.54911.00001.09752.18242.20390.3236
u432.81290.91121.00002.07942.36470.2981
u441.24830.45820.48091.00001.17280.1434
u451.27160.45370.42290.85271.00000.1314
Table 22. The objective and comprehensive weights of the influencing factors of IED A and IED B.
Influencing FactorIED AIED B
Index EntropyObjective WeightComprehensive Weight (w41)Index EntropyObjective WeightComprehensive Weight (w42)
u41h4110.03850.21700.1083h4210.03850.20810.1047
u42h41200.21920.3419h42200.21640.3401
u43h41300.21920.3149h42300.21640.3133
u44h41400.21920.1515h42400.21640.1507
u45h4150.39920.13170.0834h4250.34010.14280.0911
Table 23. The weights of the MU influencing factors.
Influencing Factoru51u52u53u54u55u56Subjective WeightIndex EntropyObjective WeightComprehensive Weight (w5)
u511.00000.41370.35440.43110.38101.09170.0853h510.02750.16280.0831
u522.41731.00001.31971.20971.06742.39160.2274h5200.16740.2279
u532.82140.75771.00000.97140.99132.01470.1974h5300.16740.1978
u542.31980.82671.02941.00000.96881.93580.1928h5400.16740.1932
u552.62490.93691.00881.03221.00001.99610.2031h5500.16740.2036
u560.91600.41810.49640.51660.50101.00000.0941h5600.16740.0943
Table 24. The equipment FCE result of case 1 and 2.
EquipmentEvaluation Result
Case 1Case 2
Server98.5479.46
SCADA HMI Software99.3555.74
Switch_A99.5222.64
Switch_B99.5222.64
Switch_C99.137.74
Switch_D99.2022.68
Switch_E99.8622.64
Switch_F99.8622.64
IED_A99.2588.89
IED_B99.4388.89
MU99.9987.72
SCADA System99.1569.07
Table 25. Case 2 measured value of influencing factor of equipment.
ServerSCADA HMISwitchIEDMU
IF *1MVIFMVIFMV *2IFMVIFMV
ABCDEFAB
u110.9025u210.9991u310.94980.94980.96100.96100.94980.9498u410.98510.9851u510.9900
u120u2280u32334333u4211u520
u1332u2320u33223222u4300u530
u1480u24120u349090100909090u445050u545
u1511 u35100100100100100100u452525u550.6
u5620
*1 IF: Influencing factor, *2 MV: Measured value.

