Article

Planning of the Multi-Energy Circular System Coupled with Waste Processing Base: A Case from China

1
School of Electronic Information and Electrical Engineering, Shanghai Jiao Tong University, Minhang District, Shanghai 200240, China
2
State Grid (Suzhou) City & Energy Research Institute Co., Ltd., Huqiu District, Suzhou 215010, China
3
Electric Power Planning & Engineering Institute, Xicheng District, Beijing 100011, China
4
Department of Electronic and Electrical Engineering, University of Bath, Calverton Down, Bath BA2 7AY, UK
*
Author to whom correspondence should be addressed.
Energies 2019, 12(20), 3910; https://doi.org/10.3390/en12203910
Submission received: 25 July 2019 / Revised: 14 September 2019 / Accepted: 12 October 2019 / Published: 15 October 2019

Abstract

:
With the accelerated development of urbanization, waste disposal has become a tough problem. If waste cannot be disposed properly, it will lead to environment pollution and waste of resources. Since the energy utilization of the Waste Processing Base (WPB) has not been considered thoroughly, optimal planning of the Multi-Energy Circular System (MECS) coupled with the WPB is studied in this paper. Based on a typical WPB, this paper adds Power to Gas (P2G) and energy storage equipment, and applies a bi-level optimization model to optimize energy utilization. The minimum of total annual cost is the objective of the upper model, whose decision variables are the capacity of each equipment. The minimum annual operating cost is the lower model’s objective whose decision variables are the control parameters of certain energy equipment. Finally, a practical WPB is used for the demonstration and simulation of the proposed planning scheme. The analysis of the simulation results indicates that the collaborative optimization of the MECS coupled with WPB is effective, and improves the benefits of energy, economy, and environment enormously.

1. Introduction

Nowadays, energy, economy, and environment issues are becoming increasingly complicated, which attracts the general attention of governments around the world [1,2,3,4,5,6]. The traditional waste disposal methods applied most are landfill and incineration, which have been conducted in waste incineration power plants in Denmark and landfill in China. The existing energy utilization methods in a waste processing base (WPB) are relatively simple and not comprehensive, leading to the waste of energy and secondary pollution [7,8]. Therefore, collaborative planning of a multi-energy circular system (MECS) and WPB is essential to achieve coordinated energy utilization and find effective solutions to environmental issues.
The integration and collaboration of different energies in an integrated energy system can effectively improve the utilization of energy [9,10,11,12,13,14,15]. A generalized multi-energy system refers to a large-scale system composed of the development, conversion, transportation, scheduling, and other manipulations of a variety of energies, including coal [16], natural gas [17], water [18], wind [19], solar energy [20], and other forms of energy [21]. It is called a multi-energy system [22] for different kinds of energy have a complex coupling relationship in each cyclic process and then form an interrelated organic whole. Scholars usually regard electric power, thermal energy, and gas systems as the major research subjects of multi-energy (or integrated energy) systems [23,24,25,26,27], focusing on the internal problems of the three systems and their coordination and optimization in different manipulations at different spatial and temporal scales [28].
Reference [29] proposed an optimal planning method for a multi-energy system (MES) with both an electricity network and a heat network [30], introducing a grey fuzzy integer programming (GFIP) method and its application regional waste management planning under uncertainty. However, energy and environmental benefits are not considered in [29,30]. Other studies on multi-energy systems are as follows: In [31], the optimization is carried out to minimize the cost and maximize the primary energy saving of the system. The carbon emission reduction ratio is also calculated to assess the environmental performance of the microgrid. In [32,33], the capacity and operation of the CCHP system are optimized by the genetic algorithm (GA) so as to maximize the technical, economic, and environmental benefits in comparison to a separation production system. Reference [34] describes a mixed-integer linear programming model. However, there are fewer types of equipment that can be selected in the planning, which is also limited to the heat between stations. In [35], the limitation of the single-objective optimization is pointed out, while the multi-objective optimization of the system is carried out. Reference [36] proposes a generic and accurate dynamic operation model considering the variable efficiencies and the transitional status of energy converters. In [37], a dynamic programming algorithm is developed to maximize the profits of CHPs. Most of the current studies on multi-energy systems have already clarified some issues, but there are few planning documents that consider multi-energy planning issues with the WPB together, as the phenomenon of garbage siege becomes more serious.
From references [31,32,33,34,35,36,37], the utilization of energy in a multi-energy system can be improved by planning and dispatching the capacity of the energy using equipment. This paper provides a schematic structure with mathematic models of each unit in the WPB. Considering the interconnection as well as the dispatch of a multi-energy system, a bi-level optimization model is then presented. Finally, the benefits of energy, economy, and environment are realized by planning and dispatching the capacity of equipment in the MECS, coupled with a practical WPB.
The innovations of this paper are as follows: (1) The planning of the MECS applied to the WPB is proposed, which can realize comprehensive benefits of energy, economy, and environment; (2) considering the advantage of integrated energy systems, the optimization problem of multi-energy collaborative dispatching is integrated into the bi-level planning model proposed.
The structure of this paper is as follows: The first two sections introduce the physical planning architecture and models of MECS in the WPB. The third part constructs a bi-level optimization model for the multi-energy system of WPB, and the genetic algorithm is introduced to solve the model. The fourth part combines the actual examples to analyze the energy, environment, and economy benefits of the planned multi-energy system of WPB. Finally, the conclusion is given.

2. Design of Multi-Energy Planning

In the planning of multi-energy systems, the most basic method is to achieve the energy, economic, and environmental goals of the system through the location of energy sources and path optimization of energy network. However, for an actual multi-energy system, the energy type, load characteristics, and environmental factors in the system will affect the source, network, load, and storage planning of the multi-energy complementary system, resulting in the planning result not being truly optimal. Therefore, when planning the actual multi-energy system, it is necessary to analyze the system in detail and construct a suitable, physical, layered architecture.

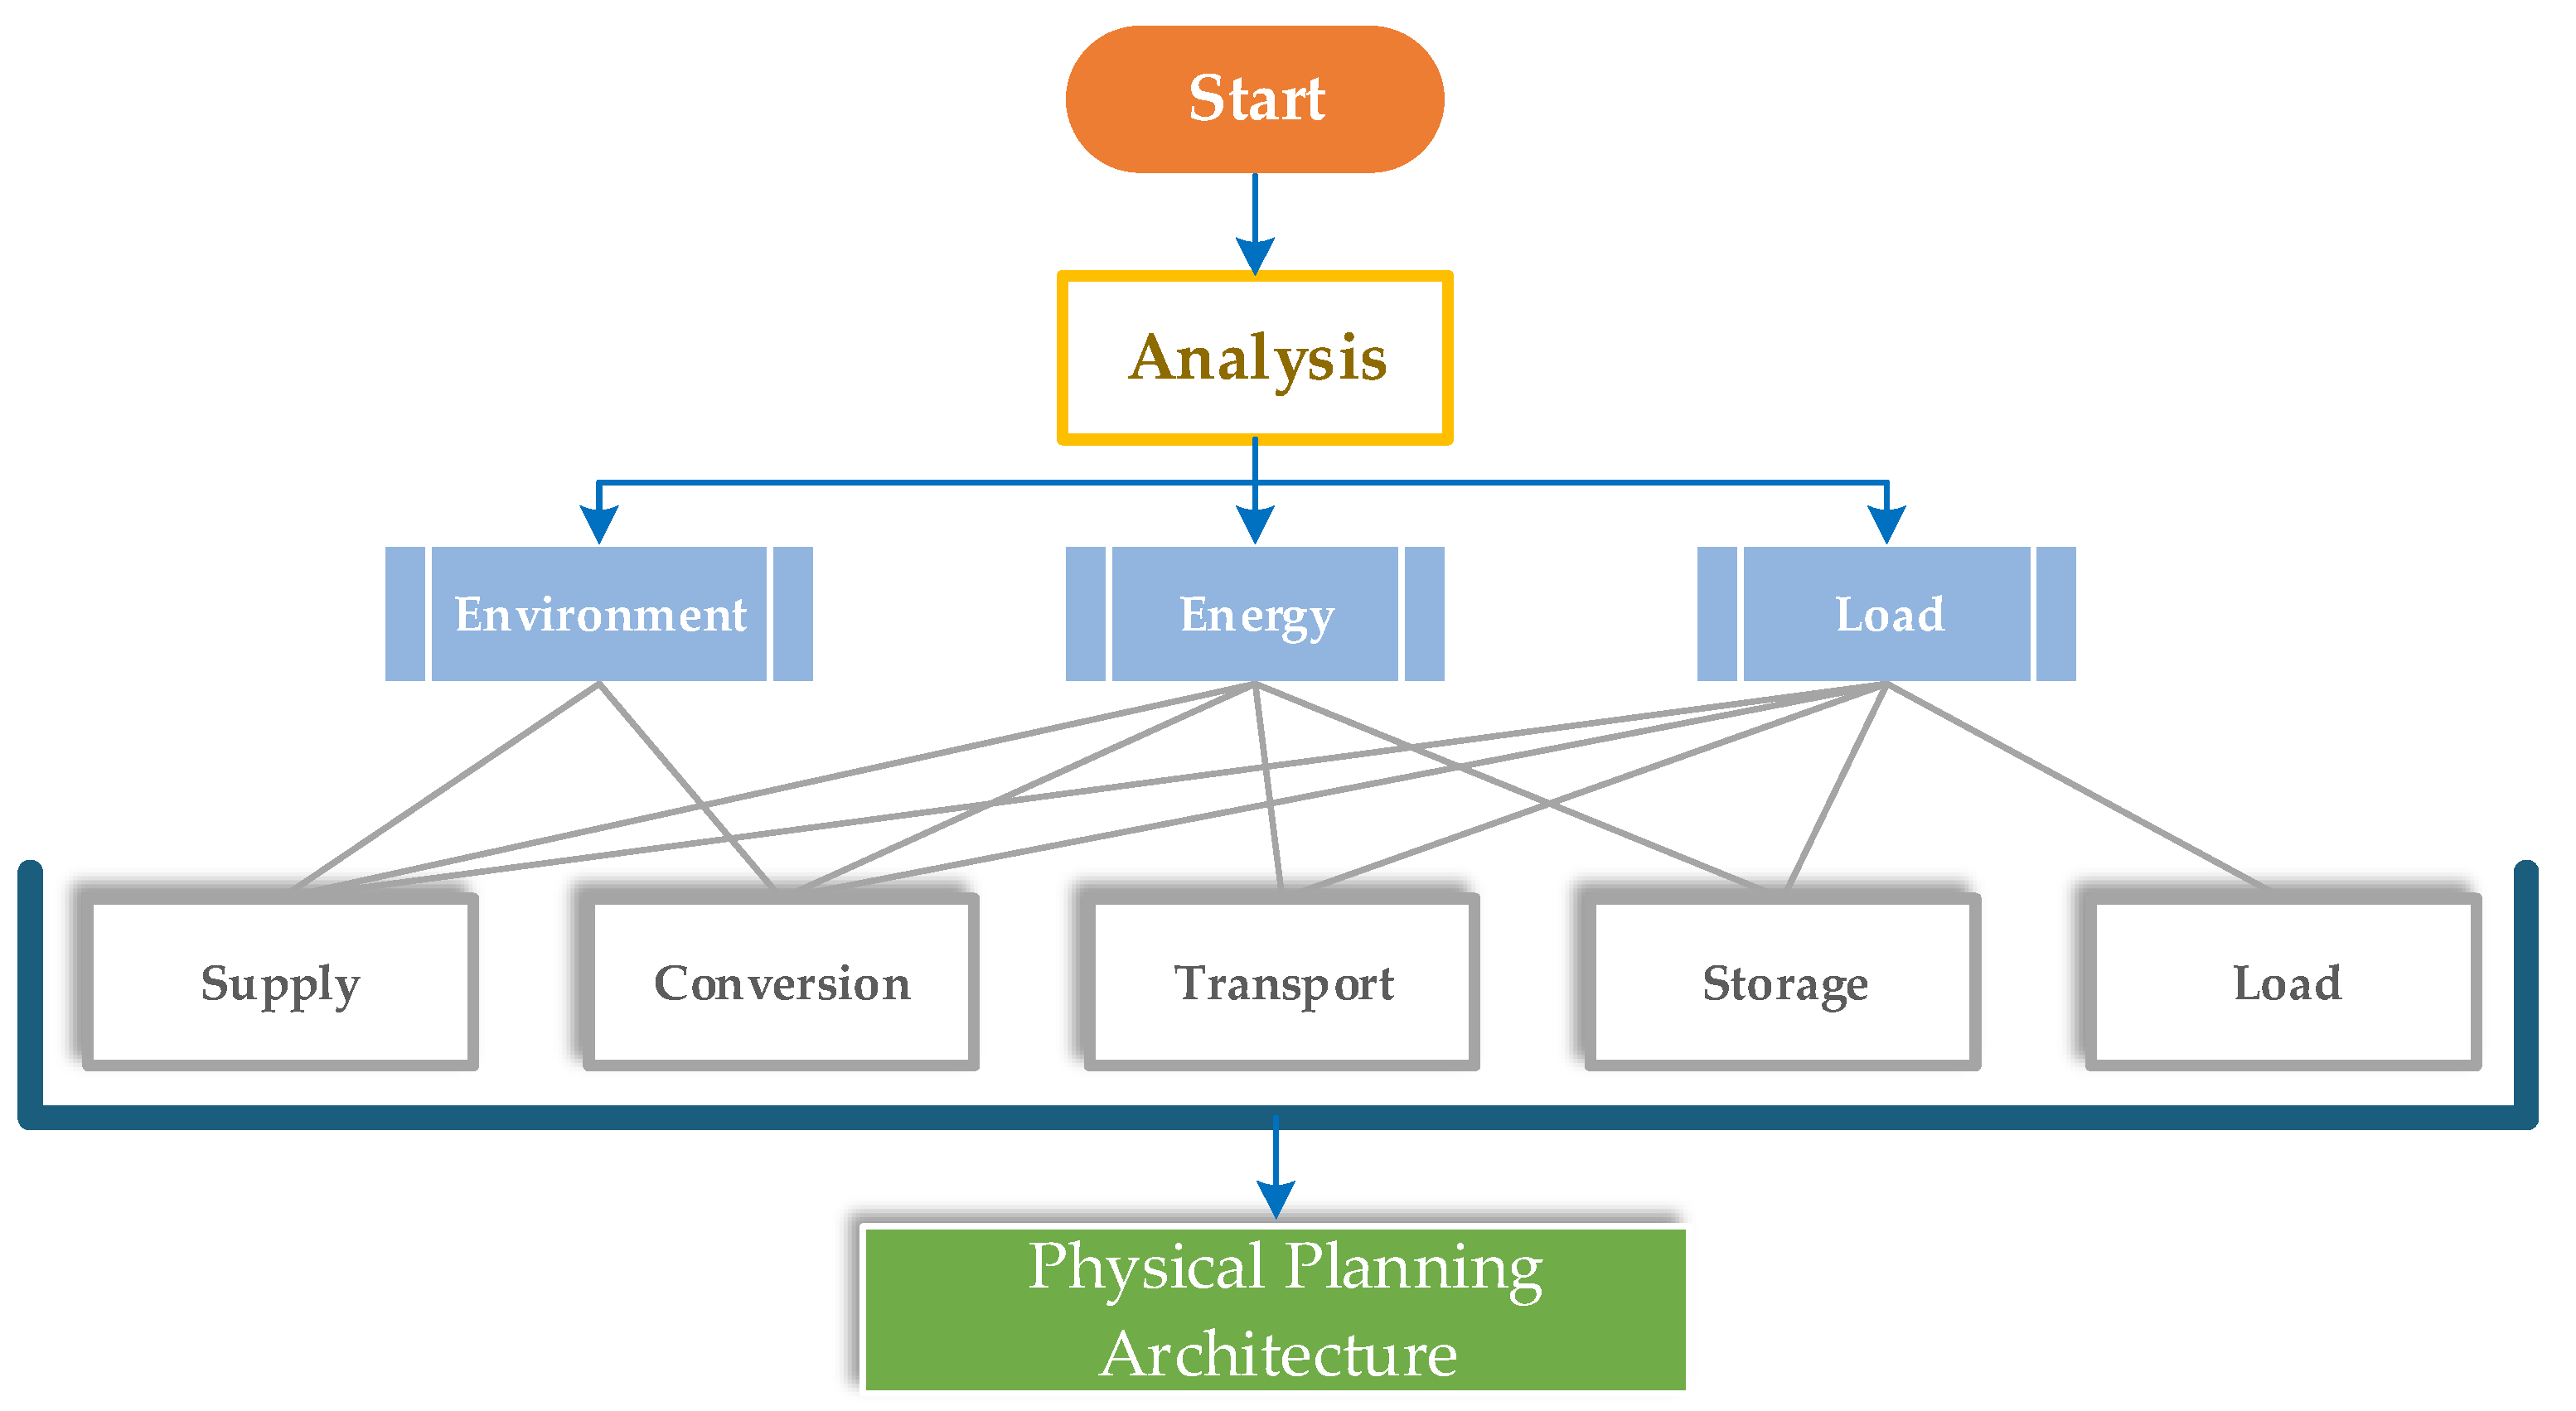
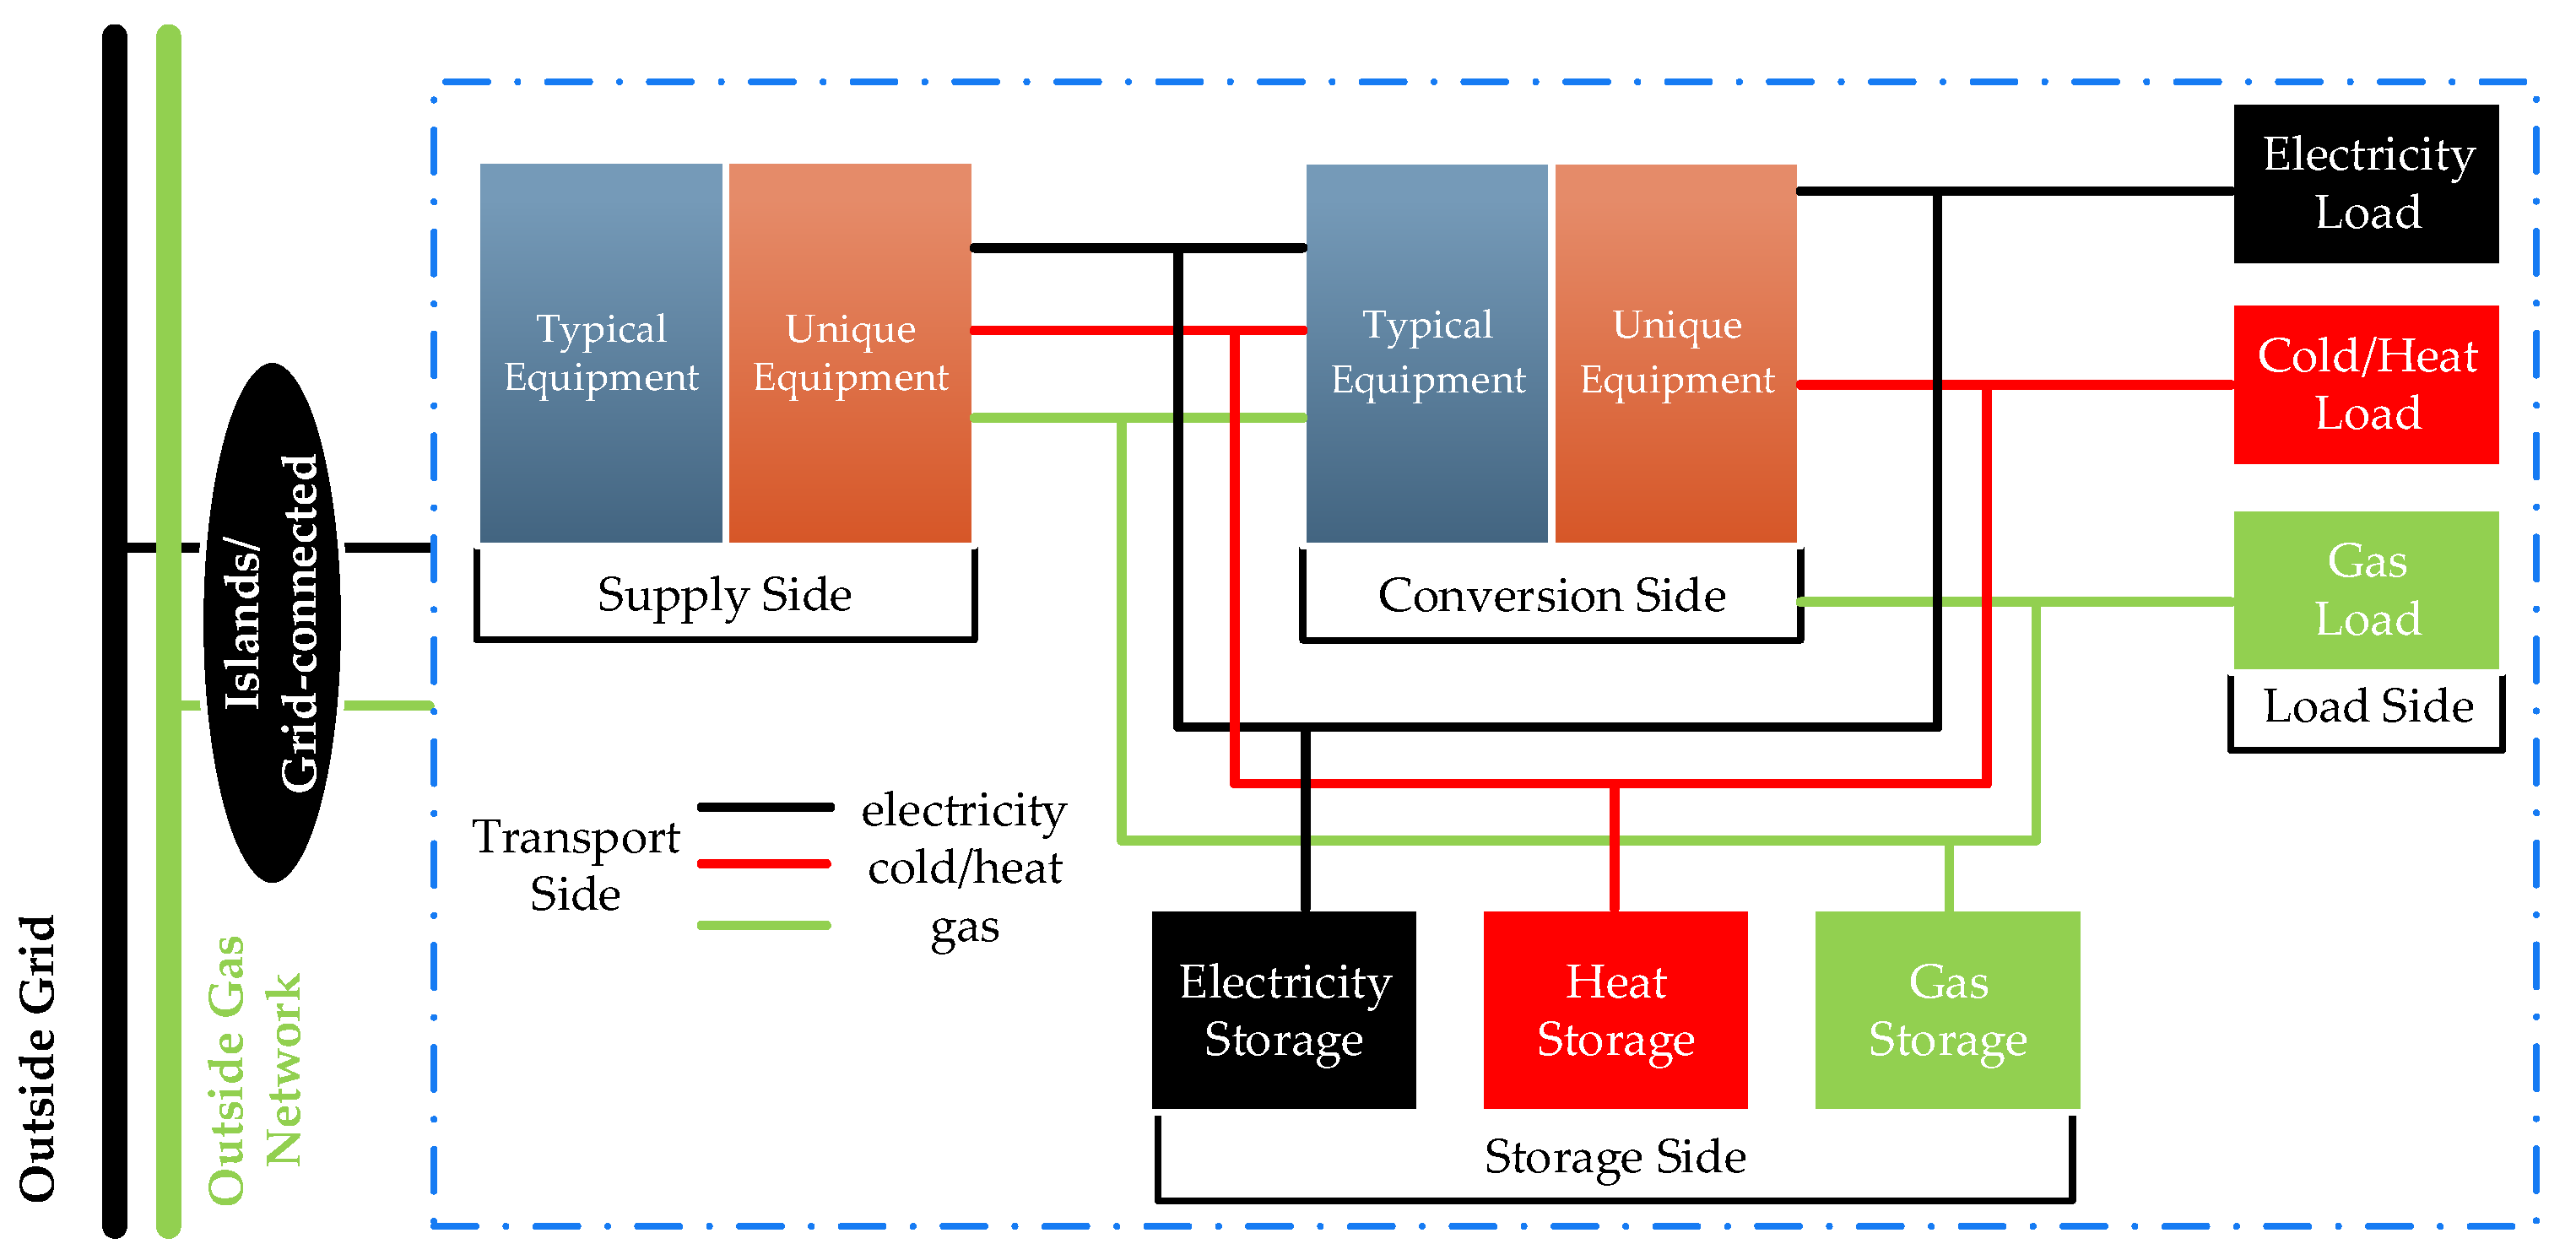
2.1. Physical Planning Architecture

When planning for a multi-energy system, first construct its physical planning architecture to determine the coupling modes and flow directions of the energy components and various energy sources included in the system. The specific construction process of the physical planning architecture is shown in Figure 1. The physical planning architecture is divided into the supply side, the conversion side, the transport side, the energy storage side, and the load side. Based on the analysis of the environment, energy, and load factors of the multi-energy system, the impact of factor analysis on the planning architecture is figured out. Environmental factors are mainly related to the generation and conversion of energy, so the components on the supply side and the conversion side are affected. The energy factor involves the entire process of energy generation, conversion, transportation, and storage, so it affects all but the load side. The load factor is the last loop in the entire architecture, which can be traced back to every part of the architecture, so the load factor affects the entire physical planning architecture. Physical planning topology can be designed based on the factor analysis.
Figure 2 shows the physical planning architecture of a multi-energy system. It reveals the connection mode of the energy flow in the system. The energy equipment on the supply side and conversion side is divided into typical energy components and unique energy components. The operating status of multi-energy systems can be divided into two types: Islands and grid-connected. In China’s current energy network, only the electricity and natural gas networks form a large-scale coverage. Therefore, in the physical planning framework, the external network of multi-energy systems only shows the interaction of electricity and gas network. It should be noted that only the supply side, conversion side, load side, energy storage side, and the transport side are collectively represented in the energy flow relationship, and it is not indicated that these elements are geographically aggregated inside the system.

2.2. Models of Equipment in MES

Energy equipment in a multi-energy system can be divided into typical energy equipment and unique equipment. Typical energy equipment can be divided into energy supply, energy conversion, energy storage, and energy transmission equipment. As supplement and promotion, the actual multi-energy system has its own unique energy equipment.

2.2.1. Typical Energy Equipment

(1) Energy supply equipment
The energy supply equipment refers to the device that the input is a primary energy source, such as wind, photovoltaics, natural gas, etc., while the output is energy that can be directly used, such as electricity and heat. In the case of natural gas as a user load, it is generally converted to heat for use, so natural gas is not considered as a terminal energy source. The typical models in this section mainly cover wind power, photovoltaic power generation, gas boilers, gas turbines, and fuel cells. Due to space limitations, these models are not described here.
(2) Energy conversion equipment
Through the energy conversion equipment, secondary energy sources such as electricity, heat, and cold can be flexibly converted between each other. There are heat pumps for electric-thermal conversion, electric refrigerators for electric cooling, heat exchangers for heat-to-heat conversion, and absorption refrigeration for heat-cooling conversion. These models are not described here. In addition, the development of power-to-gas (P2G) technology has enabled energy to achieve electric-gas transition [38]. Therefore, this section considers it as a special energy conversion element.
Electricity can be converted into CH4 through P2G [39]
V P 2 G o u t = η P 2 G P P 2 G i n
where P P 2 G i n is the input power in kWh, η P 2 G is the conversion efficiency of P2G, and V P 2 G o u t is the output volume of CH4 in m3.
P2G is mainly subject to its rated power [39].
0 P P 2 G i n P P 2 G r a t e d
where P P 2 G r a t e d stands for the rated power of P2G.
(3) Energy storage equipment
The energy storage component can realize the energy transfer on the time scale by storing the energy, and can improve the stability and flexibility of the energy supply in the system. In addition to suppressing the volatility of renewable energy, electricity storage can also achieve the goal of peak load shifting. Heat/cold storage can be used to cope with the complex and variable load. Gas storage can be used as an indirect solution for electricity storage, thereby reducing its storage cost.
Assuming that the energy storage and discharge power are constant during the time period Δ t , The energy relationship before and after discharge is as follows [40]:
W ( t ) = W ( t Δ t ) + ( Q c η c Q d / η d ) Δ t
where W ( t Δ t ) and W ( t ) are energy stored in power/heat/gas storage equipment before and after energy storage or discharge. Q c and Q d are capacities of energy stored or released. η c and η d are energy storage and dissipation efficiency. The following constraints must be met to ensure the stable operation of the equipment [40]:
W min W W max
0 Q c Q c , max
0 Q d Q d , max
where W max and W min stand for the maximum and minimum value of stored energy. Q c , max and Q d , max are the maximum value of energy storage and discharge.
In order to reserve a certain amount of adjustment margin, the energy charged of the storage equipment after one cycle is restored to the original values of storage [40], that is
W T = W 0
where W 0 and W T are the power/heat/gas storage volume at the beginning and end.
(4) Energy transmission equipment
Ignoring the transmission speed of the energy itself, the transmission characteristics of the electricity cables, heat/cold, and gas pipelines are basically similar, and the expressions are as follows [41]:
{ p t o u t = p t i n ( 1 k p , l o s s L p ) h t o u t = h t i n ( 1 k h , l o s s L h ) v t o u t = v t i n ( 1 k g , l o s s L g )
where p t o u t , h t o u t , and v t o u t refer to the output electricity, heat/cold, and gas at the end of the transmission line in time t , and p t i n , h t i n , and v t i n refer to the input electricity, heat/cold, and gas in time t . k p , l o s s , k h , l o s s , and k g , l o s s are the unit loss rate of electricity, heat/cold, and gas transmission line. L p , L h , and L g are the length of electricity, heat/cold, and gas transmission line.

2.2.2. Unique Energy Equipment

WPB is taken as an example for explanation. The unique energy components of a WPB include waste incineration power plants, landfills, leachate treatment plants, biogas power plants, and biogas compression and purification stations.
(1) Waste incineration (WI) power plant
The waste incineration power generation refers to power generation by burning urban waste. In the process of waste incineration, a large amount of heat is generated. At the same time, the waste incineration plant will also produce leachate. The model of the WI is shown as follows [42,43]:
{ P W I = k P M w a s t e W I Q W I = k Q M w a s t e W I M l e a c h a t e W I = k l e a c h a t e M w a s t e W I
where P W I and Q W I respectively stand for the amount of power and waste heat generation in kWh, while M l e a c h a t e W I and M w a s t e W I are the amount of leachate produced and waste incineration in t . k P and k Q are the generation productiveness of power and heat in kWh/t, while k l e a c h a t e is the leachate production rate of unit waste incineration.
(2) Waste landfill (WL)
Landfill is a centralized dumping site of waste. The landfill product has two parts; one is landfill gas [44] that can be used as fuel, and the other is leachate [45], which is recycled to the leachate plant for reproduction. The more common model is as (10) and (11) shows.
V t g a s W L = { 2 W V 0 m ( 1 ω ) ( 1 e k t )     t < T 2 W V 0 m ( 1 ω ) ( e k T 1 ) e k t t T
In (10), V t g a s W L , m , k , and T stand for the biogas production rate in year t , the amount of annual waste landfill, the attenuation coefficient, and total operating years of the landfill. W is the amount of wet garbage in landfill. ω is the moisture content of wet garbage, and V 0 is the production of biogas in unit dry garbage, theoretically.
V t l e a W L = k l e a W L M w a s t e W L
where k l e a W L is the leachate production rate of unit waste incineration, and V t l e a W L is the volume of leachate produced.
(3) Leachate treatment (LT) plant
Biogas is obtained in LT. Leachate consumes electrical and thermal energy during processing and produces biogas. The model of LT [46] is as follows:
{ V g a s L T = γ g a s M l e a c h a t e L T P L T = γ P M l e a c h a t e L T Q L T = γ Q M l e a c h a t e L T
where M l e a c h a t e L T is the amount of the leachate treated in t , V g a s L T is the biogas obtained in m3, P L T and Q L T stand for electricity and heat consumption, and γ g a s is the biogas production rate, while γ P and γ Q are the power and heat consumption rate.
Part of the biogas generated by WL and LT is used for biogas power generation, and the other part for compression and purification.
(4) Biogas power plant (BP)
Biogas power generation technology is a new energy-comprehensive utilization technology that integrates environmental protection and energy conservation. The biogas generated by the anaerobic fermentation process enables the biogas generator to generate electricity [47].
P B P = k B P E β 1
where E is the total biogas generated by WL and LT, P B P is the electricity generated in kWh, k B P is the amount of power generated by unit volume of biogas in kWh/m3, and β 1 stands for the rate of biogas used for generation.
(5) Biogas compression and purification (BCP) plant
Purification of biogas refers to the removal of gases other than CH4 in biogas [48].
V C H 4 B C P = k B C P E ( 1 β 1 )
where V C H 4 B C P is the amount of CH4 after compression and purification in m3, and k B C P is the amount of CH4 generated by unit volume of biogas via compression and purification.

3. Optimization Model of MECS Coupled with WPB

Annual operating costs are included in the planning objectives of the whole system [49,50]. The annual operating cost is mainly calculated by the optimal output of each equipment on a typical day as well as considering environmental benefits. However, the multi-energy (electricity/heat/gas) collaborative optimization of the system must be based on the installation capacity of each device. The two abovementioned mutually constrained and repeated iterations are needed to acquire the optimal planning scheme.
Therefore, a bi-level planning model is applied to the system. The upper model deals with the investment decision problem, with the minimum annual cost as the target. The optimization variables are the installation capacity of each device. The lower model solves the operation optimization problem, with the goal of minimum annual operating costs (such as maintenance costs and carbon tax). The optimization variables are the dispatch value of each device in the system in time t. The investment results in the upper model affect the objective function and constraints in the lower. In return, the lower model takes the optimal value as feedback to the upper model, achieving the interaction between the upper and lower model. Energy balance, operational constraints, and optimization variable constraints are included in the optimization model.

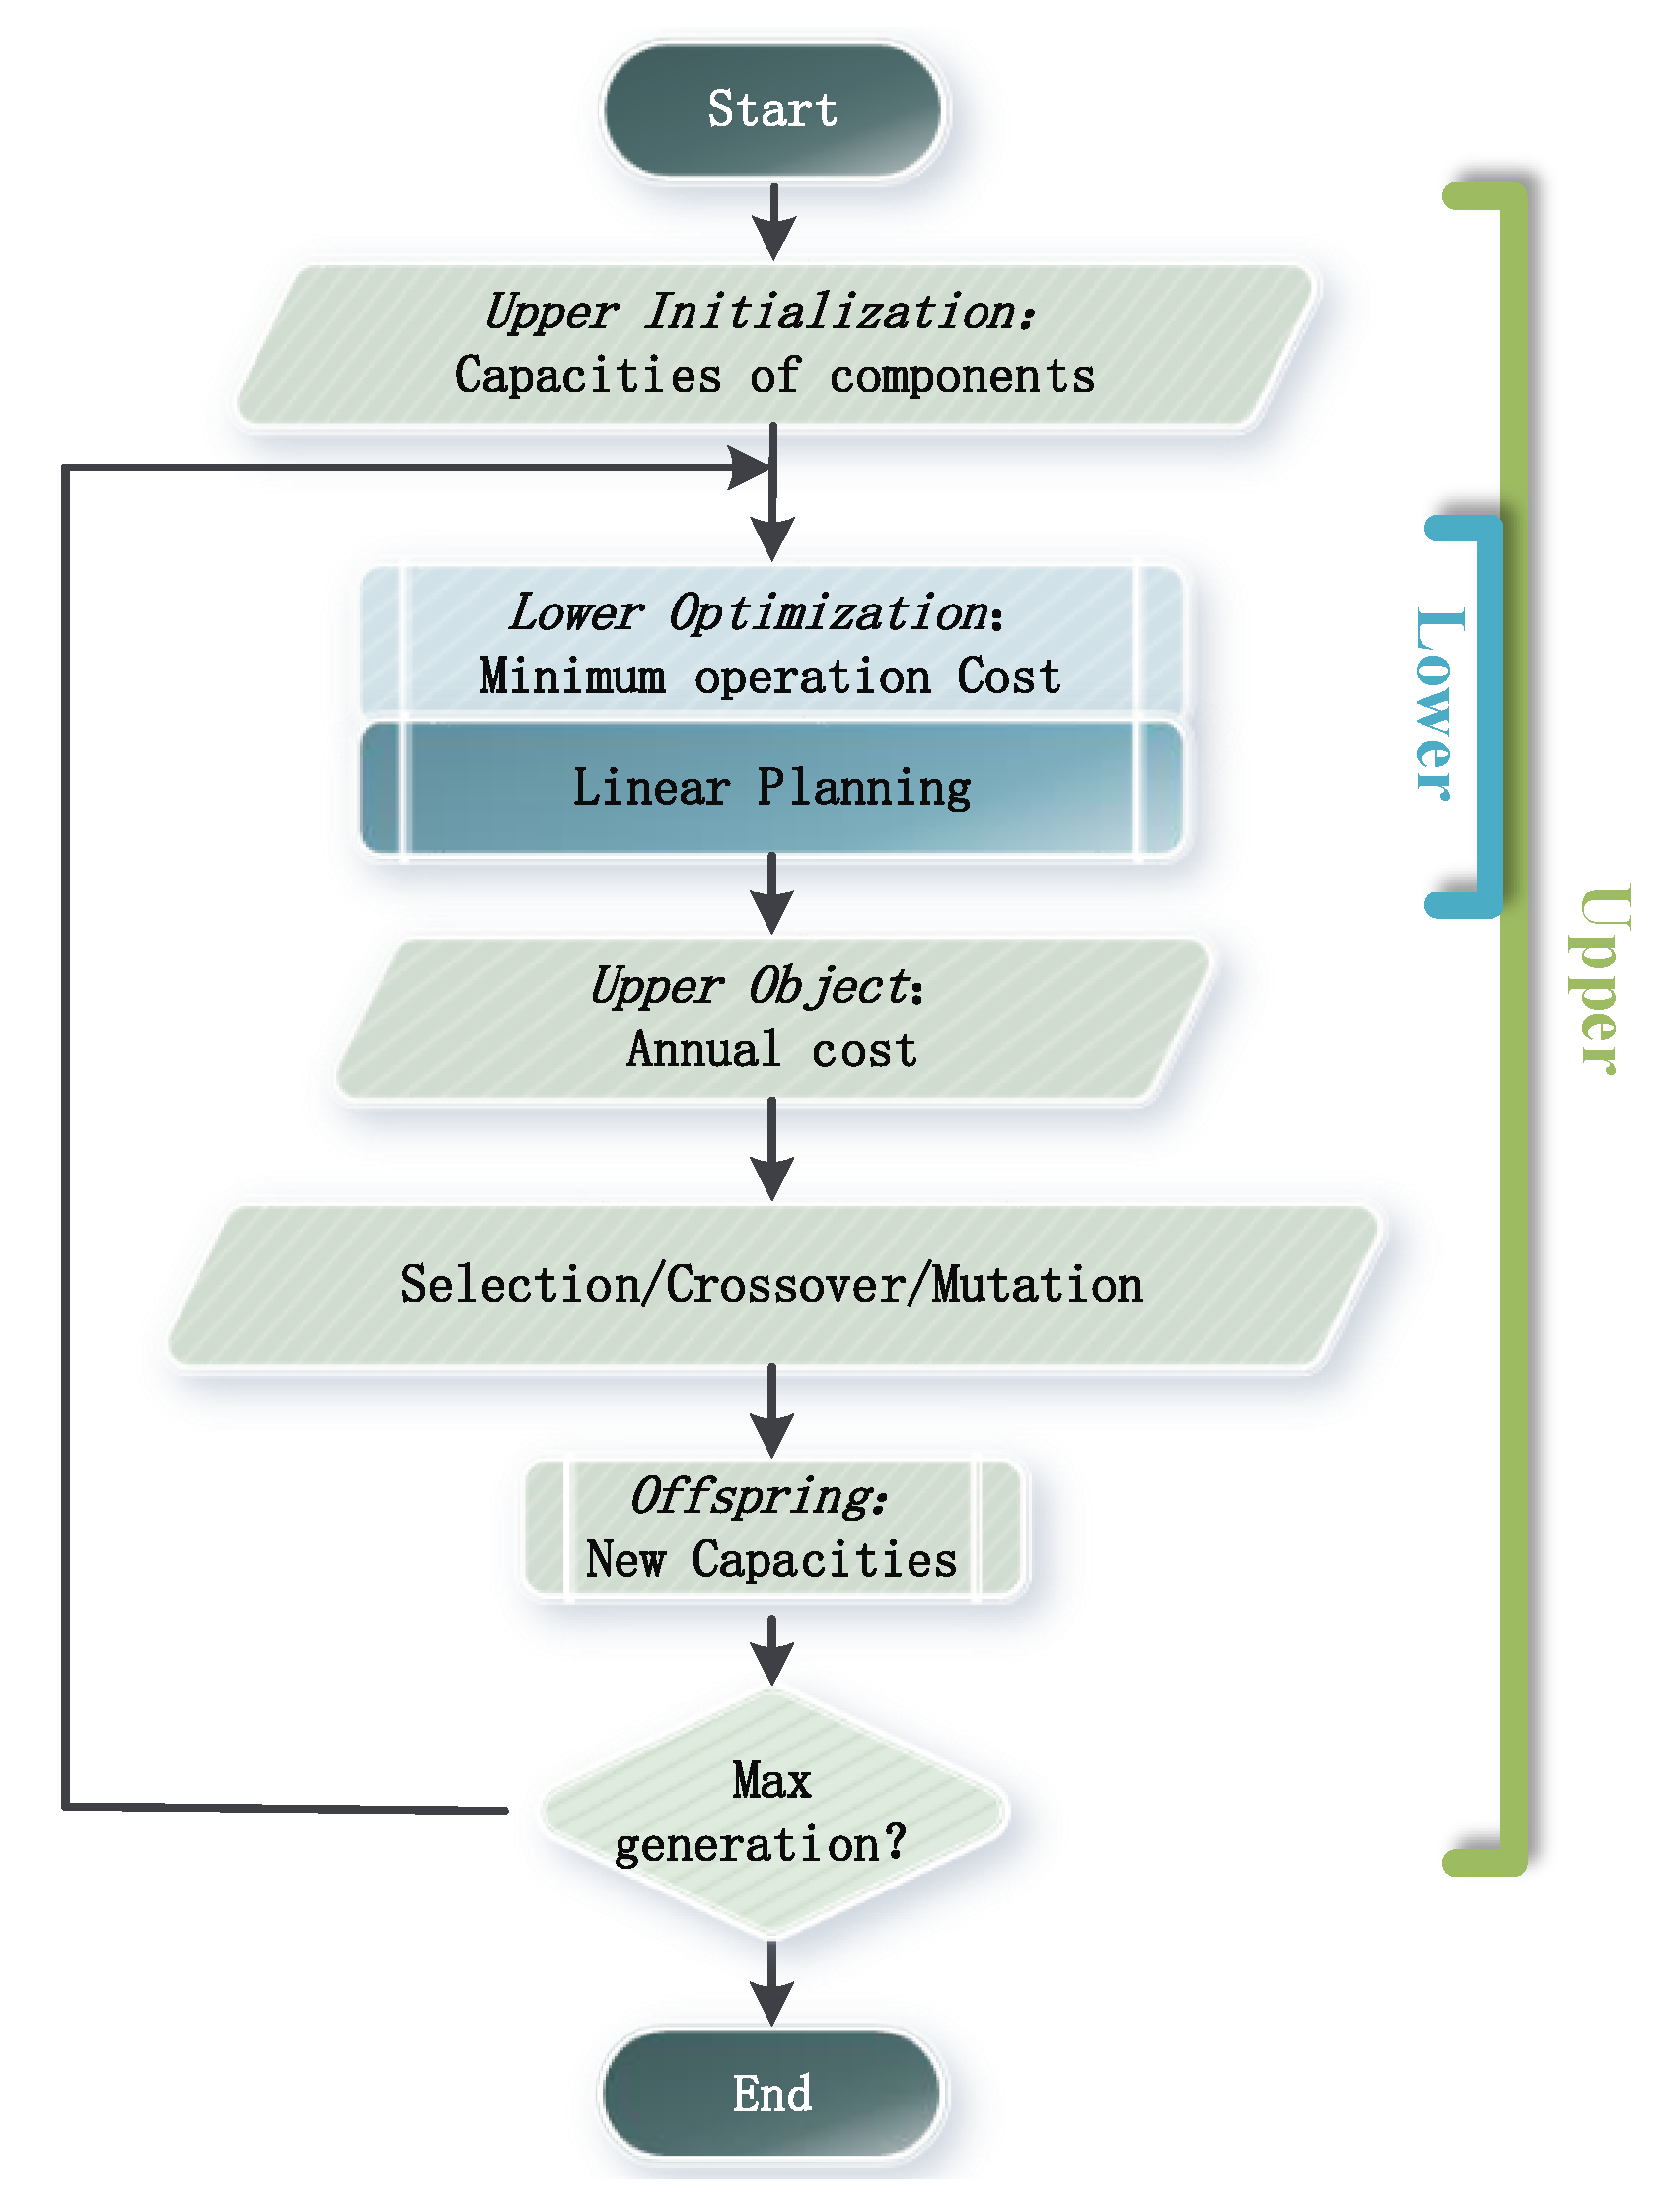
3.1. Bi-Level Planning Optimization Model

3.1.1. The Upper Model

(1) Objective function
The minimum total annual cost is the objective of the upper model. The annual cost covers the investment in equipment C i n v , annual operating costs C o p e (calculated by Equation (20) in the lower model), waste disposal subsidies, and the environmental maintenance costs C e p for ecological construction after the closure of WL. The objective function [49] is shown below.
F U P = C i n v + C o p e + C e p C a l l o
C i n v = i α i E i c a p W i
where α i is the discount rate for the investment expense of ith equipment, E c a p i is the investment cost of the unit capacity in the ith equipment, and W i is the capacity of the ith equipment.
C e p = β W W L E 0 e p T e
where β is the discount rate for environmental maintenance costs, and W W L stands for the landfill capacity. E 0 e p is the annual environmental maintenance cost of unit capacity, and T e is the environmental maintenance period of landfill.
C a l l o = t m t A o w a s t e
where m t is the amount of waste treatment in time t , and A o w a s t e is subsidy of per unit waste treatment.
(2) Constraints
Considering the physical meaning of the optimization variables and the actual situation, the optimization variables need to be kept within a certain range [50].
{ 0 W W L M w a s t e 0 W W I M w a s t e 0 V P 2 G O U T V C H 4 v e h 0 V C H 4 B C P V C H 4 v e h M w a s t e W W L + W W I V C H 4 v e h V C H 4 B C P + V P 2 G o u t
where M w a s t e is the amount of waste disposal per day, and V C H 4 v e h is the volume of CH4 vehicles used.

3.1.2. The Lower Model

(1) Objective function
The lower-level planning model targets the minimum annual operating cost of the system. The annual operating cost of the system is made up of equipment operation and maintenance cost C m a n , energy benefit C e n e , and environmental cost C C O 2 (mainly considering carbon tax).
F L O W = C o p e = C m a n + C c o 2 C e n e
C m a n = i , t Q t , i E i m a n
where Q t , i is the output electricity/heat/gas energy of ith equipment in time t , and E i m a n is the operation and maintenance costs incurred by per unit energy of the ith equipment.
C e n e = t ( P t ω t e l e c + V t ω t g a s + H t ω t h e a t )
where P t , V t , and H t respectively stand for the sold electricity/heat/gas in time t . ω t e l e c , ω t g a s , and ω t h e a t respectively stand for the electricity/heat/gas price in time t .
C c o 2 = ω t a x ( t λ V 2 G V t V 2 G + λ G a s P V t G a s P + λ W I M t W I )
where ω t a x is the carbon price, and λ V 2 G , λ G a s P , and λ W I respectively stand for the carbon dioxide emissions of per unit fuel of car and boat, BP and WI. V t V 2 G and V t G a s P are biogas consumption by vehicles and BP in time t . M t W I is the amount of the waste consumed by WL in time t .
(2) Constraints
Equipment operating constraints are mainly equipment rated power or rated capacity limit, just as Equations (4)–(7) show. Energy balance constraints include system power, thermal energy, and gas network. Moreover, the constraints of decision variables are also given in Equations (28)–(30).
P t W I + P t B P = P t L T + P P 2 G i n + W p o w e r ( t ) + P s a l e
V t W L + V g a s L T = E
V C H 4 B P + V P 2 G o u t = V t V 2 G + W g a s ( t ) + V s a l e
Q W I = Q L T + W h e a t ( t ) + Q s a l e
0 λ 1 1
0 λ 2 1
0 β 1 1
where P s a l e , V s a l e , and Q s a l e refer to the capacity of power/heat/gas for sale. λ 1 , λ 2 , and β 1 are the dispatch ratio of WL, WI, and BP.

3.2. Solution Algorithm

In this paper, the bi-level programming model is solved by the genetic algorithm (upper model) and linear programming (lower model). The process of the algorithm solution is shown in Figure 3. The genetic algorithm is used for the upper model to search for the optimum solution through iteration. In each iteration process, it updates the capacities of components, and thus, the minimum operation cost can be calculated by the lower model. Then, the annual cost can be figured out. After selection, crossover, and mutation, new capacities are obtained. When the iteration is finished, this algorithm will find the optimum capacities as well as the operation mode of the components.

4. Case Analysis

In this section, a practical WPB in Shanghai is selected as the case scenario. This paper focuses on a practical WPB and expands the intrinsic equipment, constructing a multi-energy complementary device on the basis of it. A MECS in which the WPB acts as the core is formed.

4.1. Analysis of the Original WPB

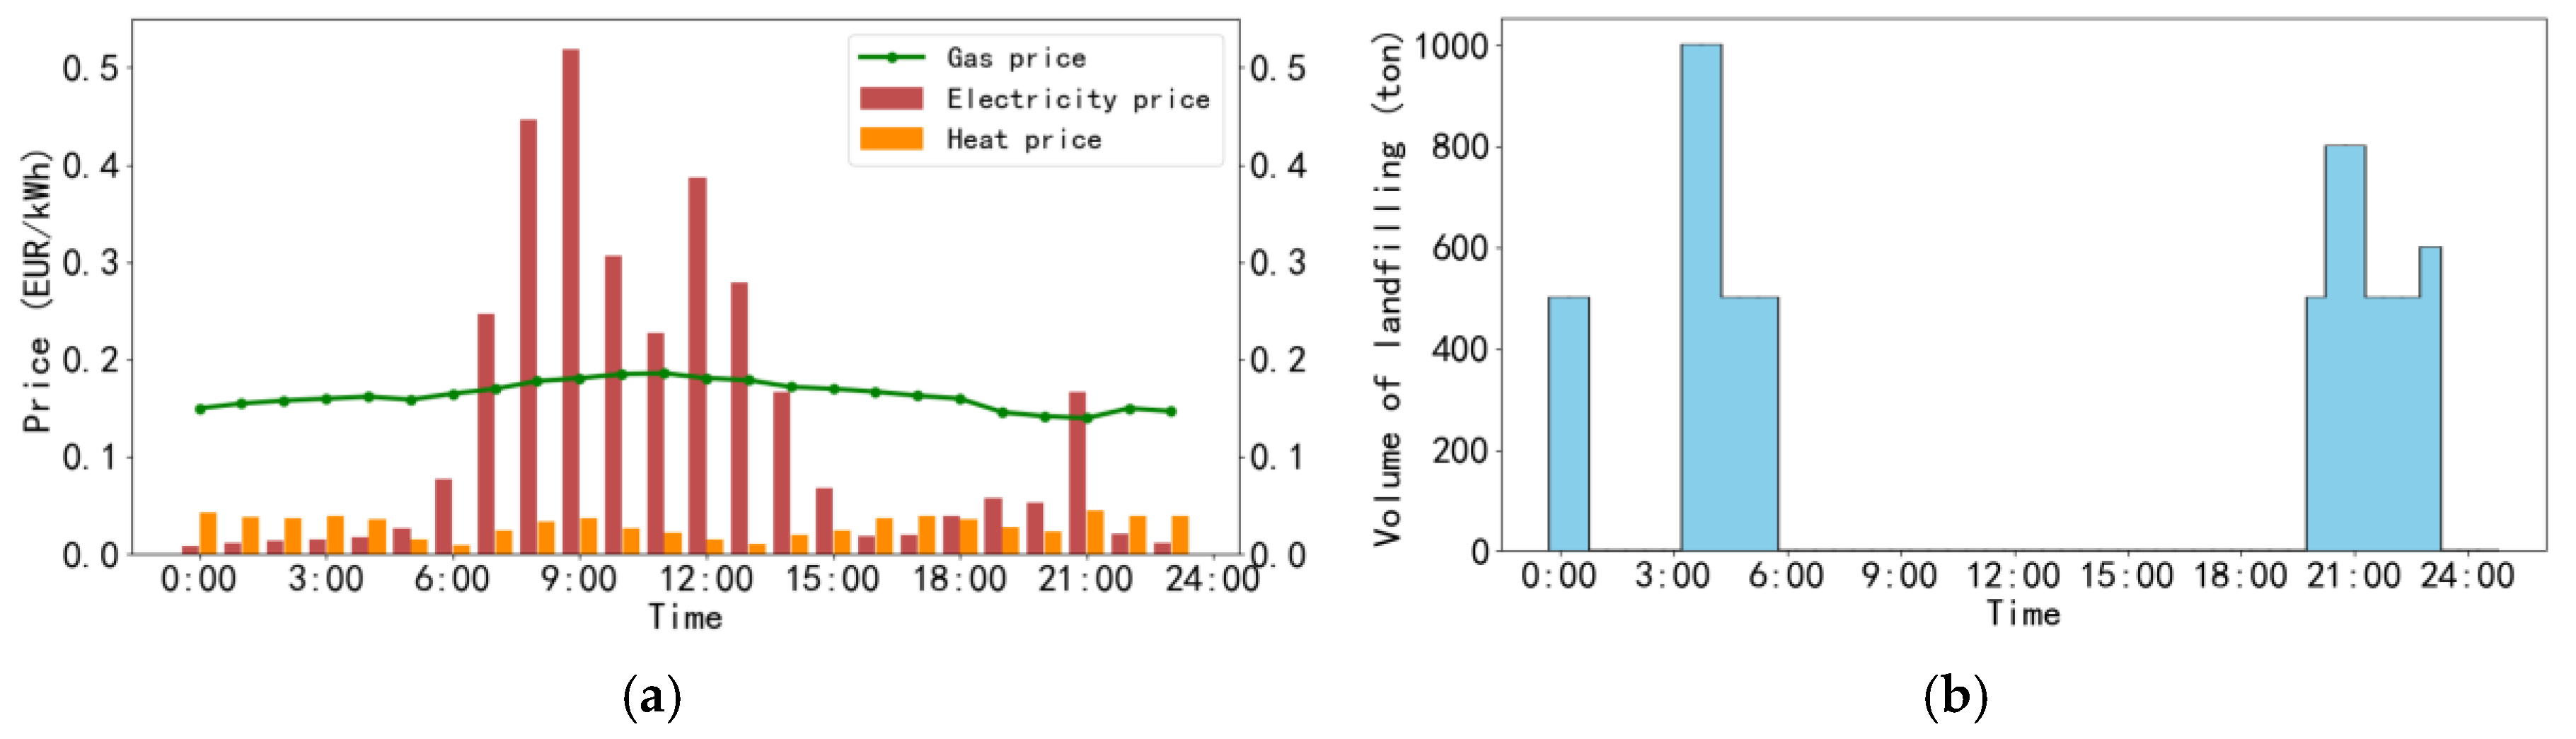
4.1.1. Energy Factor Analysis

Figure 4 shows the overview of the original WPB. It is located at the seaside and has abundant wind energy resources. The WPB is a self-sufficient energy park. The external resources required in the base are only waste, and it can produce biogas, natural gas, and other energy sources from landfilling, leachate, and incineration. However, the original equipment does not fully reflect the complementary energy characteristics, resulting in low energy utilization. For example, the thermal energy of the power plant is not used, and the biogas of the leachate plant is directly burned and discharged. In addition, the serious wind abandonment phenomenon in the WPB is also an important reason for low energy utilization.

4.1.2. Environment Factor Analysis

In terms of environmental factors, although a single device has advantages in carbon emissions, it ignores the environmental benefits brought about by overall optimization. In addition, the application of biogas is still lacking, resulting in an increase in carbon emission costs.

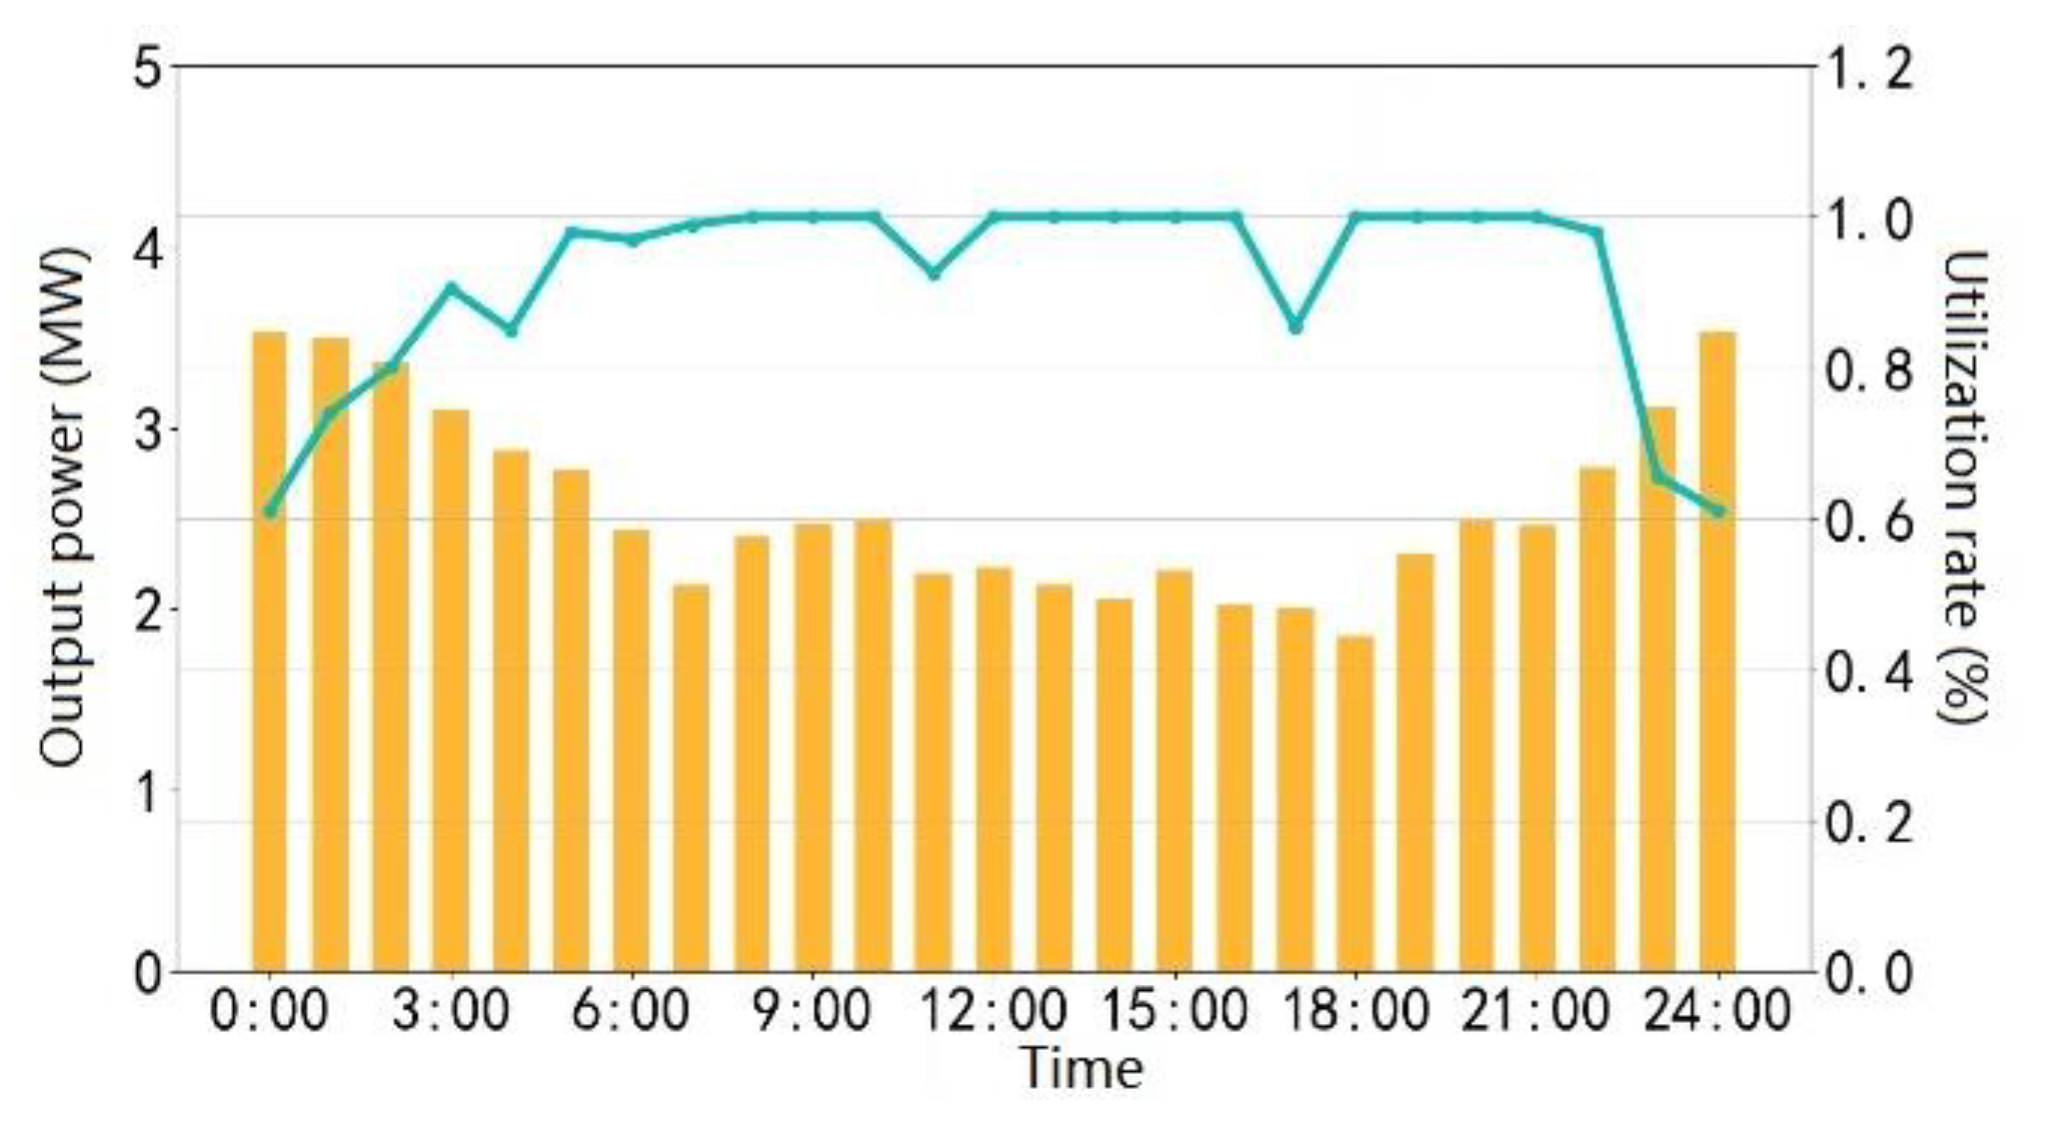
4.1.3. Load Factor Analysis

The transportation vehicles inside the WPB need to consume natural gas. At the same time, there are no residential users near the WPB, the internal electrical and thermal load is concentrated, and the total amount is lower than the current heat generation of the base. There are some gas loads in metallurgy, glass, electronics, and other industries that are distributed through the urban pipe network near the WPB.

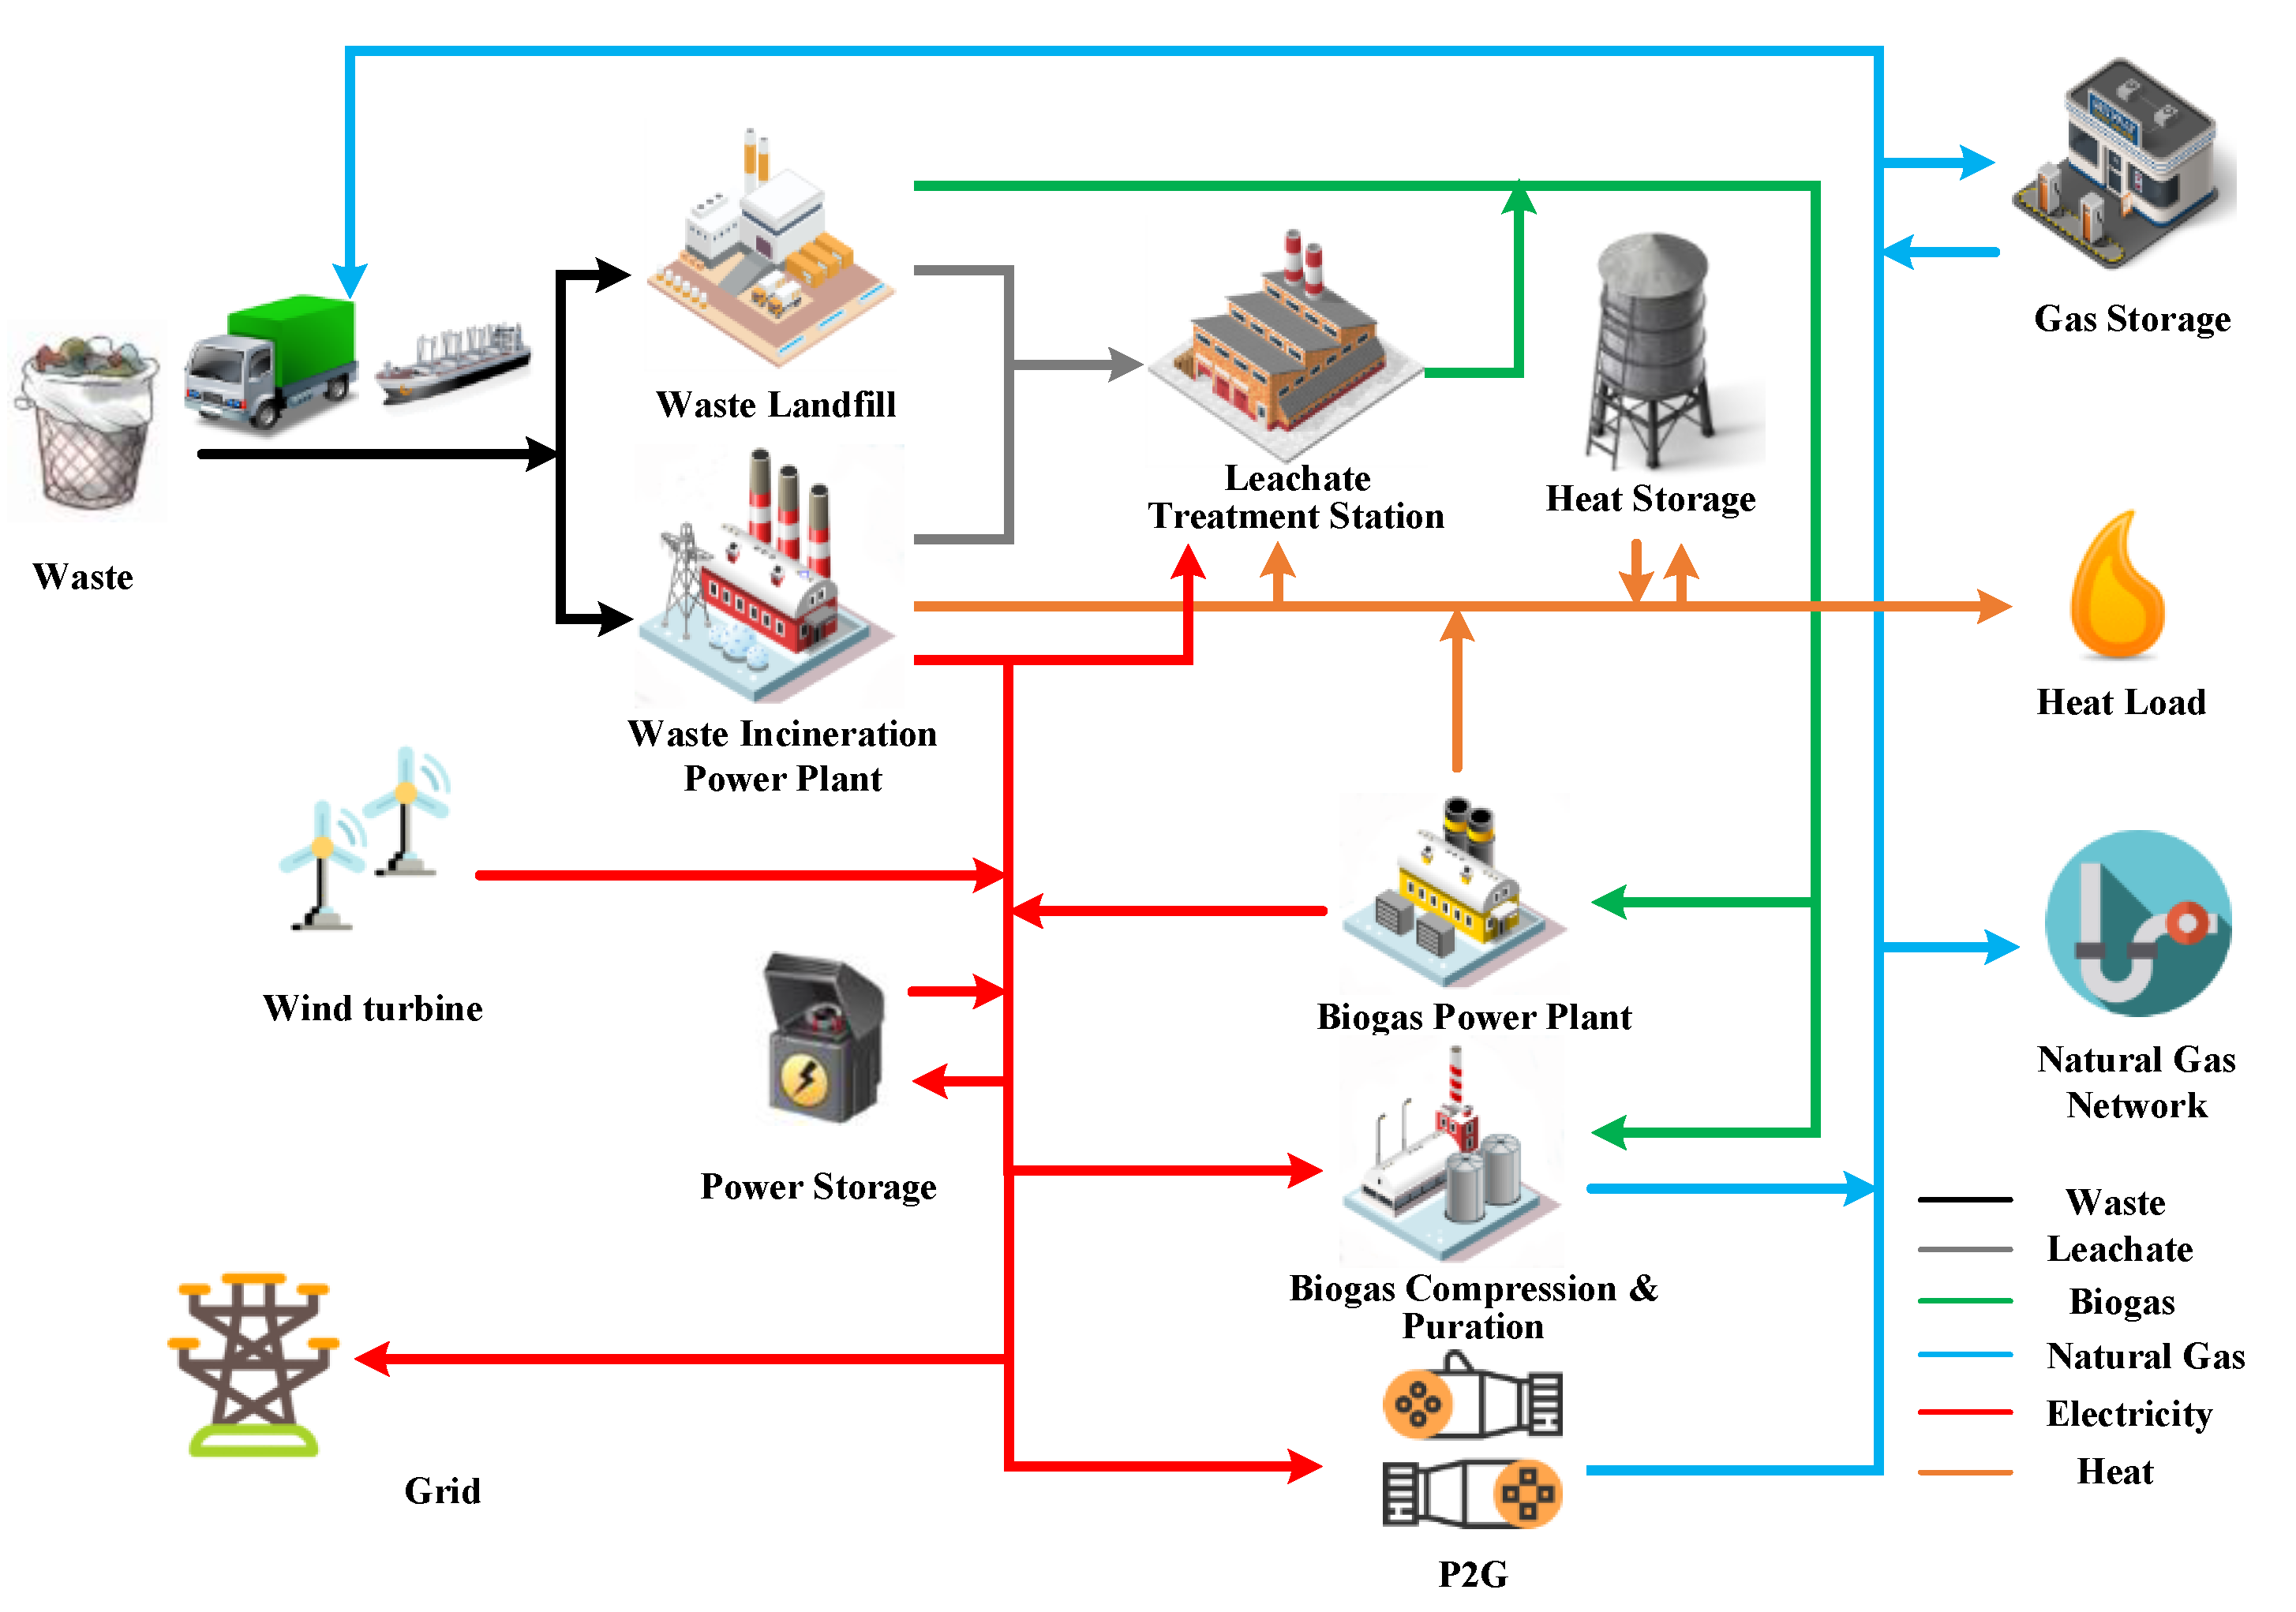
4.2. MECS Coupled with WPB

Based on the typical WPB and energy conversion device in MECS, we proposed a physical planning topology, illustrated in Figure 5. The WPB includes landfills, waste incineration power plants, leachate treatment plants, and biogas power plants. The biogas compression and purification plant, P2G, and some energy storage devices are planned in the system for taking full advantage of the various energies and reducing environmentally harmful emissions.

4.3. Basic Data

The information of the intrinsic equipment in WPB is shown in Table 1, and the multi-energy complementary equipment is shown in Table 2. The data in Table 1 and Table 2 are collected from a solid waste treatment base in Shanghai. Some of the equipment has not been installed, so its data are estimated based on the equipment currently available.
The energy price and the amount of waste transportation of a day in a MECS are shown in Figure 6. Figure 7 shows the output power and utilization rate of the wind turbine in a typical day. The WPB belongs to the source park, and the load in the park is very low. Because of the rigid requirements of waste disposal capacity, the generation capacity of waste incineration power plants has the lowest limit, and wind turbines are also in the state of generation. Therefore, there is basically no situation in which the energy production of WPB cannot meet the load. In the lower-level planning model, the impact of the load in the optimal scheduling is small, and the optimization result is determined by the fluctuation of the energy price and abandoned wind rate. Based on the abovementioned actual situation, the load of WPB is set to a fixed value in order to simplify the processing.

4.4. Results

Table 3 shows the capacity planning result of the intrinsic equipment and multi-energy complementary equipment of the WPB. Table 4 gives a comparison of energy, economic, and environmental benefits before and after planning.
The planned MECS coupled with WPB can improve the benefits from the three aspects of energy, economy, and environment. Firstly, the adopted planning method increases the utilization of heat and biogas. From Figure 5, the extra heat in the power plant can be supplied to the leachate plant or for external use. The biogas burns directly or is used inefficiently for generation. It is now applied to the waste transportation vehicle or for sale after compression and purification. Secondly, the maximum economic benefit shall be realized through the coordination of electricity/heat/gas according to the price of energy. In terms of the environment, the conversion of the vehicle’s motive power from traditional energy to biogas is about to reduce carbon emissions significantly. Planning of the MECS coupled with WPB brings about the following benefits:

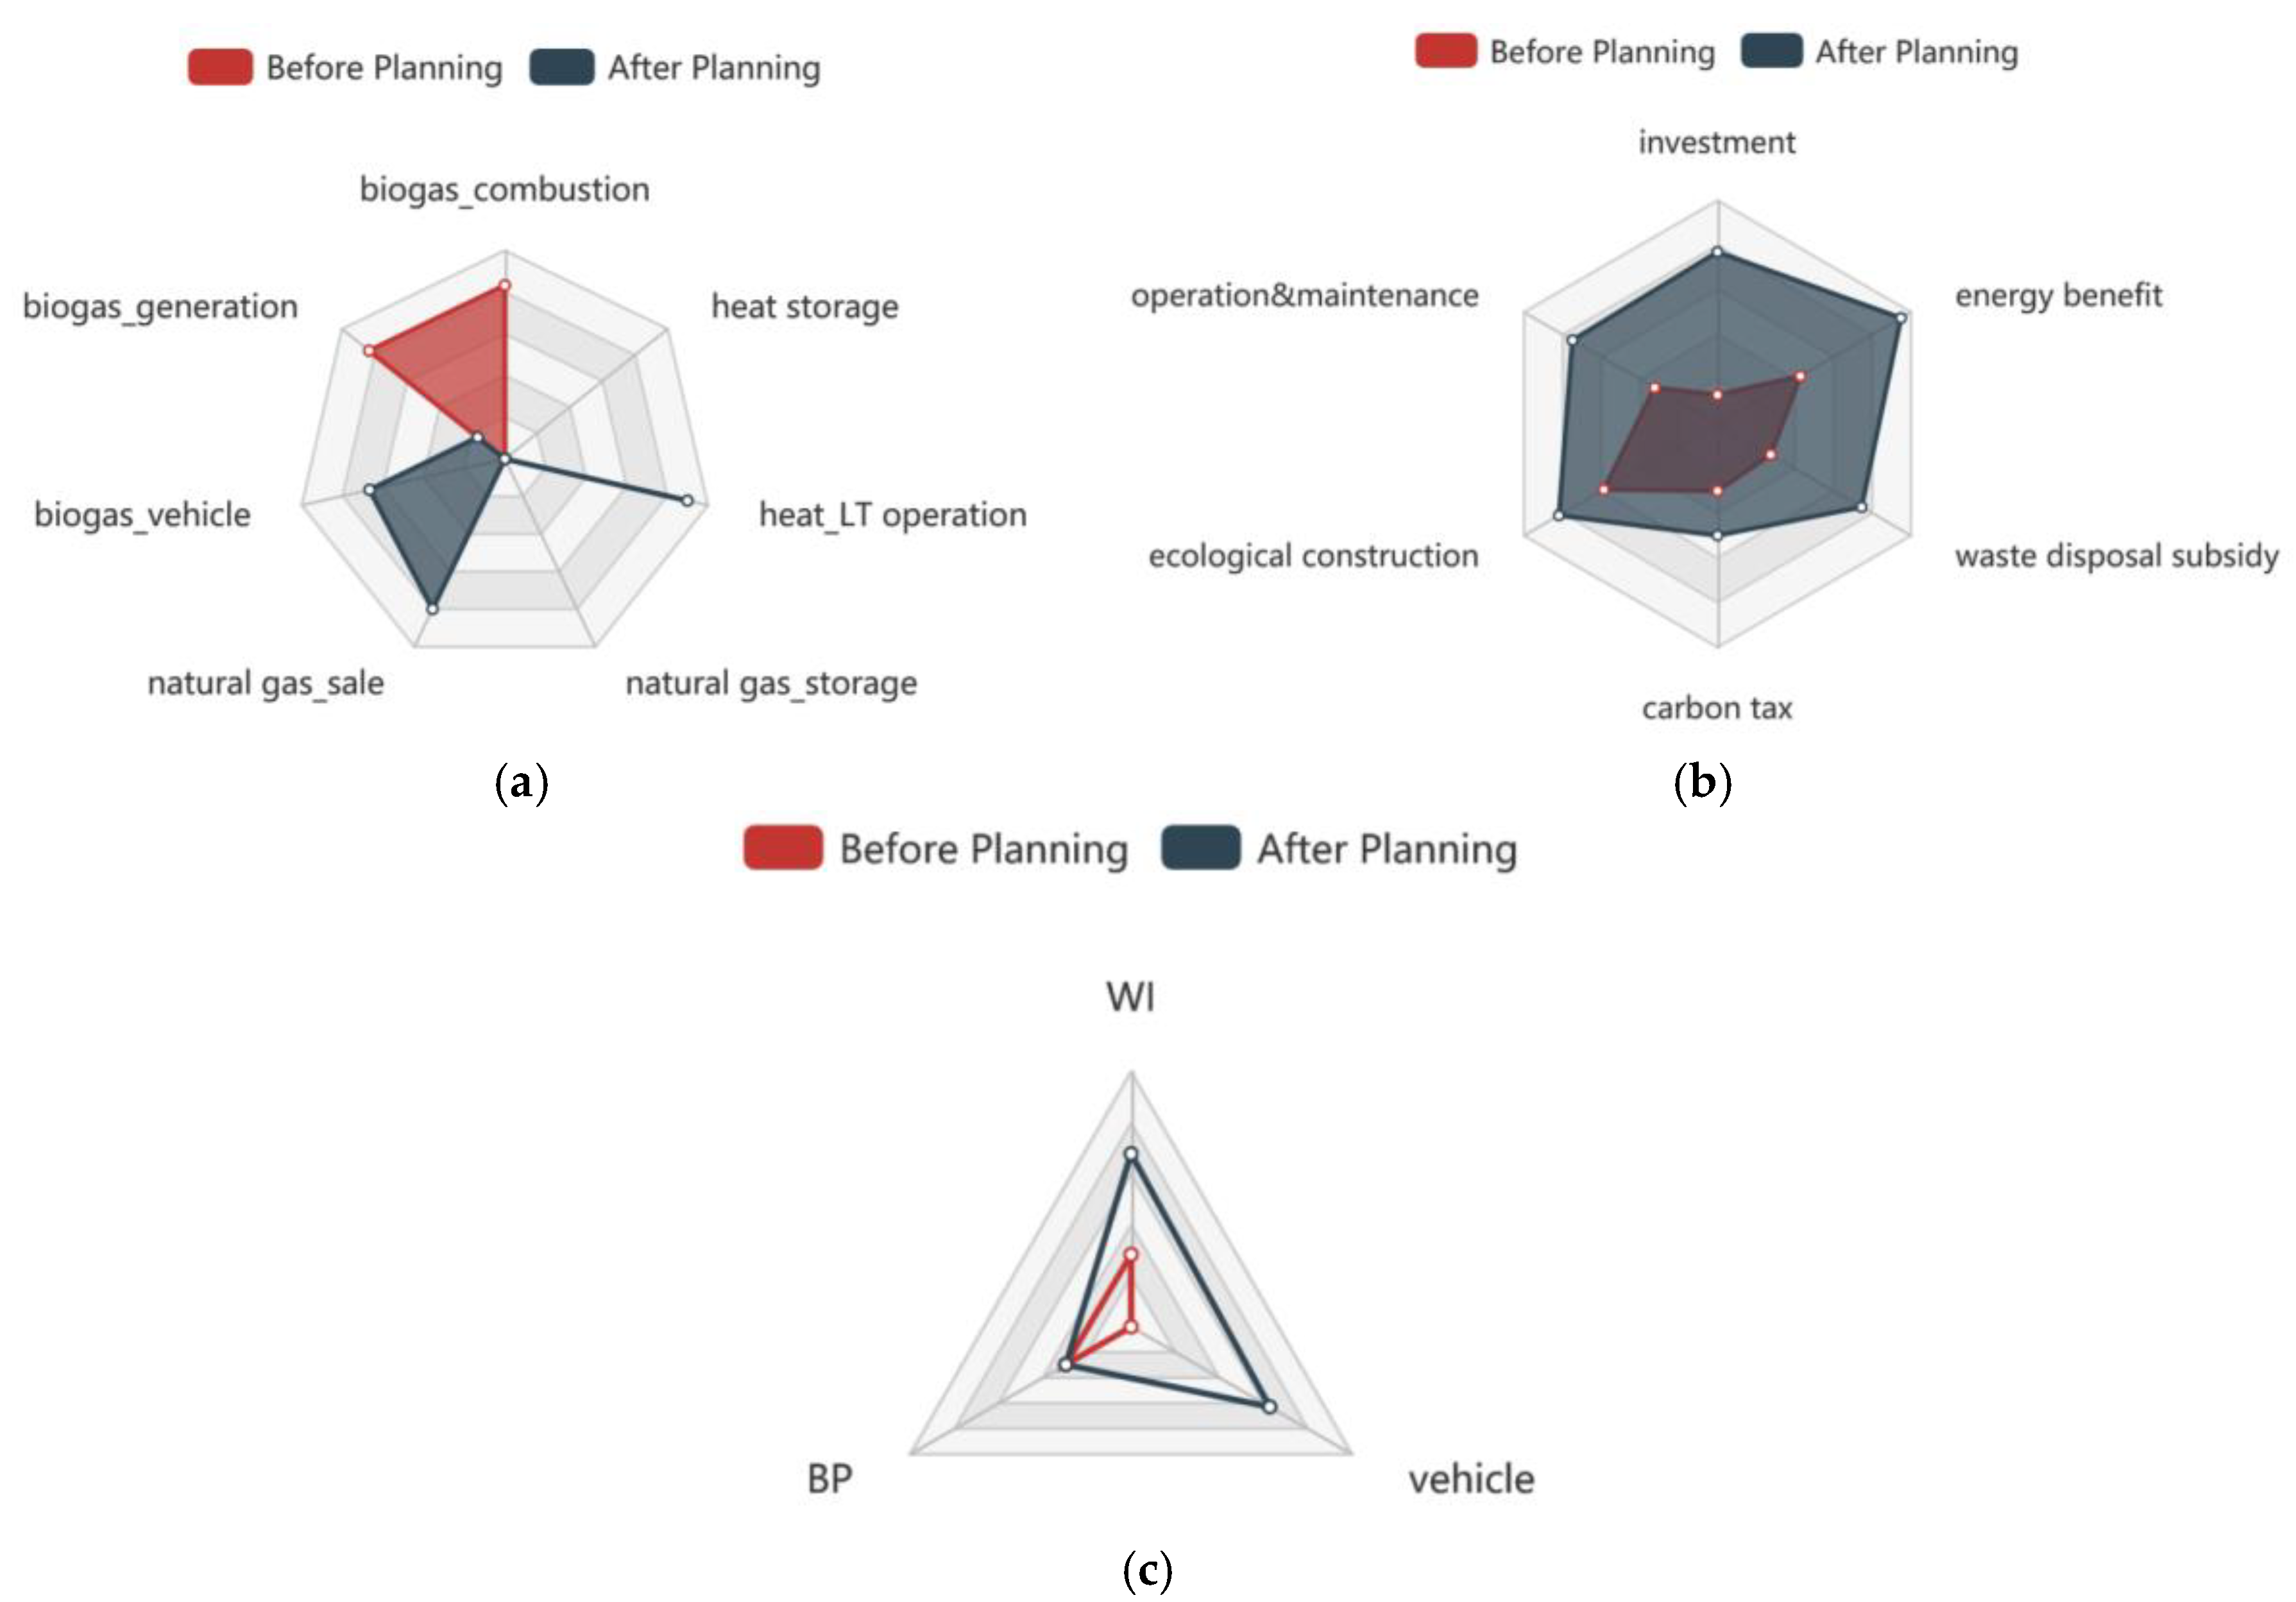
4.4.1. Improvement of Energy Efficiency

The original WPB has low efficiency of energy owing to the single form of energy utilization. Select two typical energy sources in MECS as an example. The form of biogas utilization is abundant and the efficiency of biogas generation is greatly improved. As for heat, the original utilization was zero, which means the heat was not used. The form and efficiency of heat are both improved effectively.
Moreover, the utilization of biogas and CH4 forms the energy flow, cycling in the MECS, shown as Figure 5. The waste is treated to produce biogas and natural gas in WL and WI after transportation by vehicles. The formed gas can be used as fuel for vehicles after compression and purification. Vehicles continue to transport waste to the WPB. The recycling of the energy reduces the emission of biogas and final treatment, lightening the environmental pressure of economic growth.

4.4.2. Growth of Economic Benefits

From Table 4, it is obvious that the economic benefits of MECS coupled with WPB are higher than those of the original WPB, which can also be observed in Figure 8.
The dispatch waste disposal ratio of WI and WL is about 88% and 12%, respectively, because WI achieves more profit with less cost. Therefore, the proportion of waste disposed by WI is higher to obtain more economic benefits.
From the perspective of the multi-energy complementary equipment, one main reason for higher profit after planning is the energy benefit of energy storage equipment for external sale, which cannot be obtained in the original WPB. It can be found in Table 4 that the energy benefit is a considerable part of the income of the WPB.

4.4.3. Promotion of Environmental Benefits

Environmental benefits mainly consider carbon emission reduction. We can consider the carbon emission reduction of the entire system in two parts: Intrinsic equipment and complementary equipment in a waste base. From Table 4, the current carbon emission reduction of WI is twice as much as that of the original, while the carbon emission reduction of BP is not changed. Moreover, vehicles transporting waste create 2515.8 t/day of carbon emission reduction. The comparison of carbon emission reductions of waste bases can be seen from Figure 8.
As a comparison, reference [51] applied a hierarchical optimization strategy to a distributed generation system in the center of a small town in the Northeast of Italy. The original energy cost of this region is €796,064/year before planning. After planning, it turns out that €53,359/year can be saved and 2714 t/year of CO2 emissions can be avoided. This study shows similar results to those of this paper, however, it lacks the consideration of energy storage equipment. Meanwhile, multi-objective optimization is used in [51], while this paper quantifies environmental cost and ecological construction cost so that the planning algorithm has only one objective.

5. Conclusions

This paper studies the planning method of the MECS coupled with the WPB from a case in China. Adding multi-energy complementary equipment based on the intrinsic equipment in the original WPB can not only improve energy utilization, but also accomplish economic and environmental benefits. The following conclusions can be obtained:
(1)
MECS is analyzed from three aspects: Energy, environment, and load. According to the results, the MECS is divided into supply, conversion, transmission, storage, and other blocks. According to the division of typical energy components and park-specific energy components, the physical planning architecture of MECS is built;
(2)
Based on the conventional location selection and capacity decision method of energy devices and the bi-level optimization model, the optimal scheduling of energy devices in MECS is transformed into the planning model;
(3)
The energy efficiency of biogas and heat is improved by constructing the BP and P2G. After planning, biogas and CH4 are recycled throughout the WPB, which is significant for the MECS. In addition, the original wasted heat energy in the WPB has also been fully utilized. Energy benefits for sale increases the total economic benefits, which is achieved by the supplement of power/heat/gas storage equipment. Energy storage devices make the way of energy supply and utilization in the WPB more flexible. The fuel of vehicles replaced by biogas helps enhance the carbon emission reduction.
However, the paper studies the coordination problem of a single regional pluripotent complementary system. In future research, the following issues will be considered:
(1)
Uncertainty factors in MECS, such as renewable energy and energy demand, are to be considered in the planning model in future research;
(2)
The energy collaborative optimization between multiple regions will be discussed in future research.

Author Contributions

Conceptualization, D.X. and X.W.; Methodology, L.Z.; Validation, A.C.; D.X. and C.G.; Formal Analysis, L.Z.; Investigation, A.C.; Data Curation, H.G.; Writing—Original Draft Preparation, L.Z.; Writing—Review and Editing, L.Z.; Project Administration, D.X.; Funding Acquisition, H.G.

Funding

This research was funded by Research on Energy Systems of Smart Park; Research and Demonstration on Key Technologies of Multi-Functional Energy Router of Shanghai Science and Technology Commission (18DZ1203700).

Conflicts of Interest

The authors declare no conflict of interest.

References

  1. Huang, W.; Zhang, N.; Yang, J.; Wang, Y.; Kang, C. Optimal Configuration Planning of Multi-Energy Systems Considering Distributed Renewable Energy. IEEE Trans. Smart Grid 2019, 10, 1452–1464. [Google Scholar] [CrossRef]
  2. Du, W.; Li, M. Government support and innovation for new energy firms in China. Appl. Econ. 2019, 51, 2754–2763. [Google Scholar] [CrossRef]
  3. Kubickova, M. The impact of government policies on destination competitiveness in developing economies. Curr. Issues Tour. 2019, 22, 619–642. [Google Scholar] [CrossRef]
  4. Rada, E.C.; Castagna, G.; Adami, L.; Torretta, V.; Ragazzi, M. Compensation opportunities and waste-to-energy plants. AIP Conf. Proc. 2018, 1968, 030065. [Google Scholar]
  5. Gitelman, L.; Magaril, E.; Khodorovsky, M. Interdisciplinarity as heuristic resource for energy management. Int. J. Energy Prod. Manag. 2016, 1, 163–171. [Google Scholar] [CrossRef] [Green Version]
  6. Press, D.; Mazmanian, D. The greening of industry through ‘government-supervised self-regulation’. In Entrepreneurial Management and Public Policy, 2nd ed.; Nova Science Publishers: Hauppauge, NY, USA, 2011; pp. 233–249. [Google Scholar]
  7. Borisova, M.A.; Ryshikova, M.V.; Gomazova, A.A. Municipal Solid Waste Management in China. In Proceedings of the 2018 IEEE International Conference “Management of Municipal Waste as an Important Factor of Sustainable Urban Development” (WASTE), St. Petersburg, Russia, 4–6 October 2018; pp. 10–13. [Google Scholar]
  8. Zhong, Y.; Yu, Q.; Wu, P.; Wang, G. A Research into the Recycling System of Waste Electrical and Electronic Equipment in China. In Proceedings of the 2006 IEEE International Conference on Service Operations and Logistics, and Informatics, Shanghai, China, 21–23 June 2006; pp. 705–710. [Google Scholar]
  9. Ceseña, E.A.M.; Mancarella, P. Energy Systems Integration in Smart Districts: Robust Optimisation of Multi-Energy Flows in Integrated Electricity, Heat and Gas Networks. IEEE Trans. Smart Grid 2019, 10, 1122–1131. [Google Scholar] [CrossRef]
  10. Mavi, N.K.; Mavi, R.K. Energy and environmental efficiency of OECD countries in the context of the circular economy: Common weight analysis for malmquist productivity index. J. Environ. Manag. 2019, 247, 651–661. [Google Scholar] [CrossRef]
  11. Rada, E.C. Special waste valorization and renewable energy generation under a circular economy: Which priorities? WIT Trans. Ecol. Environ. 2019, 222, 145–157. [Google Scholar]
  12. Tsai, W.-T. Promoting the circular economy via waste-to-power (WTP) in Taiwan. Resources 2019, 8, 95. [Google Scholar] [CrossRef]
  13. Ragossnig, A.M.; Schneider, D.R. Circular economy, recycling and end-of-waste. Waste Manag. Res. 2019, 37, 109–111. [Google Scholar] [CrossRef] [Green Version]
  14. Rada, E.C.; Ragazzi, M.; Torretta, V.; Castagna, G.; Adami, L.; Cioca, L.I. Circular economy and waste to energy. AIP Conf. Proc. 2018, 1968, 030050. [Google Scholar]
  15. Tomić, T.; Schneider, D.R. The role of energy from waste in circular economy and closing the loop concept—Energy analysis approach. Renew. Sustain. Energy Rev. 2018, 98, 268–287. [Google Scholar] [CrossRef]
  16. Mohamad, N.F.; Hidayu, A.R.; Sherif, A.A.; Sharifah, A.S.A.K. Characteristics of bituminous coal, sub-bituminous coal and bottom ash from a coal-fired power plant. In Proceedings of the 2013 IEEE Business Engineering and Industrial Applications Colloquium (BEIAC), Langkawi, Malaysia, 7–9 April 2013; pp. 571–573. [Google Scholar]
  17. Martínez-Mares, A.; Fuerte-Esquivel, C.R.; de Ingeniería, I. Integrated energy flow analysis in natural gas and electricity coupled systems. In Proceedings of the 2011 North American Power Symposium, Boston, MA, USA, 4–6 August 2011; pp. 1–7. [Google Scholar]
  18. Zhu, G.; Zhao, G.; Zhang, Z.; Lu, X. Water quality of water source area in Taihu Lake and effect on water treatment process. In Proceedings of the 2011 International Conference on Consumer Electronics, Communications and Networks (CECNet), Xianning, China, 16–18 April 2011; pp. 3783–3786. [Google Scholar]
  19. Dai, Y.; Lu, Y.; Sun, Y.; He, Y. Wind energy resource assessment and derivation of characteristic wind speed in wind field of Inner Mongolia. In Proceedings of the 2011 International Conference on Consumer Electronics, Communications and Networks (CECNet), Xianning, China, 16–18 April 2011; pp. 3787–3790. [Google Scholar]
  20. Ramirez-Del-Barrio, P.; Mendoza-Araya, P.; Valencia, F.; León, G.; Cornejo-Ponce, L.; Montedonico, M.; Jiménez-Estévez, G. Sustainable development through the use of solar energy for productive processes: The Ayllu Solar Project. In Proceedings of the 2017 IEEE Global Humanitarian Technology Conference (GHTC), San Jose, CA, USA, 19–22 October 2017; pp. 1–8. [Google Scholar]
  21. Moghaddam, M.P.; Damavandi, M.Y.; Bahramara, S.; Haghifam, M.R. Modeling the impact of multi-energy players on electricity market in smart grid environment. In Proceedings of the 2016 IEEE Innovative Smart Grid Technologies—Asia (ISGT-Asia), Melbourne, VIC, Australia, 28 November–1 December 2016; pp. 454–459. [Google Scholar]
  22. Van Beuzekom, I.; Gibescu, M.; Slootweg, J.G. A review of multi-energy system planning and optimization tools for sustainable urban development. In Proceedings of the 2015 IEEE Eindhoven PowerTech, Eindhoven, The Netherlands, 29 June–2 July 2015; pp. 1–7. [Google Scholar]
  23. Hosseinpour, J.; Chitsaz, A.; Liu, L.; Gao, Y. Simulation of eco-friendly and affordable energy production via solid oxide fuel cell integrated with biomass gasification plant using various gasification agents. Renew. Energy 2020, 145, 757–771. [Google Scholar] [CrossRef]
  24. Fathabadi, H. Two novel methods for converting the waste heat of PV modules caused by temperature rise into electric power. Renew. Energy 2019, 142, 543–551. [Google Scholar] [CrossRef]
  25. Shamsi, S.S.M.; Negash, A.A.; Cho, G.B.; Kim, Y.M. Waste heat and water recovery system optimization for flue gas in thermal power plants. Sustainability 2019, 11, 1881. [Google Scholar] [CrossRef]
  26. Gitelman, L.D.; Kozhevnikov, M.V.; Starikov, E.M.; Rada, E.C. Scaling up the innovation process in the energy sector on the basis of technology entrepreneurship. In WIT Transactions on Ecology and the Environment; WIT Press: Southampton, UK, 2019; Volume 222, pp. 1–12. [Google Scholar]
  27. Montorsi, L.; Milani, M.; Venturelli, M. Economic assessment of an integrated waste to energy system for an urban sewage treatment plant: A numerical approach. Energy 2018, 158, 105–110. [Google Scholar] [CrossRef]
  28. Bao, Z.; Zhou, Q.; Wu, L.; Yang, Z.; Zhang, J. Optimal capacity planning of MG with multi-energy coordinated scheduling under uncertainties considered. IET Gener. Transm. Distrib. 2017, 11, 4146–4157. [Google Scholar] [CrossRef]
  29. Cheng, H.; Wu, J.; Luo, Z.; Zhou, F.; Liu, X.; Lu, T. Optimal Planning of Multi-Energy System Considering Thermal Storage Capacity of Heating Network and Heat Load. IEEE Access 2019, 7, 13364–13372. [Google Scholar] [CrossRef]
  30. Huang, G.H.; Baetz, B.W.; Patry, G.G. Grey fuzzy integer programming: An application to regional waste management planning under uncertainty. Socio-Econ. Plan. Sci. 1995, 29, 17–38. [Google Scholar] [CrossRef]
  31. Yousefi, H.; Ghodusinejad, M.H.; Kasaeian, A. Multi-objective optimal component sizing of a hybrid ICE+PV/T driven CCHP microgrid. Appl. Therm. Eng. 2017, 122, 126–138. [Google Scholar] [CrossRef]
  32. Wang, J.; Jing, Y.; Zhang, C. Optimization of capacity and operation for CCHP system by genetic algorithm. Appl. Energy 2010, 87, 1325–1335. [Google Scholar] [CrossRef]
  33. Wang, J.; Zhai, Z.J.; Jing, Y.; Zhang, C. Particle swarm optimization for redundant building cooling heating and power system. Appl. Energy 2010, 87, 3668–3679. [Google Scholar] [CrossRef]
  34. Bracco, S.; Dentici, G.; Siri, S. Economic and environmental optimization model for the design and the operation of a combined heat and power distributed generation system in an urban area. Energy 2013, 55, 1014–1024. [Google Scholar] [CrossRef]
  35. Wang, M.; Wang, J.; Zhao, P.; Dai, Y. Multi-objective optimization of a combined cooling, heating and power system driven by solar energy. Energy Convers. Manag. 2015, 89, 289–297. [Google Scholar] [CrossRef]
  36. Abdollahi, G.; Sayyaadi, H. Application of the multi-objective optimization and risk analysis for the sizing of a residential small-scale CCHP system. Energy Build. 2013, 60, 330–344. [Google Scholar] [CrossRef]
  37. Xie, D.; Lu, Y.; Sun, J.; Gu, C.; Li, G. Optimal Operation of a Combined Heat and Power System Considering Real-time Energy Prices. IEEE Access 2016, 4, 3005–3015. [Google Scholar] [CrossRef]
  38. Clegg, S.; Mancarella, P. Integrated Modeling and Assessment of the Operational Impact of Power-to-Gas(P2G) on Electrical and Gas Transmission Networks. IEEE Trans. Sustain. Energy 2015, 6, 1234–1244. [Google Scholar] [CrossRef]
  39. Zhang, R.; Jiang, T.; Li, G.; Chen, H.; Li, X.; Ning, R. Bi-level optimal dispatch of wind power integrated energy system considering electric rotation gas absorption. Proc. CSEE 2018, 38, 5668–5679. [Google Scholar]
  40. Wu, C.; Tang, W.; Bai, M.; Zhang, L.; Cong, P. User-side energy Internet planning based on bilevel programming. Trans. China Electrotech. Soc. 2017, 32, 122–131. [Google Scholar]
  41. Zhou, Y.; Sun, G.; Huang, W.; Xu, E.; Wei, Z.; Chen, S.; Chen, F. Integrated Energy Coordination and Dispatch Optimization Model for Multi-Area Virtual Power Plants. Proc. CSEE 2017, 37, 6780–6790+7069. [Google Scholar]
  42. Du, H.; Jiao, X.; Wang, R.; Yao, Q. Trend Analysis on Leachate Yield of Domestic Waste Incineration Power Plant. Environ. Sanit. Eng. 2019, 27, 48–50+54. [Google Scholar]
  43. Tsai, W.-T. Analysis of municipal solid waste incineration plants for promoting power generation efficiency in Taiwan. J. Mat. Cycles Waste Manag. Jpn. 2016, 18, 393–398. [Google Scholar] [CrossRef]
  44. Maciel, F.J.; Juca, J.F.T. Evaluation of landfill gas generation and emissions in a MSW large -scale experimental cell in Brazil. Waste Manag. 2011, 31, 966–977. [Google Scholar] [CrossRef] [PubMed]
  45. Zhuang, Y. Computation of Leachate Generation on MSW Landfill. Envir. Sanitation Eng. China 2005, 13, 53–56. [Google Scholar]
  46. Tang, X. The Application of Biogas Power Generation in Sewage Treatment System-Biogas Power Generation Application in Leachate Treatment System of Waste Incineration Power Plant. Technol. Innov. Appl. 2017, 16, 91–92. [Google Scholar]
  47. You, Z.; You, S.; Li, X.; Hao, C. Biogas power plants waste heat utilization researches. In Proceedings of the 2009 IEEE 6th International Power Electronics and Motion Control Conference, Wuhan, China, 17–20 May 2009; pp. 2478–2481. [Google Scholar]
  48. Yadav, S.D.; Kumar, B.; Thipse, S.S. Biogas purification: Producing natural gas quality fuel from biomass for automotive applications. In Proceedings of the 2013 International Conference on Energy Efficient Technologies for Sustainability, Nagercoil, India, 10–12 April 2013; pp. 450–452. [Google Scholar]
  49. Li, Z.; Wang, C.; Liang, J.; Zhao, P.; Zhang, Z. Expansion Planning Method of Integrated Energy System Considering Uncertainty of Wind Power. Power Syst. Technol. 2018, 42, 3477–3487. [Google Scholar]
  50. Lei, J.; Yu, L.; Guo, X.; Li, P.; Li, C.; Wu, Y. Planning Method for Integrated Energy System with the Consideration of Coupling among Power, Heat, and Gas. Proc. CSU-EPSA 2019, 31, 19–24. [Google Scholar]
  51. Melchiorre, C.; Stefano, C.; Piero, P.; Mauro, R. Two-Level Evolutionary Multi-objective Optimization of a District Heating System with Distributed Cogeneration. Energies 2019, 12, 114. [Google Scholar]
Figure 1. Construction flow of physical planning topology.
Energies 12 03910 g001
Figure 2. Physical planning topology of park-level energy regional network.
Energies 12 03910 g002
Figure 3. Flowchart of solution algorithm.
Energies 12 03910 g003
Figure 4. Initial overview of the waste processing base (WPB).
Energies 12 03910 g004
Figure 5. Physical planning topology of a multi-energy circular system (MECS) coupled with WPB.
Energies 12 03910 g005
Figure 6. The energy price and waste transportation of a typical day. (a) Energy price; (b) Waste transportation.
Energies 12 03910 g006
Figure 7. Operation of wind turbine in a typical day.
Energies 12 03910 g007
Figure 8. Benefit comparison in WPB before and after planning. (a) Energy utilization ration; (b) Expenditure and income; (c) Carbon emission reductions.
Energies 12 03910 g008
Table 1. Information of the intrinsic equipment.
EquipmentInvestment ($)Original CapacityOperation and Maintenance Cost ($)Efficiency
WL6.1429/tNearly full0.84/tBiogas (80%)
Leachate (0.8 m3/t)
WI3557.1/t30 MW13.5/tPower (495.3 kWh/t)
Leachate (21.95%)
LT18,386/m33200 m35.93/m3Power (32.71 kWh/t)
Leachate (20.5 m3/m3)
BP1700/kW15 MW0.0074/kWhPower (40%)
WT/4 MW//
Table 2. Information of the multi-energy complementary equipment.
EquipmentInvestment ($)Operation and Maintenance Cost ($)Efficiency
BCP65/m30.0525/m350%
P2G800/kW0.042/kWh45%
PS142.86/kWh0.00027/kWhCharge (90%)
Discharge (90%)
GS6428.6/m30.315/m3Charge (58.4%)
Discharge (75%)
HS5/kWh0.00024/kWhCharge (90%)
Discharge (90%)
Table 3. The information of the multi-energy complementary equipment.
EquipmentCapacity (Unit)
Intrinsic Equipment
(Extension)
WL4896 t/day
WI1064.52 t/day
LT1628.71 m3/day
BP4.16k W/day
Muti-Energy Complementary Equipment
(Construction)
BCP146,610.48 m3/day
P2G723 kw/day
PS483.87 kWh/day
HS87.10 kWh/day
GS193.55 m3/day
Table 4. Benefit comparison of the system.
Energy (Utilization Ratio)Economy ($) (* 104)Environment (t/day)
ItemsBiogas/Natural GasHeatExpenditureIncomeIntrinsicNew
a1a2a3saleGSb1HSc1c2c3c4d1d2WIBPa3
Original0.50.5///0/2.66.514.70.065.564.31135.988.9/
Current00.10.1~0.8~00.9~015.415.020.50.114.9142.32717.7~88.92515.8
a1, a2, and a3 refer to direct combustion, generation, and vehicle. b1 is LT operation. c1, c2, c3, and c4 refer to investment, operation and maintenance, ecological construction, and carbon tax. d1 and d2 are waste disposal subsidy and energy benefit.

