1. Introduction
The development of LED lighting technologies has reached the stage of maturity. The gap in luminous efficacy between LED and traditional light sources at the same or better lighting quality parameters justifies the replacement of traditional lighting on a large scale. There is significant difference between the operating conditions of a new lighting installation, designed for new buildings, and a replacement, or merely retrofitting, of an existing lighting installation. Replacement of lighting installations usually takes place in older buildings, where important changes in the planned working process were established, and at least some kind of building adaptation was made. In such cases, the electrical installation is often left in its original condition, and rarely completely adapted to new conditions or changes in technologies of electrical devices in use.
One of such configurations was used as an example of the lighting flicker study presented in this paper. Shortly after fluorescent lighting was replaced by an LED lighting installation in a part of the office building, complaints were noted about annoying light flicker in some offices.
The appearance of light flicker with LED lighting was widely studied and analyzed in the past decade [
1,
2,
3,
4,
5,
6], but most of the studies were focused on the intrinsic flicker caused by LED drivers in normal operating conditions, and only a few of them were dealing with flicker induced by rapid voltage changes (RVC) [
7,
8,
9,
10]. The severity of voltage fluctuations of the supplied voltage in an electric distribution network has been examined thoroughly in the past decades, and the European countries limit it with the use of the electric power quality Standard EN 50160, which sets limits for short and long term flicker severity. Locally induced RVC is limited by the Electromagnetic Compatibility Directive, which sets compatibility levels for electrical equipment.
The main goal of our study was to determine an adequate solution or set of solutions for mitigating light flicker in such a particular situation when an existing lighting installation is renewed with LED lighting, electrical wiring from local to floor and to the main distributor is long, and local electrical devices with high inrush current are present at the location.
We have analyzed the following possible solutions for limiting the flicker in this situation: Replacement of LED drivers with less sensitive or flicker-free, relocation of the device causing the RVCs to another location and phase of the supply voltage, and general improvement of electrical power installations. We have also considered the installation of an active voltage conditioner (AVC), and an UPS as a possible solution to the problem. AVC could be an acceptable solution for larger facilities, with multiple problematic, non-replaceable production devices. The high cost of AVCs investment and regular maintenance was the cause that we discarded them as a possible solution in the case of an office building.
Changing the wiring of the electrical installation was eliminated as a possible solution because of the long distances across the various facilities causing the excessive volume of work and expenses.
The lighting installation, consisting of glare free, non-dimmable LED panels with 36 and 42 W luminaire system power and the electrical installation were examined, and on-site measurements were performed of the lighting and electric power quality. In order to find the correct solution, the sensitivity of LED drivers to RVC should be determined, and the possible influence of the connection point of the laser printer on the amplitude of the supply voltage modulation.
Mitigating light flicker caused by voltage fluctuations still lacks clear and prescribed procedures. While voltage fluctuations are limited by power quality Standards, RVCs can be induced locally by devices that pass the IEC compatibility procedures [
11], as is evident from the analysis presented in this paper.
The sensitivity of LED drivers to RVCs varies from complete immunity to very sensitive [
12]. While properly designed [
13,
14,
15,
16,
17], and flicker-free LED drivers solve the problem of light flicker, there are still very sensitive drivers on the market and in use. IEC TR 61547-1 [
18] is one of the first international attempts to prescribe lighting equipment immunity levels to voltage fluctuations. A light flickermeter, based on the IEC voltage flickermeter is introduced by IEC for this purpose and uses the same statistical flicker severity indexes as are used in voltage flickermeter design. The statistical approach of evaluating flicker ignores maximal measured values, which can in the case of RVCs mean several of the highest values per minute.
A presentation of percent flicker at given frequencies was introduced in the IEEE Std 1789 [
19]. This kind of presentation was intended to be used only for light sources during normal supply voltage conditions, although it is already used, and is, with some modification, also suitable for presenting sensitivity to RVCs.
The aim of the procedure described in this paper is to provide the necessary actions to mitigate the light flicker in LED lighting and to bring attention to the importance of setting the immunity levels of LED drivers. In order to fulfil this task, the source of locally induced voltage fluctuations has to be identified. The instantaneous and short-term flicker indexes are derived measures and are not very helpful for the purpose of identifying local sources of voltage fluctuations. These have to be identified in the cases of already built in sensitive light sources, even if the next generations of LED drivers will be immune to RVCs.
In the case discussed in this article, the voltage disturbances are caused by the laser printer due to the zero voltage crossing (ZVC) with the time shift power control technique of the heating element. Such RVCs vary in duration, but the presence of specific harmonic components is characteristic of them. A method to identify such specific local sources of RVC is presented in the paper.
2. Methods Used to Perform the Actions in the Procedure
A procedure to select the appropriate solution for mitigating light flicker in office lighting is shown in
Figure 1. Step 1 in the procedure was performed with simultaneous voltage measurements of lighting supply voltage in the office and at the building’s connection terminal. Identification of the source of RVCs was done with an analysis of illuminance and voltage waveforms, measured at the working place where the light flicker was noticed. Identification was confirmed with a Matlab Simulink model.
Experimental setup to perform for step 4 in the procedure consisted of a programmable power supply, an integrating sphere for measuring the light output of the LED module with interchangeable LED drivers, and a data acquisition system. Multiple instances of the same LED driver types were measured.
A Matlab Simulink model was developed to confirm the identification of the source of RVCs, and to evaluate the effects of connecting identified device to its own electric phase.
A Dewesoft SIRIUS (SN: D00C018078, DEWESOFT d.o.o., Trbovlje, Slovenia) data acquisition system was used for voltage, current and light measurements, with a Minolta T1 lux meter as a light sensor. The work place illuminance has been measured on the affected task area directly under the luminaire, and simple shields were used to prevent stray light impact. The light incidence angle, room temperature and distance to illuminance meter head have no influence on the results, as all of the methods and procedures are based on the relative values.
The same measurement set-up was used for laboratory measurements, with a CHROMA 61500 (Model 61501, CHROMA ATE Inc., Taoyuan, Taiwan) as a programmable electric power source. Some data processing was made with Dewesoft X data acquisition software at the time of measurements, whilst data were saved on a laptop computer for later processing with Matlab (R2015a, The Mathworks Inc., Natick, Massachusetts). On-site measurements were made with a data sample rate of 200,000 samples per second as the light flicker source was yet unknown. The data sample rate for the laboratory measurements was adjusted to 20,000 samples per second with additional filtering of the high harmonic content, as recommended in [
20].
2.1. Sensitivity of the LED Luminaire to Rapid Voltage Changes
Because of the strong response of the LED to the voltage harmonic component at 25 Hz, the sensitivity of the LED driver to RVCs had to be checked.
Sinusoidal and rectangular voltage modulation are mostly used for the evaluation of light sources’ sensitivity to voltage fluctuations in Standards and other studies. The rectangular shape of voltage fluctuations with an amplitude of 1% was chosen to simulate the real RVCs observed on-site.
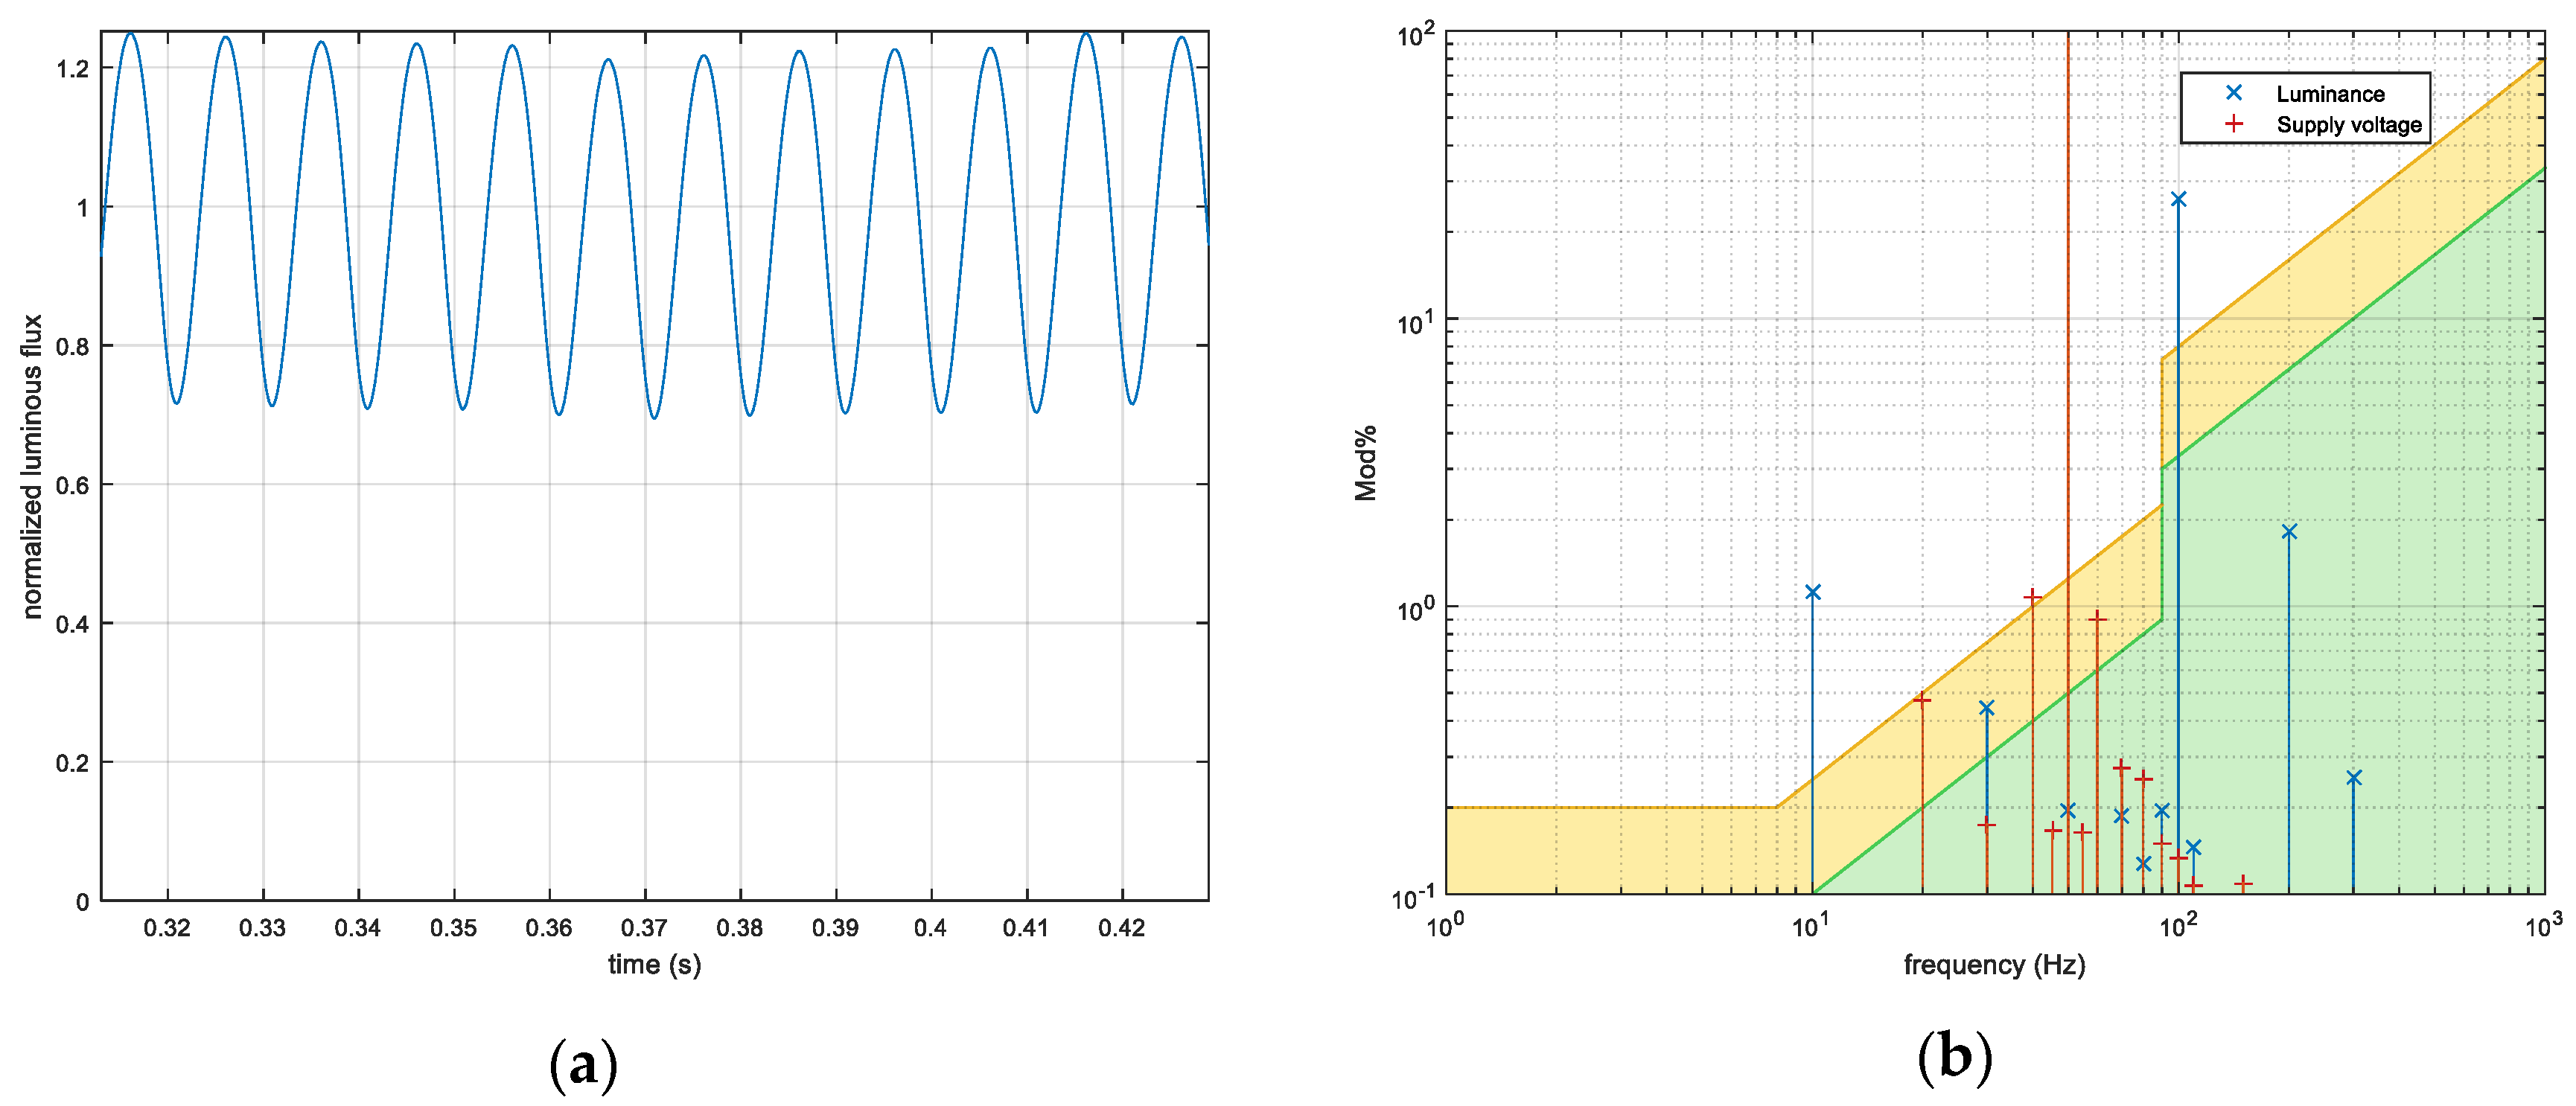
An example of modulated light output as a function of time is shown in
Figure 2a and its harmonic content in
Figure 2b. The supply voltage of the LED luminaire with a factory supplied driver was modulated with a rectangular signal of 1% amplitude and a frequency of 10 Hz.
Sinusoidal voltage modulated by a rectangular signal can be described as:
where
U is the RMS supply voltage,
fn is the network frequency,
fm is the modulation frequency, and
Am is the modulation amplitude. Initial phase angles of voltage and modulation signal
φn and
φm were set to zero.
The modulated voltage signal (1) can be replaced by the Fourier series, as written in Equation (2), where the odd coefficients
An are calculated and the even coefficients are equal 0 [
1,
3].
A set of interharmonic components, with a frequency equal to the difference between network frequency and the corresponding modulation harmonic frequency, are obtained by replacing the product of two sine functions, as is evident from
Figure 2b.
2.2. Light Flicker in A Steady-State Operation and Gain Factor Measurements
Flicker percent and flicker index are used mostly to quantify the severity of light flicker during steady-state operation of light sources [
21]. In the case of periodic modulation, where the modulation is symmetrical in a half period, flicker percent is equal to modulation amplitude in percentage, also known as modulation depth. Under normal operating conditions, the light modulation frequency is double compared to the voltage network frequency, which was true for traditional light sources. Electronic ballasts can produce light modulation at other frequencies, and the amplitude of the modulation of the light output at a given frequency should be considered.
Flicker percent can be used as a criterion for quantifying light flicker if modulation frequency is also considered. Such an approach was chosen in IEEE 1789-2015 [
19], where light output modulation is presented as a flicker percent at a given modulation frequency in a graph with overlapped flicker sensitivity curves. An example of such presentation is shown in
Figure 2b.
The area of acceptable light modulation is limited by the approximation of the IEC flicker sensitivity curve [
20], which is displayed on a logarithmic scale on both axes and linearized across the sections. In this way, three different frequency ranges are obtained, as shown in
Figure 2b. Presentation of results as chosen in the IEEE Std 1789 was intended solely for the flicker evaluation of light sources during normal operation. However, it is also well suited to the presentation of the light output modulation resulting from fluctuations in the supply voltage.
The linearization of the IEC flicker sensitivity curve is described in [
19], but it is not completely clear if the shift of frequency on the frequency axis was taken into account, since the IEC curve represents sensitivity to voltage changes per time unit, and the IEEE recommended area represents sensitivity to light output modulation as a function of frequency. Research done over the last decade shows that the frequency of maximum observer sensitivity is between 15 and 18 Hz [
21,
22], or the double frequency of 8.8 Hz, which is used as one of the threshold points of the linearization area based on the IEC curve.
2.3. Gain Factor
Sensitivity of light sources to Rapid Voltage Changes is most often presented as a gain factor, as described in Equation (4). The relationship between changes in the light output and voltage amplitudes relative to their nominal values for traditional light sources can be described by Equation (3). Illuminance, luminance or light intensity are usually used for light output changes.
where
γ is in the range of 3.4 to 3.8 for a standard incandescent lamp, ∆
V/
V and ∆
L/L are the relative changes in voltage and luminance amplitudes, respectively, and
V and
L are their nominal values.
The linearized expression (3) is used in the IEC flicker meter as the weighting gain factor at given frequency:
where
gf is the gain factor at a given frequency.
The results of gain factor measurements for a series of traditional light sources, such as fluorescent, halogen and also LED light sources, are published and available [
4,
10,
23,
24], but most of the analyzed LED light sources were for residential use. Only recently, an overview was made of the gain factor measurements, where LED drivers were classified by their topology, showing great diversity in LED drivers’ sensitivity to RVCs [
2]. Gain factors of LED drivers in the frequency range of up to 100 Hz are mostly smaller than that of an incandescent lamp. However, there are some types of drivers’ topology that are even more sensitive to RVCs than incandescent lamps.
3. Results and Analysis of Measurements
3.1. On-Site Measurements
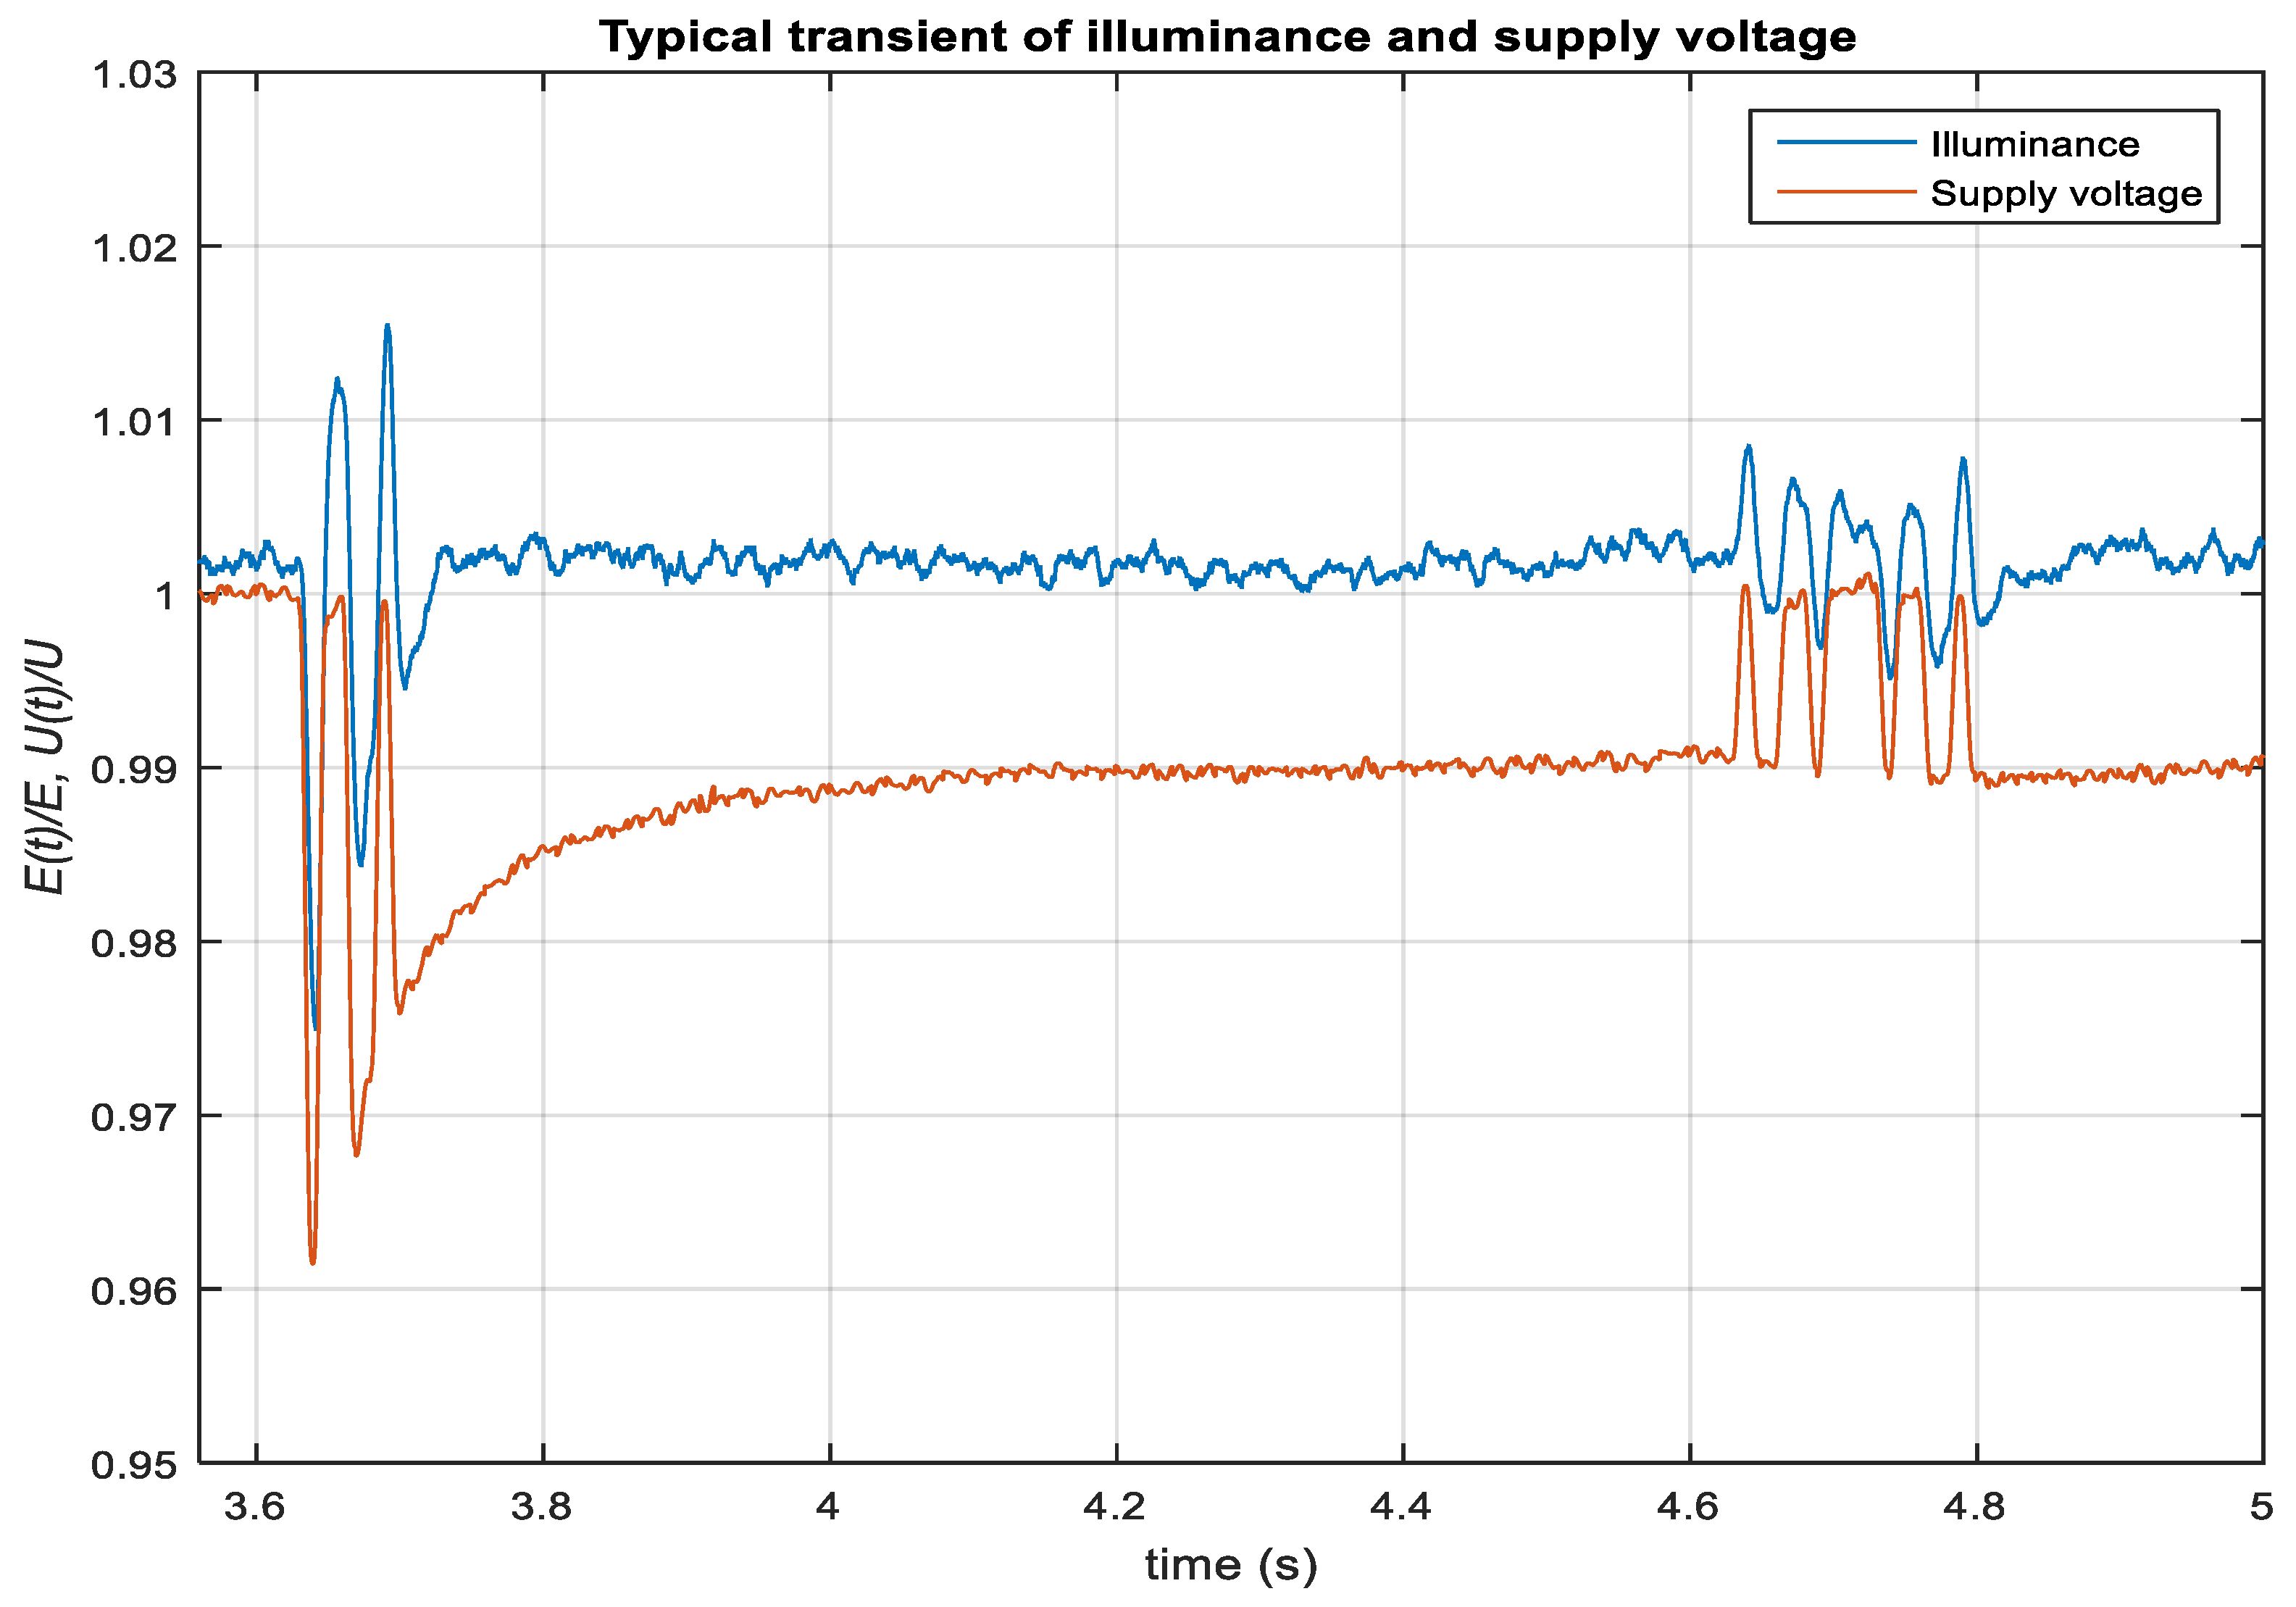
Faulty or poorly designed LED drivers or RVCs were considered as possible sources of light flicker. On-site measurements of the lighting supply voltage and illuminance have confirmed occurrences of annoying light flicker that corresponded with voltage fluctuations. The duration of voltage fluctuation corresponded with the duration and sequence of light flicker. The localization, duration and occurrence pattern of disturbances shown in
Figure 3 indicates that a local single-phase electric device was the cause of voltage fluctuations.
As the annoying light flicker was occurring only locally in some parts of the building, voltage fluctuations at the point of common coupling were excluded as its possible source.
Normalized RMS time values of lighting supply voltage and illuminance, shown in
Figure 3, imply that the source of voltage fluctuation and light flicker is a single local device. Longer-lasting measurements indicate that the form of the disturbance is characteristic, and consists of a significant voltage drop with declining amplitude at startup of the device, and some minor disturbances with a constant amplitude that can be repeated several times. The shape of the disturbance is characteristic for electric heating elements, which confirms that the electrical device causing the disturbance is a laser printer, in our case a multi-function office device.
Harmonic analysis of the modulated supply voltage and the illuminance for the time sections at startup and at the end of the startup cycle are shown in
Figure 4a,b. Harmonic signal analysis confirms the significant light modulation of the LED module at a frequency of 100 Hz, as well as several harmonic components in the lower frequency range. Due to the high level of light modulation at 100 Hz, the luminaire with such LED driver is not recommended for use in general lighting, but compatibility levels have not yet been set internationally. The percentage of users sensitive to light flicker at frequencies above 50 Hz is very small, but some may experience headaches and other consequences [
21,
25,
26,
27].
When comparing the harmonic components of modulated voltage and illuminance, the frequencies should not be compared directly, as the modulation of the emitted light is caused by the interharmonic components of the voltage. The harmonic component of illuminance at 12.5 Hz is caused by the harmonic component at the difference between the frequency of the harmonic of illuminance and the power frequency [
1],
fl =
fn−
fm = 50–37.5 Hz, where
fn is the power frequency and
fm the frequency of the corresponding modulation harmonic.
A closer look at the harmonic analysis in the range up to 50 Hz shown in
Figure 4a,b shows some deviations from the expected results. Besides the harmonic components of illuminance at 12.5 and 37.5 Hz, which depend on the load duration, there is a significant harmonic illuminance component at 25 Hz that is almost identical to the voltage component. The 25 Hz component is also independent of the duration of the load cycle, indicating the presence of an additional source of voltage disturbance. A comparison of the most important harmonic components of the supply voltage and the illumination up to 50 Hz is given in
Table 1.
The presence of the device that uses a ZVC power control technique in the electric circuit was confirmed with the help of data processing of measured illuminance and lighting supply voltage. A sliding window with a width of 200 milliseconds was selected as an observation period. The signal in the selected time window was repeated to improve frequency resolution, and frequency range over 50 Hz was filtered. The ratio of the illuminance and the voltage harmonic components were compared to the ratio of components defined by the width of the window, as shown in
Table 1.
3.2. Sensitivity of the LED Luminaire to Rapid Voltage Changes
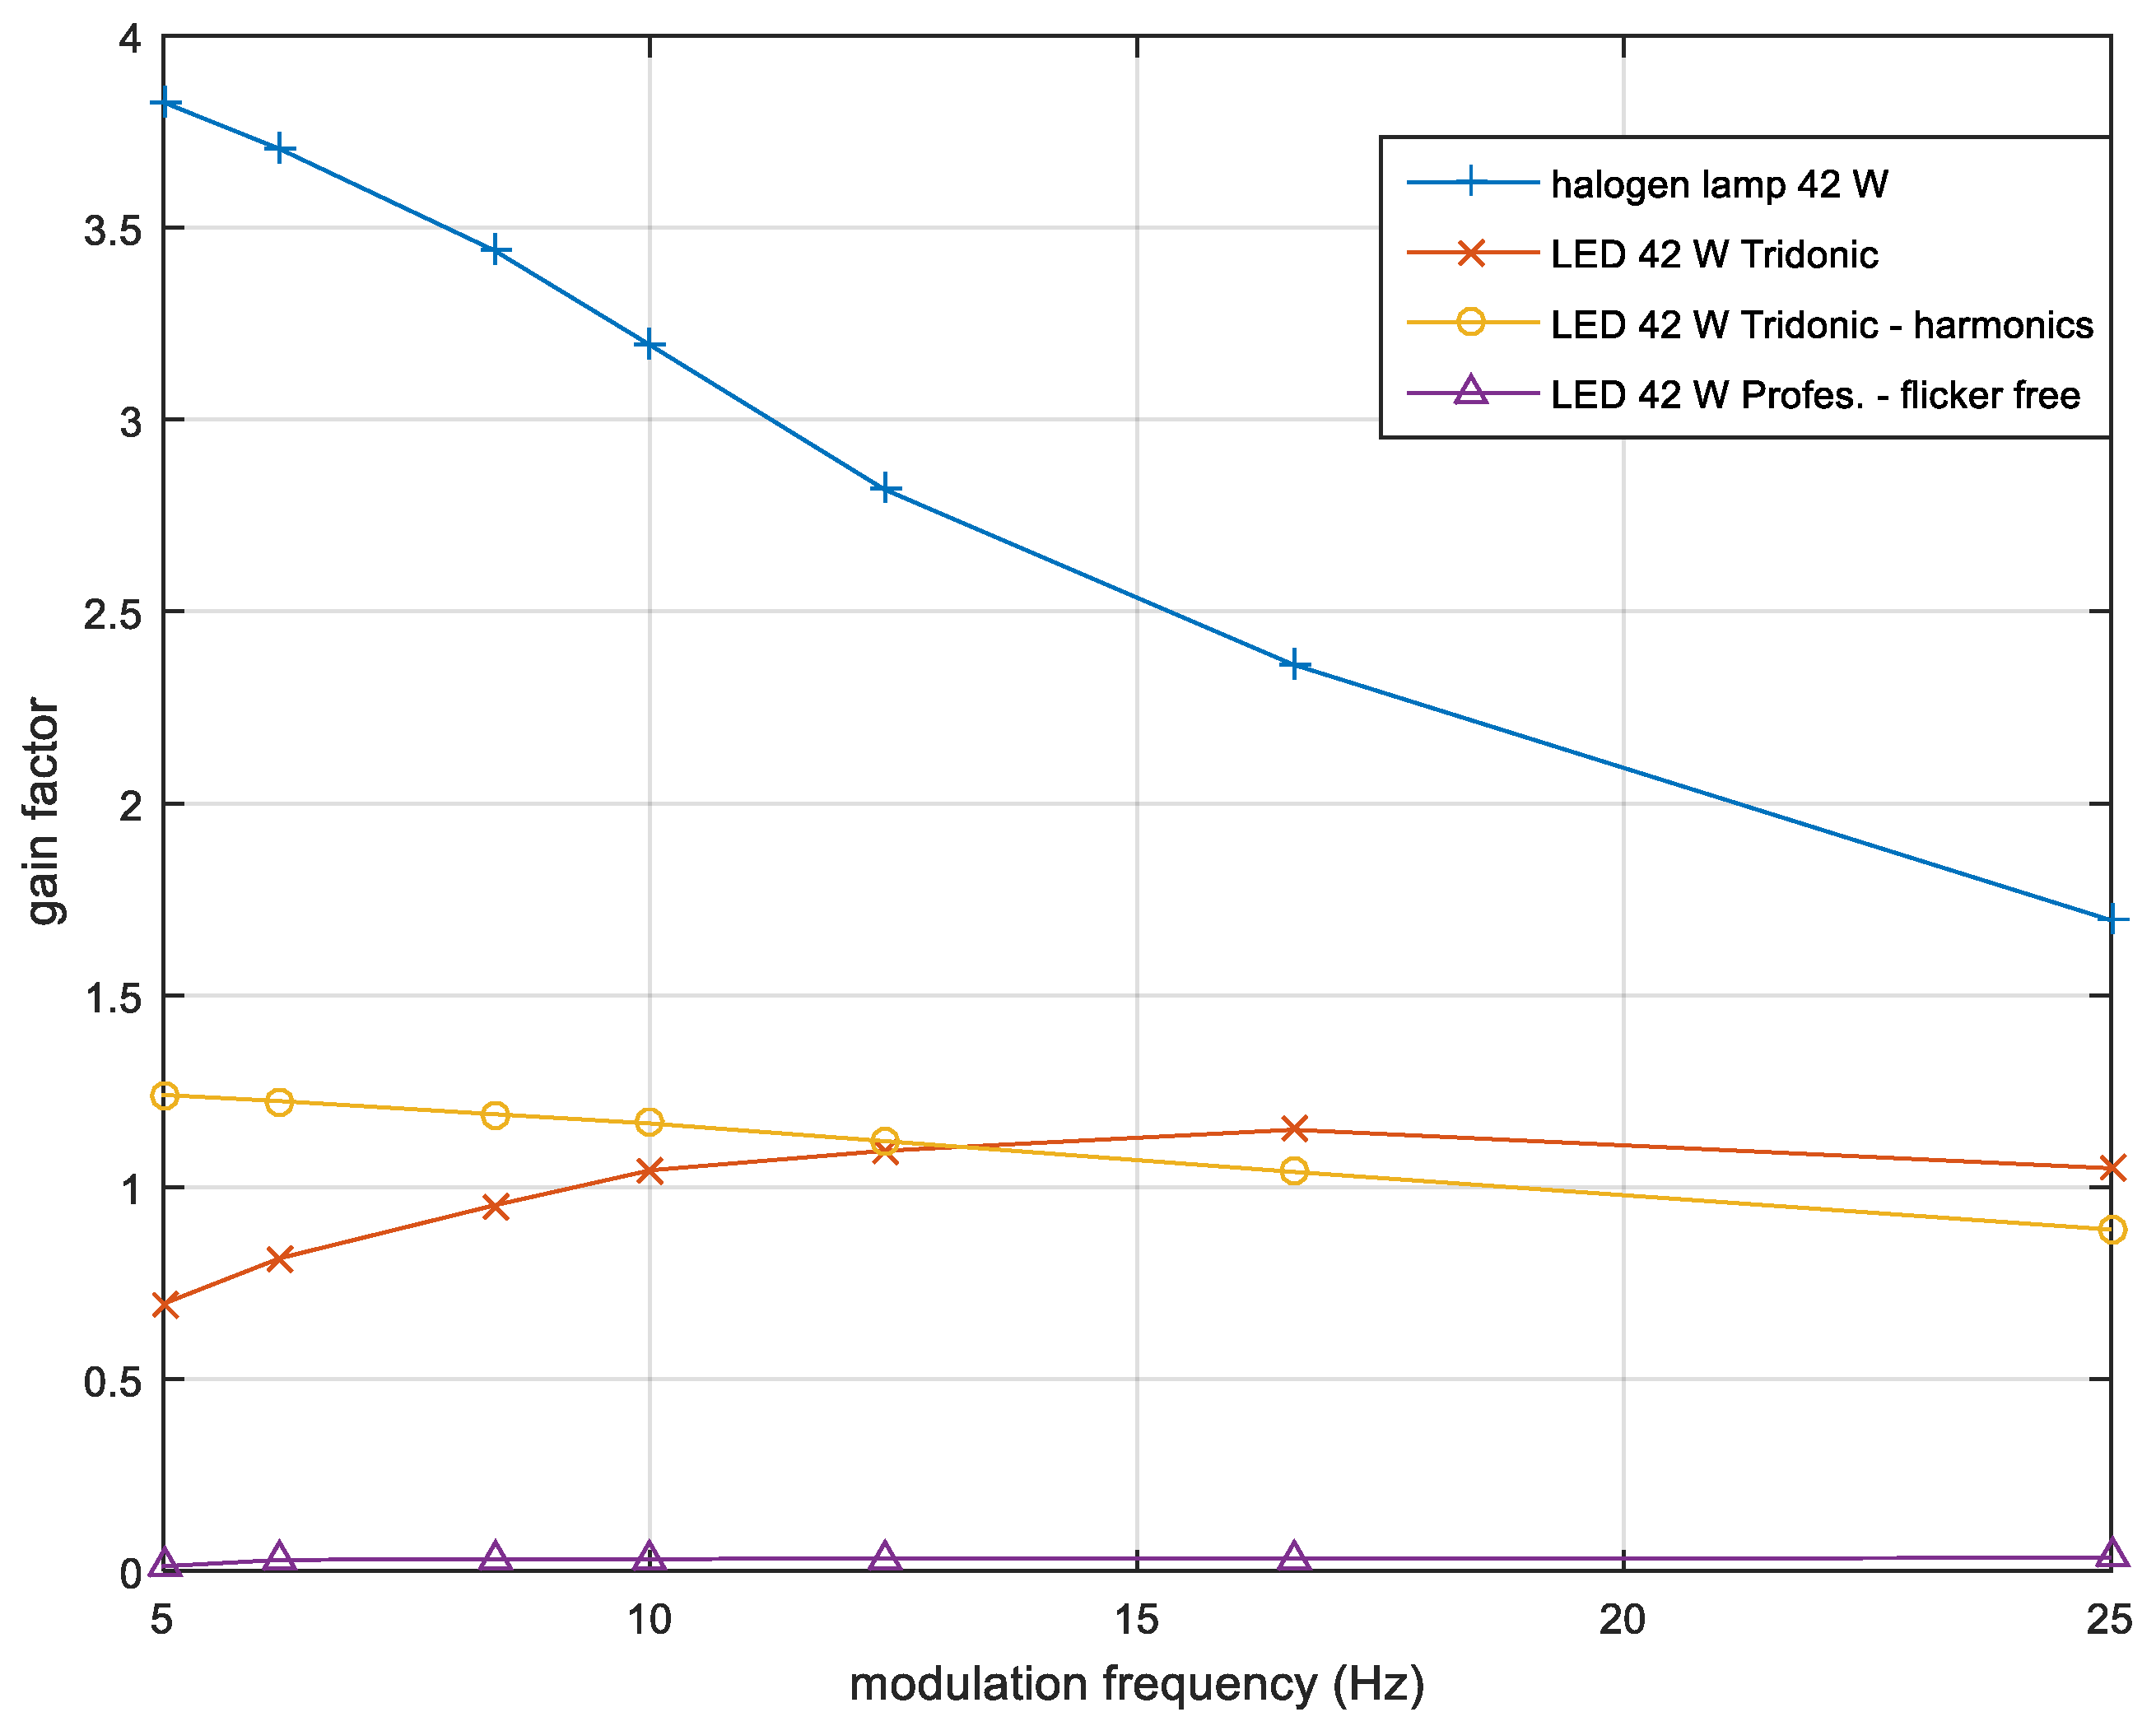
The results of the gain factor measurements for a halogen lamp and an LED luminaire operating with different LED drivers are shown in
Figure 5. Measurements were carried out using a rectangular modulated voltage with 1% modulation amplitude, to emulate original disturbances closely. A halogen lamp was used as a reference since its relationship to incandescent lamps is well known.
Gain factor curves for the factory supplied Tridonic LED driver (LC 45W fixC SR SNC, Tridonic, Dornbirn, Austria) with a nominal power of 42 W was measured and calculated as in Equation (4), and as a ratio of harmonic coefficients of illuminance and supply voltage. Some of the proposed flicker evaluation methods are based on Fourier analysis of illuminance, which needs to be investigated further, as is evident from the comparison of gain factor curves shown in
Figure 5.
The gain factors at 12.5 Hz, calculated from harmonic coefficients, correspond well with the values from
Table 1 measured on-site, if a slightly different amplitude of modulation is taken into account. Due to the notable difference at 25 Hz, the source of disturbances was analyzed in more detail.
3.3. Analysis of the Source of Disturbances
Some of the local devices, such as office laser printers or multi-function devices, can cause significant Rapid Voltage Changes in supply voltage due to the changing load during operation. Electromagnetic Compatibility Standard IEC 61000-3-3 [
11] limits the magnitude of RVCs that could result from variable load, but the restrictions are less so if the inrush current of the device does not exceed 10 A. The power control of the device during changing load is performed by period skipping with the zero-voltage crossing with time shift (ZVC) technique, which is a common way of controlling the power of heating devices. The ZVC power control technique could be used for two purposes, the first to control the changing required power of the electric heater, and the second to limit the RMS value of inrush current to 10 A, in order to achieve compliance with allowed voltage drop in the electromagnetic compatibility requirements of IEC 61000-3-3.
We measured the current and voltage at the start and during the operation cycle of a Minolta multi-function device using the same measuring setup.
Figure 6a shows the waveform of inrush current during the copying cycle of the device. The duration of the increased load cycle is slightly longer than recorded at the device start up and shown as supply voltage changes in
Figure 3. Inspection of the current waveform reveals that the ZVC technique is used for power control during the operation cycle, resulting in a strong subharmonic component at 17 and 25 Hz, as shown in
Figure 6b.
Besides the harmonic components at approximately 17 and 25 Hz, there is also a noticeable harmonic component at a lower frequency, the frequency of which depends on the duration of the operating cycle. Depending on the required heater power during the operation of the printer, the duration of the increased power consumption and the combination of the omitted periods and half-periods of the current also differ, which, later could lead to RVCs in a problematic frequency range.
4. Influence of the Connection Point of the Device on Voltage Fluctuations
Changing the location and the connection point of an interfering device was considered as one of the possible solutions for reducing the light flicker to an acceptable level. Location changing options were limited, because of the localized working process and the length of the electric wiring between the local and floor distributor. The amount and the shape of the inrush current results in significant voltage drop, at least across the impedance of the common neutral conductor. We limited the possible solutions to change the connection of the device to different phases and locations within the offices, any other solution would not be justified financially.
A model of electric installations was developed in Matlab Simulink (R2018, The Mathworks Inc., Natick, Massachusetts), as shown in
Figure 7. A laser printer was included in the numeric model as a current source. Furthermore, the influence was analyzed of the printer’s connection point on RVCs in the lighting supply voltage. The lighting supply voltage was used as an input to the digital flickermeter in Matlab Simulink [
28] to check the instantaneous flicker.
The largest contribution to the total circuit impedance is the resistance of the phase and neutral conductors between the local, floor and building distributors, with a length of approximately 45 m and 120 m respectively. Conductors with a cross-section of 4 mm2 and 10 mm2 are used for electric wiring to the floor distributor and building distributor, respectively. The resistance of the phase conductor R_Line_1 and the phase angle between the voltage source and load current were adjusted in the model to emulate phase and location changes of the connected device.
Simulation results confirmed that the analyzed laser printer was connected to the same electric phase as the observed part of the lighting system. Changing its location would improve flicker conditions in observed offices, but could cause the annoying light flicker in others. RVCs are generated during the working cycle of the device across a shared part of line and neutral conductor with the cumulative impedance of 0.82 Ω.
Based on the description of the working process in our example, the duration of the simulation was set to 10 min, with one minute of printer typical working cycle.
The simulation results in the form of digital flicker output, for a working cycle of approximately one minute, are shown in
Figure 8. The current of the laser printer used as a current source in simulation is shown in
Figure 9. Comparing the weighted voltage changes and the Output S5 in
Figure 8 shows clearly that not only the change in RMS value but also the shape of the current waveform contributes to instantaneous flicker sensation
Pinst. Larger spikes in
Pinst are occurring during the start and the end of working cycles, when the current’s periods are skipped by the ZVC technique of the device’s power control unit.
The frequency of voltage source in the simulation had to be adjusted to the frequency at the time of current measurements and was set to 49.984 Hz. One minute of simulation is long enough that the instability of network frequency can have a significant impact on the phase angle between voltage and current at the start and end of the simulation.
Figure 10 shows the typical disturbance in RMS voltage of a lighting supply calculated with the Matlab Simulink model presented in
Figure 7. The shape of the RVC is very similar to the shape of the RVC measured on-site and shown in
Figure 2, even though two different events are presented. Differences in the shape of the voltage transients at the start and end of the working cycle are due to the fact that voltage in
Figure 3 is a half period RMS voltage, and the voltage shown in
Figure 10 is calculated as RMS over the entire period.
Changes of flicker indexes for different connection points of a laser printer, calculated in Matlab Simulink simulations, are shown in
Table 2. Changing the connection point of the device that causes the RVCs to different phase results in lower RVC in the lighting supply voltage, and lower flicker severity. A reduction of RVC to 25% of the initial values was expected, but calculated values are even lower, except for the values of
Pst, which drops to approximately 40%.
Calculated short term flicker severity indexes
Pst for all three examples are below the limit and indicate, that the light flicker at the workplace should be tolerable, or even non existing, which is not the case. Calculated values for P
0.1 shown in
Table 1 indicates, that connecting the lighting installation on phase L1, and all other electric loads on remaining two phases could be a possible solution in this particular case. The system power of LED lighting installation is much lower than the system power of replaced installation, which makes this solution possible.
5. Discussion
The sensitivity of LED drivers for general lighting to RVCs varies from complete immunity to very sensitive, as shown in
Figure 5. Installing the flicker-free LED drivers would solve the problem of light flicker, as is evident from the procedure shown in
Figure 1, but there are very sensitive drivers already in use, and still available on the market.
IEC TR 61547-1 [
18] is one of the first international attempts to prescribe lighting equipment immunity levels to voltage fluctuations. A light flickermeter, based on the IEC voltage flickermeter is introduced by IEC for this purpose. Short term flicker severity
Pst is used as the immunity criteria, which could be appropriate for longer lasting disturbances, but is not suitable to evaluate the intermittent nature of locally induced RVCs, as is evident from the results of Matlab Simulink simulations shown in
Table 2.
The IEEE Std 1789 [
19] introduced a presentation of percent flicker at given frequencies, as shown in
Figure 2b. This presentation could be used for presenting sensitivity to RVCs if samples are measured with selected shape and amplitude of modulation. The limit line for visible flicker range in the IEEE Std 1789 is based on the same human vision sensitivity curve as is used in IEC standards and is in the frequency range between 10 and 30 Hz very close to it. Original
Pst curve was measured for low luminance adaptation levels, and narrow visual field, which was appropriate for home lighting in the time it was developed. In general lighting of work places adaptation luminance levels are much higher, and visual field involved could be near π steradians [
22]. In the case of the high adaptation levels and wider visual field, not only the frequency of maximum sensitivity changes from 8.8 to 15–20 Hz but also sensitivity is higher. It is very unlikely that LED drivers would produce light modulation at frequencies below the double of power supply nominal frequency under nominal supply voltage conditions. In the case of modulations in the frequency range between 15 to 30 Hz caused by RVCs, light flicker could become visible, despite LED driver being in accordance with The Practice 1 limits of IEEE Std. 1789.
Instantaneous and short-term flicker indexes are derived measures and are not very helpful for the purpose of identifying local sources of voltage fluctuations. These have to be identified in the cases of existing sensitive light sources, even if the next generations of LED drivers will be immune to RVCs.
In the case discussed in this article, the voltage disturbances caused by the laser printer due to the ZVC power control of the heating element varies in duration, but the presence of harmonic components at 12.5, 16.67, or 25 Hz are characteristic. To identify such device, harmonic analysis must be done.
Comparison of the gain factor curves shown in
Figure 5 indicates a significant difference between the calculation based on Equation (4) and by calculating the ratio of illuminance and voltage harmonics. This could be due to rectangular modulation of the supply voltage, but differences in gain factors measured with rectangular and sinusoid modulations are well known for standard lamps and are constant over a low frequency range. Since some of the proposed flicker evaluation measures are based on harmonic analysis of illuminance, this deviation should be studied in more detail and with more complex modulation waveforms.
6. Conclusions
In order to analyze the possibility of reducing the severity of light flicker in the object under consideration, the procedure presented in
Figure 1 was followed. We analyzed the sensitivity of the selected LED drivers to RVCs, confirmed the suitability of the electrical installations, and analyzed the operation of the device that causes local disturbances in the lighting supply voltage. For the purpose of the analysis we performed on-site measurements of the voltage and illuminance, laboratory measurements of the responses of the lamps to (RVC), and simulations of the suitability of electrical installations in the Matlab Simulink.
The electrical installation is old, but still within current and voltage design recommendations. The renovation would not ensure the functioning of existing lighting without occasional flicker, as the factory supplied LED drivers are more sensitive to RVCs in comparison to fluorescent lighting.
Installing LED drivers with very low sensitivity to voltage changes, or even flicker-free ones, active voltage conditioner, and over dimensioning of electrical installations are possible solutions to address annoying light flicker in object under consideration, but later involve unnecessary investment. Flicker free variants of LED drivers are well known, even for higher lighting system power [
14,
15], but are usually used for special lighting purposes, such as sport lighting, or lighting of fast moving objects, which reflects in their prices. Their sensitivity to RVCs is negligible, within the measurement error. The procedure followed in this article shows that setting appropriate international immunity levels for LED drivers would prevent excessive flicker in the working environment even without other measures.
The use of ZVC with time shift technique to control the power of heating elements in laser printers requires in-depth analysis, and IEC compatibility test procedures should be adjusted to include Pinst, max or at least P0.1 as a compatibility parameter.
While the presented procedure used in this paper for light flicker mitigation is simple, methods to evaluate single steps are complex and time consuming. Defining an appropriate immunity and emissivity levels for lighting equipment and electric devices that can produce RVCs in electrical circuits would prevent annoying light flicker in general and residential lighting applications.


