Article

Comparison of Four Methods for Borehole Heat Exchanger Sizing Subject to Thermal Response Test Parameter Estimation

1
School of Energy Science and Engineering, Harbin Institute of Technology, Harbin 150001, China
2
School of Architecture, Harbin Institute of Technology, Harbin 150001, China
3
Key Laboratory of Cold Region Urban and Rural Human Settlement Environment Science and Technology, Ministry of Industry and Information Technology, Harbin 150001, China
*
Authors to whom correspondence should be addressed.
Energies 2019, 12(21), 4067; https://doi.org/10.3390/en12214067
Submission received: 16 August 2019 / Revised: 22 October 2019 / Accepted: 22 October 2019 / Published: 25 October 2019

Abstract

:
The impact of different parameter estimation results on the design length of a borehole heat exchanger has received very little attention. This paper provides an in-depth investigation of this problem, together with a full presentation of six data interpretation models and a comprehensive comparison of four representative sizing methods and their inter models. Six heat transfer models were employed to interpret the same thermal response test data set. It was found that the estimated parameters varied with the data interpretation model. The relative difference in borehole thermal resistance reached 34.4%, and this value was 11.9% for soil thermal conductivity. The resulting parameter estimation results were used to simulate mean fluid temperature for a single borehole and then to determine the borehole length for a large bore field. The variations in these two correlated parameters caused about 15% and 5% relative difference in mean fluid temperature in the beginning and at the end of the simulation period, respectively. For computing the borehole design length, software-based methods were more sensitive to the influence of parameter estimation results than simple equation-based methods. It is expected that these comparisons will be beneficial to anyone involved in the design of ground-coupled heat pump systems.

Graphical Abstract

1. Introduction

Ground-coupled heat pump (GCHP) systems enjoy a wide range of applications because of their high efficiency, energy savings, environmental friendliness, and low land coverage. A GCHP system often uses vertical borehole heat exchangers (BHEs) to exchange heat with a subsurface structure. A diagrammatic drawing of a standard U-tube exchanger borehole configuration is shown in Figure 1, with U-shape pipes installed in a borehole and grouting material between the pipes and the wall. The heat carrier fluid is circulated through the piping system to exchange heat between the ground and the building end-users. Since a BHE is an essential part of a GCHP system and accounts for almost half of the system’s initial cost, it is of extreme importance to have a reliable method for sizing it.
At the present stage, existing BHE design methods can generally be categorized into three types according to their complexity: the rules of thumbs method, simple equation-based methods, and software-based methods.
In the rule of thumb method, the required length that satisfies the peak cooling or heating load demand is determined according to an estimated heat transfer rate (with a unit of W/m). This method relies mostly on the past project experience of the designers and lacks a scientific basis. Thus, it is not considered in this paper [1,2].
Simple equation-based methods are widely used in practice for their quick calculations. A significant feature of simple equation-based methods is that the number of heat pulses adopted is limited. An example of such a method is the ASHRAE method [2], which originated from Kavanaugh and Rafferty’s work [3] and is now described in the ASHRAE Handbook. Another representative is the IGSHPA method [4], which used to be a standard method to size BHEs in North America. The design equations of such methods are consolidated from analytical heat transfer models through a series of simplifications; they also retain a limited number of heat pulse parameters, and they determine the length of the BHE required for both heating and cooling (the larger value is retained) to achieve the desired system performance on the basis of a worst-case scenario.
Software-based methods are somewhat more complicated because they often employ a more complex underlying model that can more realistically consider load representation, bore field geometry, borehole configuration, soil and fluid thermal properties, and dynamic heat pump characteristics, among other factors. Herein, this kind of method mainly refers to those methods in which monthly or hourly loads are used, not only software or simulation tool-based ones. These design tools or simulation programs compute the mean fluid temperatures of the heat pump(s) after inputting the system parameters and then compare the simulated minimum or maximum fluid temperature of the heat pump(s) with the user-specified constraint values. The smallest length that satisfies the requirement is sought iteratively. A number of design and analysis computer programs are available—such as EED, GLHEPRO using Eskilson’s non-dimensional temperature response factor g-functions [5], and TRNSYS software with the embedded duct ground heat storage model (DST) component developed by Pahud and Hellstrom [6,7].
Each method has its own inter model, referring to a combination of mathematical equations or the calculation steps to obtain design borehole length. For each method, its inter model is often formulated from a specified underlying heat transfer model [8,9]. Assessing the performances of these methods is a tough task. On the one hand, it is necessary to figure out how each method works since the underlying models of the methods differ in their settings of basic assumptions, initial and boundary conditions, simplified methods, as well as solutions. On the other hand, a range of system parameters should be collected to complete a large number of comparison runs; these parameters include all the physical and thermal properties of different materials and equipment related to the calculation of building thermal loads, interpretation of thermal response test data, and rating of the heat pump, and other factors. Validating the methods experimentally is even more difficult because of a lack of sufficient operation data support. Consequently, only a handful of studies have compared multiple BHE design methods or experimentally validated different methods.
Thornton et al. [10] compared the results of five practical vertical BHE sizing programs with the results of a calibrated simulation model, and Shonder et al. [11] added one more program to the updated versions of these five in a follow-up study. One main conclusion made by the authors is that the existing commercial programs yield inconsistent results, with differences of about 6–16%. However, in these studies, the programs used for sizing were referenced by a letter designation (A–F), without much focus on the design algorithms. Kurevija et al. [12] performed a comparison between Eskilson’s g-function method and the ASHRAE method for one building in Croatia and showed that the ASHRAE method produced smaller sizes for a 30-year design. A comparison between these two methods using experimental data sets for four locations was carried out by Cullin et al. [13], who showed that the ASHRAE method produced errors from –21% to 167%. Similar comparisons [14] have been performed for simulated buildings and different kinds of design methods. However, these comparisons have given little attention to the inter models and the design algorithms themselves.
In the design of vertical GCHPs, accurate knowledge of soil thermal properties is critical. In practice, a thermal response test (TRT) is usually used to provide important design parameters for a GCHP system. In most cases, a TRT is used to estimate both borehole thermal resistance and soil thermal conductivity, which are then used in the design calculations of BHEs. This technology is realized by installing a pilot borehole of approximately the same size and depth as those planned for the project, recording temperatures and flow rates measured during the test, comparing the tested data with that calculated from a selected heat transfer model, and then estimating ground thermal properties using a parameter estimation (PE) method. ASHRAE suggests that the line source, the cylindrical, or a numerical algorithm be applied and that, when possible, more than one of these methods be applied to enhance the reported accuracy. However, a tricky issue has long been overlooked: When applying more than one inverse method, should the estimated parameters be averaged? Or should a more convincing result be selected? Furthermore, a consistent problem still arises between performing independent measurements of ground thermal properties and applying these properties to determine borehole length for a BHE. For example, Beier maintained that the calculation method of fluid temperature evolution should be consistent in both the test analysis and the design approach [15]; otherwise, significant errors will be introduced to the design. Although there are relevant studies dealing with the comparison of TRT interpretation models [16,17,18], few have concentrated on the influence of TRTPE models on the BHE system design. Are the heat transfer model used in TRT data interpretation and the underlying model in the design calculation based on a consistent assumption? How much impact will it have if the two models do not match each other? Alternatively, under what circumstances will the inconsistency problem significantly affect the final borehole length result? Under what circumstances will it have little impact? These are all open questions at this moment.
The above analysis reveals that although various kinds of heat transfer models and sizing methods have been developed for the design and analysis of BHEs and GCHP systems, little attention has been paid to comparing them, especially with the aim of thoroughly understanding the basic formulations and fundamental principles of these methods. To the best of our knowledge, to date, there has been no lumped assessment of different types of BHE design methods that have comprehensively compared their underlying model performances during TRT interpretation. Accordingly, this paper attempts to evaluate different types of BHE design methods in principle and compare the behaviors of their underlying inter models. Most importantly, this paper tries to fill a gap in the literature by investigating the influence of different TRTPE results on the temperature field simulation for a single borehole, as well as on the design of the borehole length for a bore field.

2. Heat Transfer Models for TRTPE

The TRT was first developed by Mogenson [19] and has since become a routine method that is used throughout the world to obtain information about ground thermal properties [20]. As mentioned above, a TRT is typically performed on a vertical pilot borehole, and specific instruments are designed to measure the thermal behavior of circulating fluid under a constant heat flux. Most importantly, tested data need to be interpreted and compared with simulated data from an appropriate heat transfer model. Adjusting the estimated parameters can bring the tested data and simulated data closer to each other, and the parameters that lead to the minimum root-mean-square error for a preset precision are taken as the results. For the whole process, the inverse heat transfer model is essential. In this paper, attention is only paid to the pure heat conduction problem. Groundwater and moisture immigration that may complicate the governing equations are regarded as rare cases and excluded from consideration.

2.1. Heat Transfer Models

Under the assumption of a homogeneous and isotropic medium, the transient heat transfer conduction is governed by the Fourier equation
ρ s c s T ( r , θ , z ) τ = κ s 2 T ( r , θ , z ) ,
where cs is specific heat capacity, J·kg−1·K−1; ρs is soil density, kg·m−3; and κs is soil thermal conductivity, W·m−1·K−1. In BHE applications, the cylindrical coordinate system (r, θ, z) is generally adopted, and the Laplace operator ∇ is then expressed as
2 = 1 r r ( r r ) + 1 r 2 ( 2 θ 2 ) + 2 z 2
In the thermal problem schematized in Figure 1, Equation (1) should be solved in each domain (i.e., soil, grout, and tube wall) with appropriate boundary conditions (BCs) and initial conditions (ICs). A good number of models have been developed in order to solve the partial differential equations in Equation (1) by analytical or numerical means or a combination of the two. Each model is based on some kind of approximation that reflects a simplified formulation of an equation set (including Equation (1) and preset BCs and ICs). There are inherent differences in the basic assumptions, BCs, and ICs between these models, and even for the same model, different solution methods can lead to different results.
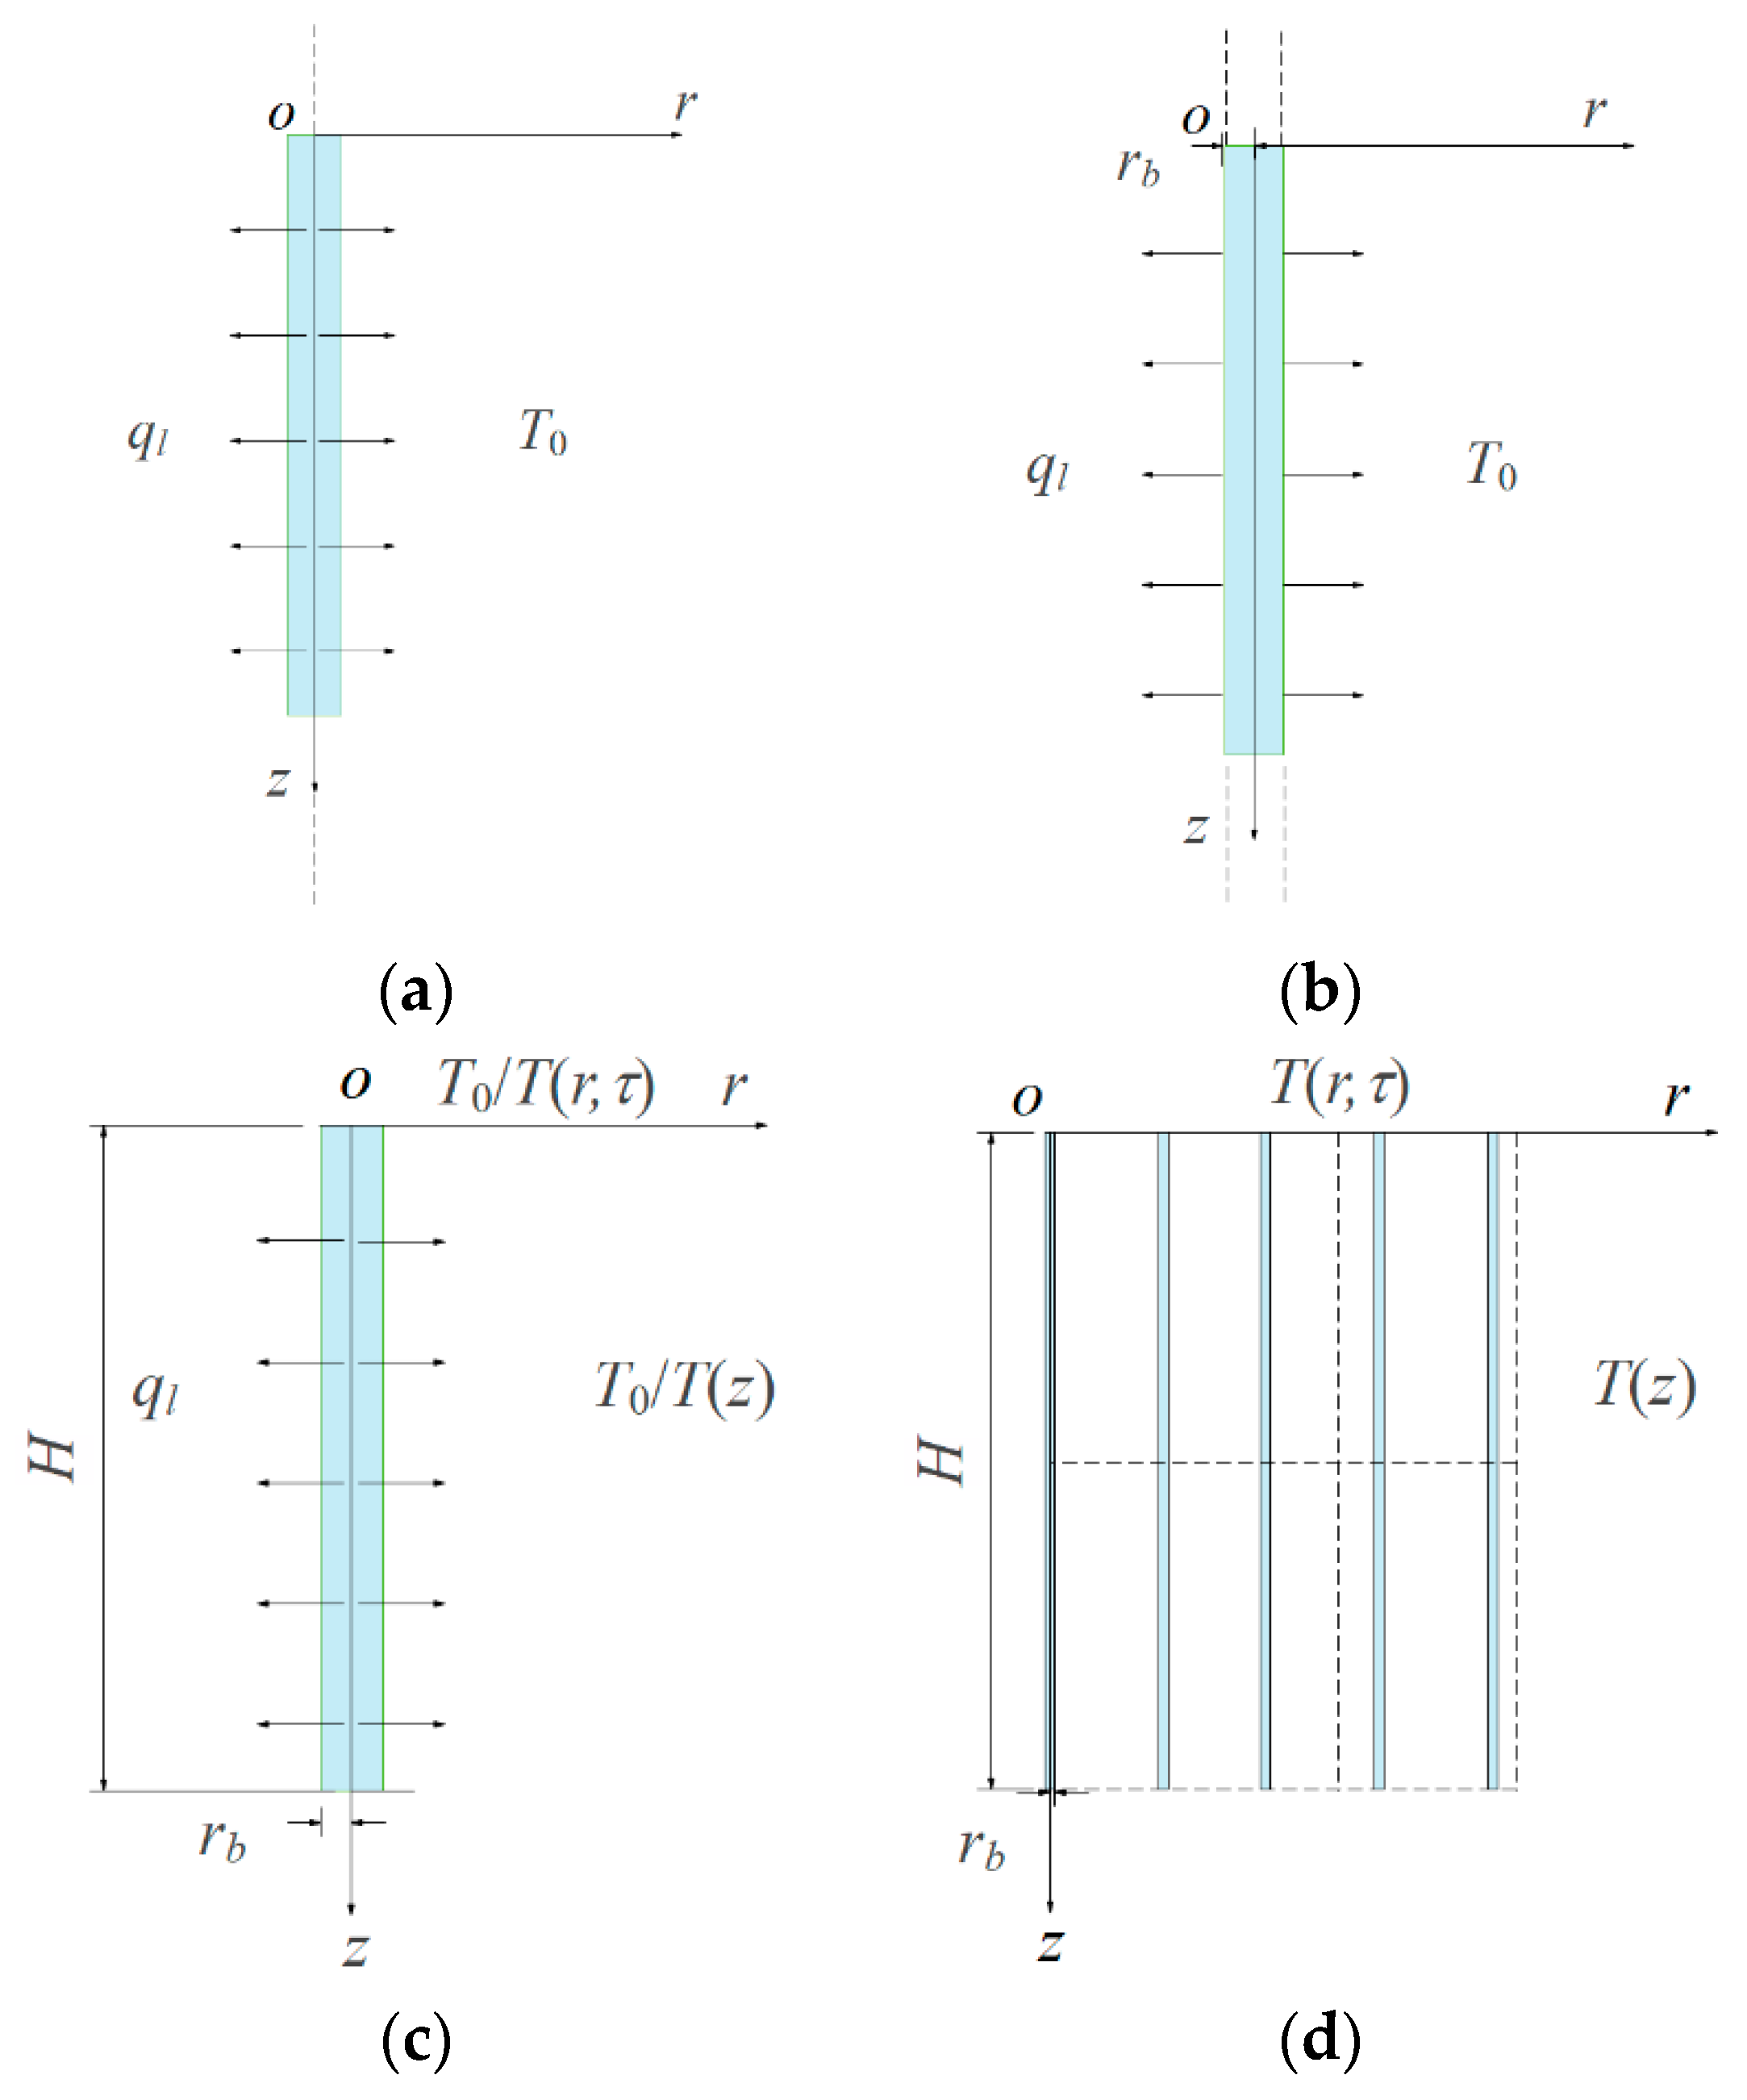
As an example, the infinite line source model (ILS) [21] assumes that the borehole is an infinite line source located in the center of the borehole and that the ground is a homogeneous and isotropic medium with a constant initial temperature. Thus, the heat conduction problem decreases to a one-dimensional schematization in which the temperature field only changes in the radial direction. The infinite cylindrical source model (ICS) [22,23] slightly differs by considering the borehole to be an infinite cylindrical heat source. An improvement is made in the finite line source model (FLS) [5], which accounts for the finite length of the borehole. It is worth noting that the FLS itself has dozens of solutions [24], including both analytical and numerical ones, with different BCs and ICs. A representative FLS with a numerical solution (FLSN) is a combination of Eskilson’s long time-step solution [5] and Yavuzturk’s short time-step solution [25], and it has been implemented in some design tools and simulation programs. An FLS with a simple analytical solution (FLSA) is exemplified by Bandos et al.’s [26] asymptotic expansion formulas. The improved FLS under complex conditions (FLSCC) proposed by Zhang et al. [27] is also interesting because it considers variable ground surface and subsurface temperatures. Another notable numerical representative is the DST model. As reported by Zhang et al. [20], these models are all suitable for conducting TRTPE in practice; among them, the ILS and ICS are the most widely used in engineering applications. The FLS (especially the FLSN) and DST are models that underlie famous design tools and simulation programs [8]. In addition to the FLSN and DST, a number of other numerical heat transfer models are applicable to TRTPE and BHE design. They are usually solved by commercial software, such as FLUENT, ANSYS, or COMSOL. However, because of their extremely high computational cost, they are neither widely used in TRTPE nor suitable for direct incorporation into a building simulation program with hourly or sub-hourly time steps. These numerical models still have a long way to go to achieve widespread practical application. Thus, only the above six heat transfer models—ILS, ICS, FLSN, FLSA, FLSCC, and DST—were selected to interpret TRT data and obtain important design input parameters for comparison runs. These models are not only suitable for TRT data interpretation but also able to serve as the underlying models for the inter models of some BHE sizing methods. That is to say, underlying heat transfer models can be reformulated into the inter model for BHE sizing method by considering complex load representation, heat pump characteristics, and multi-borehole configuration, etc. A simple schematic representation of the selected models is illustrated in Figure 2. Since the DST is a three-dimensional numerical model, only the schematic diagram of a mesh division in the longitudinal section is given. During TRT analysis, the number of boreholes should be set to 1.
The mean borehole wall temperature T b(°C) is an intermediate parameter that builds a bridge between the steady-state process inside the borehole and the transient heat transfer process outside the borehole. In the following subsections, the equations related to directly computing T b are presented for each method.

2.1.1. ILS

In this paper, the ILS employs Carslaw and Jaeger’s solution [22], and the mean borehole wall temperature is expressed by
T b ¯ = T 0 + q l R s = T 0 + q l 4 π κ s E 1 ( r b 2 4 a s τ ) ,
where T0 refers to undisturbed ground temperature, °C; ql is the heat transfer rate, W·m−1; rb is the borehole radius, m; Rs is the equivalent thermal resistance of soil, K·m·W−1; and αs is soil thermal diffusivity, m²·s−1
α s = κ s / ρ s c s
The exponential integral E1 in Equation (4) is computed by means of a power series expansion
E 1 ( r b 2 4 a s τ ) = r b 2 4 a s τ e u u d u = ln ( r b 2 4 a s τ ) γ n = 1 [ ( 1 ) n n n ! ( r b 2 4 a s τ ) n ] ,
where γ is Euler’s constant, 0.5772.

2.1.2. ICS

Instead of complex integral expressions with Bessel functions, tabulated values at a specific dimensionless radius [23], or fitting formulae [28], the solution of the ICS utilizes the equation proposed by Baudoin [29], expressed by
T b ¯ = T 0 + q l R s = T 0 + q l G ( τ ) κ s = T 0 + q l 2 π κ s r b j = 1 10 [ V j j K 0 ( ω j r ) ω j K 1 ( ω j r b ) ] ,
ω j = j ln ( 2 ) α s τ ,
V j = k = I n t ( j + 1 2 ) min ( j , 5 ) ( 1 ) j 5 k 5 ( 2 k ) ! ( 5 k ) ! ( k 1 ) ! k ! ( j k ) ! ( 2 k j ) ! ,
where K0 and K1 are modified Bessel functions of the second kind of order 0 and 1, respectively. The term G(τ)/κs is the equivalent thermal resistance of soil Rs, K·m·W−1.

2.1.3. FLSN

Calculating the solution of FLSN can be facilitated by using a combination of the short time-step g-function from Yavuzturk’s numerical solution [25] and the long time-step g-function from Eskilson [5] proposed by Maestre et al. [30], expressed as
T b ¯ = T 0 + q l 2 π κ s g ( τ τ s s , r b H ) ,
where H is the borehole depth, m. The boundaries of the unsteady state τmin (s) and the steady state τss (s) are defined as
τ min = 5 r b 2 / α s ,
τ s s = H 2 / 9 α s
When τ < τmin,
g ( τ τ s s , r b H ) = g s t ( τ τ s s , r b H ) = β 1 , F L S N ln 4 ( τ τ s s ) + β 2 , F L S N ln 3 ( τ τ s s ) + β 3 , F L S N ln 2 ( τ τ s s ) + β 4 , F L S N ln ( τ τ s s ) + β 5 , F L S N ln ( r b 0.0005 H )
where βi,FLSN is a fitting parameter for i =1 – 5.
When τ > τmin,
g l t ( τ τ s s , r b H ) = { ln ( H 2 r b ) + 1 2 ln ( τ τ s s ) τ min < τ < τ s s ln ( H 2 r b ) τ > τ s s
This treatment with the FLSN is, in fact, implemented analytically. As a result, it can be easily used for TRTPE, together with an optimization algorithm.

2.1.4. FLSA

The solution of FLSA employs the findings of Bandos et al. [26], as illustrated in Equations (14) and (15).
When 5τmin << τ << τss/9,
T ¯ b = q l 4 π κ s [ ln 36 τ H 2 τ s s r b 2 γ + 3 r b H 18 π 4 τ τ s s 1 π r b 2 2 H 2 τ s s 4 τ + r b 2 H 2 τ s s 36 τ ]
When τ >> τss/9,
T ¯ b = q l 4 π κ s { 4 sinh 1 H 2 r b 2 sinh 1 3 H 2 r b + 3 r b H 4 1 + r b 2 H 2 + 4 + r b 2 H 2 τ s s 3 / 2 324 τ 3 / 2 π [ 1 τ s s ( 1 + r b 2 / H 2 ) 60 τ ] }

2.1.5. FLSCC

The FLSCC is an FLS model under more complex ICs and BCs proposed by Zhang et al. [27]. The boundary condition is replaced by a shortened form of Kusuda and Achenbach’s [31] mathematical model to describe the subsurface temperature field. For ground surface (z = 0), the variation in the ground surface temperature ψ(τ) (°C) can be expressed as
ψ ( τ ) = T m + T a m sin ( ω τ + ω Δ τ ) ,
ω = 2 π / τ p d ,
where Tm is the annual mean ground surface temperature, °C; Tam is the amplitude of temperature oscillations, °C; ω is the angular frequency, rad·s−1; ωτ is the initial phase, rad; and τpd is the period of temperature oscillations, s.
For capturing random weather changes that occur over a few days, for instance, during a TRT, the temperature information needs to be transformed into the superposition of sinusoidal functions, expressed as
ψ ( τ ) = i = 1 n [ T a m i sin ( ω i τ + ω i Δ τ i ) ]
For the subsurface, the undisturbed subsurface temperature at the initial condition φ(τ = 0) (°C) is expressed by
φ ( z ) = T 0 s + k z ,
where T0s is the ground surface temperature at the point z = 0, °C, and k represents the geothermal gradient, °C·m−1. It should be noted that ψ(0) at z = 0 should be equal to φ(0) at τ = 0.
The solution resulting from complex initial and boundary conditions is given by
T ¯ g s + T ¯ = i = 1 n { T a m i d p i e H / d p i [ cos ( H / d p i ω i τ ω i Δ τ i ) + sin ( H / d p i ω i τ ω i Δ τ i ) ] 2 H + T a m i d p i [ sin ( ω i τ + ω i Δ τ i ) cos ( ω i τ + ω i Δ τ i ) ] 2 H } + T 0 s e r f ( H 4 α s τ ) + T m e r f c ( H 4 α s τ ) + T m + T 0 s H [ 4 α s τ π exp ( H 2 4 α s τ ) 4 α s τ π ]
where dp is the depth of thermal penetration from the ground surface and equal to the square root of ω divided by twice of αs, expressed in units of m.
d p = ω / ( 2 α s )
The final solution of the FLSCC is obtained by calculating the superposition of Equations (14), (15), and (20). Therefore, for the FLSCC, the mean borehole wall temperature is found by the following.
When 5τmin << τ << τss/9,
T ¯ b = q l 4 π κ s ( ln 36 τ H 2 τ s s r b 2 γ + 3 r b H 18 π 4 τ τ s s 1 π r b 2 2 H 2 τ s s 4 τ + r b 2 H 2 τ s s 36 τ ) + i = 1 n { T a m i d p i e H / d p i [ cos ( H / d p i ω i τ ω i Δ τ i ) + sin ( H / d p i ω i τ ω i Δ τ i ) ] 2 H + T a m i d p i [ sin ( ω i τ + ω i Δ τ i ) cos ( ω i τ + ω i Δ τ i ) ] 2 H } + T 0 s e r f ( H 4 α s τ ) + T m e r f c ( H 4 α s τ ) + T m + T 0 s H [ 4 α s τ π exp ( H 2 4 α s τ ) 4 α s τ π ]
When τ >> τss/9,
T ¯ b = q l 4 π κ s { 4 sinh 1 H 2 r b 2 sinh 1 3 H 2 r b + 3 r b H 4 1 + r b 2 H 2 + 4 + r b 2 H 2 τ s s 3 / 2 324 τ 3 / 2 π [ 1 τ s s ( 1 + r b 2 / H 2 ) 60 τ ] } + i = 1 n { T a m i d p i e H / d p i [ cos ( H / d p i ω i τ ω i Δ τ i ) + sin ( H / d p i ω i τ ω i Δ τ i ) ] 2 H + T a m i d p i [ sin ( ω i τ + ω i Δ τ i ) cos ( ω i τ + ω i Δ τ i ) ] 2 H } + T 0 s e r f ( H 4 α s τ ) + T m e r f c ( H 4 α s τ ) + T m + T 0 s H [ 4 α s τ π exp ( H 2 4 α s τ ) 4 α s τ π ]
Equations (22) and (23) indicate that the only difference between the FLSCC and FLSN is whether the solution resulting from complex ICs and BCs is added by superposition. In other words, the FLSCC is reduced to the FLSA if the ICs and BCs are set to constant. Although the final solution of the FLSCC contains many functional relationships and integral forms, most of them are basic functions, and others are solvable special functions. It is easy to solve using computing tools, such as MATLAB or Mathematica.

2.1.6. DST

The DST was developed by Hellström [6] and has been embedded in the commercial software TRNSYS [7]. In this model, the computational domain is called the storage volume, within which the bore field can only be a cross-sectional area with a certain depth, and boreholes can only be uniformly placed. The basic problem in the analysis is divided into three thermal processes: a global thermal process, a local thermal process, and a steady-flux process. The final solution is a superposition of the solutions of these three parts. The global thermal process through the storage volume and the surrounding soil and the local thermal process around a single BHE are solved numerically using a two-dimensional explicit finite difference method, whereas a steady-flux regime uses Carslaw and Jaeger’s infinite line source analytical solution [22]. Basically, the interaction between the storage region and the surrounding soil (including the interaction between the BHEs within the storage region) is covered by the global solution, the short time variations are accounted for by the local problems, and the slow redistribution of heat during injection/extraction is handled by the steady-flux solution.
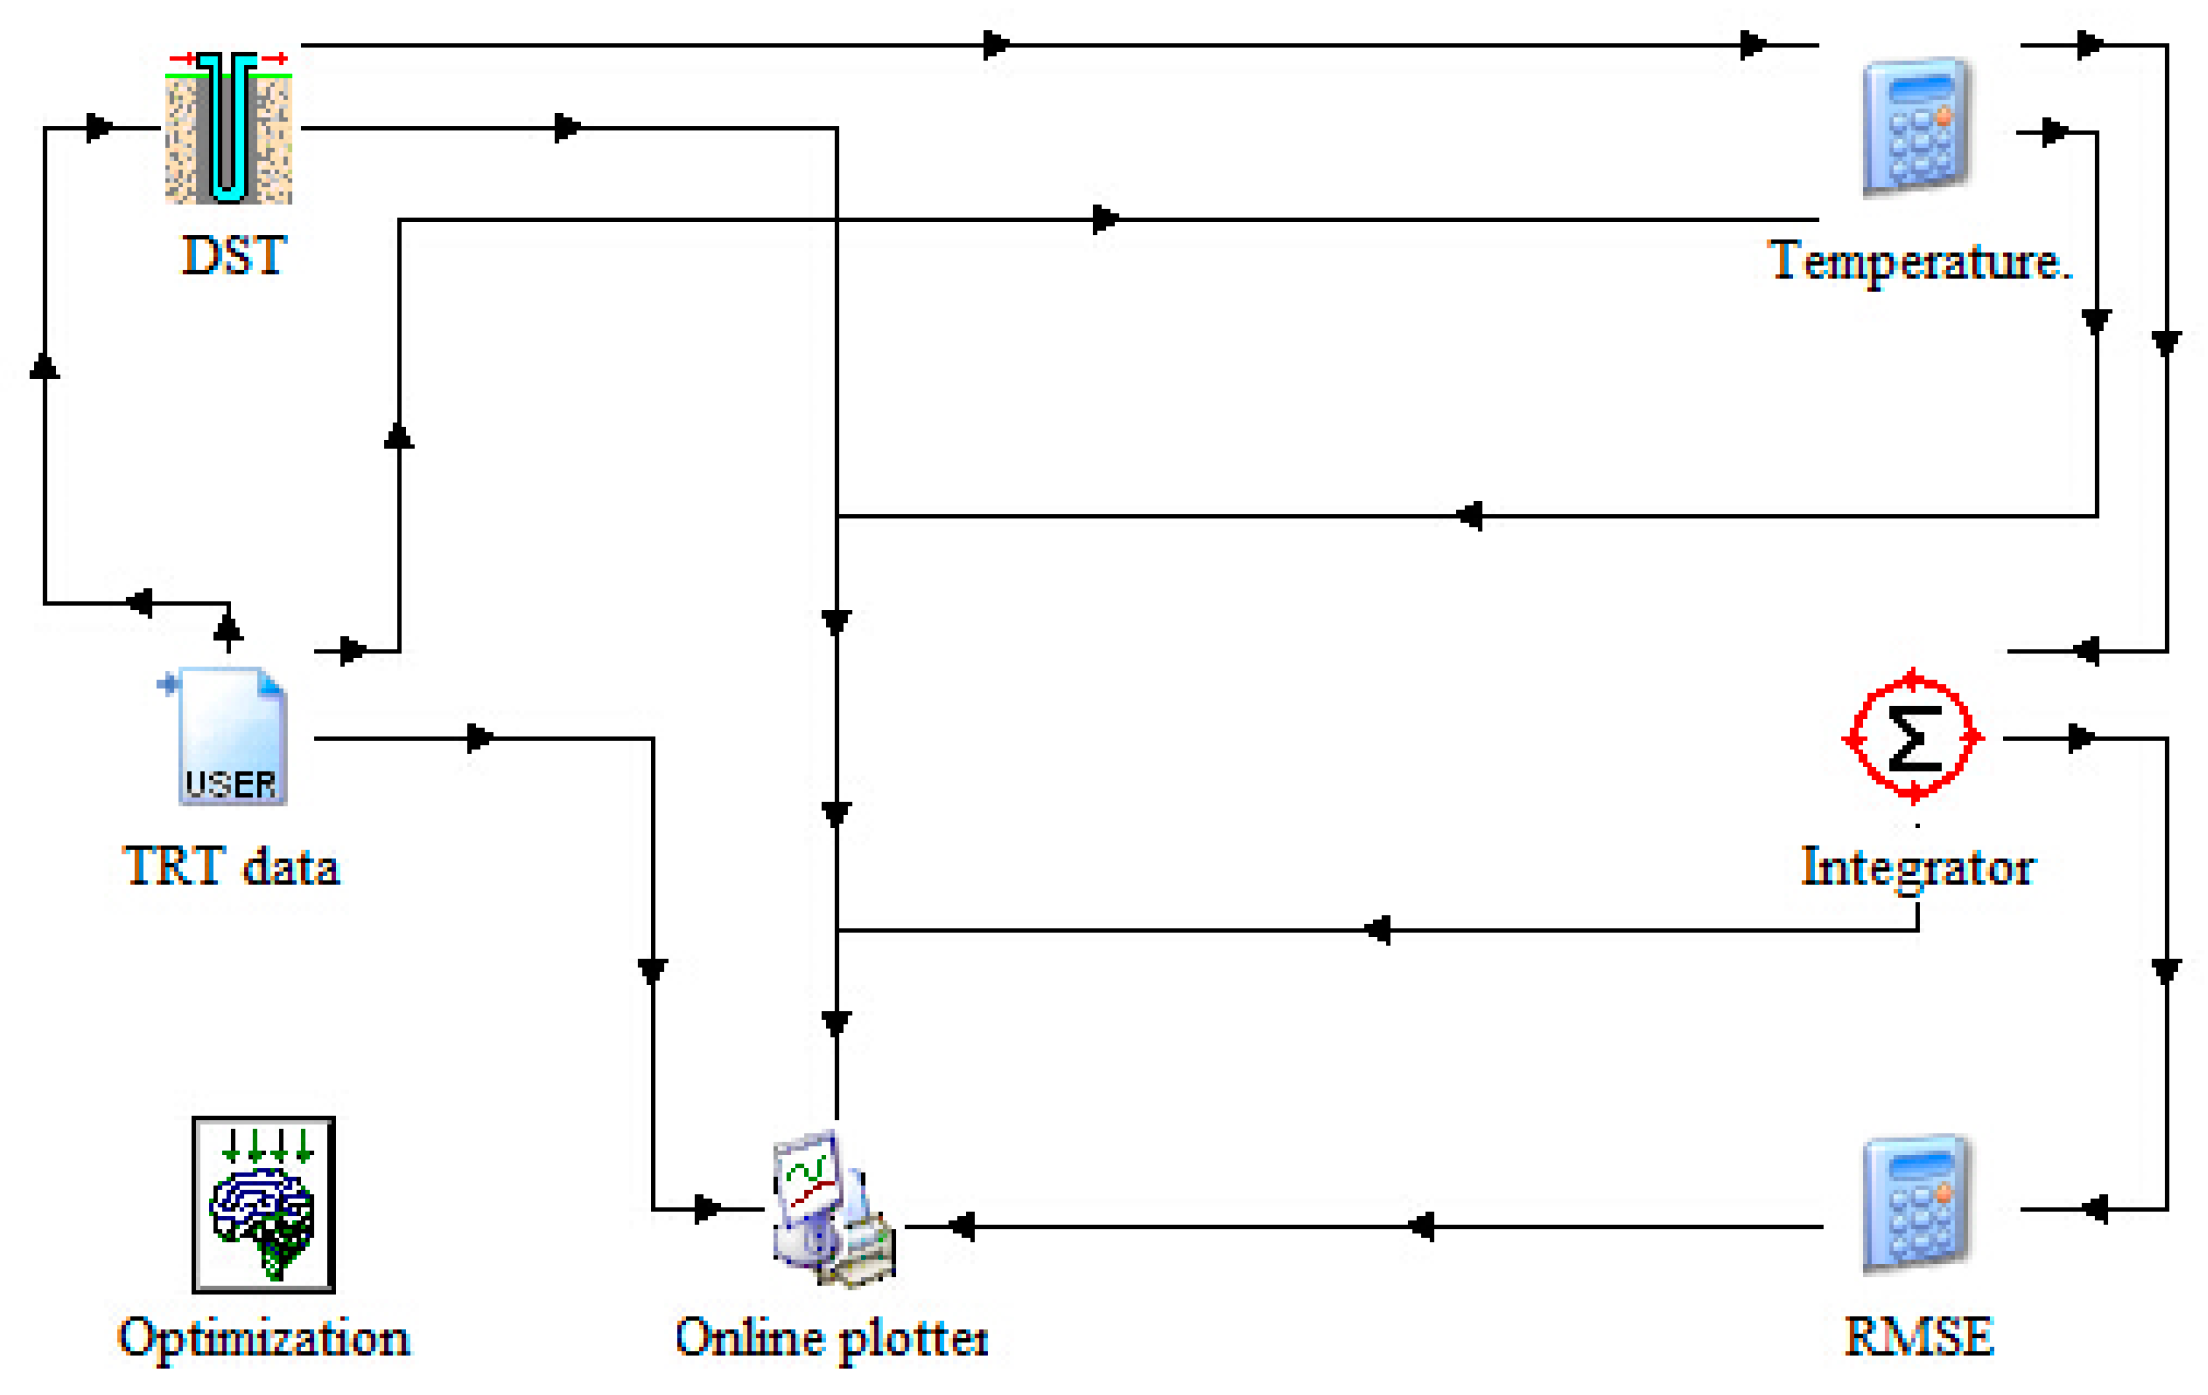
The DST has been used to realize PE in a few studies with the help of the GenOPT package (a generic optimization program) [32]. For example, Witte et al. [33] adopted the DST to estimate the thermal conductivities of soil and grouting materials. Zhang et al. [20] also presented a simulation-optimization approach for determining the optimal thermal conductivity and the specific heat capacity of soil. There are four kinds of DST components in the TRNSYS software; two of them are applicable to U-pipe configuration, and the other two are suitable for concentric tube configuration. The identifying numbers of the U-pipe components are Type557a and Type557b, respectively. Both of the above methods employ Type557a component (in which the borehole thermal resistance is calculated by a theoretical formula) together with the Hooke–Jeeves optimization algorithm. In contrast to their approaches, a Type557b component (in which the borehole thermal resistance is defined by the user, and the value used in this work is from TRTPE) was applied in this study [34], the layout of which is shown in Figure 3. Using Type557b makes it convenient for us to investigate the influence of PE on the BHE design. PE methods based on the DST, as well as the other five models, are introduced in the next paragraph.
Users must have an accurate knowledge of all the parameters, inputs, and outputs, which can be found in [33]. The most important aspect of using the DST-based method is to fully understand its required input parameters, such as building loads, bore field geometry, borehole characteristics, ground thermal properties, fluid characteristics, heat pump characteristics, mesh parameters, and time parameters. Furthermore, the DST has more model considerations than others, including some secondary effects, such as the thermal insulation on the top of the volume, horizontal ground stratification, geothermal gradient, U-pipe leg thermal short-circuiting, and ground preheating before system operation. There are two kinds of input parameters in TRNSYS, namely, time-independent parameters and time-varying parameters. The time-independent parameters remain constant during the whole simulation period, and the number of these kinds of parameters in the DST model can be as high as 112 if all the secondary effects are taken into consideration. In our case, Type557b directly adopts the thermal resistance of the experimental borehole without extra calculation, and the secondary effects are excluded from consideration in the simulation to avoid expanding the variability compared with other models. Therefore, the required parameters can be reduced to 35. There are also five time-varying parameters in the DST: the BHE entering fluid temperature, the mass flow rate, two air temperatures (on the top of the store and elsewhere), and a sign indicating the fluid direction. Here, the annual ambient air temperature (such as local TMY data) can be entered into the model.

2.2. Parameter Estimation Methods

For TRTPE, the mean fluid temperature at the inlet and outlet of the BHE T f (°C) should be calculated and then compared with tested values. For design purposes, this parameter is also needed to compare with preset constraint values in software-based methods or to calculate the required length directly in simple equation-based methods. If the process inside the borehole is in a steady state, then T f can be described by the so-called effective borehole thermal resistance Rb (K·m·W−1)
T ¯ f = q l R b + T ¯ b ,
where T b can be obtained by using Equations (3)–(5) for the ILS, (6)–(8) for the ICS, (9)–(13) for the FLSN, (14) and (15) for the FLSA, and (22) and (23) for the FLSCC. In the DST, the calculation of T b is not really necessary because the model can directly calculate T f and then compare the calculated values with the measured values from the TRT.
The purpose of PE is to obtain the required design input parameters by inversely using the above heat transfer models. This method usually involves two basic problems. One is choosing the objective function to be minimized, and the other is finding a suitable iterative minimization algorithm. The commonly chosen objective function to be minimized is the error sum of squares (SSE), which is
f = min i = 1 n [ ( T f , c a l ) i ( T f , m e a ) i ] 2
In Equation (25), f is the objective function, n is the total number of measurements, Tf,cal is calculated from the models in Section 2.1, and Tf,mea refers to the mean fluid temperature measured for a selected time interval.
Sometimes, the root-mean-square error (RMSE) is also used as an indicator.
f = min i = 1 n [ ( T f , c a l ) i ( T f , m e a ) i ] 2 n
Theoretically, the estimated parameters can be any combination of the unknowns. However, sensitivity analysis has revealed that the simultaneous estimation of more than three parameters is problematic because some of these parameters are strongly correlated. Li and Lai [35] found that the estimation method was usually formulated as a two-variable model, in which soil thermal conductivity and borehole thermal resistance are the best choices in most cases for design purposes. Technically, this combination can prevent the optimization process from becoming trapped in a local minimum.
There are several iterative methods suitable for performing the least-squares minimization method to solve the inverse heat conduction problem [36,37,38]; among these methods are the Gauss linearization method, the conjugate gradient method, the Levenberg–Marquardt method, and the interior trust region method subject to bounds. In this study, the interior trust region method was adopted, as recommended by Li and Lai [35], while the estimation process based on the DST model employed the Nelder–Mead simplex algorithm, which is embedded in a generic optimization program package, GenOpt.

3. TRT Experimental Data and the Results of PE

3.1. Experimental Data from the Thermal Response Test

The technology of the TRT itself has many sources of uncertainty [39]. PEs should be derived from the same data set when obtaining different PE results using the six selected heat transfer models for a comparison run. Other influential factors, such as the simulation starting time, should also be in accordance. The experimental data set was collected from the existing literature. The test was performed by researchers in the Laval University [40]. The temperature responses were recorded every 300 s for 168 hours at a constant rate period using a high-precision temperature sensor with an error of ±0.1 °C and flow meter with an error of ±1%. One reason for choosing this set of data is that it contains local climatic data, which are suitable for obtaining more accurate PEs based on the FLSCC and DST. The tested borehole had a depth of 140 m and a radius of 0.076 m. An average heat transfer rate of 66.49 W/m was injected into the ground with an undisturbed temperature of 7.5 °C. The volumetric specific capacity of the soil was about 2.25 × 10⁶ J·K−1·m−3. The test results are shown in Figure 4. In the first several hours, the heat transfer process was unsteady, and the ratio of temperature change was large, so the temperature points in the first 13 hours were screened out.

3.2. Parameter Estimation Results

PEs were obtained using the above data set with each of the selected six heat transfer models. As noted, both the FLSCC and DST take into account a variable soil surface temperature. The tested ambient air temperatures during the TRT need to be transformed into a superposition of sinusoidal functions by a curve-fitting method, while the raw data can be directly entered into the DST model as an input variable. The PE results are shown in Table 1.
For each of the six models presented earlier, both the borehole thermal resistance and soil thermal conductivity were estimated. Each PE result was assigned an identification number for the sake of convenience. The estimated parameters were found to vary with the model used as a basis, and both SSE and RMSE were calculated to assess the optimization results. Table 1 shows that the SSEs and RMSEs of PE5 and PE6 are smaller than those of the other PEs; in other words, the fluid temperatures simulated by the DST and FLSCC are closer to the experimental data. This suggests that accounting for the variation in ground surface and subsurface temperatures helps improve the accuracy of the model. As shown in Table 1, only the differences between PE1 and PE4 are negligible. Although the values of soil thermal conductivity from PE1 and PE5 are almost the same, the values of the other estimated parameter Rb are different. Furthermore, the relative difference in the borehole thermal resistance between PE1 and PE6 is as high as 34.4%. For soil thermal conductivity, the relative difference reaches 11.9%.
The impact of the variation in soil thermal conductivity and diffusivity on the design length and, consequently, on the system capacities was reported by Kavanaugh [41]. The conclusion was derived from investigating an office building GCHP system using a design program. It was reported that a 10% variation in these parameters caused the design length to differ by 4.5–5.8%. Since soil thermal conductivity, thermal diffusivity, and borehole thermal resistance are highly correlated [42], there is no doubt that the variation in soil thermal conductivity and borehole thermal resistance will have some impacts on the final design output, which is examined in the rest of the paper.

4. Comparison of the Time Evolution of Mean Fluid Temperatures for a Single Borehole

For design purposes, the heat pump entering fluid temperatures (EFTs) are used as design constraints in most cases. Here, the constraints also indicate the minimum (if the building thermal loads are heating dominated) or maximum (if the building thermal loads are cooling dominated) values of the BHE exiting fluid temperature since these two parameters are nearly equal. The mean fluid temperature of the BHE inlet and outlet T f as an intermediate parameter reflects the design length to some degree. Regardless of the model used as a basis, most methods need to compute the temperature response around a single borehole because of a constant heat pulse. Then, a multiple load aggregation algorithm is used to account for dynamic thermal loads, and it superimposes solutions for multiple boreholes to deal with heat accumulation effects. In this section, we first show the extent to which the PE results influence the mean fluid temperature through the results of a simple test, namely, the temperature response from a single borehole under a constant heat pulse.
In the simulation of the time evolution of the mean fluid temperature for a long period—50 years in this case—the parameters concerning borehole configurations and test conditions were consistent with those reported in Section 3.1. The six combinations of Rb and κs in Table 1 were inversely employed and substituted back into the base models to conduct the comparison runs. That is, each PE result corresponds to one base model, so there are 36 time-evolution curves in total. For the FLSCC and DST, hourly variation in the ground surface temperature was simulated by Equations (16) and (17), in which the annual mean ground surface temperature Tm was set to 7.5 °C, the amplitude of temperature oscillations Tam was 18 °C, and the initial phase ω∆τ was 0.24 rad. In practice, it is better for designers and engineers to find statistical data on the project location. Otherwise, curve fitting using Equations (16) and (17) using local TMY data is a good alternative. This is also the case for the DST model.
According to the simulation results, for one base model, the absolute maximum temperature differences between the two curves were around 1.1 °C in the beginning and about 2.1 °C at the end of the simulation period. With further simulation, these temperature differences rose to 3–6 °C when the heat transfer rate was increased to 100 W/m and the simulation time period was doubled. Because absolute values may change with simulation parameters, the relative difference was defined to illustrate the temperature differences subject to PE
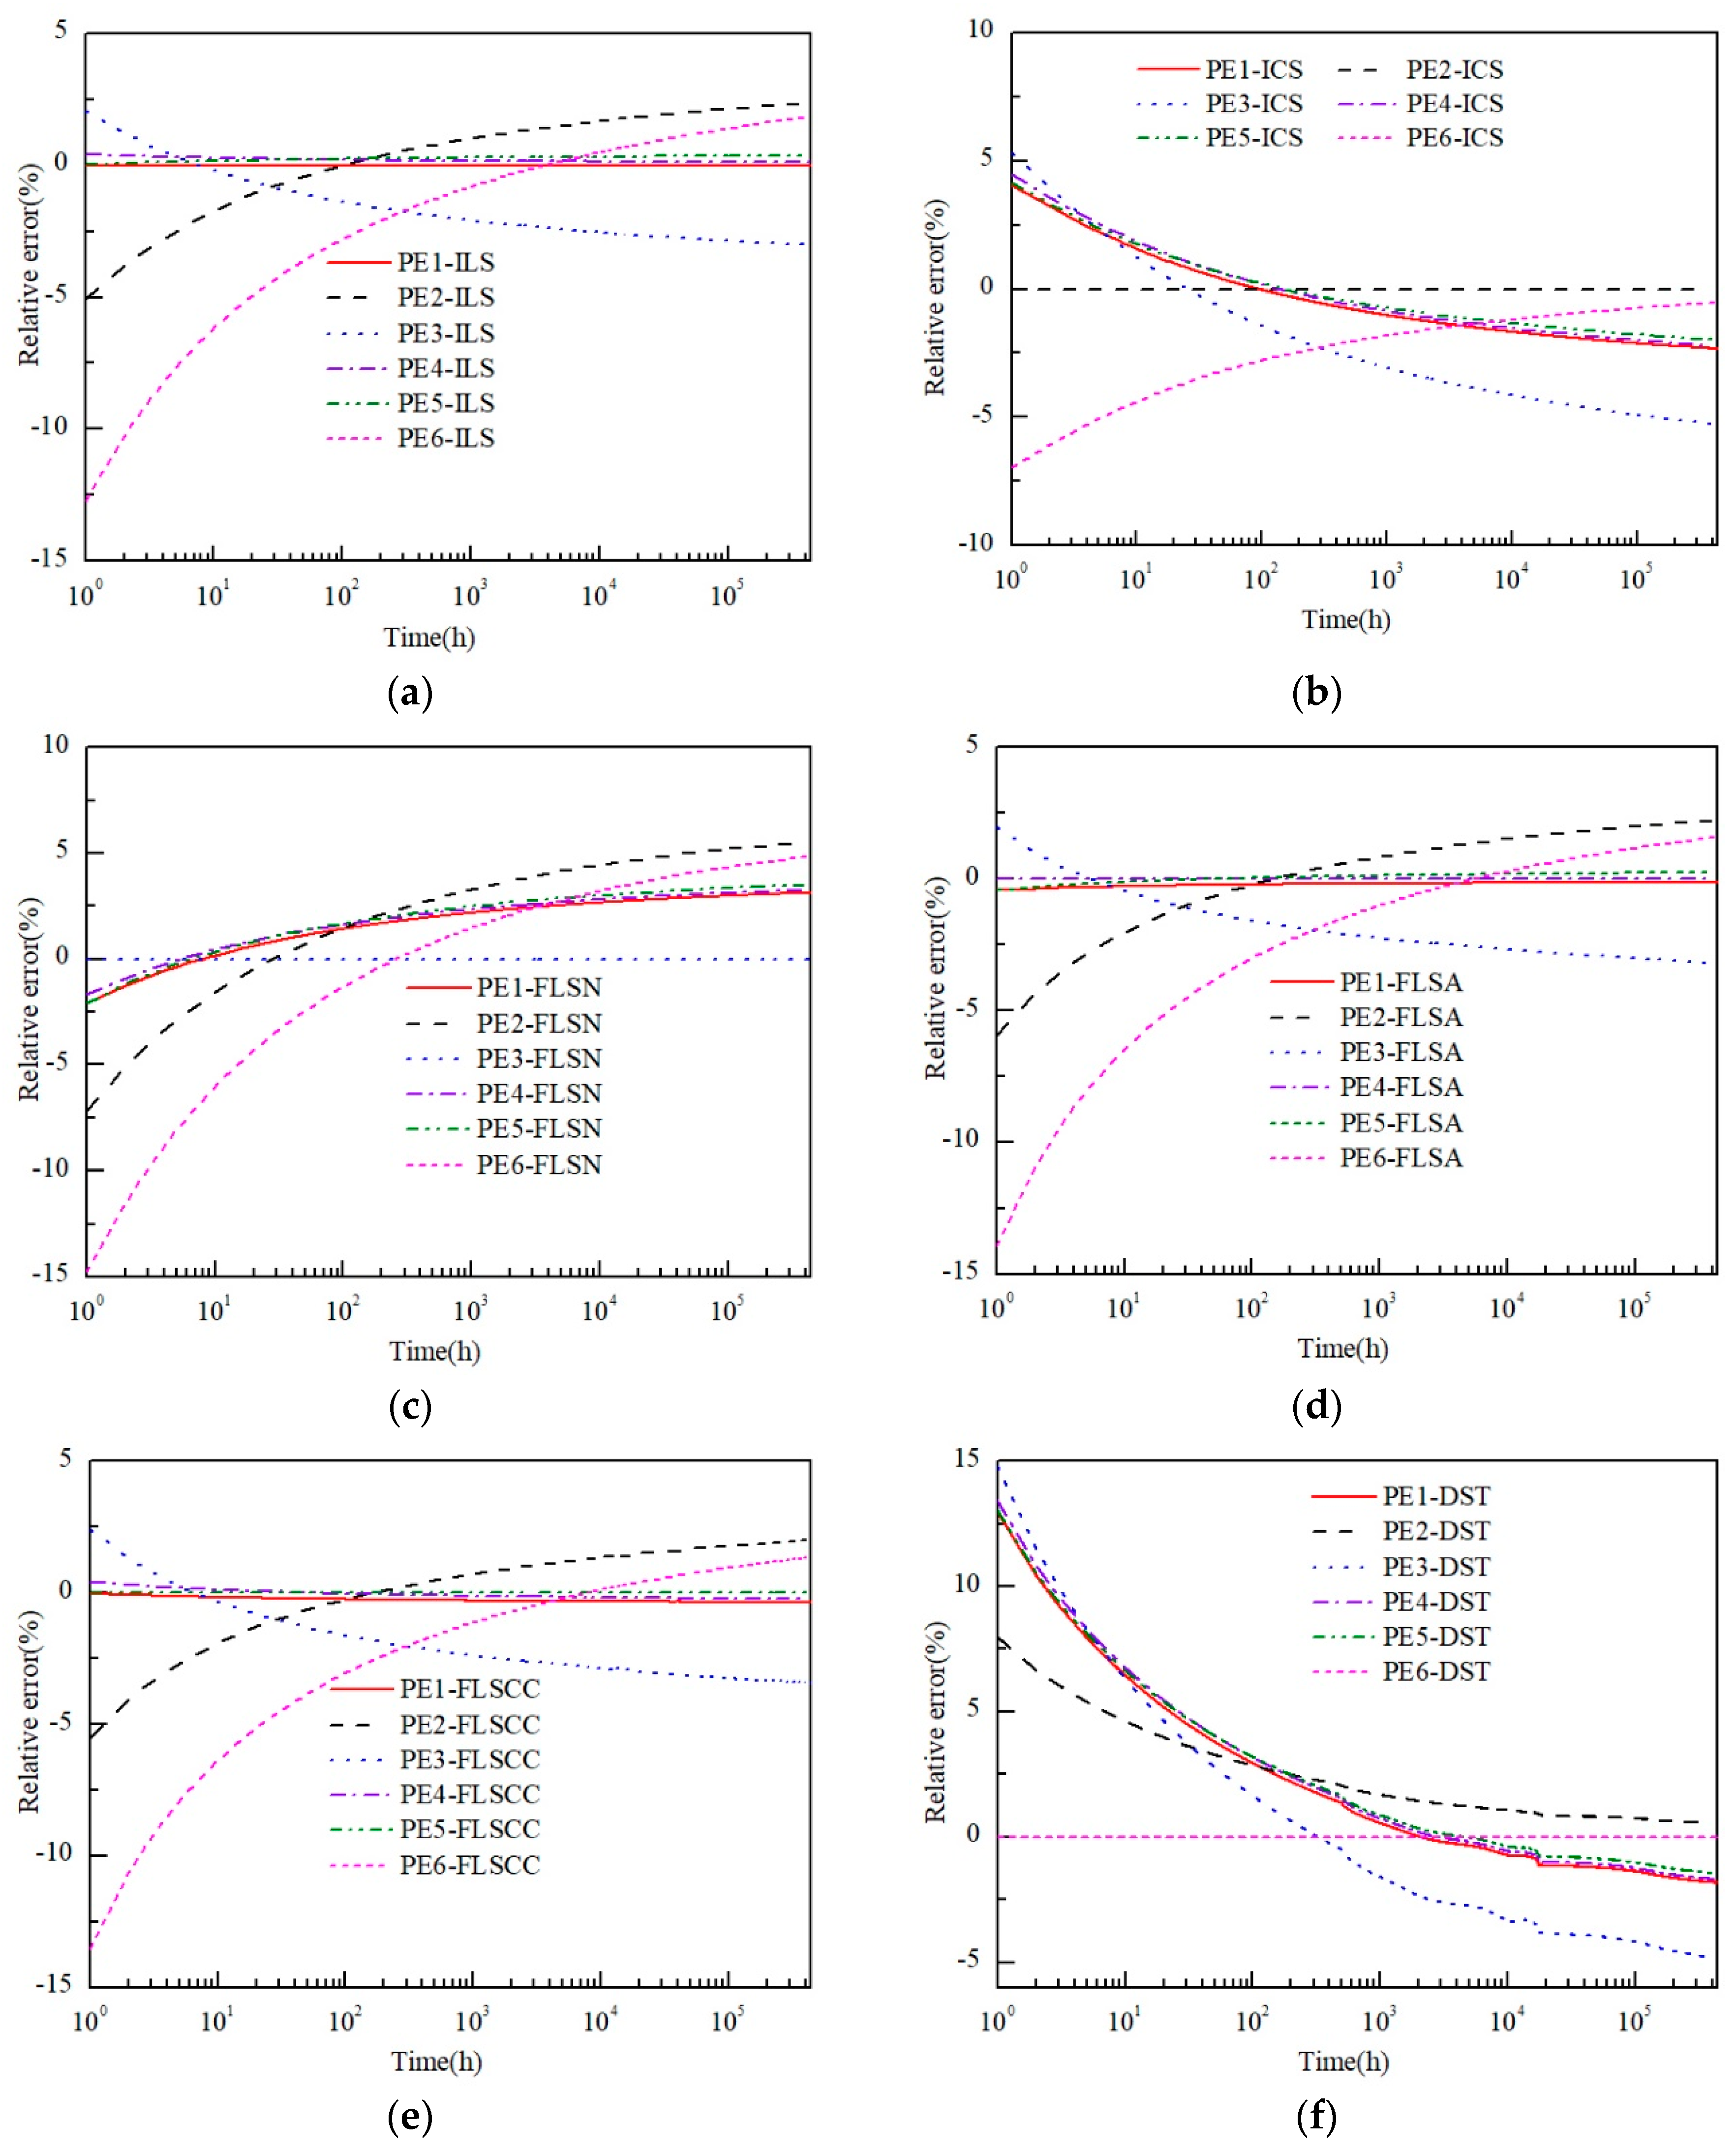
ε T , R E = ( T i T 0 ) ( T b a s e T 0 ) T b a s e T 0 × 100 % ,
where εT,RE represents the relative difference, %; Tbase refers to the mean fluid temperature calculated by the same model as TRTPE, °C; and Ti is the mean fluid temperature calculated by different models with TRTPE, °C. The relative difference curves are plotted in Figure 5. The labels in this figure indicate the models used; for example, for PE1-ICS, PE1 means that the values of soil thermal conductivity and borehole thermal resistance used in the simulation were estimated by the ILS model, and ICS indicates that mean fluid temperatures were calculated by the ICS model.
Figure 5 shows the time evolution of relative differences subject to TRTPE. For the first two years, the simulation time-step is one hour, and it changes to 240 hours in the following years. There are six time-evolution curves in each subplot, and each one was calculated from one PE result. For each subplot, the benchmark case is the curve that uses the same model in both the TRTPE and the mean fluid temperature simulation.
Figure 5a shows that PE6 causes up to a 15% relative difference in the very beginning compared with PE1. PE2 and PE3 cause around 5% relative differences in the beginning hours and at the end of system operation, while the relative difference due to the use of PE4 and PE5 is always within 1% from the beginning to the end. Similar conclusions can be drawn from Figure 4d,f. This is because the parameters estimated by these three models have little difference.
Figure 5b shows that, compared with PE2, the relative differences caused by PE1, PE3, PE4, and PE5 are less than 5% throughout the simulation time period. The relative differences from PE3 are a little bigger than those from PE1, PE4, and PE5 and about as twice as high in the late hours. Although relative differences from PE6 are more than 5% in the first 10 hours, they become progressively smaller over time.
Figure 5c indicates that for PE3, the relative differences due to all the other PE results decrease at first and then increase to 2.5–5%. Relative differences due to PE6 in the beginning hours are as high as 15% and still bigger than the other PE results.
Figure 5e displays the relative differences in the mean fluid temperature simulated by the DST model. Compared with PE6, PE1, PE3, PE4, and PE5 share the same changing trend. The values of their relative differences first decrease and then increase until the end of the simulation. In contrast, the values of the PE2-DST curve always decrease: from 7.8% in the first hour to 0.2% in the end.
In sum, the PE results cause about a 15% relative difference in the very beginning and 5% at the end of the simulation period. It can also be observed that the parameters estimated by the ILS, FLSA, or FLSCC have little difference, so there are no significant differences in the relative differences based on these three models. However, for the ICS, FLSN, and DST-based estimated parameters, it is important to highlight that relatively big differences can result if the PE and temperature field simulation use inconsistent models. Especially in the beginning hours of operation, the relative difference in the short-time response of the BHE subject to PE is significant. Moreover, the relative difference in the long-time response is also considerable. For design purposes, the influence of PE on the design output still needs detailed investigation.

5. Sizing Methods for BHE

A good number of design methods, either numerical or analytical, have been proposed to size and optimize BHEs; their underlying thermal response analysis models, treatment of building thermal loads, consideration of thermal interference, and other settings are of varying complexity and differ from each other. In this section, some representative vertical BHE design methods available in the literature are presented and compared to highlight their strengths and weaknesses in relation to their inter models. The most commonly used methods for sizing heat exchangers include the IGSHPA method [3], the ASHRAE method [2], g-function-based design tools [5,8,24], such as EED or the GLHEPRO program based on Eskilson’s approach, and the DST-based method [6,7]. The following is a brief description of the selected sizing methods used for comparison runs in this study.

5.1. IGSHPA Method

The IGSHPA method determines the length of heat exchangers required for heating and cooling loads by applying the design equations
L h = Q h ( R p + R s F h ) T 0 T L C O P h 1 C O P h ,
L c = Q c ( R p + R s F c ) T H T 0 C O P c + 1 C O P c ,
where the subscript h represents the heating mode, and c represents the cooling mode; L is the required design length, m; Q is the design load or total unit capacity at the design EFT, W; F is the run fraction; COP is the coefficient of performance; Rs is the soil resistance, K·m·W−1; TL and TH refer to the specified minimum and maximum heat pump EFT Tin,hp, °C; and Rp is the pipe resistance to heat flow, K·m·W−1. A detailed presentation of the IGSHPA method and the determination method of each parameter can be found in [43].

5.2. ASHRAE Method

The ASHRAE handbook [2] sets forth a BHE design equation that is suitable for quick calculations
L h = Q a R s a + Q h ( R b + P L F m R s m + F s c R s d ) T 0 T i n , h p + T o u t , h p 2 T p C O P h 1 C O P h ,
L c = Q a R s a + Q c ( R b + P L F m R s m + F s c R s d ) T i n , h p + T o u t , h p 2 T 0 T p C O P h + 1 C O P h ,
where Qa is the net annual average heat transfer to the ground, W; PLFm is the part-load factor for the design month; Rsa, Rsm, and Rsd are the effective thermal resistances of the ground to the annual pulse, monthly pulse, and peak daily pulse, K·m·W-1, respectively; Fsc is the short-circuit heat loss factor; and Tp is the temperature penalty for interference of adjacent bores, °C.

5.3. FLSCC-Based Method

Since the g-function method proposed by Zhang et al. is more accessible than others, it was chosen to represent g-function methods [27,44]. This method is similar to the one used in EED software, in which the superposition principle [45] is applied (as required) to model effects such as equipment on/off cycling and thermal interference effects. However, the handling of the building block load is different. There is one drawback to using simulation-based design tools; that is, such frequent calls of Eskilson’s numerical model-based g-functions impose quite a heavy calculation burden. The time step is usually set to a month to improve computation speed. However, in this FLSCC-based g-function method, it is more convenient to use analytical formulas to calculate g-functions and thus possible to run hourly or sub-hourly simulations. Here, a short introduction to this method is given.
By superimposing solutions for multiple boreholes, FLSCC-based g-functions can be created from Equations (22)–(24) as a function of time and heat pulse. The mean fluid temperature at the end of time step n is then
T f = i = 1 n ( q i q i 1 ) 2 π κ s g c ( τ n τ i 1 τ s s , r b H , B H ) + q i R b + T ¯ 0 ,
where qi is the heat transfer rate per unit length at the ith time step, W·m−1; gc is the value of the g-function at the specified point; τn is the current time of interest, s; τi−1 is the time at the (i − 1)th time step, s; and B is borehole spacing, m.
With Tf known, the heat pump EFT Tin,hp (or the BHE exiting fluid temperature Tout,BHE) and the heat pump exiting fluid temperature Tout,hp (or the BHE entering fluid temperature Tin,BHE) can be computed using a heat balance equation.
T i n , h p = T f q i H N b 2 m ˙ C f ,
where Nb is the number of boreholes, --; m ˙ is the mass flow rate, kg·s−1; and Cf is the specific heat of the fluid, J·kg−1·K−1.
The FLSCC-based method determines a borehole length by assuming an initial guess. Then, the maximum and minimum heat pump EFT can be produced and compared with the design constraints until the required precision is obtained. More details can be found in our upcoming paper [44].

5.4. DST-Based Method

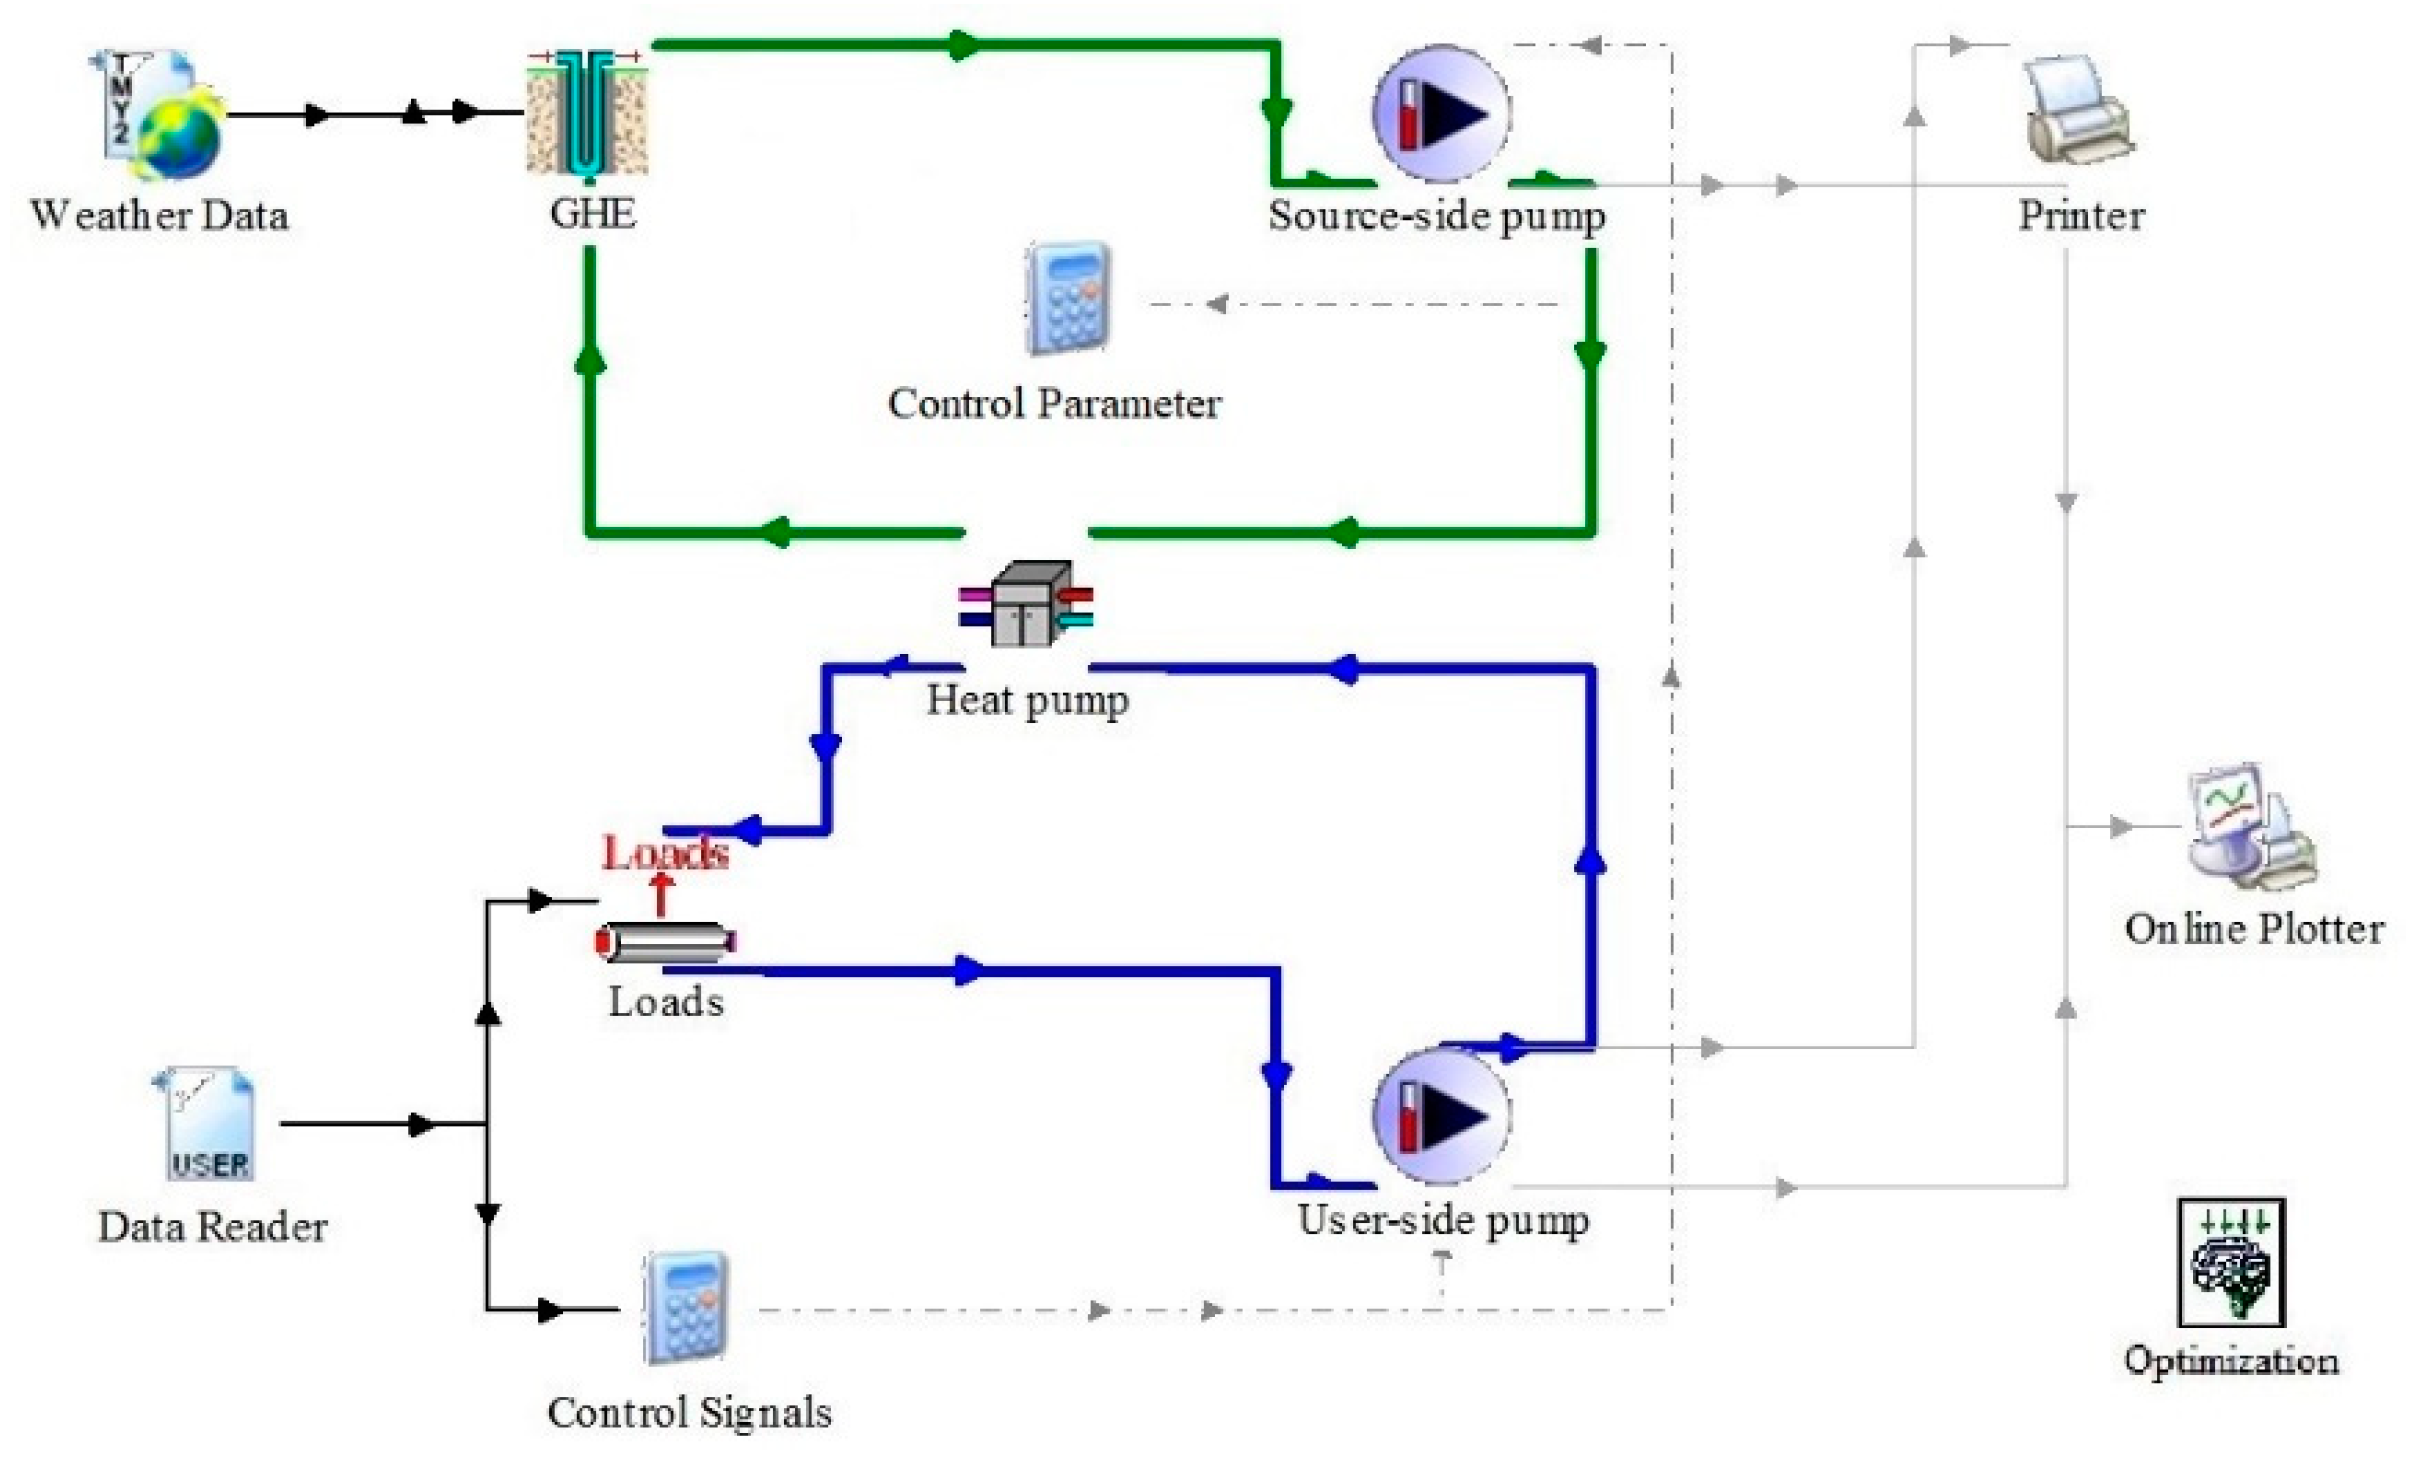
The DST model is not able to predict the BHE length without the help of other TRNSYS components. As a result, several studies pertaining to the optimization of GCHP systems have been performed using TRNSYS with the DST model [46]. In this research, the DST-based method employed an approach similar to that proposed by Zhang et al. [47], the layout of which is shown in Figure 6. In this method, the borehole length for practical engineering application is calculated according to the energy balance method, in which building thermal loads are exactly removed by the heat injected into or extracted from the ground. With the aid of an optimization component, GenOpt starts with an initial guess of the borehole depth (if the bore field geometry and number of boreholes are given), and then the program calls the sizing method to determine the maximum or minimum heat pump EFT for the whole life-span of the system. The optimization process will stop when the design constraints are satisfied. For a small-scale project, the optimal design length can even be sought by manually adjusting the controlled parameters.
The DST model was originally developed to simulate the seasonal thermal storage of densely packed boreholes configured in an axisymmetric pattern [6,7]. A major restriction with this model is its inability to specify a normal rectangular geometry. The corresponding storage volume VDST (m3) is computed using Equation (34).
V D S T = π N b H ( 0.525 B ) 2
Thus, the equivalent cylindrical storage volume can be divided into different subregions for numerical simulation.

5.5. Summary of the Sizing Methods

For the sake of convenience, each selected sizing method is assigned an identification number from M1–M4 to represent the IGSHPA method, ASHRAE method, FLSCC-based method, and DST-based method, respectively. The sizing methods usually follow different paths to determine design length. The flowchart for each method is shown in Figure 7.
It can be seen from Figure 7a that the IGSHPA method (M1) does not really need iteration steps. This is because its underlying model (ILS) assumes that the borehole has infinite length; thus, in the calculation of the ground thermal response factor Rs, the borehole length L is not required. For the ASHRAE method (M2), the borehole length L is also directly computed. Since the calculation of the penalty temperature Tp in the ASHRAE method needs L, iteration is needed and starts with an initial guess of L. The resulting new value of L is then compared with the initial guess to determine whether the required precision is satisfied. If it is not, then the iteration process continues. The FLSCC-based method and the DST-based method function differently. These two software-based methods use the maximum or minimum heat pump EFT Tin,hp for the whole life-span as a control parameter, and an optimization algorithm is used to compare the calculated values with the design constraints.
The main characteristics and inter-model considerations of the four sizing methods are listed in Table 2. It should be noted that to study the influence of TRTPE, the effective borehole thermal resistance Rb is from the PE results of each method. Thus, the effect of borehole capacity is not considered.

6. Comparison of Borehole Design Lengths for a Bore Field

6.1. Parameter Settings for Comparison Runs

6.1.1. Building Thermal Loads

IGSHPA equations use a constant load to represent the heat pump capacity at the design EFT throughout the design month, and it is nearly equal to the building peak load. Additionally, IGSHPA uses Rp to account for the steady heat transfer in the reference borehole, and the equivalent pipe diameter is defined for single or multiple U-tubes. Here, it involves the ILS model’s assumption that the difference between soil and grout materials can be neglected. As a result, borehole thermal resistance does not appear in the simulation using this method. Rp is calculated by
R p = 1 2 π κ p ln ( r o r i ) ,
where κp is pipe thermal conductivity, W·m−1·K−1; ro is the pipe outside radius, m; and ri is the pipe inside radius, m.
ASHRAE equations use a constant load throughout the course of operation, with a magnitude equal to the average value, plus a peak ‘block load’ for which no guidance is given to determine magnitude or duration. For the ASHRAE method, the annual, monthly, and daily resistance values (Rsa, Rsm, and Rsd, respectively) can be directly computed using the ICS model. Fourier numbers for the total runtime (1 year or more, depending on system; this study used 10 years), monthly (30 days), and peak (6 hours) pulses were computed. Instead of using the logarithmic chart provided by the handbook, the individual resistance terms can be obtained using Equations (6)–(8).
R s a = [ G ( τ a + τ m + τ d ) G ( τ m + τ d ) ] / κ s ,
R s m = [ G ( τ m + τ d ) G ( τ d ) ] / κ s ,
R s d = G ( τ d ) / κ s ,
where τy, τm, and τd are the operation times of a 10-year pulse, a 1-month pulse, and a 0.25-day pulse, respectively, s.
In the simulations, synthetic loads were determined using the following sinusoidal function from Bernier [39], taking into account hourly variations, and then used to estimated possible building load values. Synthetic loads were used since the objective was not to calculate the exact loads of a specific building but rather to provide a realistic estimation.
Q = f ( τ ; β 1 , β 2 , β 3 ) + ( 1 ) f l o o r ( β 4 8760 ( τ β 2 ) ) a b s ( f ( τ ; β 1 , β 2 , β 3 ) ) + β 5 ( 1 ) f l o o r ( β 4 8760 ( τ β 2 ) ) s i g n u m ( cos ( π β 4 4380 ( τ β 6 ) ) + β 7 ) ,
f ( τ ; β 1 , β 2 , β 3 ) = β 1 sin ( π 12 ( τ β 2 ) ) sin ( π 4380 ( τ β 2 ) ) × { 168 β 3 168 + [ i = 1 3 1 π i ( cos ( π i β 3 84 ) 1 ) ( sin π i 84 ( τ β 2 ) ) ] }
In the above equations, Q is the load, the angles are measured in radians, τ is the time variable, floor is the largest integer less than or equal to the number considered, abs denotes the absolute value of the expression, and signum is equal to plus or minus one according to the sign of the expression evaluated. This synthetic symmetric profile was obtained using the following parameters: β1 = 1000, β2 = 1000, β3 = 80, β4 = 2, β5 = 0.01, β6 = 0, and β7 = 0.95.
According to the synthetic profile shown in Figure 8a, the peak heating and cooling loads Qh and Qc were both set to 1030 kW. A building load can be converted into a ground load by adding or subtracting the compressor power at peak load. Figure 8b shows the results obtained; the COPs used to develop the ground loads are given in Section 6.1.4. The net annual average heat transfer to the ground Qa was 31.7 kW, according to Figure 8b. The DST-based method and the FLS-based method directly use the hourly loads determined by the synthetic profile. These two software-based methods convert the building loads into ground loads during the simulation process.

6.1.2. Thermal Interference Effect

The underground temperature field is influenced by the imbalance between the heat injection and extraction rate after a given operating time. For example, if the heat injected into the ground in summer is higher than that extracted from the ground, then the temperature field of the whole heat storage domain increases every year. For design purposes, this heat accumulation effect also interferes with the calculated EFT. The IGSHPA equations use Rs—the soil resistance to heat flow—to account for the thermal interference effect. This parameter involves the effects of multiple vertical heat exchangers by adding the resistances of other boreholes at respective distances, as described in reference [43]. Rs for multiple BHEs is expressed by
R s ( X ) = [ I ( X r o e ) + 1 M [ I ( X S D 1 ) + + I ( X S D M ) ] ] / ( 2 π κ s ) ,
where Xroe is equal to roe/{2(αsτ)1/2}, and I(Xroe) is the exponential integral; I(Xroe)/(2πκs) is the resistance of the soil surrounding a single pipe with a radius roe; and I(XSD1)/(2πλs) … I(XSDM)/(2πλs) are resistances of adjacent boreholes at respective distances (m) from the reference single borehole of SD1, …, SDM. Rational approximations for the exponential integral I(X) are determined as follows.
For 0 < X ≤ 1,
I ( X ) = 1 2 [ ln X 2 0.57721566 + 0.99999193 X 2 0.24991055 X 4 + 0.05519968 X 6 0.00976004 X 8 + 0.00107857 X 10 ]
For X > 1,
I ( X ) = 1 2 X 2 e X 2 ( 0.2677737 + 8.637609 X 2 + 18.059017 X 4 + 8.5733287 X 6 + X 8 3.9684969 + 21.0996531 X 2 + 25.6329561 X 4 + 9.5733223 X 6 + X 8 )
In Equation (41), roe is equivalent to the outside radius for U-pipe heat exchangers (m), defined as
r o e = N U l e g s r o ,
where ro is the outside pipe radius (m), and NUlegs refers to the number of U-pipe legs within a single borehole.
In the ASHRAE method, a temperature penalty Tp is employed to quantify the interference of adjacent bores. The handbook suggests that this parameter be determined either from tabulated values [2] or by direct computation [4]. In this work, the temperature penalty was computed directly using Kavanaugh and Rafferty’s analytical solution [4], which estimates the stored heat E (the unit is W) for 10 years in a hollow cylinder located in an open bore field by
T p = N 4 + 0.5 N 3 + 0.25 N 2 + 0.1 N 1 N 4 + N 3 + N 2 + N 1 E ρ s c s B 2 L ,
where E is the total heat stored in a cylindrical region, J; Ni is the number of boreholes in the field adjacent to i other boreholes.
Either Rs or Tp can be regarded as an index to evaluate the long-term behavior of the bore field during system operation: the greater the imbalance between the required heating and cooling loads, the higher the values of these two parameters and, consequently, the greater the influence on the sizing process. In contrast to these two simple equation-based methods, the DST-based method directly calculates the mean temperature of the heat storage domain using a numerical DST model, and the FLSCC-based method uses the g-functions to obtain the temperature rise or drop caused by a cluster of BHEs.

6.1.3. Temperatures

The IGSHPA method recommends using the Kusuda equation [31] to calculate the undisturbed ground temperature T0. For vertical BHEs, T0 can be set to the value of the annual mean ground surface temperature Tm. The ASHRAE method suggests determining T0 from local water well logs and geological surveys or less accurate sources, such as temperature contour maps provided by the authoritative department. In this study, the value was measured directly by the TRT. The variation in ground surface temperature is represented by the Kusuda equation in both the FLSCC-based method and the DST-based method.
The design values of the minimum EFT TL and maximum EFT TH are chosen from a rational range provided by some national standards, and variances in these thresholds can be geographically driven [48]. For example, the ASHRAE handbook suggests that this value be 11–17 °C higher than T0 in summer and 6–11 °C lower than T0 in winter in the USA, while the limits of TL and TH in China are recommended to be 4 °C in heating and 33 °C in cooling [49]. Generally, TL and TH are assumed to be higher than 0 °C in winter and less than 35 °C in summer. In this case study, TL and TH were assumed to be 1 °C and 32 °C, respectively. The selection of EFT is not arbitrary in practice. Choosing maximum values that are too high or minimum values that are too low can lead to inefficient system performance. Conversely, choosing values that are close to T0 can result in fairly large BHE dimensions. This selection requires a comprehensive consideration of energy consumption and system efficiency. Consequently, it is better to adjust these temperature limits according to the expected system efficiency target. TL and TH are input parameters in the simple equation-based method, while—in the FLSCC-based method and the DST-based method—they serve as design constraints, as illustrated in Figure 7c,d.

6.1.4. Heat Pump Characteristics

The IGSHPA, ASHRAE, and FLSCC-based methods use a single value of the heat pump COP as a design condition to compute the actual amount of energy injected into or extracted from the BHEs. COPh and COPc are evaluated at TL (1 °C) and TH (32 °C) and have values of 3.351 and 3.993 in heating and cooling, respectively. FLSCC utilizes these two values to convert building loads into ground loads, as shown in Figure 7c. In the TRNSYS software, the heat pump unit is simulated using the Type 668 component. Users need to input the actual performance of the sample unit under different operating conditions according to the manufactory’s data [50]. The performance of the heat pump unit also has a great impact on the efficiency and energy consumption of the whole system; thus, it is important to model the heat pump more accurately in practice.

6.1.5. Equipment On/Off Cycling Effect

During the whole course, the system does not run throughout the design period. An intermittent operation allows the ground temperature field to recover under a zero heat pulse for a short time. The consideration of this equipment on/off cycling effect helps avoid overestimating the borehole length. In simple equation-based methods, the so-called run fraction F and part-load factor PLF are introduced to take this effect into account. The run fraction F in the IGSHPA method is equal to the total hours in the design month divided by the run hours. The part-load factor PLF in the ASHRAE method can be computed directly from the hourly data by dividing the total load for the month by the product of the peak load and the number of hours in the month. The FLSCC uses an hourly load profile to calculate the temperature field and determine the design length, so zero pulses are included. In the DST-based method, a control signal was added to the simulation process, with 1 indicating the ‘on’ mode for the heat pump and 0 for the ‘off’ mode.

6.1.6. Other Effects

The ASHRAE method also considers short-circuiting heat losses between the upward and downward legs of the U-tube loop by adding a factor called Fsc to the daily pulse resistance Rga. Zanchini et al. [42] reported that the percentage energy loss due to thermal short-circuiting is only significant in the first hour, during which unsteady heat transfer occurs inside a coaxial ground heat exchanger. In accordance with the handbook, a brief sensitivity analysis was also conducted, and it indicated that the specific value for this factor (ranging from 1.01 to 1.06) produces less than 1% variation in the design length in any case. That is, this factor is somewhat negligible. In this case, Fsc was assumed to be 1.04, as specified by the handbook. In the TRNSYS software, the DST model also allows for accounting for effects such as thermal insulation, preheating calculation, and multiple ground layers. Since a virtual case was used as an example in this study, these secondary effects were not considered. It is worth noting that heat gains/losses in the piping between the BHE and the heat pump were assumed to be negligible in this case.

6.1.7. Summary of Input Parameters and Values for Comparison Runs

The main parameters used in the comparison runs are listed in Table 3. A summary of the application of each parameter and its sources are also included. The time of operation was 1 month (the coldest or the hottest month) for M1; 10 years, 1 month, and 0.25 days for M2; and 10 years for M3 and M4.

6.2. Results of Predicted Borehole Lengths

For the case presented earlier, four methods were used to size the BHEs. By using different pairs of soil thermal conductivity and borehole thermal resistance, the resulting borehole lengths subjected to TRTPE were also obtained. Figure 9 shows the sizing results for each combination of method and TRTPE underlying model.

6.2.1. Variation in Borehole Design Length Subject to PE

When analyzing over- or under-sizing errors caused by different TRT inverse models, the benchmark is the case of a consistent model, in which TRTPE and borehole length sizing use the same underlying model. As can be seen from the inter model introduced in Section 5, the underlying models of M1, M2, M3, and M4 correspond to ILS, ICS, FLSCC, and DST, respectively. Thus, PE1-M1, PE2-M2, PE5-M3, and PE6-M4 were used as the benchmark case for each method. The relative difference in the borehole design length subject to PE is defined as
ε R E , P E = | L i L b a s e | L b a s e ,
where εRE,PE is the relative difference in the design length arising from the use of different TRTPE results; Lbase is the benchmark length calculated by a method using the same underlying model as that used by TRTPE, m; and Li is the length calculated by a method using underlying models that are different from those used by TRTPE, m.
Table 4 shows the variation in the borehole design length subject to TRTPE. PE1, PE4, and PE5 produces similar relative differences in design length in each case. Of PE2, PE3, and PE6, PE6 has a larger relative difference than PE2 and PE3. This conclusion is consistent with that from the mean fluid temperature comparisons. This can be best explained by the different considerations of the PE underlying models. The ILS, FLSA, and FLSCC are all analytical solutions of the line source model, while the ICS, FLSN, and DST have different assumptions or solutions.
For simple equation-based methods, the relative difference in the borehole design length caused by TRTPE results does not exceed 5% in any case. For the IGSHPA method (M1), in a design month, the time magnitude of a month is in a range of small relative differences, as seen in Figure 5. Another reason for the low impact in the IGSHPA method is that the value of borehole thermal resistance is not needed in the simulation. The ASHRAE method (M2) also calls for PE parameters a limited number of times.
For the software-based sizing methods, significant relative differences exist in the FLSCC-based method (M3) when using parameters based on the ICS (PE2) and DST (PE6). The authors hold that the reason may be attributed to the fact that too many calls of TRT estimated parameters are needed in the simulation. For example, soil thermal properties are used 1.752 × 10⁵ times for iteration during a 10-year operation when calculating g-functions. The average relative differences in the borehole length for the FLSCC-based method (M3) and the DST-based method (M4) are generally higher than those for simple equation-based methods. The estimated parameters are also called frequently in the numerical computation for each node in the DST.
Generally, M1 and M2 are less influenced by PE results (less than 5% for any case), while M3 and M4 show significant relative differences in the borehole length design. Thus, it is important to pay attention when one model-based TRT result is substituted into another model-based sizing method. The results in Table 4 can provide a qualitative reference when necessary.

6.2.2. Comparison of Borehole Lengths Based on Four Sizing Methods

The influence of TRTPE has to be removed in order to compare the lengths determined by the four sizing methods. Thus, the average design length subject to TRTPE was calculated for each sizing method. In the comparison run, an average of average lengths, equal to 117.48 m, was used as a benchmark. The results are shown in Table 5. The relative difference between each method and the average of average lengths is defined by
ε R E , M = L i L a v e L a v e
where εRE, M is the relative difference in the design length arising from using different sizing methods; Lave is the average of average lengths subject to TRTPE, m; and Li is the average length from each sizing method, m.
It is obvious that the semi-empirical methods IGSHPA and ASHRAE result in greater lengths than those calculated by the DST-based method and FLSCC-based method. The reason may be mostly attributed to the different approaches to load representation. As mentioned above, both the IGSHPA and ASHRAE methods use a constant load over the design month or the course of operation, and it is nearly equal to peak heating or cooling load. The ASHRAE method also adds an additional peak daily pulse to consider the worst-case scenario. This also suggests the reason that the design length determined by the ASHRAE method is greater than that computed by the IGSHPA method. In simple equation-based approaches, namely, the IGSHPA and ASHRAE methods, the parameter definitions are vague and confuse designers, and there is no real justification for using excessively simplified expressions. When using a simple equation-based approach, designers need to select a value of a parameter from a certain range given by the handbook, and a random selection may lead to either over- or under-design. These simple equations are not suitable for design purposes in their existing forms.
The other two methods—namely, the DST-based method and the FLSCC-based method—directly use the hourly load data. The design output of the FLSCC-based method is about 9.7% greater than that of the DST-based method. According to the authors’ analysis, one possible reason may be that when calculating thermal interference effects, the FLS method uses the borehole located in the center of the heat storage region as a reference, and this is where the heat accumulation effect is the strongest. On the other hand, the DST model adopts a numerically explicit difference method and superposition method to calculate the temperature field of the heat storage region.
From examining the inter models of different sizing methods, the more thoughtfully developed software-based methods—such as the FLSCC-based method and DST-based method—are recommended.

7. Conclusions

This paper presents an assessment of four BHE sizing methods and their inter models, with emphasis on investigating the influence of TRTPE results. The comparisons range from the simulation of the time evolution of mean fluid temperature for a single borehole to the borehole design length for a bore field.
The time evolution of mean fluid temperature was simulated for a single borehole stimulated by a constant heat pulse for a 50-year operation, and a defined relative difference between temperatures calculated using different PE results was compared. The results of this comparison exercise show that the relative differences in temperature are up to 15% at the very beginning and around 5% at the end of system operation. Furthermore, the parameters estimated by the ILS, FLSA, or FLSCC (PE1, PE4, and PE5) have little difference, whereas more attention should be paid to the ICS, FLSN, and DST-based estimated parameters (PE2, PE3, and PE6).
The comparison of BHE sizing methods was performed by using four methods to size the length for a bore field. The design length calculated by the same underlying model as that used for TRTPE was used as a benchmark, and the relative difference in the predicted borehole length was defined and compared for each sizing method. This conclusion drawn from the comparison of the borehole design length subject to PE coincides with that from the comparison of mean fluid temperature. Using ICS-based PE results, FLSN-based PE results, and DST-based PE results causes significant relative differences compared with using FLSA-based PE results and FLSCC-based PE results. Additionally, the estimated soil thermal properties are invoked numerous times during a simulation cycle using the FLSCC-based method and the DST-based method, so these methods are more sensitive to the influence of PE results.
In the final step, the average length from each sizing method was compared. The results show that, for the test case with a symmetric synthetic load profile, simple equation-based approaches predict a much larger BHE length than software-based methods, while the design output of the FLSCC-based method is similar to that of the DST-based method. From examining their inter models, it is concluded that simple equation-based methods are somewhat rudimentary by today’s standard. Thus, the FLSCC-based method and the DST-based method are recommended since they are more thoughtfully formulated, computationally fast, and more stable.
Comprehensive comparisons of TRT interpretation models and BHE sizing inter models can play a significant role in the discovery of modeling differences or the selection of appropriate methods. This provides a reference for designers, engineers, and researchers in this field. Since this work’s main focus is on the influence of TRTPE, further investigations of other effects on BHE sizing are expected, with additional factors such as test cases with different load schemes, variations in heat pump characteristics, variations in surface and subsurface temperature, and inhomogeneous soil formulation.

Author Contributions

Conceptualization, X.Z. and T.Z.; Methodology, X.Z.; Validation, X.Z. and T.Z.; Formal analysis, X.Z.; Investigation, T.Z.; Data curation, T.Z.; Writing—original draft preparation, X.Z.; Writing—review and editing, B.L.; Supervision, B.L. and Y.J.; Project administration, B.L.; Funding acquisition, Y.J.

Funding

This research was funded by the National Key R&D Program of China, grant number 2017YFC0702900.

Acknowledgments

The authors would like to thank two anonymous reviewers for their scientific attitude and insightful suggestions. Their comments helped improve the quality of this paper.

Conflicts of Interest

The authors declare no conflict of interest.

Nomenclature

BBorehole spacing, m;
csSoil specific heat capacity, J·kg−1·K−1;
CfFluid specific heat, J·kg−1·K−1;
COPcCoefficient of performance for cooling mode, --;
COPhCoefficient of performance for heating mode, --;
dpDepth of thermal penetration, m;
ETotal heat stored in a cylindrical region, J;
FcRun fraction for cooling mode, --;
FhRun fraction for heating mode, --;
FscShort-circuit heat loss factor, --;
gg function, --;
gltLong-term response factor g function, --;
gstShort-term response factor g function, --;
GG factor, --;
HBorehole depth, m;
kGeothermal gradient, °C·m−1;
K0Modified Bessel functions of the second kind of order 0;
K1Modified Bessel functions of the second kind of order 0;
LaveAverage length of design length for each sizing method, m;
LbaseDesign length benchmark for comparison subject to parameter estimation, m;
LcRequired design length for cooling mode, m;
LhRequired design length for heating mode, m;
m ˙ Flow rate, m3·s−1;
PLFmPart load factor, --;
qlHeat transfer rate, W·m−1;
QaNet annual average heat transfer to ground, W;
QcDesign load for cooling mode, W;
QhDesign load for heating mode, W;
rbBorehole radius, m;
riPipe inside radius, m;
roPipe outside radius, m;
roeEquivalent pipe radius, m;
RbBorehole thermal resistance, K·m·W−1;
RgaEffective thermal resistances of ground to annual pulse, K·m·W−1;
RgdEffective thermal resistances of ground to peak daily pulse, K·m·W−1;
RgmEffective thermal resistances of ground to monthly pulse, K·m·W−1;
RpPipe thermal resistance, K·m·W−1;
RsSoil thermal resistance, K·m·W−1;
T0Undisturbed ground temperature, °C;
T0sGround surface temperature at z = 0, °C;
TairAir temperature, °C;
TamAmplitude of temperature oscillations, °C;
T bMean borehole wall temperature, °C;
TbaseMean fluid temperature calculated by base parameter estimation result, °C;
T fMean fluid temperature, °C;
Tin,hpFluid temperature entering the heat pump, °C;
Tout,hpFluid temperature leaving the heat pump, °C;
Tin,BHEFluid temperature entering the borehole heat exchanger, °C;
Tout,BHEFluid temperature leaving the borehole heat exchanger, °C;
TLMinimum heat pump entering fluid temperature, °C;
THMaximum heat pump entering fluid temperature, °C;
TgsContribution portion of ground surface temperature, °C;
TmAnnual mean ground surface temperature, °C;
TpPenalty temperature, °C;
TContribution portion of undisturbed ground temperature, °C;
VDSTStorage volume, m3;
Greek letters
αsSoil thermal diffusivity, m²·s−1;
εRE,PERelative difference of mean borehole temperature subject to parameter estimation, --;
εRE, M,Relative difference of average length subject to sizing method, --;
φUndisturbed ground temperature in the vertical direction, °C;
γEuler’s constant;
κsSoil thermal conductivity, W·m−1·K−1;
ρsSoil density, kg·m−3;
τaOperation time of annual pulse, s;
τdOperation time of daily pulse, s;
τmOperation time of monthly pulse, s;
τminTime boundary of unsteady state, s;
τnSimulation period, s;
τpdPeriod of temperature oscillations, s;
τssTime boundary of steady state, s;
υfFlow velocity, m·s−1;
ωAngular frequency, rad·s−1;
τPhase constant, s;
ψGround surface temperature, °C;
Abbreviations
BHEBorehole heat exchanger
COPCoefficient of performance
DSTDuct ground heat storage model
EFTEntering fluid temperature
FLSFinite line source model
FLSAFinite line source model with analytical solution
FLSCCFinite line source model considering complex initial and boundary conditions
FLSNFinite line source model with numerical solution
GCHPGround coupled heat pump
ICSInfinite cylinder source model
IGSHPAInternational Ground Source Heat Pump Association
ILSInfinite line source model
RMSERoot-mean-square error
SSEError sum of squares
TRTThermal response test

References

  1. Ball, D.A.; Fischer, R.D.; Hodgett, D.L. Design methods for ground-source heat pumps. ASHRAE Trans. 1983, 89, 416–440. [Google Scholar]
  2. ASHRAE. ASHRAE Handbook—HVAC Applications; Chapter 34. Geothermal Energy; American Society of Heating, Refrigerating and Air Conditioning Engineers (ASHRAE): Atlanta, GA, USA, 2011. [Google Scholar]
  3. Kavanaugh, S.P.; Rafferty, K. Ground-source Heat Pumps—Design of Geothermal System for Commercial and Institutional Buildings; ASHRAE: Atlanta, GA, USA, 1997. [Google Scholar]
  4. IGSHPA. Ground Source Heat Pump Residential and Light Commercial: Design and Installation Guide; Oklahoma State University: Stillwater, OK, USA, 2009. [Google Scholar]
  5. Eskilson, P. Thermal Analysis of Heat Extraction Boreholes. Ph.D. Thesis, University of Lund, Lund, Switzerland, 1987. [Google Scholar]
  6. Hellström, G. Ground Heat Storage Thermal Analyses of Duct Storage System I. Theory. Ph.D. Thesis, University of Lund, Lund, Switzerland, 1991. [Google Scholar]
  7. Pahud, D.; Hellström, G. The new duct ground heat model for TRNSYS. In Seminar 49 Physical Models for Thermal Energy Stores; Eindhoven University of Technology: Eindhoven, The Netherlands, 1996. [Google Scholar]
  8. Yang, H.; Cui, P.; Fang, Z. Vertical-borehole ground-coupled heat pumps: A review of models and systems. Appl. Energy 2010, 87, 16–27. [Google Scholar] [CrossRef]
  9. Rainieri, S.; Bozzoli, F.; Pagliarini, G. Modeling approaches applied to the thermal response test: A critical review of the literature. HVAC&R Res. 2011, 17, 977–990. [Google Scholar]
  10. Thornton, J.W.; McDowell, T.P.; HuBHEs, P.J. Comparison of practical vertical ground heat exchanger sizing methods to a Fort Polk datamodel benchmark. ASHRAE Trans. 1997, 8, 675–683. [Google Scholar]
  11. Shonder, J.A.; Baxter, V.; Thornton, J.; HuBHEs, P. A comparison of vertical ground heat exchanger software for commercial applications. ASHRAE Trans. 2000, 106, 831–842. [Google Scholar]
  12. Kurevija, T.; Vulin, D.; Krapec, V. Effect of borehole array geometry and thermal interferences on ground source heat pump system. Energy Convers. Manag. 2012, 60, 134–142. [Google Scholar] [CrossRef]
  13. Cullin, J.R.; Spitler, J.D.; Montagud, C. Validation of vertical ground heat exchanger design methodologies. Sci. Technol. Built Environ. 2015, 21, 137–149. [Google Scholar] [CrossRef]
  14. Staiti, M. The Sizing of Borehole Heat Exchangers for Ground Source Heat Pumps: A Comparison Between Two Methods. Master’s Thesis, Politecnico di Milano, Milan, Italy, 2014. [Google Scholar]
  15. Beier, R.A. Vertical temperature profile in ground heat exchanger during in-situ test. Renew. Energy 2011, 36, 1578–1587. [Google Scholar] [CrossRef]
  16. Conti, P. Dimensionless Maps for the Validity of Analytical Ground Heat Transfer Models for GSHP Applications. Energies 2016, 9, 890. [Google Scholar] [CrossRef]
  17. Zarrella, A.; Emmi, G.; Graci, S.; De Carli, M.; Cultrera, M.; Santa, G.; Galgaro, A.; Bertermann, D.; Müller, J.; Pockelé, L.; et al. Thermal Response Testing Results of Different Types of Borehole Heat Exchangers: An Analysis and Comparison of Interpretation Methods. Energies 2017, 10, 801. [Google Scholar] [CrossRef]
  18. Urchueguía, J.; Lemus-Zúñiga, L.; Oliver-Villanueva, J.; Badenes, B.; Pla, M.; Cuevas, J. How Reliable Are Standard Thermal Response Tests? An Assessment Based on Long-Term Thermal Response Tests Under Different Operational Conditions. Energies 2018, 11, 3347. [Google Scholar] [CrossRef]
  19. Morgensen, P. Fluid to Duct Wall Heat Transfer in Duct System Heat Storages. In International Conference on Surface Heat Storage in Theory and Practice; Swedish Council for Building Research: Stockholm, Switzerland, 1983; pp. 652–657. [Google Scholar]
  20. Zhang, C.; Guo, Z.; Liu, Y.; Cong, X.; Peng, D. A review on thermal response test of ground-coupled heat pump systems. Renew. Sustain. Energy Rev. 2014, 40, 851–867. [Google Scholar] [CrossRef]
  21. Ingersoll, L.R.; Plass, H.J. Theory of the ground pipe heat source for heat pump. Heat. Pip. Air Cond. 1948, 20, 119–122. [Google Scholar]
  22. Carslaw, H.S.; Jaeger, J.C. Conduction of Heat in Solids, 2nd ed.; Oxford University Press: Oxford, UK, 1959; p. 510. [Google Scholar]
  23. Ingersioll, L.; Zobel, O.J.; Ingersoll, A.C. Heat Conduction: With Engineering Geological and Other Applications; Mc Graw-Hill: New York, NY, USA, 1954; p. 325. [Google Scholar]
  24. Cimmino, M.; Bernier, M.; Adams, F. A contribution towards the determination of g-functions using the finite line source. Appl. Therm. Eng. 2013, 51, 401–412. [Google Scholar] [CrossRef]
  25. Yavuzturk, C. Modeling of Vertical Ground Loop Heat Exchangers for Ground Source Heat Pump Systems. Ph.D. Thesis, Oklahoma State University, Stillwater, OK, USA, 1999. [Google Scholar]
  26. Bandos, T.V.; Montero, Á.; Fernández, E.; Santander, J.L.G.; Isidro, J.M.; Pérez, J.; De Córdoba, P.J.F.; Urchueguíab, J.F. Finite line-source model for borehole heat exchangers: Effect of vertical temperature variations. Geothermics 2009, 38, 263–270. [Google Scholar] [CrossRef]
  27. Zhang, X.; Zhang, T.; Jiang, Y.; Li, B. Improvement on an analytical finite line source model considering complex initial and boundary conditions: Part 1, model development and validation. Energy Build. 2019, 198, 1–10. [Google Scholar] [CrossRef]
  28. Bernier, M.A. Ground-coupled heat pump system simulation. ASHRAE Trans. 2001, 107, 605–616. [Google Scholar]
  29. Baudoin, A.E. Stockage Intersaisonnier de Chaleur Dans le sol par Batterie D’echangeurs Baionnette Verticaux: Modele de Predimensionnement. Ph.D. Thesis, Université de Reims, Reims, France, 1988. [Google Scholar]
  30. Maestre, I.R.; Gallero, F.J.G.; Gómez, P.Á.; Pérez-Lombard, L. A new RC and g-function hybrid model to simulate vertical ground heat exchangers. Renew. Energy 2015, 78, 631–642. [Google Scholar] [CrossRef]
  31. Kusuda, T.; Achenbach, P.R. Earth temperature and thermal diffusivity selected stations in the United States. ASHRAE Trans. 1965, 71, 61–76. [Google Scholar]
  32. Witte, H.J.L. Advances in geothermal response testing. Therm. Energy Storage Sustain. Energy Consum. 2007, 234, 177–192. [Google Scholar]
  33. Pahud, D.; Hellström, G.; Mazzarella, L. Heat storage in the ground Duct ground heat storage model for TRNSYS (TRNVDST) User manual for the October 1996 version; project report for Laboratoire des systèmes énergétiques (LASEN): Lausanne, Switzerland, 1996. [Google Scholar]
  34. Zhang, X.; Jiang, Y.; Yao, Y.; Deng, S. A TRNSYS-based thermal response test parameter estimation method. Int. J. Electr. Energy 2016, 4, 28–31. [Google Scholar] [CrossRef]
  35. Li, M.; Lai, A.C.K. Parameter estimation of in-situ thermal response tests for borehole ground heat exchangers. Int. J. Heat Mass Transf. 2012, 55, 2615–2624. [Google Scholar] [CrossRef]
  36. Beck, J.V.; Arnold, K.J. Parameter Estimation in Engineering and Science; John Wiley & Sons: New York, NY, USA, 1977. [Google Scholar]
  37. Ozisik, M.N.; Orlande, H.R.B. Inverse Heat Transfer: Fundamentals and Applications; Taylor & Francis: New York, NY, USA, 2000. [Google Scholar]
  38. Wetter, M. Optimization Program. User Manual Version 3.1.1; Office of Scientific & Technical Information; U.S.Department of Energy: Washington, DC, USA, 2009.
  39. Zhang, X.; Huang, G.; Jiang, Y.; Zhang, T. Ground heat exchanger design subject to uncertainties arising from thermal response test parameter estimation. Energy Build. 2015, 102, 442–452. [Google Scholar] [CrossRef]
  40. Raymond, J.; Therrien, R.; Gosselin, L.; Lefebvre, R. A review of thermal response test analysis using pumping test concepts. Groundwater 2011, 49, 932–945. [Google Scholar] [CrossRef]
  41. Kavanaugh, S.P. Field tests for ground thermal properties—Methods and impact on ground-source heat pump design. Chin. J. Explos. Propellants 2000, 32, 1–4. [Google Scholar]
  42. Marcotte, D.; Pasquier, P. On the estimation of thermal resistance in borehole thermal conductivity test. Renew. Energy 2008, 33, 2407–2415. [Google Scholar] [CrossRef]
  43. Cane, R.L.D.; Forgas, D.A. Modeling of ground-source heat pump performance. ASHRAE Trans. 1991, 17, 909–925. [Google Scholar]
  44. Zhang, X.; Zhang, T.; Jiang, Y.; Li, B. Improvement on an analytical finite line source model considering complex initial and boundary conditions: Part 2, model application in system design. Energy Building 2019. [Google Scholar]
  45. Bernier, M.; Pinel, P.; Labib, R.; Paillot, R. A multiple load aggregation algorithm for annual hourly simulations of GCHP systems. HVAC&R Res. 2004, 10, 471–487. [Google Scholar]
  46. Park, S.; Kim, E. Optimal Sizing of Irregularly Arranged Boreholes Using Duct-Storage Model. Sustainability 2019, 11, 4338. [Google Scholar] [CrossRef]
  47. Zhang, X.; Jiang, Y.; Yang, Y. Improved method and case study of ground-coupled heat pump system design. Energy Procedia 2012, 14, 849–854. [Google Scholar] [CrossRef]
  48. Dehkordi, S.E.; Schincariol, R.A. Guidelines and the design approach for vertical geothermal heat pump systems: Current status and perspective. Can. Geotech. J. 2014, 51, 647–662. [Google Scholar] [CrossRef]
  49. The PRC Ministry of Construction. Technical Code for Ground-Source Heat Pump System (2009); GB 50366-2009; China Architecture & Building Press: Beijing, China, 2009. [Google Scholar]
  50. Huang, G. Heat Transfer Model and Characteristics of Helix Ground Heat Exchanger Under Dynamic Environment. Ph.D. Thesis, Chongqing University, Chongqing, China, 2014. (In Chinese). [Google Scholar]
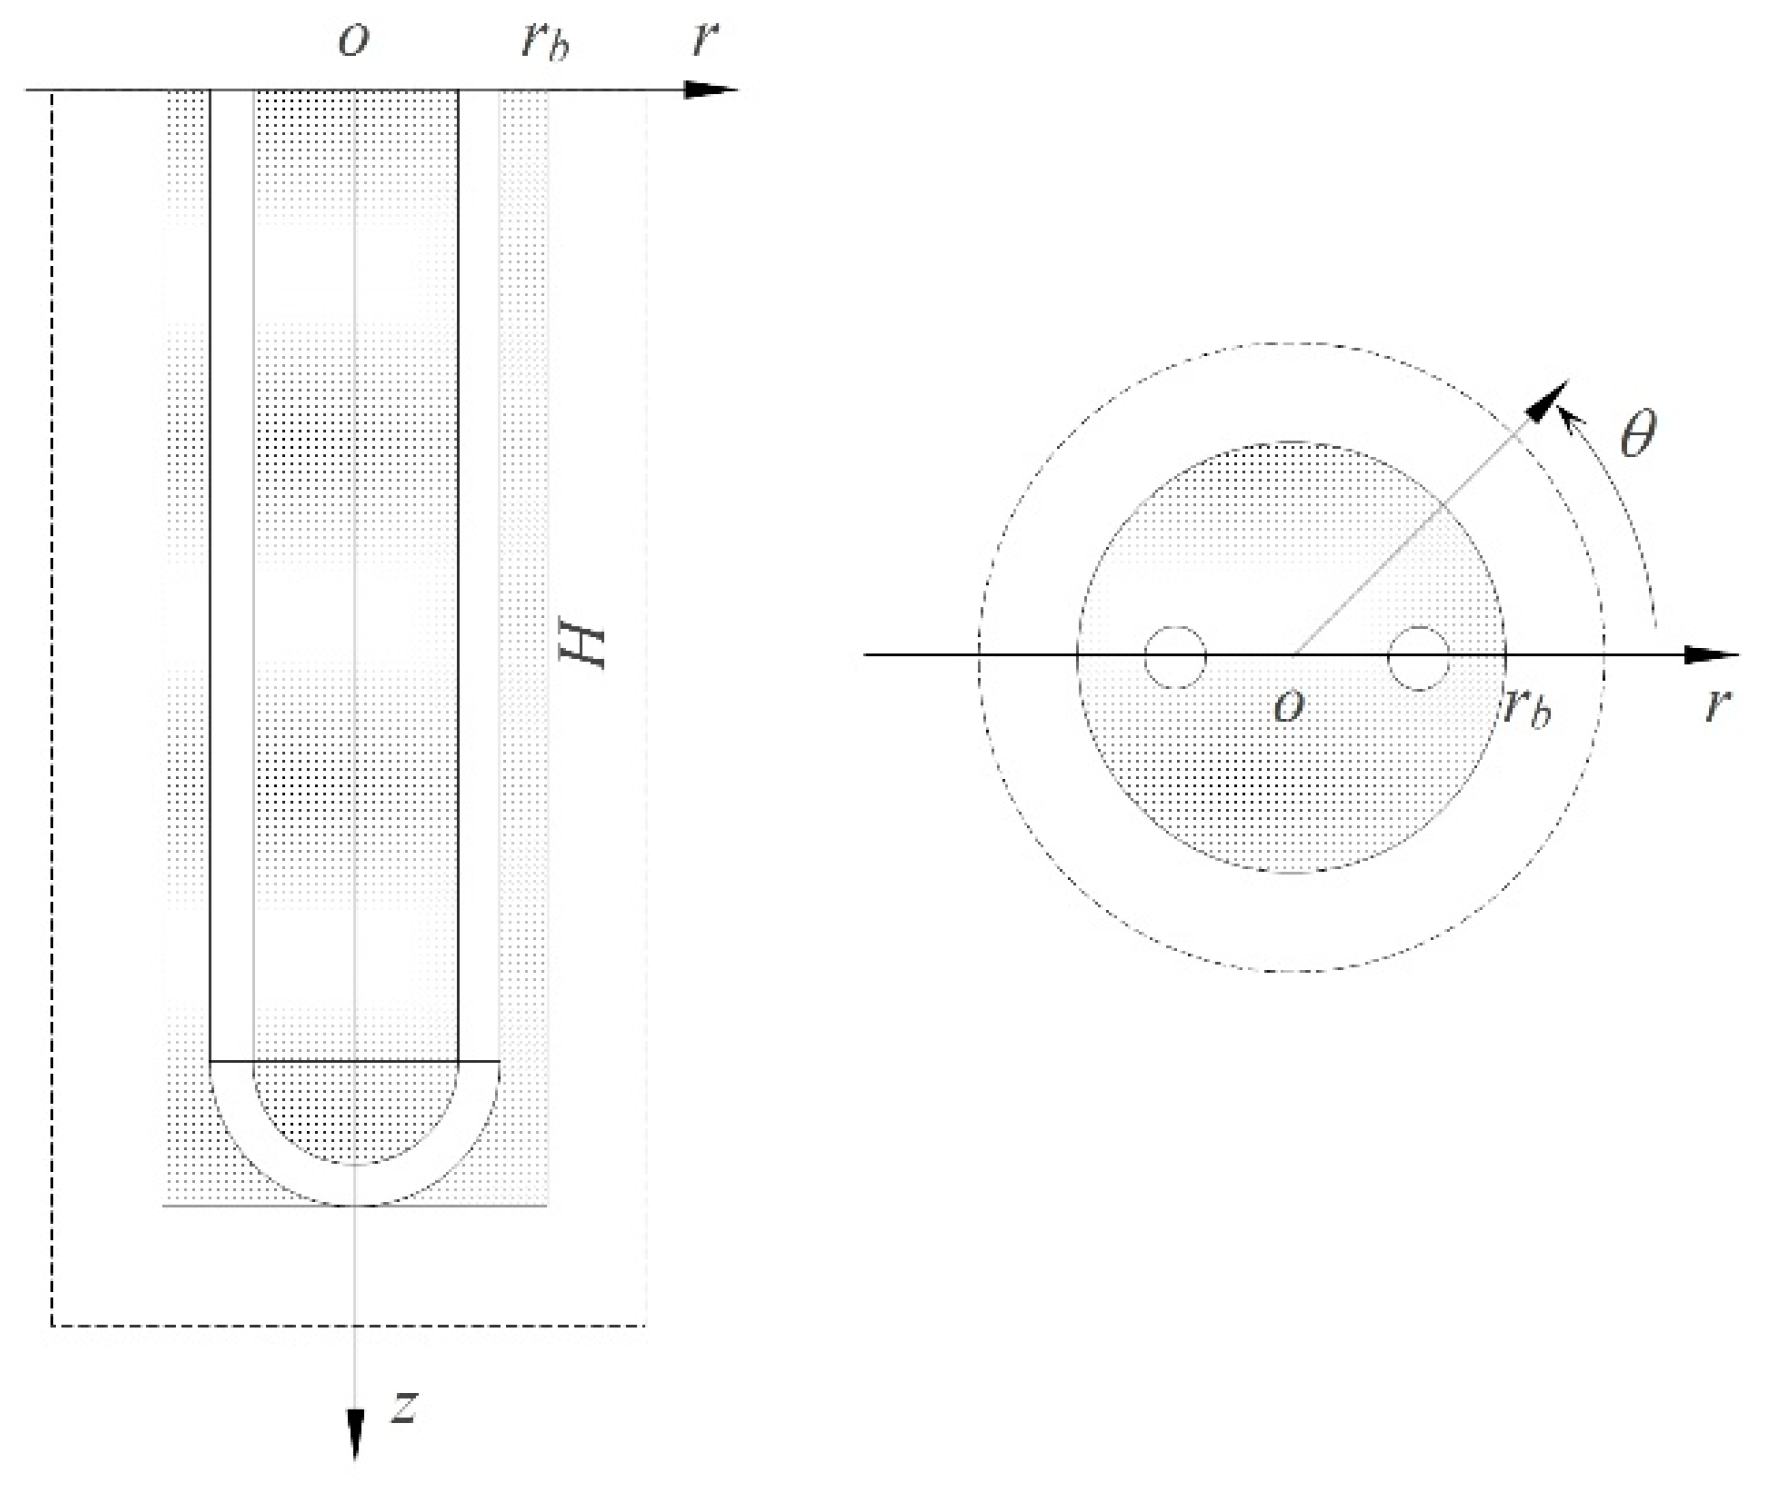
Figure 1. Layout of a typical U-tube configuration.
Energies 12 04067 g001
Figure 2. Schematic representation of (a) ILS; (b) ICS; (c) FLS, including FLSN, FLSA, and FLSCC; (d) DST.
Energies 12 04067 g002
Figure 3. Layout of the DST-based PE approach.
Energies 12 04067 g003
Figure 4. Tested temperatures. The figure shows the time evolution of the inlet and outlet temperatures of the BHE, their temperature differences, and ambient air temperatures.
Energies 12 04067 g004
Figure 5. Time evolution of the relative differences caused by using different pairs of estimated parameters. For each subplot, the benchmark case uses the same model both for TRT interpretation and mean fluid simulation. The model used for calculating mean fluid temperature for each subplot is (a) ILS; (b) ICS; (c) FLSN; (d) FLSA; (e) FLSCC; and (f) DST.
Energies 12 04067 g005
Figure 6. Layout of the DST-based sizing method.
Energies 12 04067 g006
Figure 7. Flowcharts of the typical steps required to size a BHE bore field for different sizing methods: (a) M1, (b) M2, (c) M3, and (d) M4.
Energies 12 04067 g007
Figure 8. Hourly load information, including (a) building hourly loads and (b) ground hourly loads.
Energies 12 04067 g008
Figure 9. Borehole length calculated by different sizing methods using different PE results.
Energies 12 04067 g009
Table 1. Results of TRTPE using different models.
No.Base ModelSSERMSE (°C)Rb
K·m·W−1
κs
W·m−1·K−1
PE1ILS1.47210.09750.06942.9639
PE2ICS1.48720.09800.06282.8270
PE3FLSN1.47940.09770.07263.1102
PE4FLSA1.47880.09770.06982.9630
PE5FLSCC0.98720.07980.06932.9496
PE6DST1.28760.09140.05402.7793
Table 2. Summary of the characteristics and inter-model considerations of sizing methods.
M1M2M3M4
TypeSimple equation-basedSimple equation-basedSoftware-basedSoftware-based
Base modelILSICSFLSCCDST
Load representationTwo pulsesThree pulsesHourly loadsHourly loads
Bore field geometryRectangleRectangleRectangleCylinder
COPsConstantConstantConstantVariable
Surface temperatureConstantConstantVariableVariable
Thermal inference
Geothermal gradient
Ground stratification
Thermal insulation
Thermal short-circuiting
Table 3. Parameter values for comparison runs.
ParameterSymbolUnitValueApplicationSource
Borehole spacingBm6M1, M2, M3, M4--
Number of boreholesNb--12 × 12M1, M2, M3--
Number of U-pipe legsNUlegs--2M1--
Borehole radiusrbm0.076M1, M2, M3, M4--
Pipe outside radiusrom0.016M1--
Pipe inside radiusrim0.013M1--
Equivalent pipe radiusroem--M1Equation (44)
Thermal conductivity of pipeκpW·m−1·K−10.70M1--
Soil densityρskg·m−32000M1, M2, M3, M4--
Soil specific heat capacitycsJ·kg−1·m−3·K−11125M1, M2, M3, M4--
Specific heat of the fluidCfJ·kg−1·K−14019M2, M3, M4--
Soil thermal diffusivityαsm²·s−1--M1, M2, M3, M4Equation (4)
Soil thermal conductivityκsW·m−1·K−1--M1, M2, M3, M4Table 1
Borehole thermal resistance RbK·m·W−1--M1, M2, M3, M4Table 1
Soil thermal resistanceRsK·m·W−1--M1Equation (41)–(44)
Thermal resistance of U pipeRpK·m·W−1--M1Equation (35)
Effective thermal resistances of ground to annual pulseRgaK·m·W−1--M2Equation (36)
Effective thermal resistances of ground to monthly pulseRgmK·m·W−1--M2Equation (37)
Effective thermal resistances of ground to peak daily pulseRgdK·m·W−1--M2Equation (38)
Operation time of annual pulseτah87,600M2--
Operation time of monthly pulseτmh720M2--
Operation time of daily pulseτdh6M2--
Simulation periodτnh--M1, M2, M3, M4Method dependent
Net annual average heat transfer to groundQakW31.7M2Load analysis
Design load for cooling modeQckW1030M1, M2Load analysis
Design load for heating modeQhkW1030M1, M2Load analysis
Part-load factor for cooling modePLFc--0.17M2Load analysis
Part-load factor for heating modePLFh--0.17M2Load analysis
Run fraction for cooling modeFc--0.50M1Load analysis
Run fraction for heating modeFh--0.50M1Load analysis
Short-circuit heat loss factorFsc--1.04M2--
Undisturbed ground temperatureT0°C7.5M1, M2, M4--
Ground surface temperature at z=0T0s°C7.5M3, M4--
Geothermal gradientk°C·m−10M3, M4--
Period of temperature oscillationsτpds3.1536 × 107M3, M4--
Depth of thermal penetrationdpm--M3Equation (21)
Time boundary of unsteady stateτmins--M3Equation (10)
Time boundary of steady stateτsss--M3Equation (11)
Maximum heat pump entering fluid temperatureTH°C32M1, M2, M3, M4--
Fluid temperature entering the heat pumpTin,hp°C--M2, M3Equation (33)
Minimum heat pump entering fluid temperatureTL°C1M1, M2, M3, M4--
Penalty temperatureTp°C--M2Equation (45)
Annual mean ground surface temperatureTm°C7.8M3, M4--
Amplitude of temperature oscillationsTam°C-18M3, M4--
Initial phaseω∆τrad0.24M3, M4--
Coefficient of performance for cooling modeCOPc--3.993M1, M2, M3--
Coefficient of performance for heating modeCOPh--3.351M1, M2, M3--
Flow rate m ˙ kg·s−170M2, M3, M4--
Flow velocityυfm·s−10.6M4--
Storage volumeVDSTm3--M4Equation (34)
Table 4. Variation in borehole design length subject to PE.
PE1PE2PE3PE4PE5PE6
M10.003.072.990.020.964.21
M21.360.000.831.601.544.09
M30.006.272.470.450.0015.64
M45.644.145.385.965.810.00
Table 5. Comparison of the average borehole design length from the four sizing methods.
IGSHPAASHRAEFLSCCTRNSYS
Average length, m138.20190.9876.1464.61
Relative difference, %18.1263.23−34.93−44.78