Article

Suppression Effects of Hydroxy Acid Modified Montmorillonite Powders on Methane Explosions

1
State Key Laboratory Cultivation Bases for Gas Geology and Gas Control, College of Safety Science and Engineering, Henan Polytechnic University, Jiaozuo 454000, China
2
The Collaboration Innovation Center of Coal Safety Production of Henan Province, Henan Polytechnic University, Jiaozuo 454000, China
*
Authors to whom correspondence should be addressed.
Energies 2019, 12(21), 4068; https://doi.org/10.3390/en12214068
Submission received: 9 October 2019 / Revised: 18 October 2019 / Accepted: 21 October 2019 / Published: 25 October 2019

Abstract

:
In this paper, montmorillonite inhibitors modified with polyhydroxy functional groups by gluconic acid (GA) were successfully prepared. The particle size distribution, composition, surface functional groups, and pyrolysis characteristics of the pure montmorillonite powders (Mt) and the gluconic acid modified powders (G-Mt) were analyzed by using a laser particle analyzer, X-ray diffraction (XRD), Fourier transform infrared (FTIR) and thermogravimetry–differential scanning calorimetry (TG-DSC), respectively. The suppression effect of Mt and G-Mt on the 9.5% methane–air premixed gas was tested in a 20 L spherical explosion device and a 5 L pipeline experimental system. The results show that G-Mt displays a much better suppression property than that of Mt. The optimal explosion suppression effect concentration of Mt or G-Mt powders is about 0.25 g·L−1. In this concentration, for G-Mt, the maximum explosion pressure declined by 26.7%, the maximum rate of pressure rise declined by 74.63%, and the time for the flame front to reach the top of the pipe was delayed by 242.5%. On the basis of the experimental data, the better suppression effect of G-Mt than Mt might be attributed to the presence of more hydroxyl groups on the surface.

Graphical Abstract

1. Introduction

As is well known, a methane–air mixture is a type of explosive gas and is the main component of natural gas, biogas, and coalbed methane. It is a high-quality clean fuel as well as an important raw material for the manufacture of syngas, as well as many chemical products that are usually transported through the pipeline network [1]. However, it can lead to extremely serious consequences because of its explosiveness. Thus, in order to prevent or reduce the damage caused by methane explosions, many inhibitors have been developed such as inert gases, water mist, aerosol, powder inhibitors, and so on [2,3,4,5,6]. Chemical powders—especially inorganic powders— have attracted many studies owing to the advantages of their easy storage, low cost, high dispersion, and being environmentally benign. As reported by Luo, Liu and Zhang [7,8,9], diatomite, quartz, rock dust, and palygorskite powders presented certain explosion suppression effects on methane explosions. Sun, Ni, and Wang obtained novel composite powder inhibitors by NaHCO3 powders with porous kaolinite, zeolite, and red mud, respectively [10,11,12]. Hu modified Mg(OH)2 powders by the use of 9,10-dihydro-9-oxygen mixed-10-phosphaphenanthrene-10-oxide, and the results showed that the pyrolysis fragments could directly react with flame free radicals to achieve an excellent explosion suppression effect [13]. His research also indicated that the development of modified inorganic mineral powders which can react with active free radicals (∙H, ∙HO2, ∙CH, ∙CH3 and ∙HCO) [14,15,16,17,18] of the methane explosion is an effective methane explosion suppression method.
Montmorillonite is a kind of 2:1 layered structure clay [19]. Because of its special structure, it is often used for functional modification [20]. Ca2+-montmorillonite is usually treated with acids to replace the divalent calcium cations with monovalent hydrogen ions, with the aim of altering the smectite layers and increasing the specific surface area and porosity [21]. Gluconic acid is a type of low carbon polyhydroxy acid, and the hydroxyl groups on saturated carbon are easily removed after protonation. Therefore, using gluconic acid to modify montmorillonite may increase the amount of the montmorillonite surface hydroxyl groups; thus, the modified montmorillonite may exhibit greater gas explosion suppression performance.
In this study, montmorillonite was modified by gluconic acid, and montmorillonite powders with polyhydroxyl functional groups were obtained. Then, the explosion inhibition effects of the montmorillonite powders with polyhydroxyl functional groups on methane explosions were investigated using a 20 L stainless steel spherical vessel and a 5 L pipeline experimental system. Based on the experimental results, a possible suppression mechanism was discussed.

2. Experimental

2.1. Materials and Preparation Procedures

The montmorillonite (purity > 95%) was obtained from Zhejiang Sanding Technology Co., Ltd. Gluconic acid (C6H12O7, 99%) was purchased from Nine-Dinn Chemistry (Shanghai) Co., Ltd. All of the raw chemical reagents used in the experiments were of analytical-grade purity and were used directly without further purification.
The procedure used to prepare the modified montmorillonite inhibitors was as follows. Firstly, a solution of 0.5 mol/L gluconic acid was prepared and 10 g of montmorillonite powders were mixed with 40 mL of acid solution under a liquid–solid ratio of 4:1. Then, the mixture was stirred for two hours at a constant temperature of 298 K in a heat-collecting thermostatic heating magnetic agitator. Afterwards, it was rinsed 4–5 times using deionized water and then pumped with a filter pump 3–4 times to obtain precipitation. The mixture was dried for one week in a vacuum drying oven at 313 K. Finally, the powders for testing were collected through a 200-mesh sieve screen.

2.2. Powder Characterisation Methods

X-ray powder diffraction (XRD) analysis was performed by a Bruker AXS D8 advance diffractometer (AXS D8, Bruker, Madison, WI, USA) with Cu/Kα radiation, at 40 kV and 25 mA, in a scanning range of 5–80° (2θ). A Malvern Sizer 2000 (Mastersizer2000, Marvin instruments Ltd, Worcestershire, UK) was used to test the powder specification. The Fourier transform infrared (FTIR) spectrum of the KBr wafer was recorded using a Nicolet 6700 Fourier Transform Spectrometer (TENSOR-37, Brook spectroscopic instruments Ltd, Ettlingen, Germany). Thermogravimetry-differential scanning calorimetry (TG-DSC) analysis was conducted using a Simultaneous Thermal Analyser (NETZSCH, Selb, Germany) in a flow of air (20 mL·min−1) at a heating rate of 10 °C·min−1. In this process, the starting temperature was 25 °C and the termination temperature was 800 °C.

2.3. Powder Suppression Explosion Experiments

The explosion pressure parameters of the methane explosion, suppressed by different concentrations of Mt and G-Mt, were tested by using the 20 L spherical explosion instrument, and the flame propagation behavior was measured in the pipeline test system, which had a cross-sectional area of 100 × 100 mm2 and a length of 500 mm. It has been shown that the dust dispersion inside the 20 L sphere used for explosion experiments is not uniform [22], and also that dust particles may undergo fragmentation when passing through the nozzle of the 20 L spherical vessel [23]. The same is true in the pipeline test system. In order to ensure the accuracy and reproducibility of the results, each experiment was repeated at least three times. Fortunately, the experimental results showed that the experimental data in this study are repeatable. The physical properties of the montmorillonite powders and the palygorskite powders were similar; thus, the test parameters of each system were the same as those used in previous research [9].

3. Results and Discussion

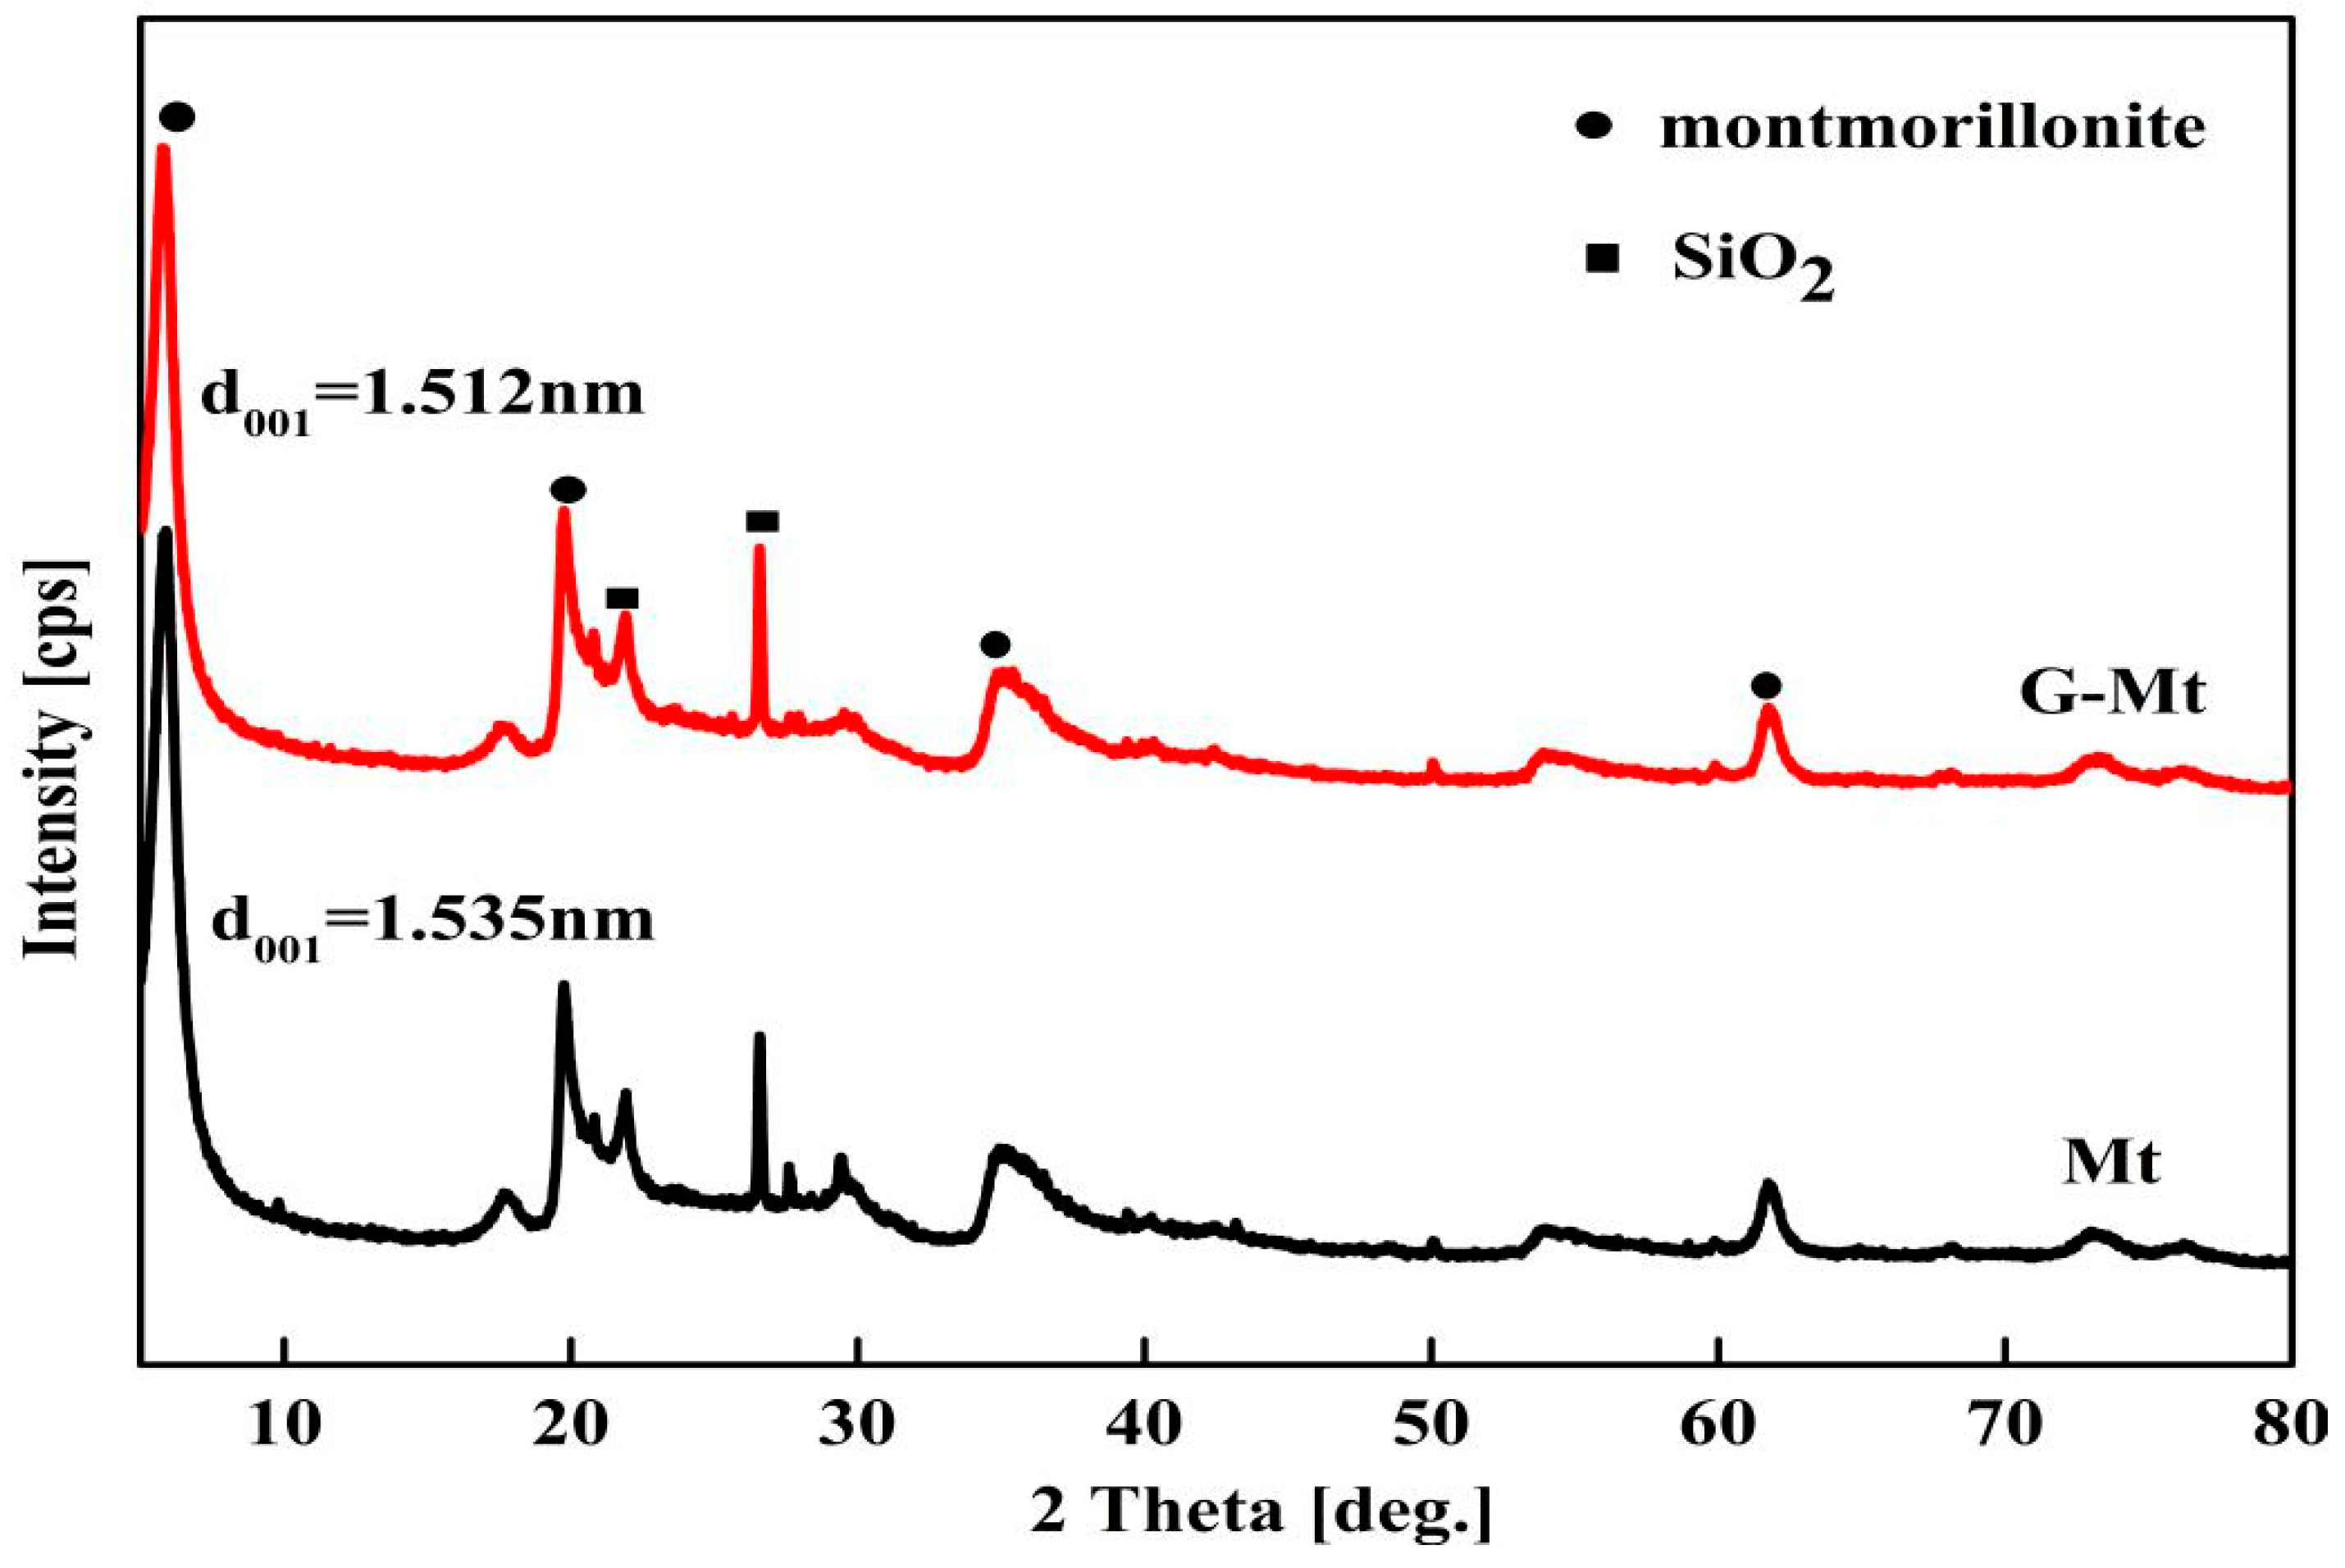
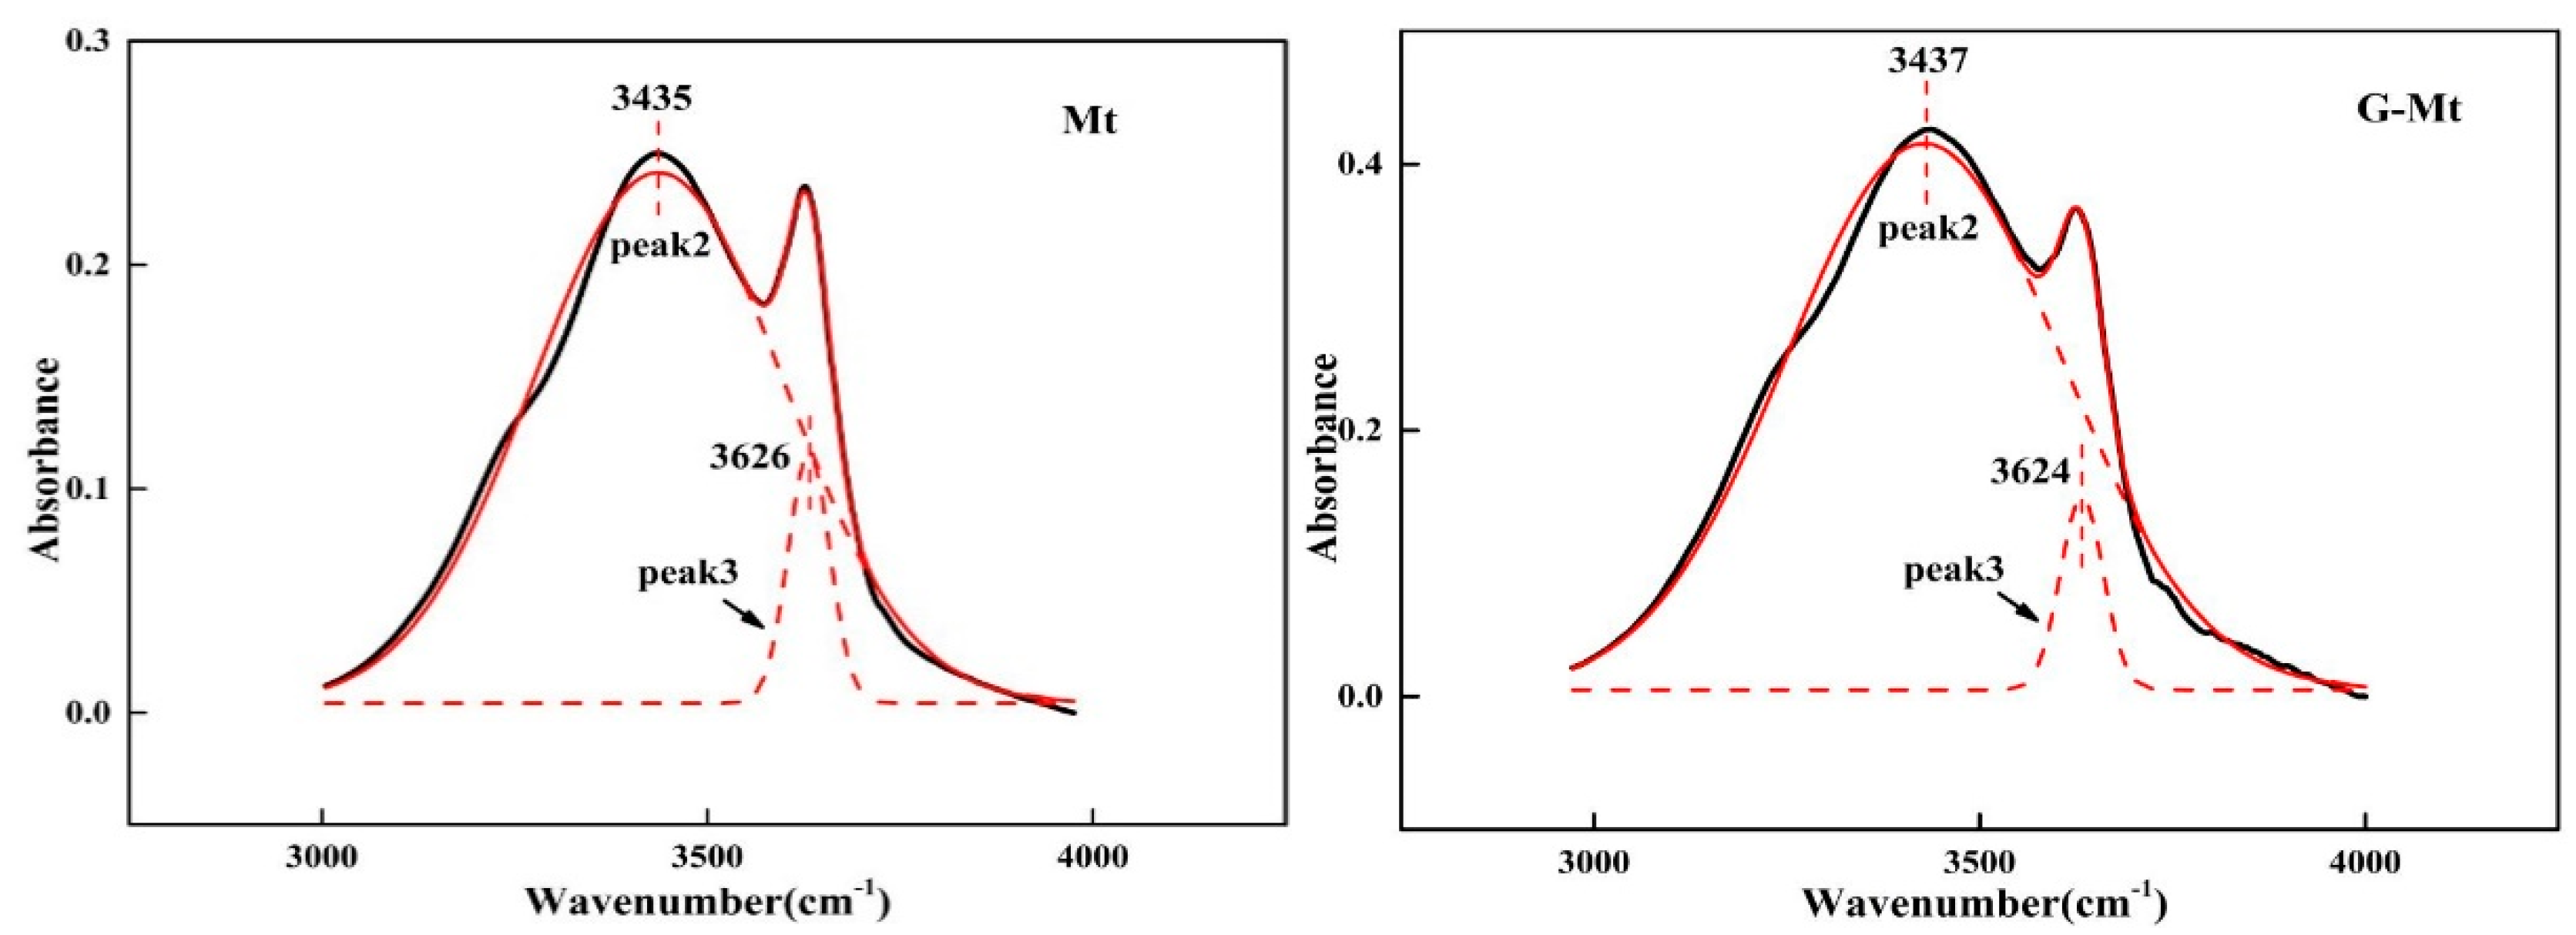
3.1. Characterisation of Mt and G-Mt

The XRD patterns of Mt and G-Mt are shown in Figure 1. It can be seen that the diffraction peaks of the two samples match the Mt standard pattern (JCPDS: 13–0135). The three principal peaks at 2θ = 5.887°, 17.688°, and 19.712° correspond to the (001), (003), and (100) planes of Mt, respectively [24]. Moreover, the value of d001 of the (001) crystal is 1.535 nm, indicating that the sample is typical calcium montmorillonite [25]. Compared with d001 of the (001) crystal peak of Mt, the value of d001 of G-Mt decreases slightly. This is because the structure of Mt is destroyed by GA [26]. An obvious peak is observed at 2θ = 26.639°, which agrees with SiO2 (JCPDS: 13–0135). Thus, it can be inferred that a small amount of quartz is included in the Mt.
The powder inhibitors used in this study were all sieved through a standard 200-mesh screen. Then, their particle size distributions were determined using a Malvern Mastersizer 2000 laser particle analyzer (Mastersizer2000, Marvin instruments Ltd, UK). The results of the two different powders are shown in Figure 2. The average particle sizes of Mt and G-Mt are 1.84 μm and 5.78 μm, respectively.
The FTIR spectra of Mt and G-Mt are shown in Figure 3. Bands at 464 and 1039 cm−1 correspond to the bending vibration of Si-O and the stretching vibration of O-Si-O, respectively [27]. The -OH bending and stretching vibration are found at 3400–3700 cm−1 [28,29]. It can be seen from Figure 3 that the -OH absorption peaks of G-Mt are significantly stronger than those of Mt. Comparing the adsorption peaks of -OH in two samples, the possible intercalation and grafting of -OH within the clay could be predicted when the increase of the relative intensities of the aforementioned peaks was observed [30]. Therefore, the 1643 and 3000–4000 cm−1 bands were processed by peak-splitting fitting [31], and the corresponding results are shown in Figure 4. As can be seen from Table 1, the 1643 cm−1 νOH can be attributed to the interlayer water with a variety of orientations and interactions [32,33,34]. The peak area value in peak 1 between Mt and G-Mt is similar, which might exclude the interference of water. However, νOH and δOH, belonging to the structural hydroxyl of G-Mt at 3000–4000 cm−1, increases about twice as much as for Mt.
Figure 5 presents the TG-DSC curves of Mt and G-Mt. It can be seen from Figure 5 that the decomposition process of Mt begins at 70 °C and ends at 250 °C. The mass loss is 12.17%, which is attributed to the loss of intercalated moisture [19]. From 250 to 800 °C, the TG curve of Mt becomes steady and shows little change with further increases in temperature. In addition, a small endothermic peak of the Mt DSC curve from 250 to 800 °C, with a mass loss of 4.15%, can be observed, which could be attributed to the removal of -OH from the crystal structure of Mt [35]. For the TG curve of G-Mt, a large gradual mass loss of 5.63% occurs after 250 °C, and the total weight loss (Table 2) of G-Mt is larger than that of Mt, but the total endothermic quantity of G-Mt is smaller. The reason for the smaller endothermic quantity of G-Mt can be attributed to the closely distributed hydroxyl groups on the surface of G-Mt, which can form H-bonded hydroxyl groups that are gradually removed at high temperatures [8,35].

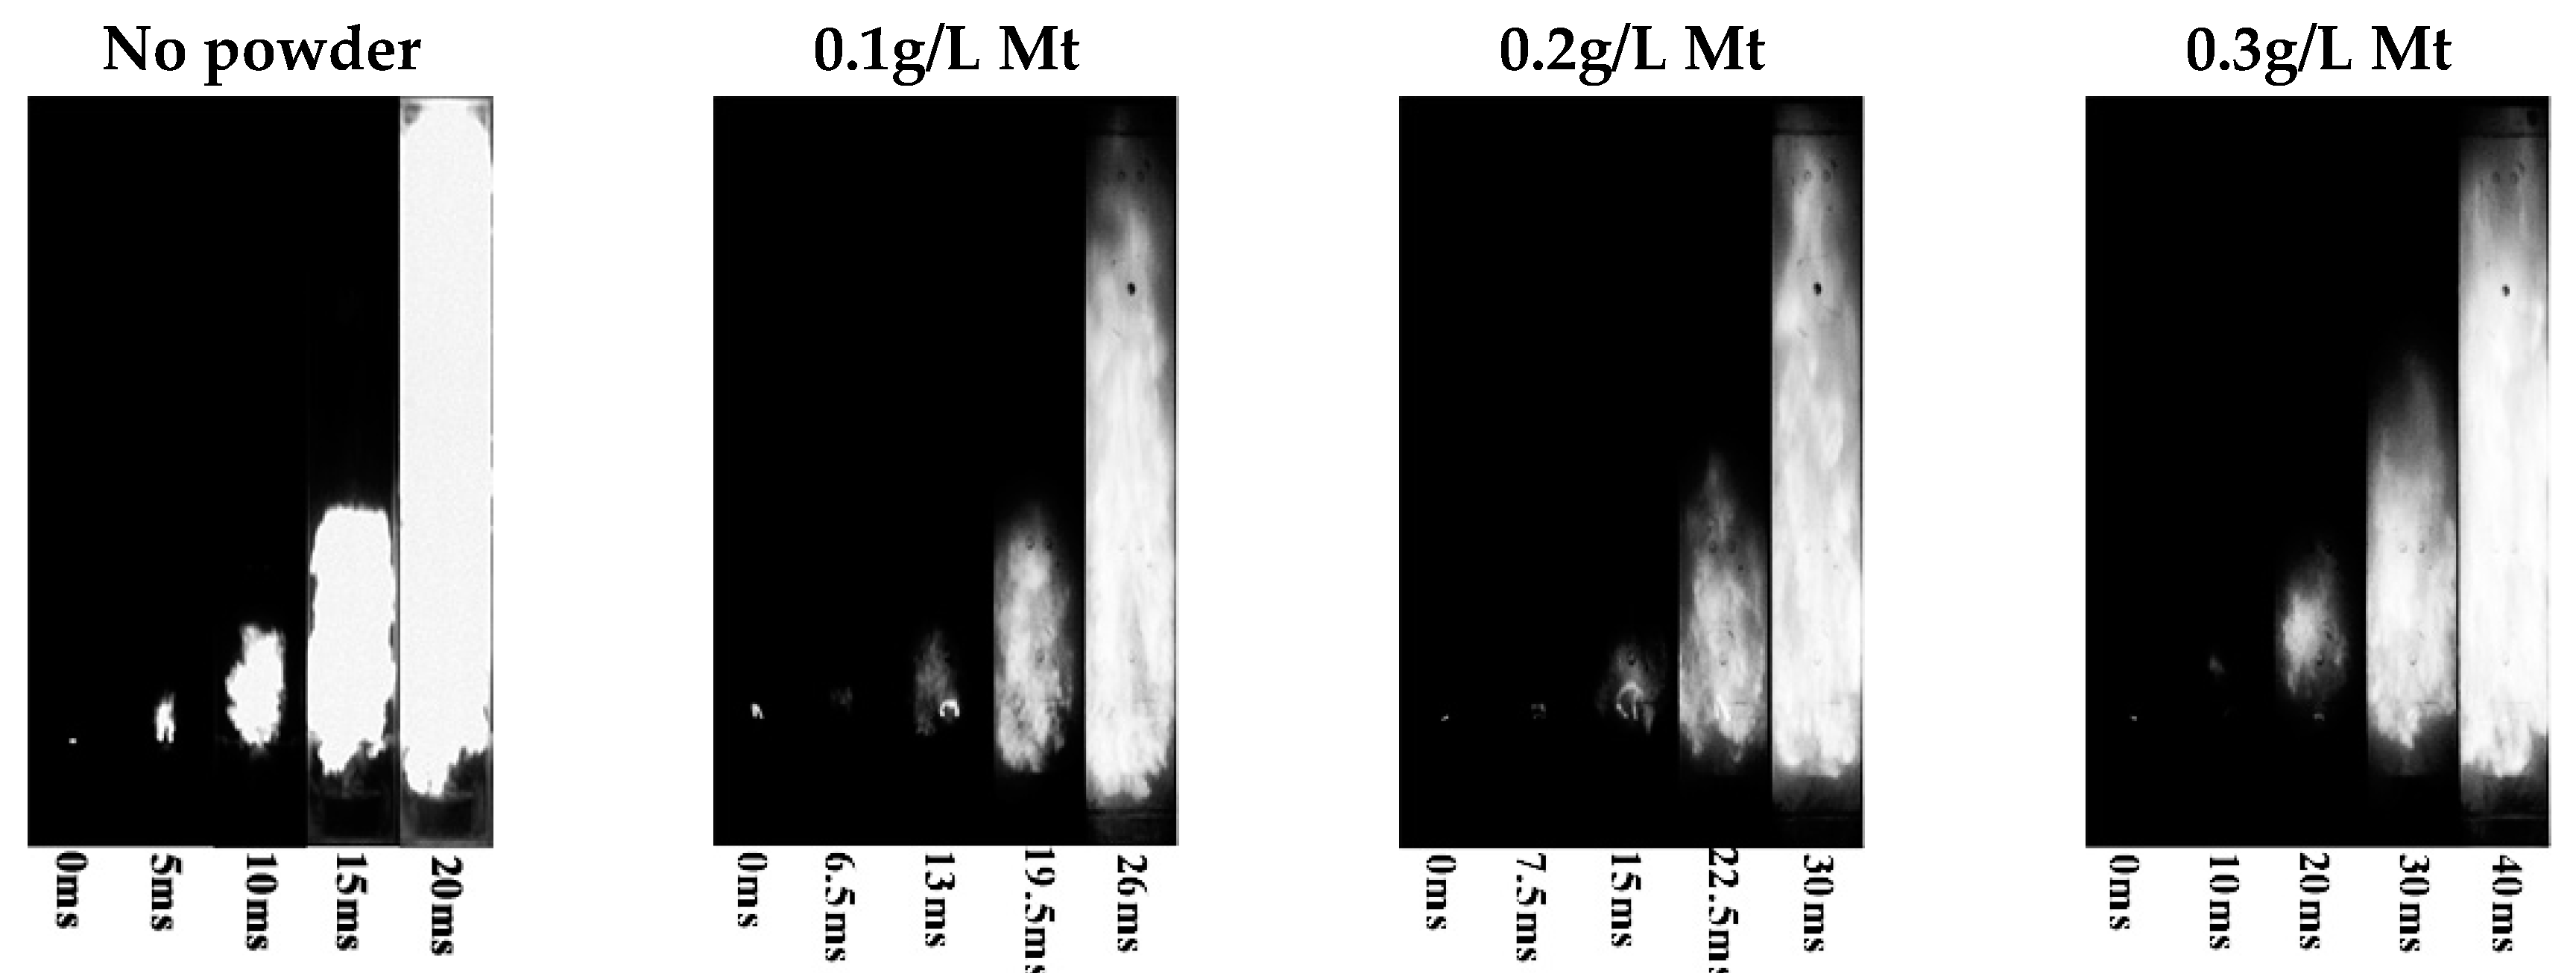
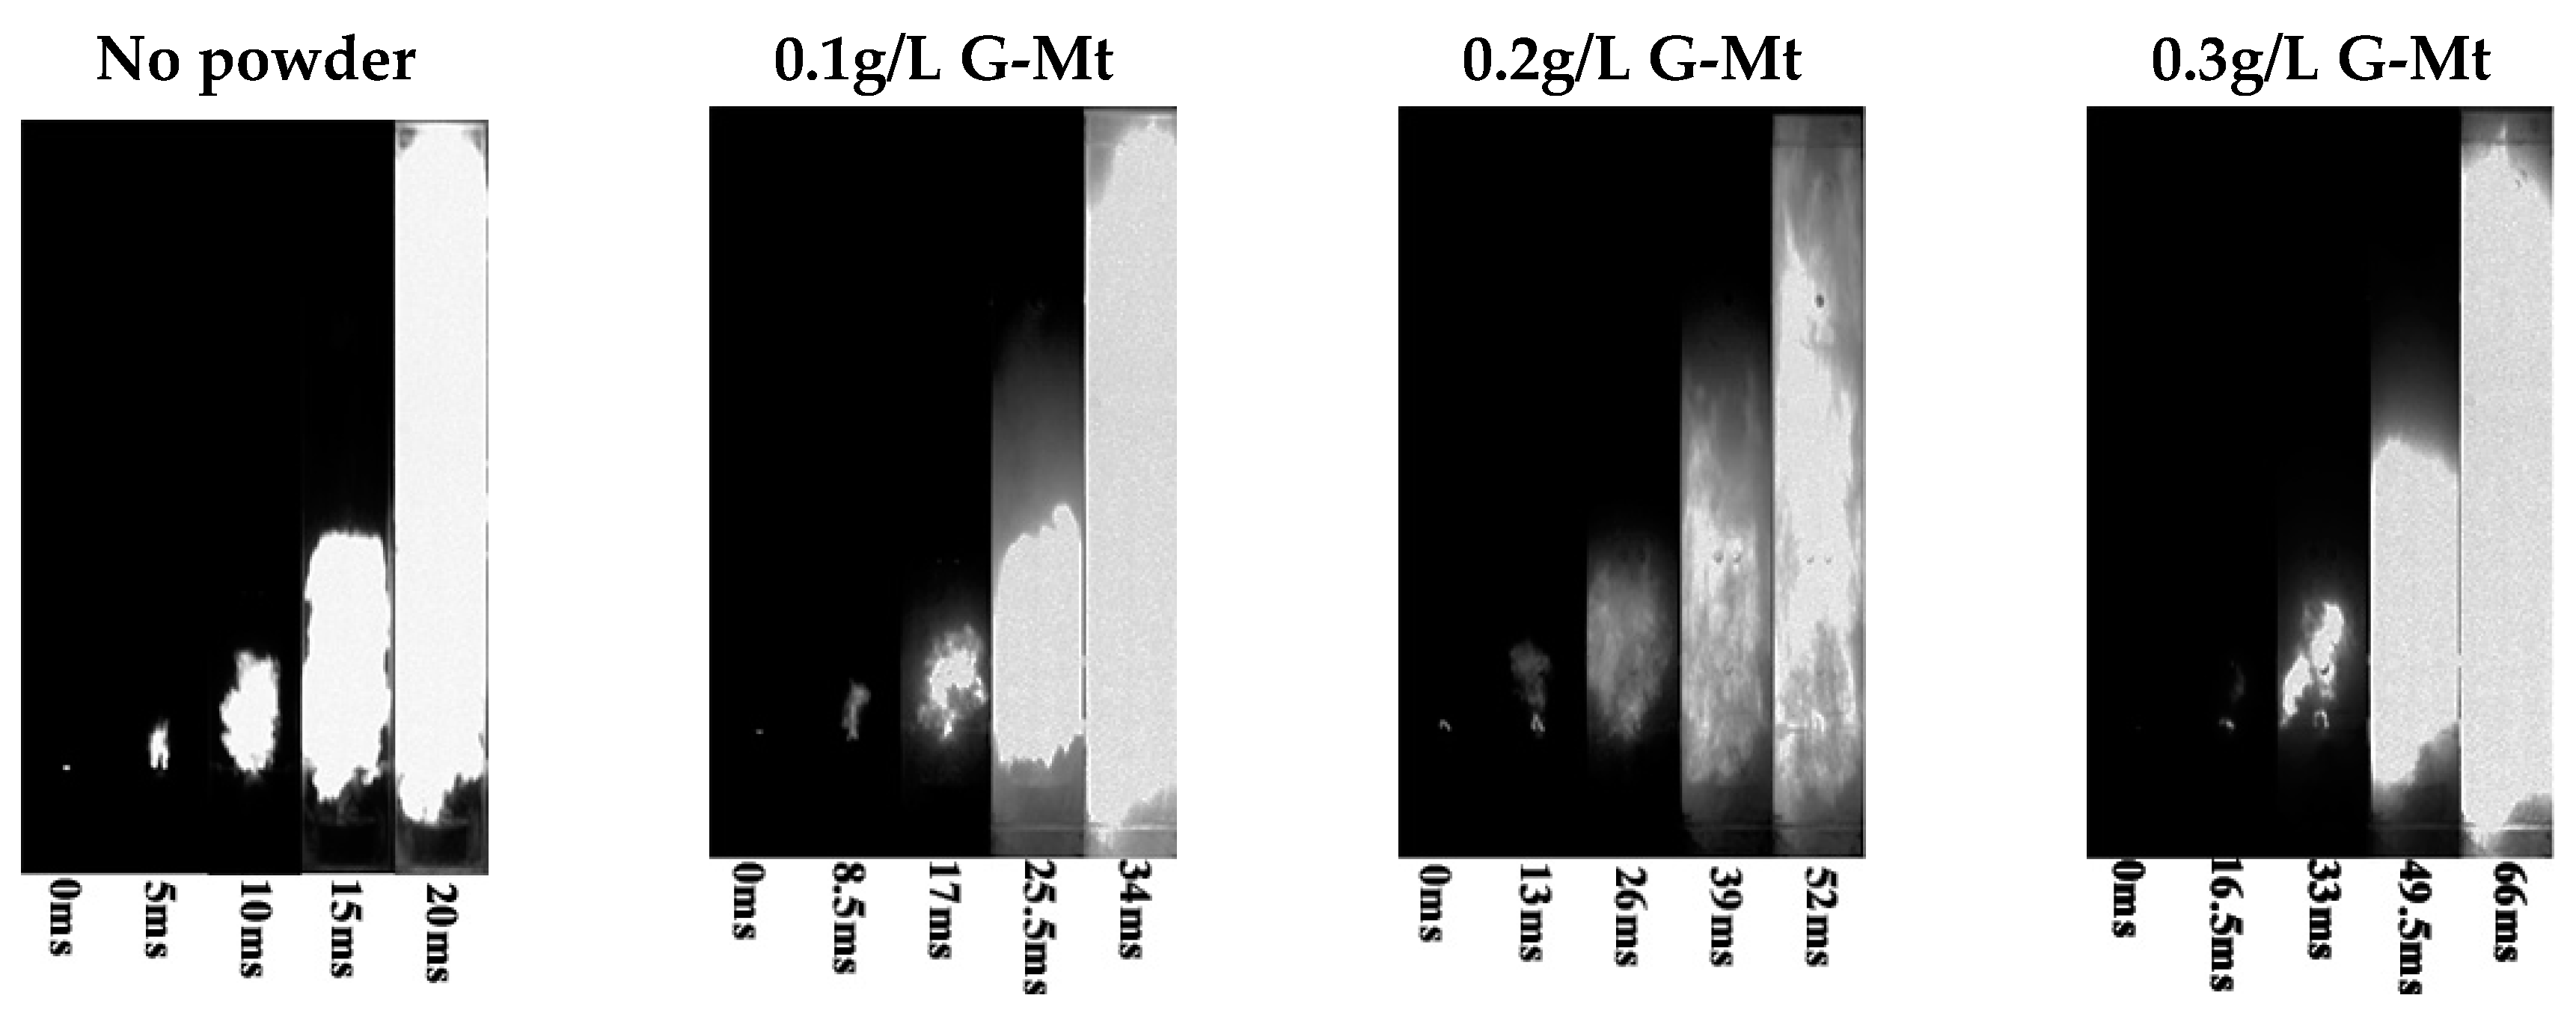
3.2. Suppression Effect of Mt and G-Mt

The explosion pressure parameters were tested in a 20 L spherical vessel. The effects of Mt and G-Mt on the 9.5% methane explosion are presented in Figure 6. As can be seen from Figure 6a,b, both the maximum explosion pressure (Pmax) and the maximum rate of explosion pressure rise ([dP/dt]max) decrease after the addition of Mt or G-Mt. Meanwhile, the time for the pressure to reach a maximum value (Tmax) obviously increases, as shown in Figure 6c. On increasing the concentration of Mt or G-Mt, both Pmax and [dP/dt]max decrease and Tmax increases. However, on further increasing the concentration of Mt or G-Mt, Pmax and [dP/dt]max no longer decrease and Tmax no longer increases, indicating that an optimal inhibitory effect concentration of Mt or G-Mt exists. According to Figure 6a–c, it can be found that the optimal concentration is about 0.25 g·L−1. Furthermore, comparing the results of Pmax, [dP/dt]max, and Tmax, the inhibitory effect of G-Mt is more significant than Mt with the addition of the same mass concentration powders.
In order to compare the suppression effect of Mt or G-Mt more clearly, the explosion pressure curves of the 9.5% methane mixed with Mt and G-Mt, respectively, with a concentration of 0.25 g·L−1, are shown in Figure 6d. It can be seen that the methane explosion could be divided into two main stages. The first is the pressure increase stage, in which the pressure increases rapidly with time. The heat released from combustion exceeds the heat lost to the surroundings. The second stage is the pressure decay process [10]. For 9.5% methane, the Pmax, [dP/dt]max and Tmax are 0.654 MPa, 87.648 MPa/s and 0.138 s, respectively, as shown in Table 3. As the G-Mt with a concentration of 0.25 g·L−1 is added, the Pmax and [dP/dt]max decrease by 26.7% and 74.63% respectively, and Tmax increases by 55.8%. For Mt, these percentage values are 11.6%, 50.77%, and 50.74% respectively, which are much lower than those of G-Mt. Thus, the inhibition effect of G-Mt is much better than that of Mt.
The flame propagation characteristics of ma ethane explosion with inhibitors are also important evaluation parameters. Hence, experiments were performed in the 5 L pipeline experimental system. The flame propagation images of the methane explosions with no powder, Mt and G-Mt are shown in Figure 7. It can be seen that the flame front of the methane explosion with no powder reaches the upper end 20 ms after ignition. However, when Mt or G-Mt are added, the explosion flame darkens and slows down. Simultaneously, an uneven flame structure appears, which can be attributed to the nonuniformity of the dust dispersion or dust particle fragmentation. Figure 8a,b presents the variation in the flame front position (FFP) for the 9.5% methane explosion with different concentrations of Mt and G-Mt, respectively. As can be seen from Figure 8a, the time to the upper end of the methane explosion flame (Te) gradually lengthens when Mt with the concentrations of 0.05 to 0.25 g·L−1 being added, and Te is prolonged from 20 ms to 42.5 ms with the addition of 0.25 g·L−1 Mt (Figure 9). However, with further increases in the concentration of Mt, once more, the flame propagates quickly in Figure 8b, and the Te of G-Mt with different concentrations shows a similar trend of initially increasing and then decreasing with Te being prolonged from 20 ms to 68.5 ms with the addition 0.25 g·L−1 G-Mt (Figure 9). Thus, 0.25 g·L−1 might still be the optimal inhibitory effect concentration for Mt or G-Mt in the 5 L pipeline experimental system.
Figure 10a shows the FFP of the 9.5% methane explosion with Mt and G-Mt at the concentration of 0.25 g·L−1. Compared with the methane explosion with no powder, the Te value of the 9.5% methane explosion with 0.25 g·L−1 Mt and 0.25 g·L−1 G-Mt is noticeably delayed, by 112.5% and 242.5%, respectively. The flame propagation velocities (FPV) of the methane explosions with no powder, 0.25 g·L−1 Mt, and 0.25 g·L−1 G-Mt are shown in Figure 10b. The FPV of methane explosion with no powder shows the trend of initial acceleration followed by a steady propagation that may be due to the reflected explosion wave [36,37]. The value of FPV significantly decreases with the addition of 0.25 g·L−1 Mt or 0.25 g·L−1 G-Mt. Furthermore, the FPV curve of G-Mt with the same concentration is below that of Mt, indicating that the suppression property of G-Mt is better than Mt. These test results are consistent with those obtained in the 20 L spherical explosive device.

3.3. Suppression Mechanism of Mt and G-Mt

From the experimental results, the methane explosion suppression mechanism can be attributed to the combined efforts of physical and chemical inhibition effects.

3.3.1. Physical Inhibition Effect

On the one hand, the evaporation of surface and interlayer water of Mt or G-Mt can absorb the amount of heat released from the explosion reaction to cool the system down and inhibit the propagation of the explosion wave [2].
On the other hand, the inhibitor powders, which are widely dispersed in the reaction zone, can reduce the thermal diffusion coefficient of the unburnt gas as well as the heat transfer from the reaction zone to the unburnt zone by blocking and absorbing the heat radiation.

3.3.2. Chemical Inhibition Effect

Many studies have shown that there are 325 elementary reactions, involving 53 species, which occur in the process of a methane explosion [38,39]. The chain reactions are dominated by free radicals (especially ∙O, H∙, ∙HO2, ∙CH3, ∙HCO, and ∙OH) during the chemical reaction. Montmorillonite modified by gluconic acid alters the smectite layers and increases the specific surface area and porosity, which improves the probability of collisions between the surface hydroxyls of Mt or G-Mt and the active radicals. Therefore, the ∙O, H∙, and ∙OH, et al., of the methane explosion may be eliminated by the surface hydroxyls of Mt or G-Mt [40,41]. Furthermore, the metal ions such as Ca2+, Mg2+, Al3+ which are generated during the heat dehydration process of Mt or G-Mt can react with the above free radicals [42,43]. The related reactions are as follows:
M+ + OH∙→ M(OH)
M(OH) + OH∙→ MO + H2O
MO + O∙→ M + O2
Furthermore, some of the key reactions play an important role in the methane explosion, such as Equations (4)–(7), et al. [14,17]. Nie confirmed that the formation of free radicals (∙O, H∙, and ∙OH) was mostly sensitive to the forward reaction of Equation (6) and the reverse reaction of Equation (7) [14]. Therefore, when Mt or G-Mt are added into the methane explosion, a large number of hydroxyl radicals may be produced in the instantaneous high temperature, and these hydroxyl radicals can reverse the direction of the key reactions of Equation (6) and Equation (7) that promote the explosion:
O2 + CH2O ⇌ HO2 + HCO∙
CH3∙ + O2 ⇌ O∙ + CH3O∙
CH3∙ + O2 ⇌ OH∙ + CH2O
2CH3∙ + (M) ⇌ C2H6 + (M)
According to the TG-DSC curves, the total endothermic quantities of Mt and G-Mt are 1143 J/g and 570.3 J/g, respectively. The average particle size of G-Mt is obviously larger than Mt, but G-Mt presents a better explosion suppression efficiency than Mt. These results prove that more hydroxyl groups of G-Mt exert a better chemical inhibition effect in the methane explosion.

4. Conclusions

In this work, clean, nontoxic and low-cost inhibitors, with polyhydroxy functional groups modified by gluconic acid, were obtained through a simple stirring method. Montmorillonite powders modified by gluconic acid had a better explosion suppression capability than the pure montmorillonite powders. When G-Mt was used as a methane explosion suppression powder material, the maximum explosion pressure reduced by 26.7%, the maximum rate of pressure rise declined by 74.63%, and the time of the flame front reaching the top of the pipe was delayed significantly. Based on the characterization analysis of the powders and the results of methane explosion suppression, it was found that the hydroxyl functional groups on the surface of Mt and G-Mt present a positive inhibitory effect. However, the exact mechanism of their action is still unclear. Hence, more work is needed to fundamentally understand the hydroxyl functional groups’ response to the methane explosion and to complement the experimental results with molecular reaction simulations. In general, this work has some guiding potential for the development and preparation of new explosion inhibitors.

Author Contributions

Y.W., W.J. and L.Z. conceived and designed the experiments; H.F., Y.Z. and C.L. performed the experiments and analyzed the data; and W.J. and X.H. managed all the experimental and writing process as the corresponding authors. All authors discussed the results and commented on the manuscript.

Funding

This research was funded by the National Natural Science Foundation of China (51874120, 51504083, 51674104, 51904094), Program for Science & Technology Innovation Talents in Universities of Henan Province (19HASTIT042), the Research Foundation for Youth Scholars of Higher Education of Henan Province (2017GGJS053), the Fundamental Research Funds for the Universities of Henan Province (NSFRF1606), Program for Innovative Research Team in University of Ministry of Education of China (IRT_16R22), Program for Innovative Research Team of Henan Polytechnic University (T2018-2), Foundation for Distinguished Young Scientists of Henan Polytechnic University (J2017-3).

Conflicts of Interest

The authors declare no conflicts of interest.

References

  1. Bianchini, A.; Guzzini, A.; Pellegrini, M.; Saccani, C. Natural gas distribution system: A statistical analysis of accidents data. Int. J. Press. Vessels Pip. 2018, 168, 24–38. [Google Scholar] [CrossRef]
  2. Cao, X.Y.; Ren, J.; Bi, M.S.; Zhou, Y.; Wang, Q. Experimental research on methane/air explosion inhibition using ultrafine water mist containing additive. J. Loss. Prev. Process Ind. 2016, 43, 352–360. [Google Scholar] [CrossRef]
  3. Wang, Z.R.; Ni, L.; Liu, X.; Jiang, J.C.; Wang, R. Effects of N2/CO2 on explosion characteristics of methane and air mixture. J. Loss. Prev. Process Ind. 2014, 31, 10–15. [Google Scholar] [CrossRef]
  4. Krasnyansky, M. Prevention and suppression of explosions in gas-air and dust-air mixtures using powder aerosol-inhibitor. J. Loss. Prev. Process Ind. 2006, 19, 729–735. [Google Scholar] [CrossRef]
  5. Luo, Z.; Wang, T.; Tian, Z.; Cheng, F.; Deng, J.; Zhang, Y. Experimental study on the suppression of gas explosion using the gas-solid suppressant of CO2/ABC powder. J. Loss. Prev. Process Ind. 2014, 30, 17–23. [Google Scholar] [CrossRef]
  6. Di Benedetto, A.; Cammarota, F.; Di Sarli, V.; Salzano, E.; Russo, G. Effect of diluents on rapid phase transition of water induced by combustion. AIChE J. 2012, 58, 2810–2819. [Google Scholar] [CrossRef]
  7. Luo, Z.M.; Cheng, F.M.; Wang, T.; Deng, J.; Shu, C.M. Suppressive Effects of Silicon Dioxide and Diatomite Powder Aerosols on Coal Mine Gas Explosions in Highlands. Aerosol. Air Qual. Res. 2016, 16, 2119–2128. [Google Scholar] [CrossRef] [Green Version]
  8. Liu, Q.; Hu, Y.; Bai, C.; Chen, M. Methane/coal dust/air explosions and their suppression by solid particle suppressing agents in a large-scale experimental tube. J. Loss. Prev. Process Ind. 2013, 26, 310–316. [Google Scholar] [CrossRef]
  9. Zhang, Y.; Wang, Y.; Zheng, L.; Yang, T.; Gao, J.; Li, Z. Effect of Pristine Palygorskite Powders on Explosion Characteristics of Methane-Air Premixed Gas. Energies 2018, 11, 12. [Google Scholar] [CrossRef]
  10. Sun, Y.; Yuan, B.; Chen, X.; Li, K.; Wang, L.; Yun, Y.; Fan, A. Suppression of methane/air explosion by kaolinite-based multi-component inhibitor. Powder Technol. 2019, 343, 279–286. [Google Scholar] [CrossRef]
  11. Ni, X.; Wang, X.; Zhang, S.; Zhao, M. Experimental study on the performance of transition metal ions modified zeolite particles in suppressing methane/air coflowing flame on cup burner. J. Fire Sci. 2014, 32, 417–430. [Google Scholar] [CrossRef]
  12. Wang, Y.; Cheng, Y.S.; Yu, M.G.; Li, Y.; Cao, J.L.; Zheng, L.G.; Yi, H.W. Methane explosion suppression characteristics based on the NaHCO3/red-mud composite powders with core-shell structure. J. Hazard. Mater. 2017, 335, 84–91. [Google Scholar] [CrossRef] [PubMed]
  13. Hu, Y.; Liu, H.Q.; Zong, R.W.; Lo, S.M. Study of a New Type of Fire Suppressant Powder of Mg(OH)2 Modified by DOPO-VTS. Procedia Eng. 2018, 211, 1102–1110. [Google Scholar] [CrossRef]
  14. Nie, B.; Yang, L.; Ge, B.; Wang, J.; Li, X. Chemical kinetic characteristics of methane/air mixture explosion and its affecting factors. J. Loss. Prev. Process Ind. 2017, 49, 675–682. [Google Scholar] [CrossRef]
  15. Zhang, R.M.; Nie, B.S.; He, X.Q.; Wang, C.; Zhao, C.H.; Dai, L.C.; Li, H.L. Different gas explosion mechanisms and explosion suppression techniques. Procedia Eng. 2011, 26, 1467–1472. [Google Scholar]
  16. De Leo, M.; Saveliev, A.; Kennedy, L.A.; Zelepouga, S.A. OH and CH luminescence in opposed flow methane oxy-flames. Combust. Flame 2007, 149, 435–447. [Google Scholar] [CrossRef]
  17. He, Z.; Li, X.B.; Liu, L.M.; Zhu, W. The intrinsic mechanism of methane oxidation under explosion condition: A combined ReaxFF and DFT study. Fuel 2014, 124, 85–90. [Google Scholar] [CrossRef]
  18. Tang, Y.; Zhuo, J.; Cui, W.; Li, S.; Yao, Q. Enhancing ignition and inhibiting extinction of methane diffusion flame by in situ fuel processing using dielectric-barrier-discharge plasma. Fuel Process. Technol. 2019, 194, 106–128. [Google Scholar] [CrossRef]
  19. Bee, S.L.; Abdullah, M.A.A.; Bee, S.-T.; Sin, L.T.; Rahmat, A.R. Polymer nanocomposites based on silylated-montmorillonite: A. review. Prog. Polym. Sci. 2018, 85, 57–82. [Google Scholar] [CrossRef]
  20. Tang, Y.B.; Wang, H. Development of a novel bentonite–acrylamide superabsorbent hydrogel for extinguishing gangue fire hazard. Powder Technol. 2018, 323, 486–494. [Google Scholar] [CrossRef]
  21. Komadel, P. Acid activated clays: Materials in continuous demand. Appl. Clay Sci. 2016, 131, 84–99. [Google Scholar] [CrossRef]
  22. Di Benedetto, A.; Russo, P.; Sanchirico, R.; Di Sarli, V. CFD simulations of turbulent fluid flow and dust dispersion in the 20 L explosion vessel. AIChE J. 2013, 59, 2485–2496. [Google Scholar] [CrossRef]
  23. Sanchirico, R.; Di Sarli, V.; Russo, P.; Di Benedetto, A. Effect of the nozzle type on the integrity of dust particles in standard explosion tests. Powder Technol. 2015, 279, 203–208. [Google Scholar] [CrossRef]
  24. Peng, K.; Fu, L.; Li, X.; Ouyang, J.; Yang, H. Stearic acid modified montmorillonite as emerging microcapsules for thermal energy storage. Appl. Clay Sci. 2017, 138, 100–106. [Google Scholar] [CrossRef]
  25. Cipolletti, V.; Galimberti, M.; Mauro, M.; Guerra, G. Organoclays with hexagonal rotator order for the paraffinic chains of the compensating cation. Implications on the structure of clay polymer nanocomposites. Appl. Clay Sci. 2014, 87, 178–188. [Google Scholar] [CrossRef]
  26. Onal, M.; Sankaya, Y. Preparation and characterization of acid-activated bentonite powders. Powder Technol. 2007, 172, 14–18. [Google Scholar] [CrossRef]
  27. Liu, H.; Yuan, P.; Qin, Z.; Liu, D.; Tan, D.; Zhu, J.; He, H. Thermal degradation of organicmatter in the interlayer clay–organic complex: A TG-FTIR study on a montmorillonite/12-aminolauric acid system. Appl. Clay Sci. 2013, 80, 398–406. [Google Scholar] [CrossRef]
  28. Takenawa, R.; Komori, Y.; Hayashi, S.; Kawamata, J.; Kuroda, K. Intercalation of nitroanilines into kaolinite and second harmonic generation. Chem. Mater. 2001, 13, 3741–3746. [Google Scholar] [CrossRef]
  29. Li, X.; Ouyang, J.; Zhou, Y.; Yang, H. Assembling strategy to synthesize palladium modified kaolin nanocomposites with different morphologies. Sci. Rep. 2015, 5, 13763. [Google Scholar] [CrossRef] [Green Version]
  30. Li, J.; Li, Z.; Yang, Y.; Kong, B.; Wang, C. Laboratory study on the inhibitory effect of free radical scavenger on coal spontaneous combustion. Fuel Process. Technol. 2018, 171, 350–360. [Google Scholar] [CrossRef]
  31. Li, Q.Z.; Lin, B.Q.; Zhao, C.S.; Wu, W.F. Chemical Structure Analysis of Coal Char Surface Based on Fourier-Transform Infrared Spectrometer. Proc. CSEE 2011, 31, 46–52. [Google Scholar]
  32. Li, X.; Yang, H. Pd hybridizing ZnO/kaolinite nanocomposites: Synthesis, microstructure, and enhanced photocatalytic property. Appl. Clay Sci. 2014, 100, 43–49. [Google Scholar] [CrossRef]
  33. Klinowski, J.; Thomas, J.M.; Fyfe, C.A. A highly siliceous structural analog of zeolite Y: high-resolution solid-state silicon-29 and aluminum-27 NMR studies. Inog. Chem. 1983, 22, 63–66. [Google Scholar] [CrossRef]
  34. Kentgens, A.P.M.; Lemmens, J.J.M.; Geurts, F.M. Two-dimensional solid-state nutation NMR of half-integer quadrupolar nuclei. J. Magn. Reson. 1987, 71, 62–74. [Google Scholar]
  35. Yuan, P.; Wu, D.Q.; Lin, Z.Y.; Diao, G.Y.; Peng, J.L.; Wei, J.F. Study on the Surface Hydroxyl Species of Diatomite using DRIFT Spectroscopy. Spectrosc. Spect Anal. 2001, 21, 783–786. [Google Scholar]
  36. Zheng, L.; Li, G.; Wang, Y.; Zhu, X.; Pan, R.; Wang, Y. Effect of blockage ratios on the characteristics of methane/air explosion suppressed by BC powder. J. Hazard. Mater. 2018, 355, 25–33. [Google Scholar] [CrossRef]
  37. Li, Q.Z.; Lin, B.Q.; Jian, C.G. Investigation on the Interactions of Gas Explosion Flame and Reflected Pressure Waves in Closed Pipes. Combust. Sci. Technol. 2012, 184, 2154–2162. [Google Scholar] [CrossRef]
  38. Simmie, J.M. Detailed chemical kinetic models for the combustion of hydrocarbon fuels. Prog. Energy Combust. Sci. 2003, 29, 599–634. [Google Scholar] [CrossRef]
  39. Smith, G.P.; Golden, D.M.; Frenklach, M.; Moriarty, N.W.; Eiteneer, B.; Goldenberg, M.; Bowman, C.T.; Hanson, R.K.; Song, S.; Gardiner, W.C.; et al. GRI-Mech 3.0. Available online: http://combustion.berkeley.edu/gri-mech/version30/text30.html (accessed on 22 October 2019).
  40. Guo, Z.; Xing, R.; Liu, S.; Yu, H.; Wang, P.; Li, C.; Li, P. The synthesis and antioxidant activity of the Schiff bases of chitosan and carboxymethyl chitosan. Bioorg. Med. Chem. Lett. 2005, 15, 4600–4603. [Google Scholar] [CrossRef]
  41. Wang, J.; Hu, S.; Nie, S.; Yu, Q.; Xie, M. Reviews on Mechanisms of In Vitro Antioxidant Activity of Polysaccharides. Oxid. Med. Cell. Longev. 2016, 2016. [Google Scholar] [CrossRef]
  42. Krasnyansky, M. Studies of fundamental physical-chemical mechanisms and processes of flame extinguishing by powder aerosols. Fire Mater. 2008, 32, 27–47. [Google Scholar] [CrossRef]
  43. Ni, X.; Chow, W.K.; Li, Q.; Tao, C. Experimental study of new gas-solid composite particles in extinguishing cooking oil fires. J. Fire Sci. 2010, 29, 152–176. [Google Scholar]
Figure 1. XRD patterns of Mt and G-Mt.
Energies 12 04068 g001
Figure 2. Particle size distributions 9 (PSD) of Mt (a) and G-Mt (b).
Energies 12 04068 g002
Figure 3. Fourier transform infrared (FTIR) spectrum of Mt and G-Mt.
Energies 12 04068 g003
Figure 4. Curve-fitted FTIR spectrum of the 3000–4000 cm−1 bands for Mt and G-Mt.
Energies 12 04068 g004
Figure 5. Thermogravimetry–differential scanning calorimetry (TG-DSC) curves of Mt and G-Mt.
Energies 12 04068 g005
Figure 6. The inhibition effect of Mt and G-Mt at different concentrations: the maximum pressure peak (a), the maximum rate of pressure rise (b), the time of the pressure peak arrival (c), the explosion pressure curves (d).
Energies 12 04068 g006
Figure 7. The flame propagation images of the 9.5% methane–air premixed gas explosion with different concentrations of inhibitors.
Energies 12 04068 g007aEnergies 12 04068 g007b
Figure 8. The inhibition effect of Mt and G-Mt: the flame front position (FFP) with Mt (a) and G-Mt (b).
Energies 12 04068 g008
Figure 9. The flame propagation images of the 9.5% methane–air premixed gas explosion: no powder (a), 0.25g/L Mt (b), 0.25g/L G-Mt (c).
Energies 12 04068 g009
Figure 10. The inhibition effect of Mt and G-Mt: comparison of 0.25g/L Mt and 0.25g/L G-Mt (a), the flame propagation velocities (FPV) with 0.25g/L of Mt and G-Mt (b).
Energies 12 04068 g010
Table 1. The hydroxyl peak fitting area of Mt and G-Mt.
SamplePeak 1Peak 2Peak 3
Mt6.2496.457.62
G-Mt8.74184.2910.15
Table 2. The TG-DSC parameters of Mt and G-Mt.
SampleTotal Weight Loss (%)Total Endothermic Quantity (J·g−1)
Mt16.321143
G-Mt19.66570.30
Table 3. The explosion parameters of CH4–air premixed gas with Mt and G-Mt.
SampleConcentration
(g·L−1)
Maximum Pressure
(MPa)
Time of Pressure Peak (s)Rate of Maximum-Pressure Rise (MPa·s−1)
No powders00.6540.13887.648
Mt0.250.5780.18343.144
G-Mt0.250.4790.21522.235

