Article

Distribution Network Model Platform: A First Case Study

by
Mirna Grzanic
1,2,*,
Marco Giacomo Flammini
1,3 and
Giuseppe Prettico
1
1
European Commission, Joint Research Centre (JRC), Directorate of Energy, Transport and Climate, Energy Security, Distribution and Markets Unit, via E. Fermi 2749, I-21027 Ispra (VA), Italy
2
Faculty of Electrical Engineering and Computing, University of Zagreb, 10 000 Zagreb, Croatia
3
Dipartimento Energia “Galileo Ferraris”, Politecnico di Torino, corso Duca degli Abruzzi 24, 10129 Torino, Italy
*
Author to whom correspondence should be addressed.
Energies 2019, 12(21), 4079; https://doi.org/10.3390/en12214079
Submission received: 18 September 2019 / Revised: 23 October 2019 / Accepted: 24 October 2019 / Published: 25 October 2019
(This article belongs to the Section F: Electrical Engineering)

Abstract

:
Decarbonisation policies have recently seen an uncontrolled increase in local electricity production from renewable energy sources (RES) at distribution level. As a consequence, bidirectional power flows might cause high voltage/ medium voltage (HV/MV) transformers to overload. Additionally, not-well-planned installation of electric vehicle (EV) charging stations could provoke voltage deviations and cables overloading during peak times. To ensure secure and reliable distribution network operations, technology integration requires careful analysis which is based on realistic distribution grid models (DGM). Currently, however, only not geo-referenced synthetic grids are available inliterature. This fact unfortunately represents a big limitation. In order to overcome this knowledge gap, we developed a distribution network model (DiNeMo) web-platform aiming at reproducing the DGM of a given area of interest. DiNeMo is based on metrics and indicators collected from 99 unbundled distribution system operators (DSOs) in Europe. In this work we firstly perform a validation exercise on two DGMs of the city of Varaždin in Croatia. To this aim, a set of indicators from the DGMs and from the real networks are compared. The DGMs are later used for a power flow analysis which focuses on voltage fluctuations, line losses, and lines loading considering different levels of EV charging stations penetration.

1. Introduction

Energy transition policies are aimed at increasing energy efficiency and effectively integrating renewable energy sources (RES) into the power system [1]. Consequently, a rising number of intermittent RES and of electric vehicle (EV) charging station installations may induce voltage deviations and high voltage/ medium voltage (HV/MV) transformers overloading. This fact poses challenges for the correct operation and management of distribution networks. To transform these treats into the opportunity to have more efficient distribution networks, it is required to focus on accurate grid analyses in the planning stage of RES and of EV charging stations installation. An important barrier to these kinds of analyses is posed by the confidentiality of network data or in certain cases by the absence of them, especially with respect to low voltage levels. To overcome this issue, power engineers have worked on the creation of synthetic representative networks serving as a case study for distribution network planning and analyses. A mayor problem with synthetic network models is that a validation process is needed in order to show that they are a realistic representation of a specific area of interest.
In literature several works have focused on creating realistic reference networks and validation methodology. A non-exhaustive list follows. A synthetic MV test grid in [2] was modeled to demonstrate the impact of distributed power generation on the grid using the tool called Smart Grid Metric. Urban and rural networks were modeled differently because of insufficient data for rural grids. Two types of rural area were built using Google Earth and statistics report for load density: large area with low population and small area with high population with a remark that no load is located outside the residential area. To investigate the impact of distributed energy resources (DER) penetration on MV network in [3], urban, rural, and industrial area are modeled based on combining a variable number of the typical representative feeders. Additionally, an economic analysis is performed through providing ancillary services at several market models. Three market frameworks were presented: flexibility bids offered directly from DER, or coupled and represented by distribution system operator (DSO) or aggregator. A statistical tool has been developed in [4] for generating representative distribution networks. Firstly, technical and geographical grid data were collected and different metrics have been investigated. Secondly, the purpose of the grid analysis needed to be identified in order to successfully select the best method for network generation. Finally, the validation was performed through comparing the performance of real grids and generated networks. The authors in [5] used metric-based validation process to demonstrate that public test cases meet the criteria of actual power system data. Metrics used in the paper are divided into two groups: metrics of system proportions including number of buses per substation, voltage levels, load at each bus, capacities of generators, etc., while proportions metrics of system network describe lines parameters and topology, as well as transformers characteristics.
The work in [6] describes a methodology for generating synthetic network based on validation metrics from real power system data. Metrics satisfy line topology and geographic intersection, connectivity, Delaunay triangulation overlap, AC power flow convergence and minimum spanning tree of the substations. A large-scale 2000-bus synthetic network with generator dynamics in [7] is modeled and validated with three transient stability metrics showing that results of dynamic response and satisfaction of transient stability networks are similar to real system networks. Synthetic network in [8] was generated according to network imitating method based on learning (NIMBLE). The network was tested against failures in the grid emphasizing the importance of line and buses spatial location which can be obtained using proposed algorithm resulting in similar structure comparing to real grid. To demonstrate the similarity of optimal power flow in synthetic grids comparing to the real ones in [9], the synthetic grids were modeled based on topology, generation, and load data with decomposing techniques Alternating direction method of multipliers and evolutionary algorithm. In order to carry out different types of analysis, additional grid modification could be done in post-processing, such as shunt element placement and generator contingency. Building synthetic networks in [10] is based on cost minimization of electricity supply and improving network reliability and quality of supply in two steps imitating the historical evolution of power grids using topological metrics such as clustering coefficient, shortest-path length, betweenness centrality, and degree distribution. On the other hand, in [11] clusters representing typical feeders in distribution grid were modeled as reference networks in order to solve strategic decision-making problem in terms of optimal investments in the grid. Work in [12] describes a method for quantifying the efficiency of curtailment schemes using synthetic distribution grid models and Monte Carlo simulations performing sensitivity analyses with different parameters variations. The authors in [13] use data set from a DSO in the Netherlands to build realistic medium voltage feeders. The research in [14] considers joint simulation environment using a top-down modeling approach with either installed distribution grid load or a synthetic distribution grid replication. Synthetic distribution grid in Singapore [15] was modeled based on power system planning optimization taking into account AC power flow to ensure the grid constraints were not violated. Results show that that built reference network is very similar to the real one.
The work in [16] models reference networks on high, medium, and low voltage level based on geographical data extracted from Open Street Map using traveling salesman problem (TSP) algorithm which results in minimum line length and minimal cost. Our platform uses additional input parameters collected from DSOs supplying different areas around Europe. Moreover, our model considers input data from end-user for specific area of interest which are publicly available from population census (population density, number of consumers per building, etc.) A two-step approach builds the entire medium voltage network in Germany [17]. First, only load is considered for network topology aiming at minimizing circuit length. Second, renewable power plants and additional loads are connected to the grid resulting in cost-optimized medium voltage distribution network in Germany. Unlike the described paper which builds the network in the entire country, our model is focused on a small area of interest, but can be extracted from Open Street Map anywhere in Europe.
To demonstrate the impact of distributed generation on distribution network cost in [18], reference networks were built based on a greenfield and expansion-planning approaches using heuristic planning algorithms and geographic information system (GIS). Consumers are classified in five categories and cities/towns are identified. Networks are modeled taking into account geographical constraints, distinguishing HV grids built based on N-1 criterion, and MV and LV networks built as radial grids. The impact of different levels of plug-in electric vehicles (PEVs) penetration in [19] was modeled on two-large scale distribution reference networks. The results show the increase of energy losses and higher investment costs in network equipment with higher penetration of PEVs in the area of higher density of population compared to fully underground network. Four different layer structures have been considered in modeling reference network in [20]. The logical layer focuses on designing a graph containing nodes and branches. The topological layer uses GIS to generate the street map and provide information about geospatial coordinates of the elements in the network. The electrical layer focuses on load, DG, transformers, cables and lines electrical characteristics, while the quality of supply layer considers system reliability information, such as protection devices, corrective and preventive maintenance actions, etc. The work in [21] puts the focus on MV/LV transformer substation planning in big areas dividing them in smaller parts to reduce computational complexity. By using the reference network built in [20], the methodology firstly identifies the isolated areas which are far from the other parts. The decomposition is then performed in the isolated areas with high load density based on theoretical minimum number of transformers. Finally, the small decomposed regions are optimized independently minimizing the cost of network investments in both LV and MV networks, as well as MV/LV transformers. Two types of reference network were built in [22] by using a large-scale distribution network planning tool based on indicators collected from 79 big DSOs serving more than 100,000 customers, thus subjected to unbundling, in Europe due to lack of detailed schemes, topology, and grid data. Large scale networks include models of urban, semi-urban, and rural networks with HV/MV substations, MV consumers, MV-LV feeders, MV/LV substations, and LV consumers. On the other hand, feeder type networks were built to represent common feeder topology of MV feeder networks for reliability analyses, while LV feeder networks served for RES and EV integration analysis.
Because of the lack of distribution network models which can be used for different types of network analysis, we develop a web-platform named distribution network models (DiNeMo) based on the work elaborated in [18,19,20,21,22,23]. The objective of the platform is to design feeders’ networks under a HV/MV substation, including MV/LV substations, automation equipment, circuit breakers, and switchers. It is developed to reproduce the network of a geographical area of approximately 2 km2 all around Europe. The technical information gathered in the DSO Observatory project [24] makes DiNeMo a unique tool to stakeholders in the electricity sector. Indeed, while keeping the confidentiality of the data, it provides a powerful instrument for the network construction which can be used for real network cases analyses.
The contributions of the paper are the following: the description of DiNeMo platform and its unique capabilities; a validation methodology proving the reproducibility of a real network provided by DiNeMo; a power flow analysis performed on a real test case showing the impact of EV charging.
The rest of the paper is organized as follows: Section 2 presents the distribution system operators’ observatory results and their importance in terms of data used internally by DiNeMo. Section 3 describes the DiNeMo platform targets and working mechanisms. In Section 4 the validation methodology is explained and applied at an urban and a semi-urban case. Section 5 discusses the results of a power flow analysis showing the impact of EV charging at the urban level and finally Section 6 concludes the paper.

2. Distribution System Observatory 2018 and Network Indicators

To build representative synthetic networks, a large number of technical input parameters are required. Furthermore, as the distribution networks characteristics vary among European countries, it is of particular importance to collect data covering different geographic areas of interest supplied by diverse DSOs in order to have an accurate and precise model of reference networks. Because of DSOs’ data protection policy and privacy regulation framework, network data required for building reference network are not publicly available. In accordance with the mentioned problems, the DSO Observatory project was launched to collect several indicators directly from large DSOs operating in Europe. As the number of DSOs in Europe is bigger than 2600, the project targeted only the 191 DSOs serving more than 100,000 customers. Results published in Distribution System Observatory 2018 [24] gathered data from 99 DSOs supplying electricity (and in certain cases gas as well) to 220 million consumers in Europe which corresponds to 85% of the total number of consumers (served by the large DSOs). The goal of the survey was to understand the metrics applied to design the network and the decision-making process in DSOs’ planning. The results are grouped in technical data and smart grid dimension. The former group includes input referring to the distributed annual energy, number of low voltage (LV), medium voltage (MV), and high voltage (HV) connected customers, supplied area, circuit length, substation capacity, reliability indicators, and other metrics. In the later one, the focus is put on understanding DSO’s role as a user of non-frequency ancillary services, DSO-TSO data management, meter data management, remote control of substations, and electric mobility. In the report36 technical indicators were built, while this paper describes a subset of 10 indicators which are utilized to build large-scale reference networks in DiNeMo platform.

2.1. Indicators for Building the Large-Scale Representative Distribution Networks

The subset of indicators used in building reference networks in DiNeMo are the following: number of LV consumers per MV consumers, LV circuit length per LV consumer, LV underground ratio, number of LV consumer per MV/LV substation, MV/LV substation capacity per LV consumer, MV circuit length per MV supply point, MV underground ratio, number of MV supply points per HV/MV substation, typical transformation capacity of MV/LV secondary substation in urban areas, and typical transformation capacity of MV/LV secondary substation in rural areas.
  • The number of LV consumers per MV consumers is the ratio measuring the level of commercial and industrial consumers supplied by the DSO. Extremely different values of this indicator occur among DSOs result. This is due to the diverse size and population supplied by each DSO, as well as type of supplied area (urban, semi-urban, or rural areas).
  • The LV circuit length per LV consumer describes the location and distance between consumers, as well as their distribution in the observed area. Higher values of the indicator refer to the big areas where population density is very small and consumers are more spread, while in small areas, such as city centers with a big population, the value is smaller.
  • The LV underground ratio is calculated as the ratio between the length of LV underground cables and total length of LV network (considering both underground cables and overhead lines). Different values of LV underground ratio correspond to rural (less than 30%), semi-urban (30%–80%), and urban areas (more than 80%).
  • The number of LV consumers per MV/LV substation depends on the spread of consumers in the supplied area giving an idea of the size of low voltage network below each MV/LV substation. We distinguish higher ratio in urban area with higher density and lower ratio in rural area where consumers are more dispersed.
  • The capacity of MV/LV substation per LV consumer is the ratio between total installed capacity of MV/LV substation and the total number of LV consumers considering peak average power of consumers, energy efficiency of the devices and simultaneity factor depending on the size of the household, and number of people per household. Therefore, it provides an indication of the power installed below each MV/LV substation.
  • MV circuit length per MV supply point is the ratio between total length of MV network and number of MV supply points, considering both MV consumers and MV/LV substations. This indicator is important for understanding the capacity for installing future distributed generation.
  • The MV underground ratio is the ratio between MV underground cable length and total length of MV network, counting both underground cables and overhead lines. The value is lower for rural and higher for urban areas.
  • Number of MV supply points per HV/MV substation is the total number of MV supply points, both MV consumers and MV/LV substations, divided by the number of HV/MV substations in the observed area. This indicator is of significant importance because it highlights how industrialized or commercial the area supplied by the DSO is.
  • Typical transformation capacity of MV/LV secondary substations in rural areas is usually lower compared to urban areas. This difference occurs because of smaller electricity density in rural areas, as well as bigger distance between consumers.
The used indicators are listed in Table 1 and Table 2 with the average, median, minimum and maximum values, calculated at European level from the data collected in the DSO Observatory survey:
For more information and detailed description of all indicators, the reader is encouraged to refer to the DSOs Observatory Project of 2016 [23] and 2018 [24].

3. DiNeMo Platform

Representative reference network models were originally developed for the transmission level for planning purposes. Due to the increasing attention toward distribution level, focus has moved to distribution network modeling. The most commonly used synthetic networks in the literature are made available by IEEE with 15, 33, 69, and 123 buses, with standardized equipment [25]. The latter are often modified based on user’s knowledge in terms of power lines, transformer capacity, and layout according to the specific analysis. Few examples are adopting real networks directly provided by DSO that differ greatly on technical features and geographical extension [26,27,28]. A well-defined picture arises from the literature which clearly emphasizes the lack of adequate quasi-real networks where researchers can apply algorithms and perform different optimization problems more related to real cases. Indeed, the small number of buses, branches and consumers, the rare presence of geo-reference layout, and the lack of equipment information are limiting the use of these networks to algorithm benchmarks. Motivated by the existence of this knowledge gap, the DiNeMo platform was developed. The purpose of DiNeMo platform is to provide a solid tool based on real data which is capable of reproducing the representative distribution grid of a given area of interest that stakeholders in the electricity sector can use for research purposes. The platform, now available online [29], aims to become the virtual place where diverse users with different roles (researchers, DSOs, NRAs, utilities, etc.) can collaborate with the objective of building reliable network models to help design and develop the smart cities of tomorrow. Therefore, the main focus of DiNeMo platform is oriented toward urban city areas.
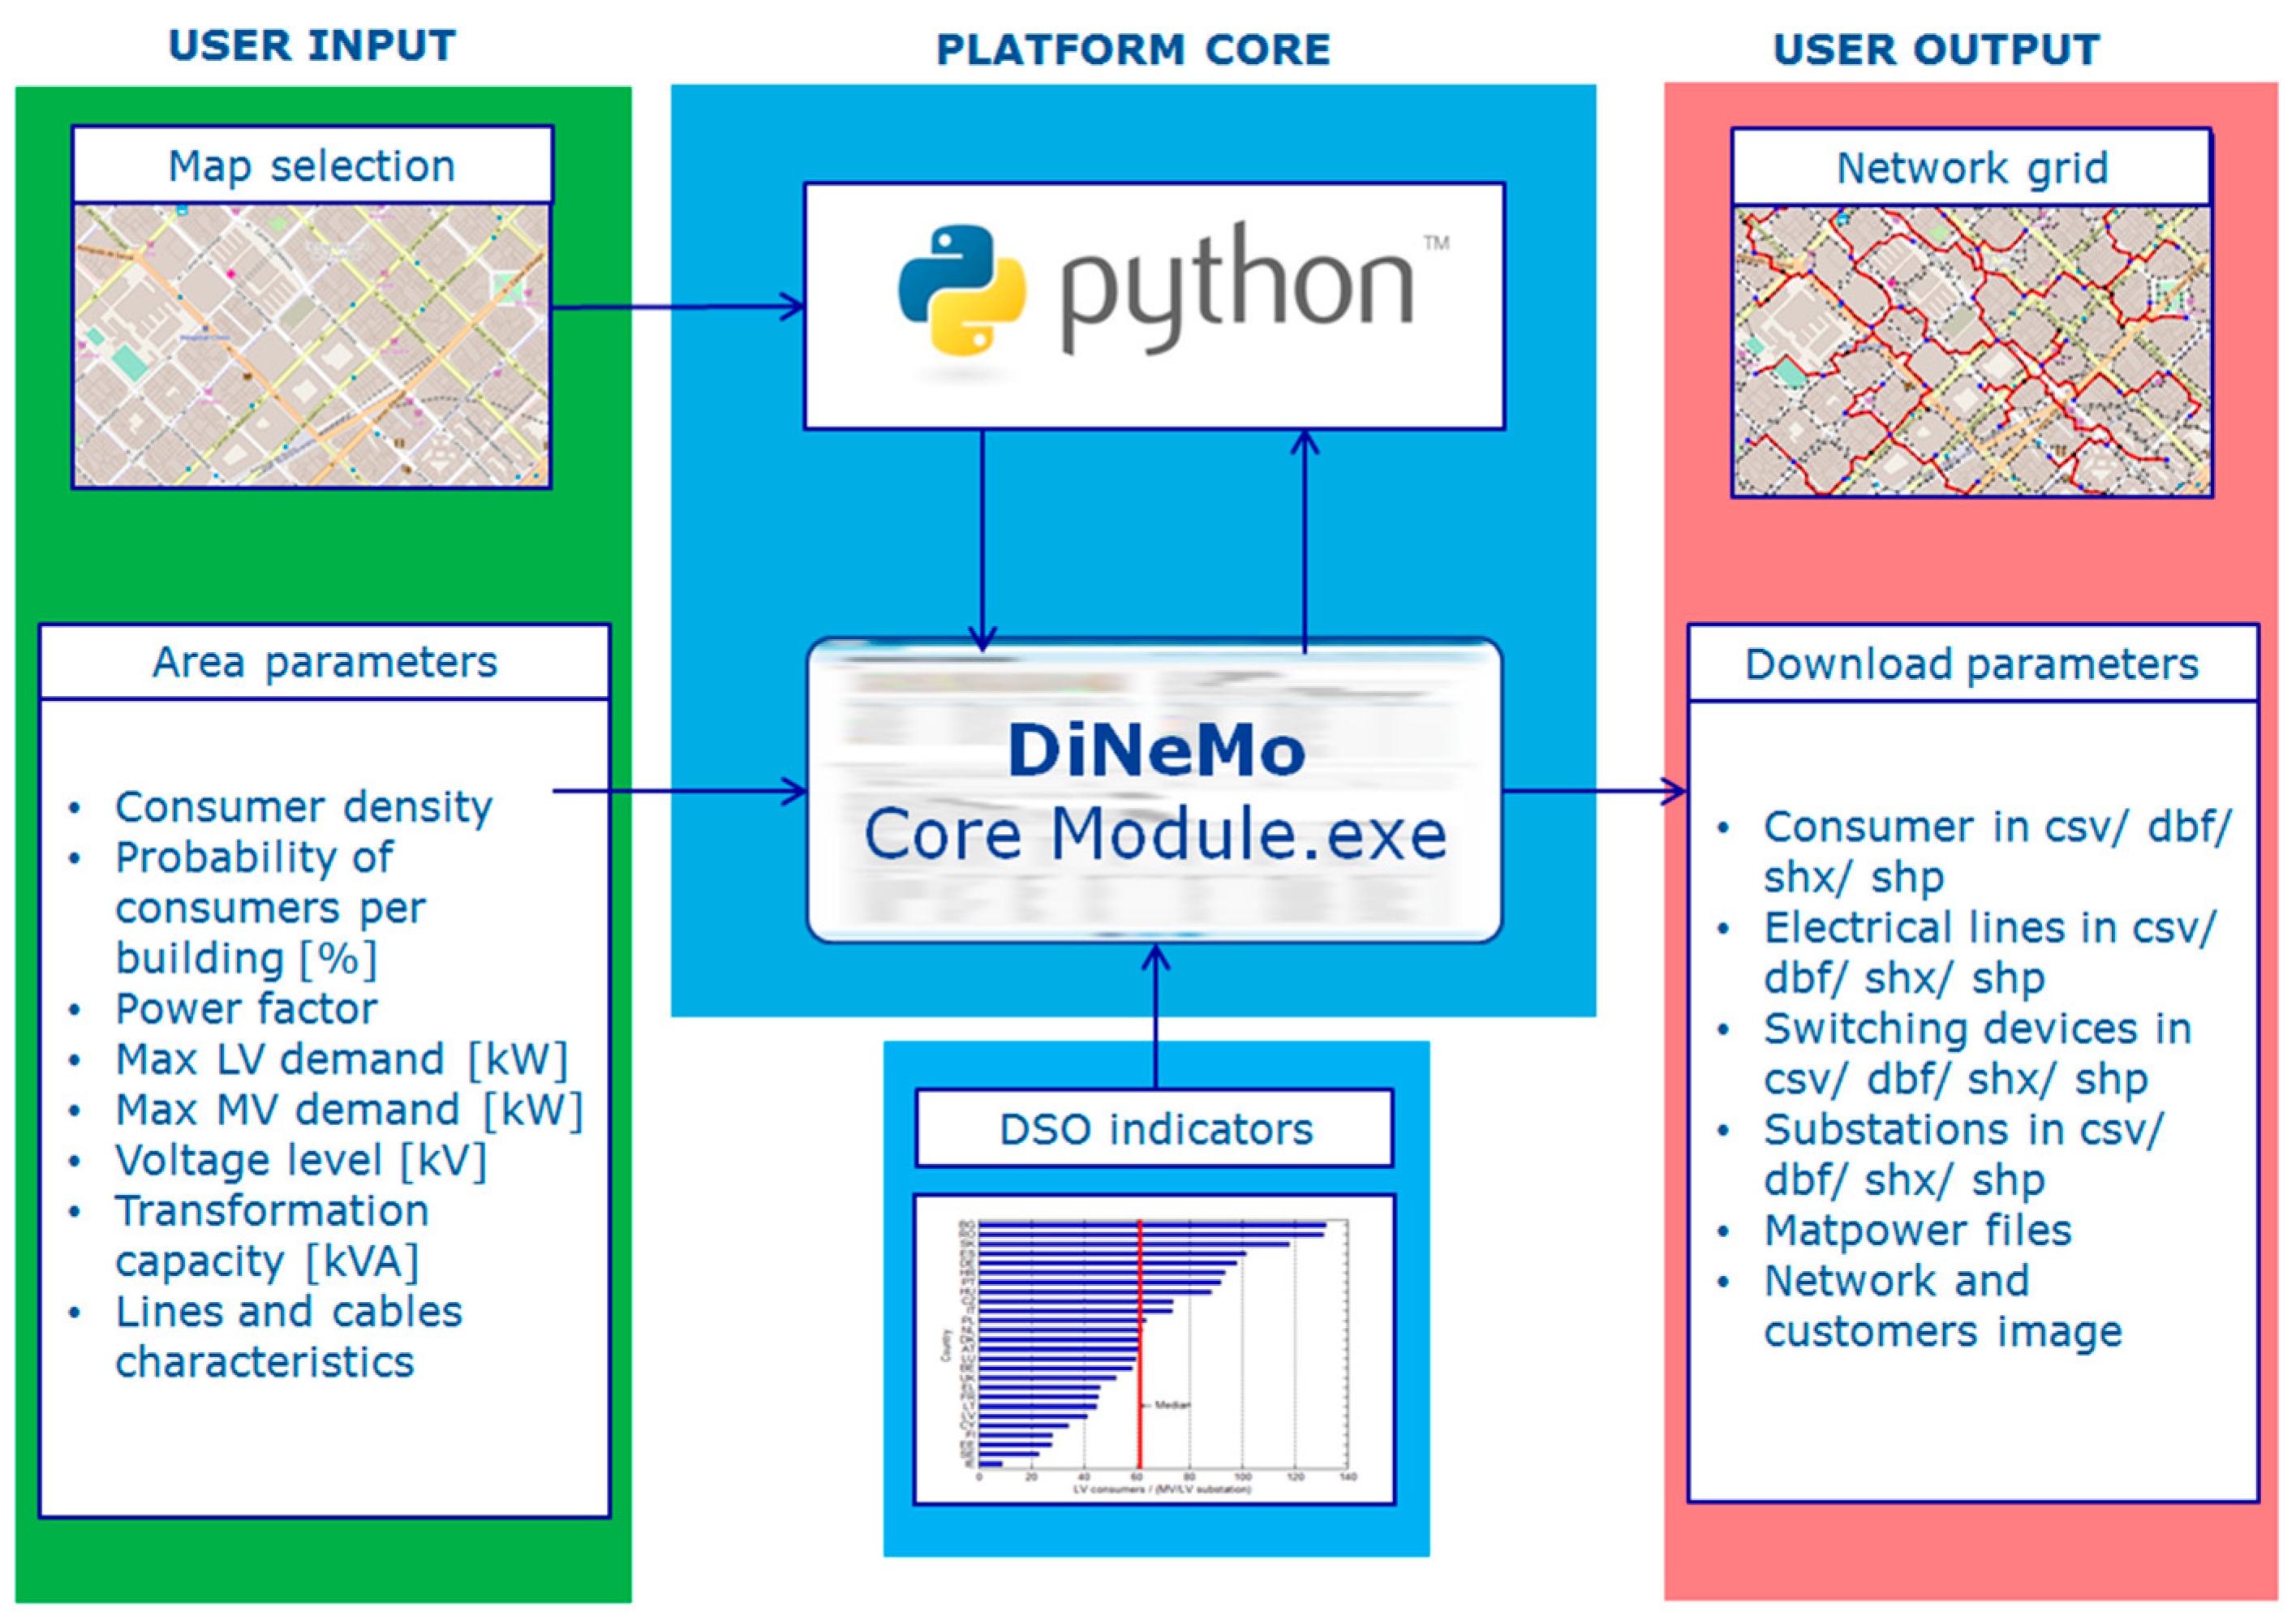
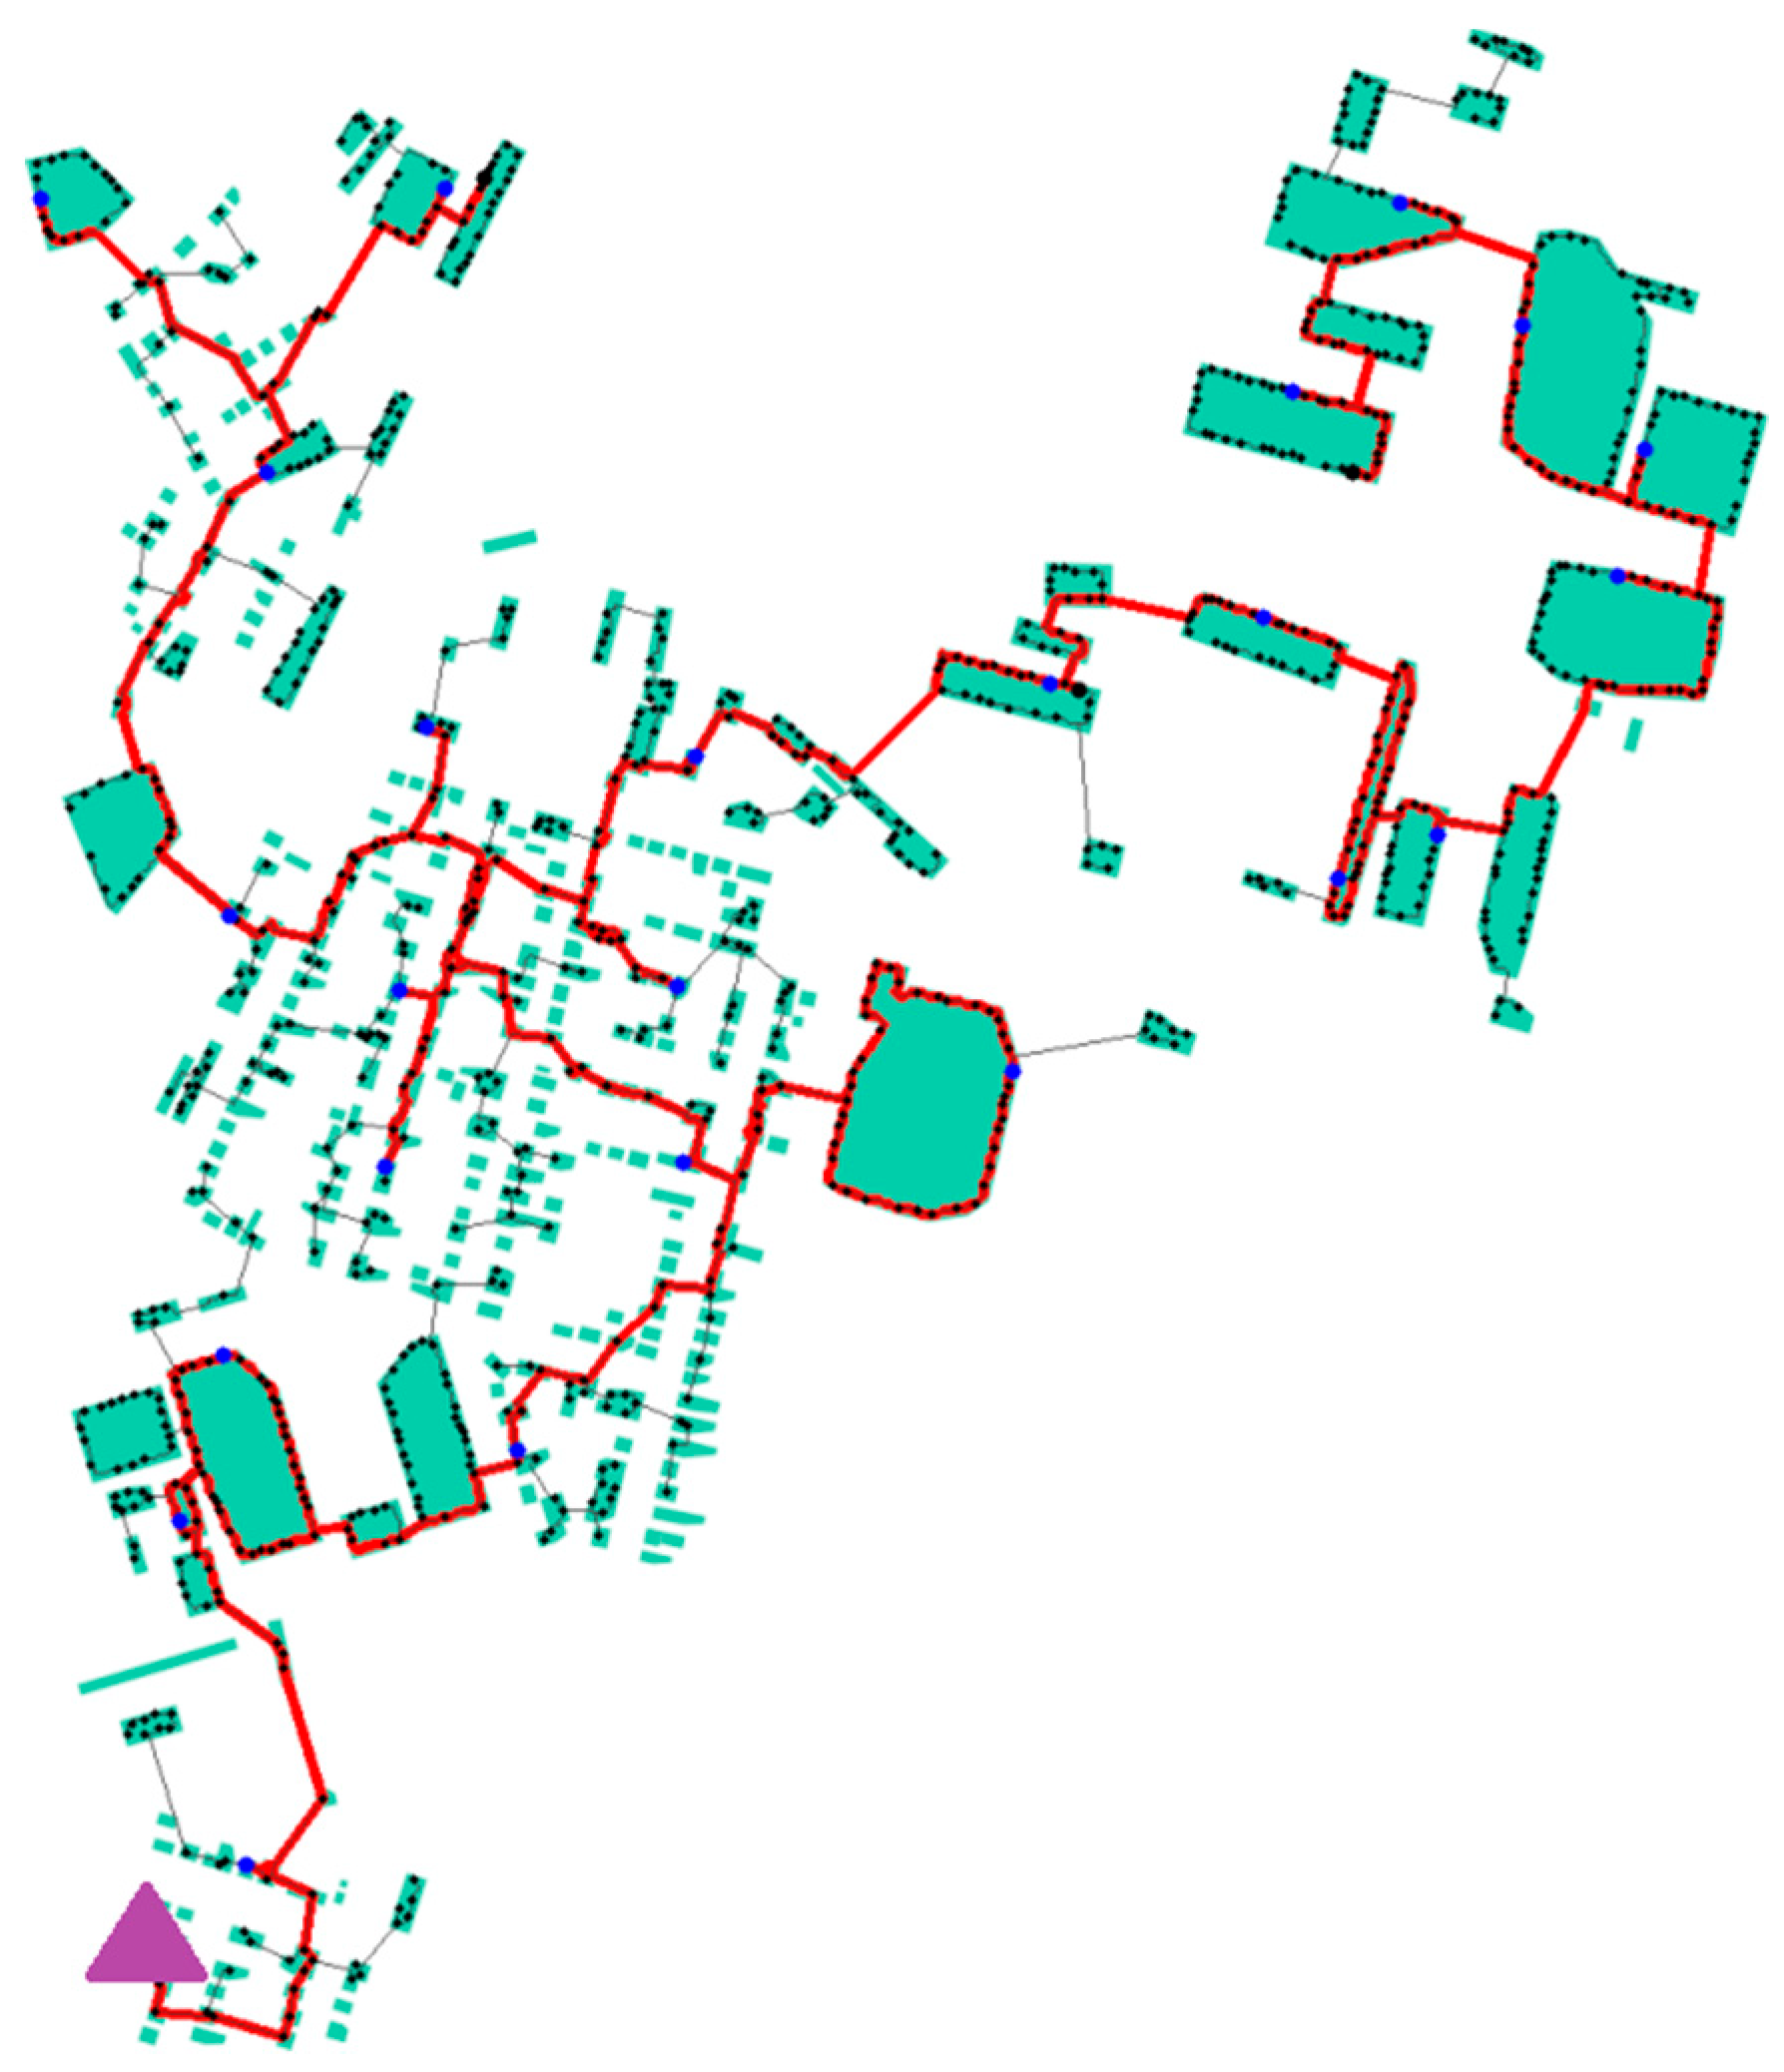
The structure of the platform is presented in Figure 1. The platform is based on a green-field model which designs the distribution grid from scratch, aiming at minimizing investment costs while keeping voltage drop at a safety level as described in methodology in [20]. There are three main blocks in the platform: the user input dashboard, the core module, and the user output. The user interface is based on editing and submitting network computation request (NCR) to a Joint Research Centre (JRC) server. In the first step the platform requires from the user side to capture the area of interest in Open Street Map. In the second step the user needs to specify the geographical location of HV/MV substation. Moreover, in the input section user is obliged to enter the number and the percentage of consumers per building and change the density, power factor, voltage level, as well as maximum demand of LV and MV consumer if necessary. On top of the mentioned requirements (user input in Figure 1) from the user’s side, the core module has nine indicators (DSOs data in Figure 1) calculated in [23] which are specific for each country serving as an extra input constraint. Moreover, overhead lines and underground cables characteristics are presented in Appendix A (Table A1 and 
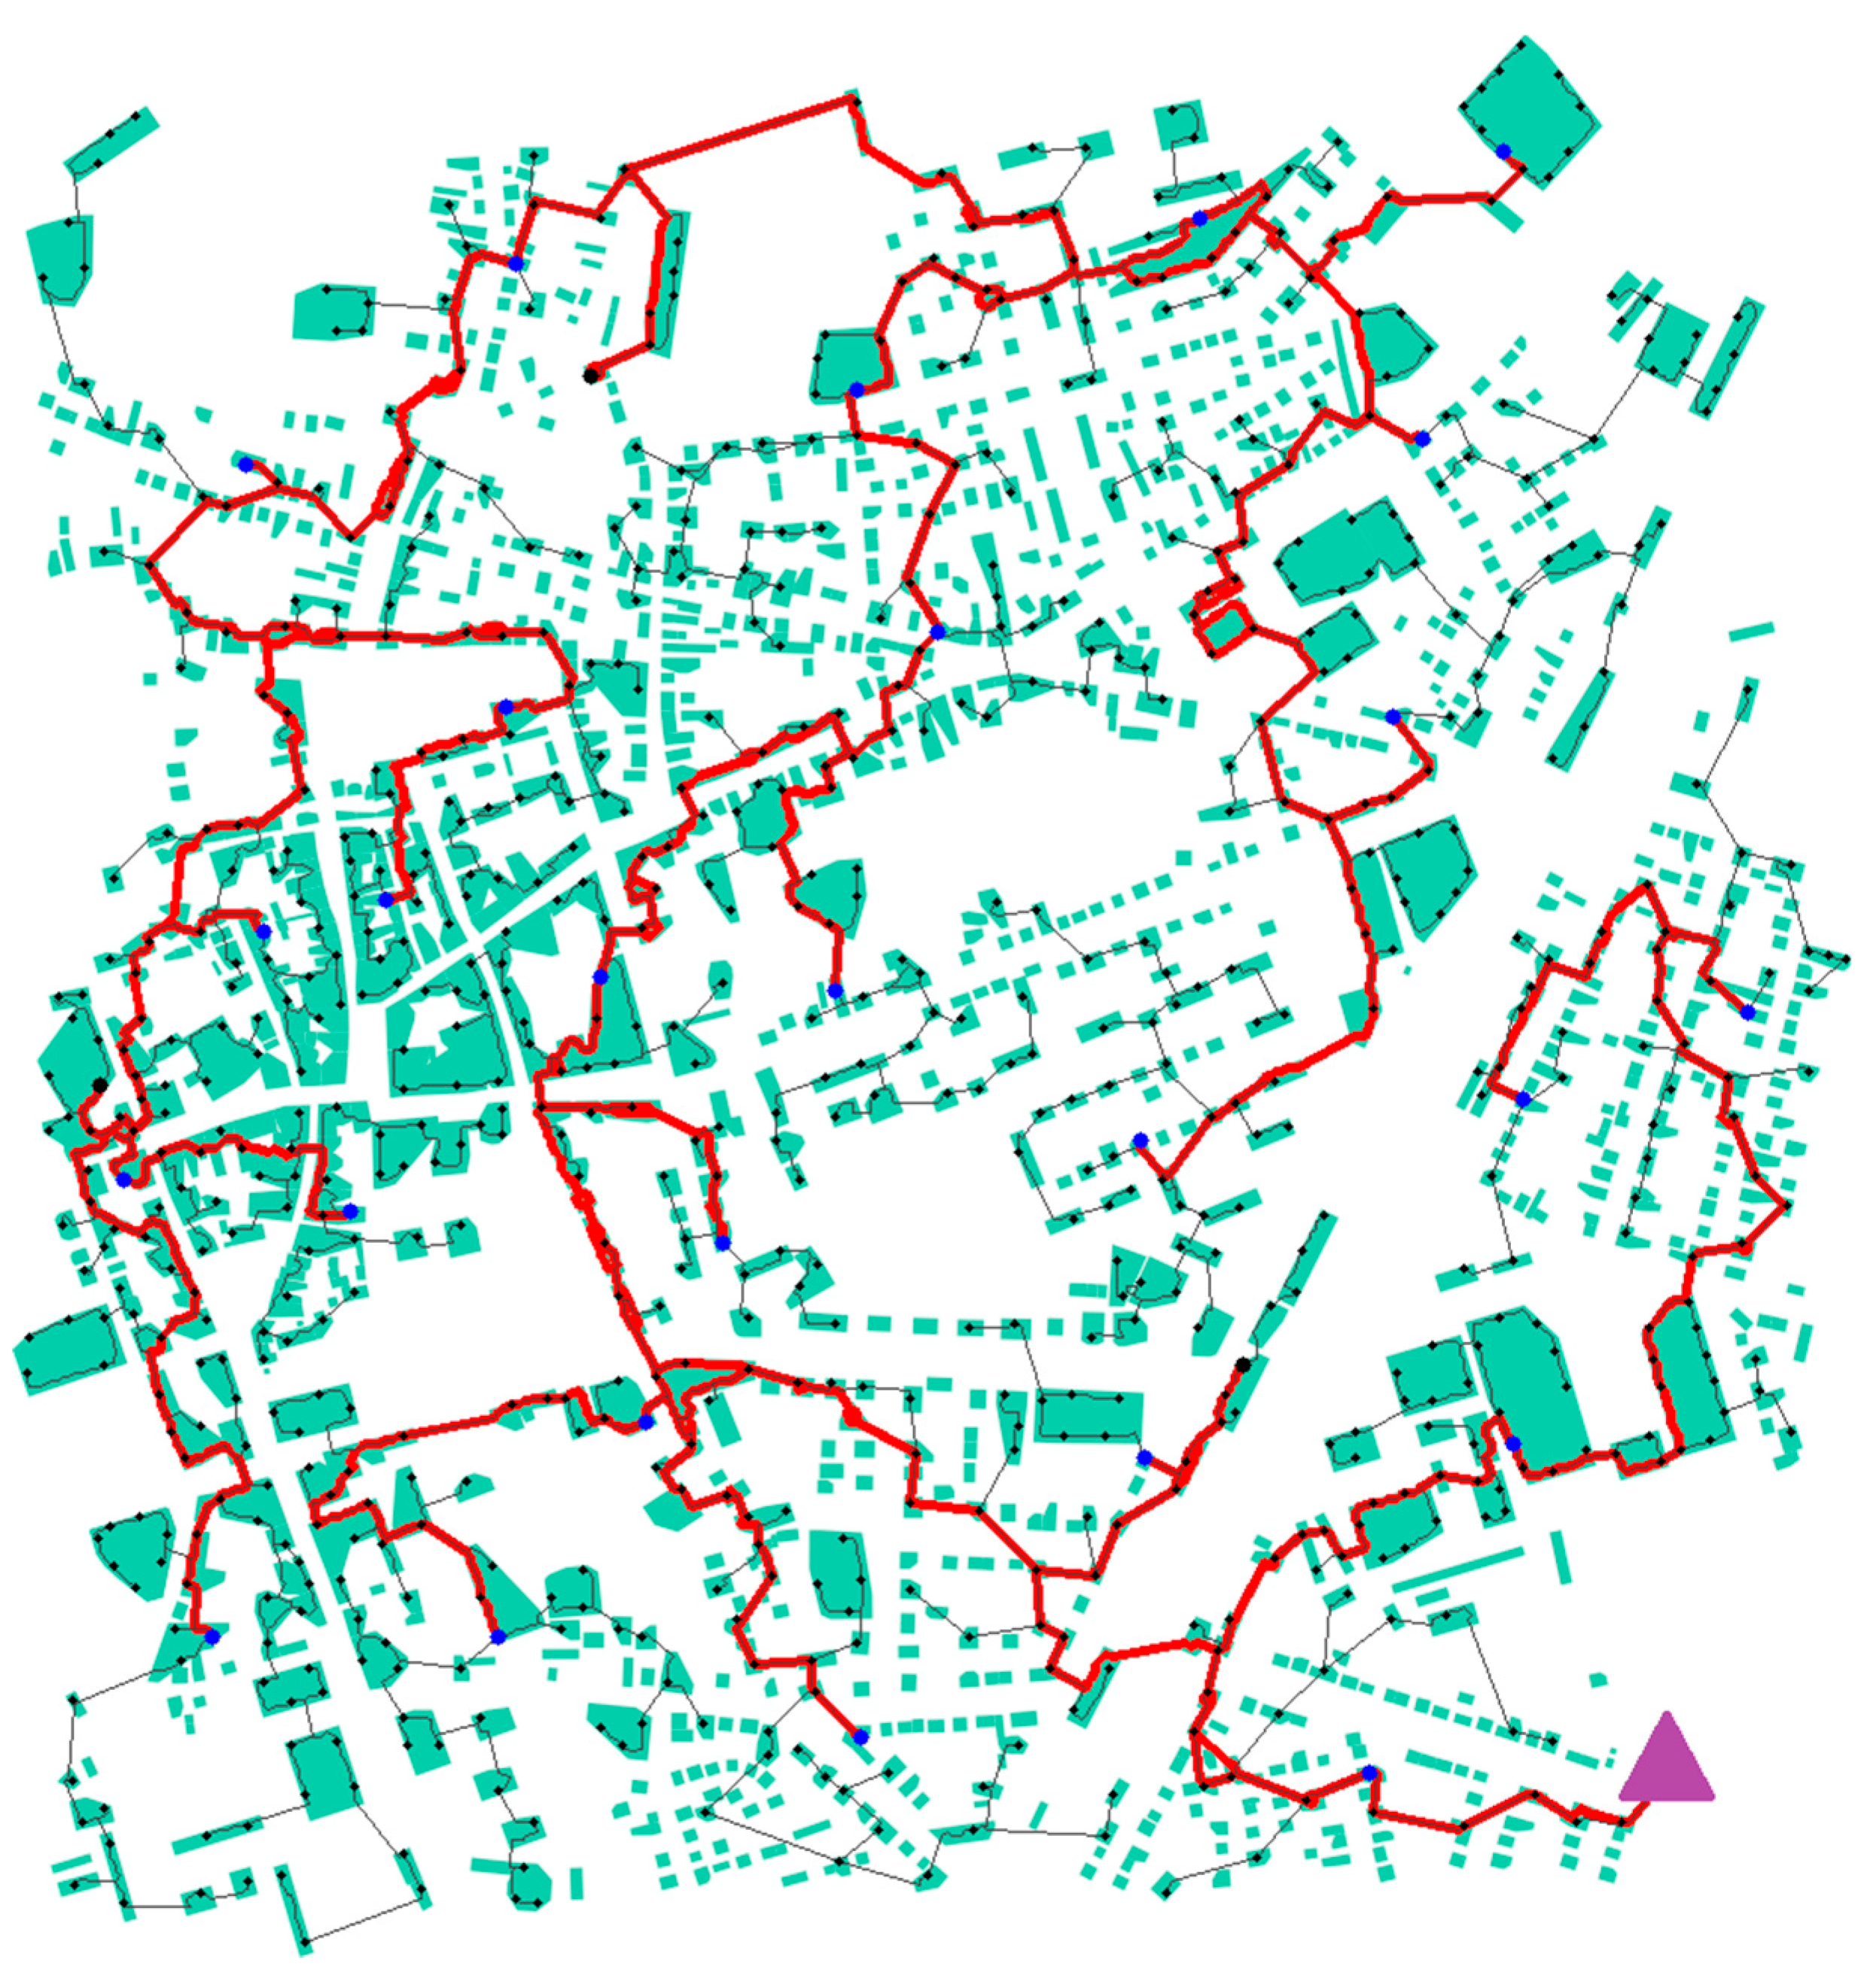
Table A2) which serves as an input parameter in DiNeMo simulation (investments cost are not reported in the paper due to confidential agreements with DSOs). Indeed, the algorithm is a branch-exchange technique which builds a graph starting from the geographical coordinates of consumers (the only known data).
By taking into account fixed cost (such as substations cost) and variable ones linked mainly to the power losses, the graph aims at minimizing the circuit length across the network [30] using Euclidian minimum spanning tree algorithm. For this reason, the network solution proposed by DiNeMo can be considered as an optimal one.
Several outputs, visible in Figure 1, are provided to the user ranging from shapefile of electrical lines, consumers, and substations, to MATPOWER files which may be used to perform power flow analysis in the network.

4. Indicators Validation Methodology

When building the reference networks, it is of significant importance to validate the accuracy of the output parameters in order to demonstrate that modeled network can be used as a representative network of the observed area. Croatian DSO, HEP—Operator distribucijskog sustava d.o.o., calculated the indicators for a small urban area in Croatia, the city of Varaždin. To demonstrate that the results of DiNeMo platform are in accordance with the data provided by Croatian DSO, we distinguish two case studies for the city of Varaždin: the city center (urban case) and an industrial area located in the east side of the center (semi-urban case). Case studies are elaborated in detail in the following sections. The validation is done by statistically comparing the nine indicators described in Section 2 as being the most relevant ones for the construction of a network.

4.1. Varaždin City Center Characteristics

The first case study is focused on the Varaždin city center, as shown in Figure 2 taken from Open Street Map which serves as an input in network computation request (NCR) in DiNeMo simulation selected by the user. The location of the HV/MV substation is chosen by the user and is indicated with a red circle. The grey cables visible in Figure 2 in the bottom right part are the transmission lines heading from the TS Varaždin substation to another HV/MV substation outside Varaždin. The substation TS Varaždin contains three different transformer levels: 110/35 kV, 110/20, and 110/10 kV. Since at the moment the platform enables only one type of HV/MV substation, we selected 110 kV/10 kV transformer with the capacity of supplying up to 31.5 MVA. The city center is composed of few main roads, and according to [31], 15 EV public charging stations have been installed. Equipped with different connectors (combo, type2, and chademo) and different power range (11 kW, 22 kW, and 50 kW), public charging stations may cause voltage fluctuations if not properly managed. Future installation of charging stations will most likely be placed close to relevant points of interest (supermarket, cinemas, shop areas, etc.). In fact, by having a deeper look at the selected area, we can observe that several potential installation points are present: more than 20 cafés and restaurants, seven banks, three schools, three university departments and a hospital. In addition, there are more than 20 parking lots which may be transformed into virtual vehicle-to-grid (V2G) areas to support the network during the hours of peak demand.
For this reason, the goal of the simulation is to test the network reliability under a deeper penetration of charging stations across the city center located close to point of interests.
After entering all required parameters for submitting a network computation request (NCR), the layout of the distribution network grid is performed by DiNeMo, as explained in Section 3. Once the NCR is successfully processed, the user can obtain several outputs. One of the outputs from DiNeMo simulation is the network image shown in Figure 3 which is based on the area selected in Figure 2. The network image, one of the outputs resulting from NCR, is shown in Figure 3. The purple triangle presents the location of HV/MV substation. The red lines in Figure 3 are MV overhead lines and underground cables, while the black ones stand for LV feeders. In the whole network the total circuit length is 90.2 km, of which 57.6 km are LV feeders, having an average length of 51 meters. Total number of LV feeders is 1119, and MV 42. The average length of LV feeders underground ranges from a few meters to almost 550 meters and they represent 39% of all LV power lines. Regarding the MV network, a different number appears. Indeed, the average length is an order of magnitude higher than LV feeders, reaching a median value of 455 meters. The blue circles represent 29 MV/LV substations of which almost 50% have a capacity of 400 kVA, and they transform the voltage from 10 kV to 0.4 kV. The connected consumers, which are located on the perimeter of each building, are colored in black and divided, by voltage level, into square shape for LV, and to bigger black circles for MV ones. In this specific case, the MV network is equipped with 45 switchers, six circuit breakers, and 165 fuses devices have been installed. Additionally, from Figure 3 emerges that the number of lines crossing roads is minimized.
The validation methodology used to compare the real network and the one designed by DiNeMo is done by comparing nine indicators explained in Section 2.1. Interesting results came out which are shown in Table 3 and Table 4. We firstly built the network based on DSO operating in Varaždin and secondly, we input the national Croatian average data (taken from the DSOs Observatory dataset). In the second column of Table 3 the indicators based on the real Varaždin network operated by the Croatian DSO are shown. The third column stands for the results of DiNeMo city center simulation, while the fourth shows the Croatian average value collected through the DSO Observatory report [24]. DiNeMo network values obtained on Varaždin network by using the average DSO Croatian values of [24] are listed in the fifth column. It is worth mentioning before looking at the results, that we are analyzing a subarea of the city center, meanwhile DSO values take into account a broader area, thus also some peripheral neighborhood.
As one can notice in Table 3, the indicator #1 presenting the number of LV consumers per MV consumers, reveals a higher value in DiNeMo, for both cases national and local simulations, than the one calculated by DSO. This difference is limited to 9% by using the local DSO value and 30% for the national one. Therefore, this discrepancy is reasonable because in this test case we are applying DiNeMo on a merely urban area which has many MV supply points due to several points of interests as well as the presence of the train station. The same effect is translated, in both cases, in the indicator #8 which sees, in the local case, the number of MV supply points per HV/MV substation of 69 compared to 33 in DiNeMo. Indicator #2 is smaller in DiNeMo compared to the DSO value because we are considering a densely urban area where consumers are positioned much closer to each other. In addition to this, DiNeMo is minimizing the circuit length according to the investment costs, thus we always expect more optimal configuration.
LV underground ratio is slightly smaller in DiNeMo networks simulation, and it is more pronounced in the local situation rather than setting the national Croation DSO DSO, HEP—Operator distribucijskog sustava d.o.o. Indicators #4, #5 and #6 show a good correlation with the real values, especially while applying the local input parameters. Indicator #7, MV underground ratio, has higher value in DiNeMo compared to DSO one. As we entered higher density in NCR, MV underground ratio is higher. Higher ratio characterizes urban area which is in line with the results because we used density for the city center and not the entire city. Furthermore, the algorithm takes into account environmental constraints, and minimizes cables crossing buildings: this is why the result shows 95% of MV underground ratio. Indicator #8, number of MV supply points per HV/MV substation, due to its interdependency with indicator #1, is calibrated with a national value which is smaller compared to this specific case.

4.2. Varaždin Semi-Urban Area Characteristics

The second test case is related to a semi-urban area of Varaždin, where the same HV/MV substation is supplying a different area. Figure 4 presents the input in DiNeMo simulation. The image from Open Street Map is selected by the user and substation location is highlighted with a red circle. Unlike urban area in the first example, most of the land in the northern part of the image has big factories. These characteristics are identifiable in the indicators’ results, and in the lower number of consumers which has an absolute value of almost 1000 consumers. The semi-urban area has a total circuit length of 46.6 km, of which almost 43% is attributed to MV, which is in line with the high industrialization of the network. Furthermore, the average LV feeders’ length is 30 meters, thus almost half of the urban case. This occurs because connected consumers are clustered in three or four main zones within the network. The number of MV/LV substations visible in blue circles in Figure 5 are limited to 25, with a higher percentage of transformer capacity of 1000 kVA.
As one can see from Table 5, number of LV consumers per MV consumers is lower in DiNeMo simulation results compared to the indicator calculated by DSO because of the density chosen for this NCR. Again, we chose higher density because this industry area is located very close to the city center. LV circuit length per LV consumer in DiNeMo is shorter compared to DSO indicator. As one can see from Figure 5, blocks of buildings are located close to each other resulting in shorter distance between consumers. LV underground ratio has a good correlation with DiNeMo output.
Figure 5 presents network image as an output of DiNeMo simulation based on the image selected in Figure 4. As one can notice from Figure 5, the number of MV supply points in this case is very small (only three MV consumers and 22 MV/LV substations) because of smaller area of supply. Comparing Figure 3 and Figure 5, number of buildings and LV consumers in Figure 5 is smaller than in Figure 3, resulting in higher number of LV consumers per MV/LV substation, as well as in smaller number of MV supply points per HV/MV substation and MV circuit length per MV supply point in industry area.
MV underground ratio is lower compared to the indicator provided by DSO because of the location of observed area and high density which refer to city center, unlike the indicator calculated for the whole city of Varaždin including suburban zones with lower density.
Indicators for industry area are compared in Table 5:
As shown in Table 6, typical transformation capacity in DiNeMo corresponds to the one provided by DSO.

5. Power Flow Analysis under A High Level of Installed Charging Stations

Outputs of DiNeMo NCR are diverse: excel tables containing information about overhead lines and underground cables, switching devices, consumers’ maximum rated power, HV/MV and MV/LV substations, images of grid layout and MATLAB file with branch, nodes and generators data required for AC power flow simulation in MATPOWER.

5.1. MATPOWER Input Data Description

We consider 110/10 kV substation with rated capacity of 31.5 MVA, 35 10/0.4 kV substations in total of which 19 with rated capacity of 400 kVA, 12 with 630 kVA, and 2 with 1000 kVA. From Croatian population census published online [32], we define input parameters for DiNeMo simulation as in Table 7 showing approximated values of number of people living in a building with the associated percentage.
Consumer demand profiles have been extracted from a dataset provided to JRC from the Italian national regulatory authority ARERA, and scaled and normalized in order to fit the size of Varaždin distribution network capacity. As the number of buses in the network exceeds the number of demand profiles provided by ARERA by almost three times, we randomly assign scaled demand profiles to each bus in MATPOWER simulation. This is performed by applying Monte Carlo method with 10,000 iterations. The same process is applied to EV charging stations, where the demand profile is taken from [33], and randomly associated to a different location in the grid. The same ratio utilization of the charging columns, presented in [33], has been applied in this analysis. As suggested in [34], one or more slow charging points will be required for every 15 electric vehicles. According to that, we distinguish two different types of penetration level (in relation to the number of the buses in the network): 10% (as a most probable future realization based on EAFO [35]) and 20% (as an extreme one) with a charging power of 22 kW as being the only one present according to [31] in Varaždin. The impact on the voltage deviation, due to the increased demand provoked by EV charging is then analyzed for the 1194 buses of the networks.

5.2. Results of AC Power Flow in MATPOWER

DiNeMo is running on a local server based in the Joint Research Centre of Ispra (European Commission) without parallel computation. The core module is developed in C++ with additional features developed in Python. The overall computation time is within 10 minutes.
The AC power flow analysis is performed in MATLAB with MATPOWER using Newton–Raphson method and a tolerance of 1e-08.
The most critical hour in terms of voltage drop is detected at 20:00. Additionally, because of its time-consuming nature, Monte Carlo simulation is performed only for this specific time. Figure 6 shows the results with 0% (left) and 10% (right) penetration of electric vehicle service equipment (EVSE) penetration. The colored nodes in Figure 6 are the same plotted in Figure 3.
Figure 6a indicates the average voltage value after 10,000 iterations for each bus where no charging stations’ installation have been applied, thus only consumer demand profile is randomly assigned. As stated in standard EN 50160, the voltage drop should be limited to ±10 % of nominal level. In this case, the average voltage value among all buses and iterations in this case is 0.9967 p.u. with an average aggregated demand of 61.3 MWh (seen from the HV/MV substation) and total losses that account for 2.5%.
Figure 6b provides a comprehensive view of the voltage variation due to 10% installation of charging stations. The total demand increases by 11%, as well as the losses which reach 3%. The mean voltage value is 0.9777 p.u., and within the 10,000 Monte Carlo iterations, 5% of the buses have voltage below 0.9 p.u. at 20:00.
It is clear that a 10% penetration of EVSE, visible in Figure 6b, is already heavily affecting the voltage issues. Indeed, the voltage is decreasing, especially in those buses located far from the substation. The proliferation of blue dots, based on the color bar on the right, highlights the voltage issues for many buses. Even worse is the situation for a 20% of EVSE penetration, which sees even higher voltage deviation, with an average voltage value of 0.95 p.u., and therefore threatens the quality of services and requires either network reinforcement or smart EV charging.

6. Conclusions

To investigate the impact of green energy transition on distribution network, it is crucial to model possible future scenarios of DERs integration in the power system. Due to the lack of publicly available distribution network data, reference networks are modeled for performing multiple grid analyses necessary for accepting increased number of RES and EV charging stations. In order to model geo-referenced networks not limited in the number of buses and branches, DiNeMo platform was created. DiNeMo platform uses real distribution network data collected from DSOs around Europe to model reference network of an observed area of interest. DiNeMo is oriented towards urban city areas, putting them in the center of the future smart grids. The algorithm used in building the reference network in DiNeMo platform is based on a green-field model designing the grid from the scratch. As the core algorithm used in DiNeMo platform is a branch-exchange technique which builds a graph starting from the geographical coordinates of consumers while considering fixed and variable cost, the graph minimizes the circuit length across the network using Euclidian minimum spanning tree algorithm and results in an optimal distribution network layout. The platform uses nine indicators from Distribution System Operator Observatory 2018 [24] to build the reference network of a specific area of interest according to the location from Open Street Map and supplied by specific DSO.
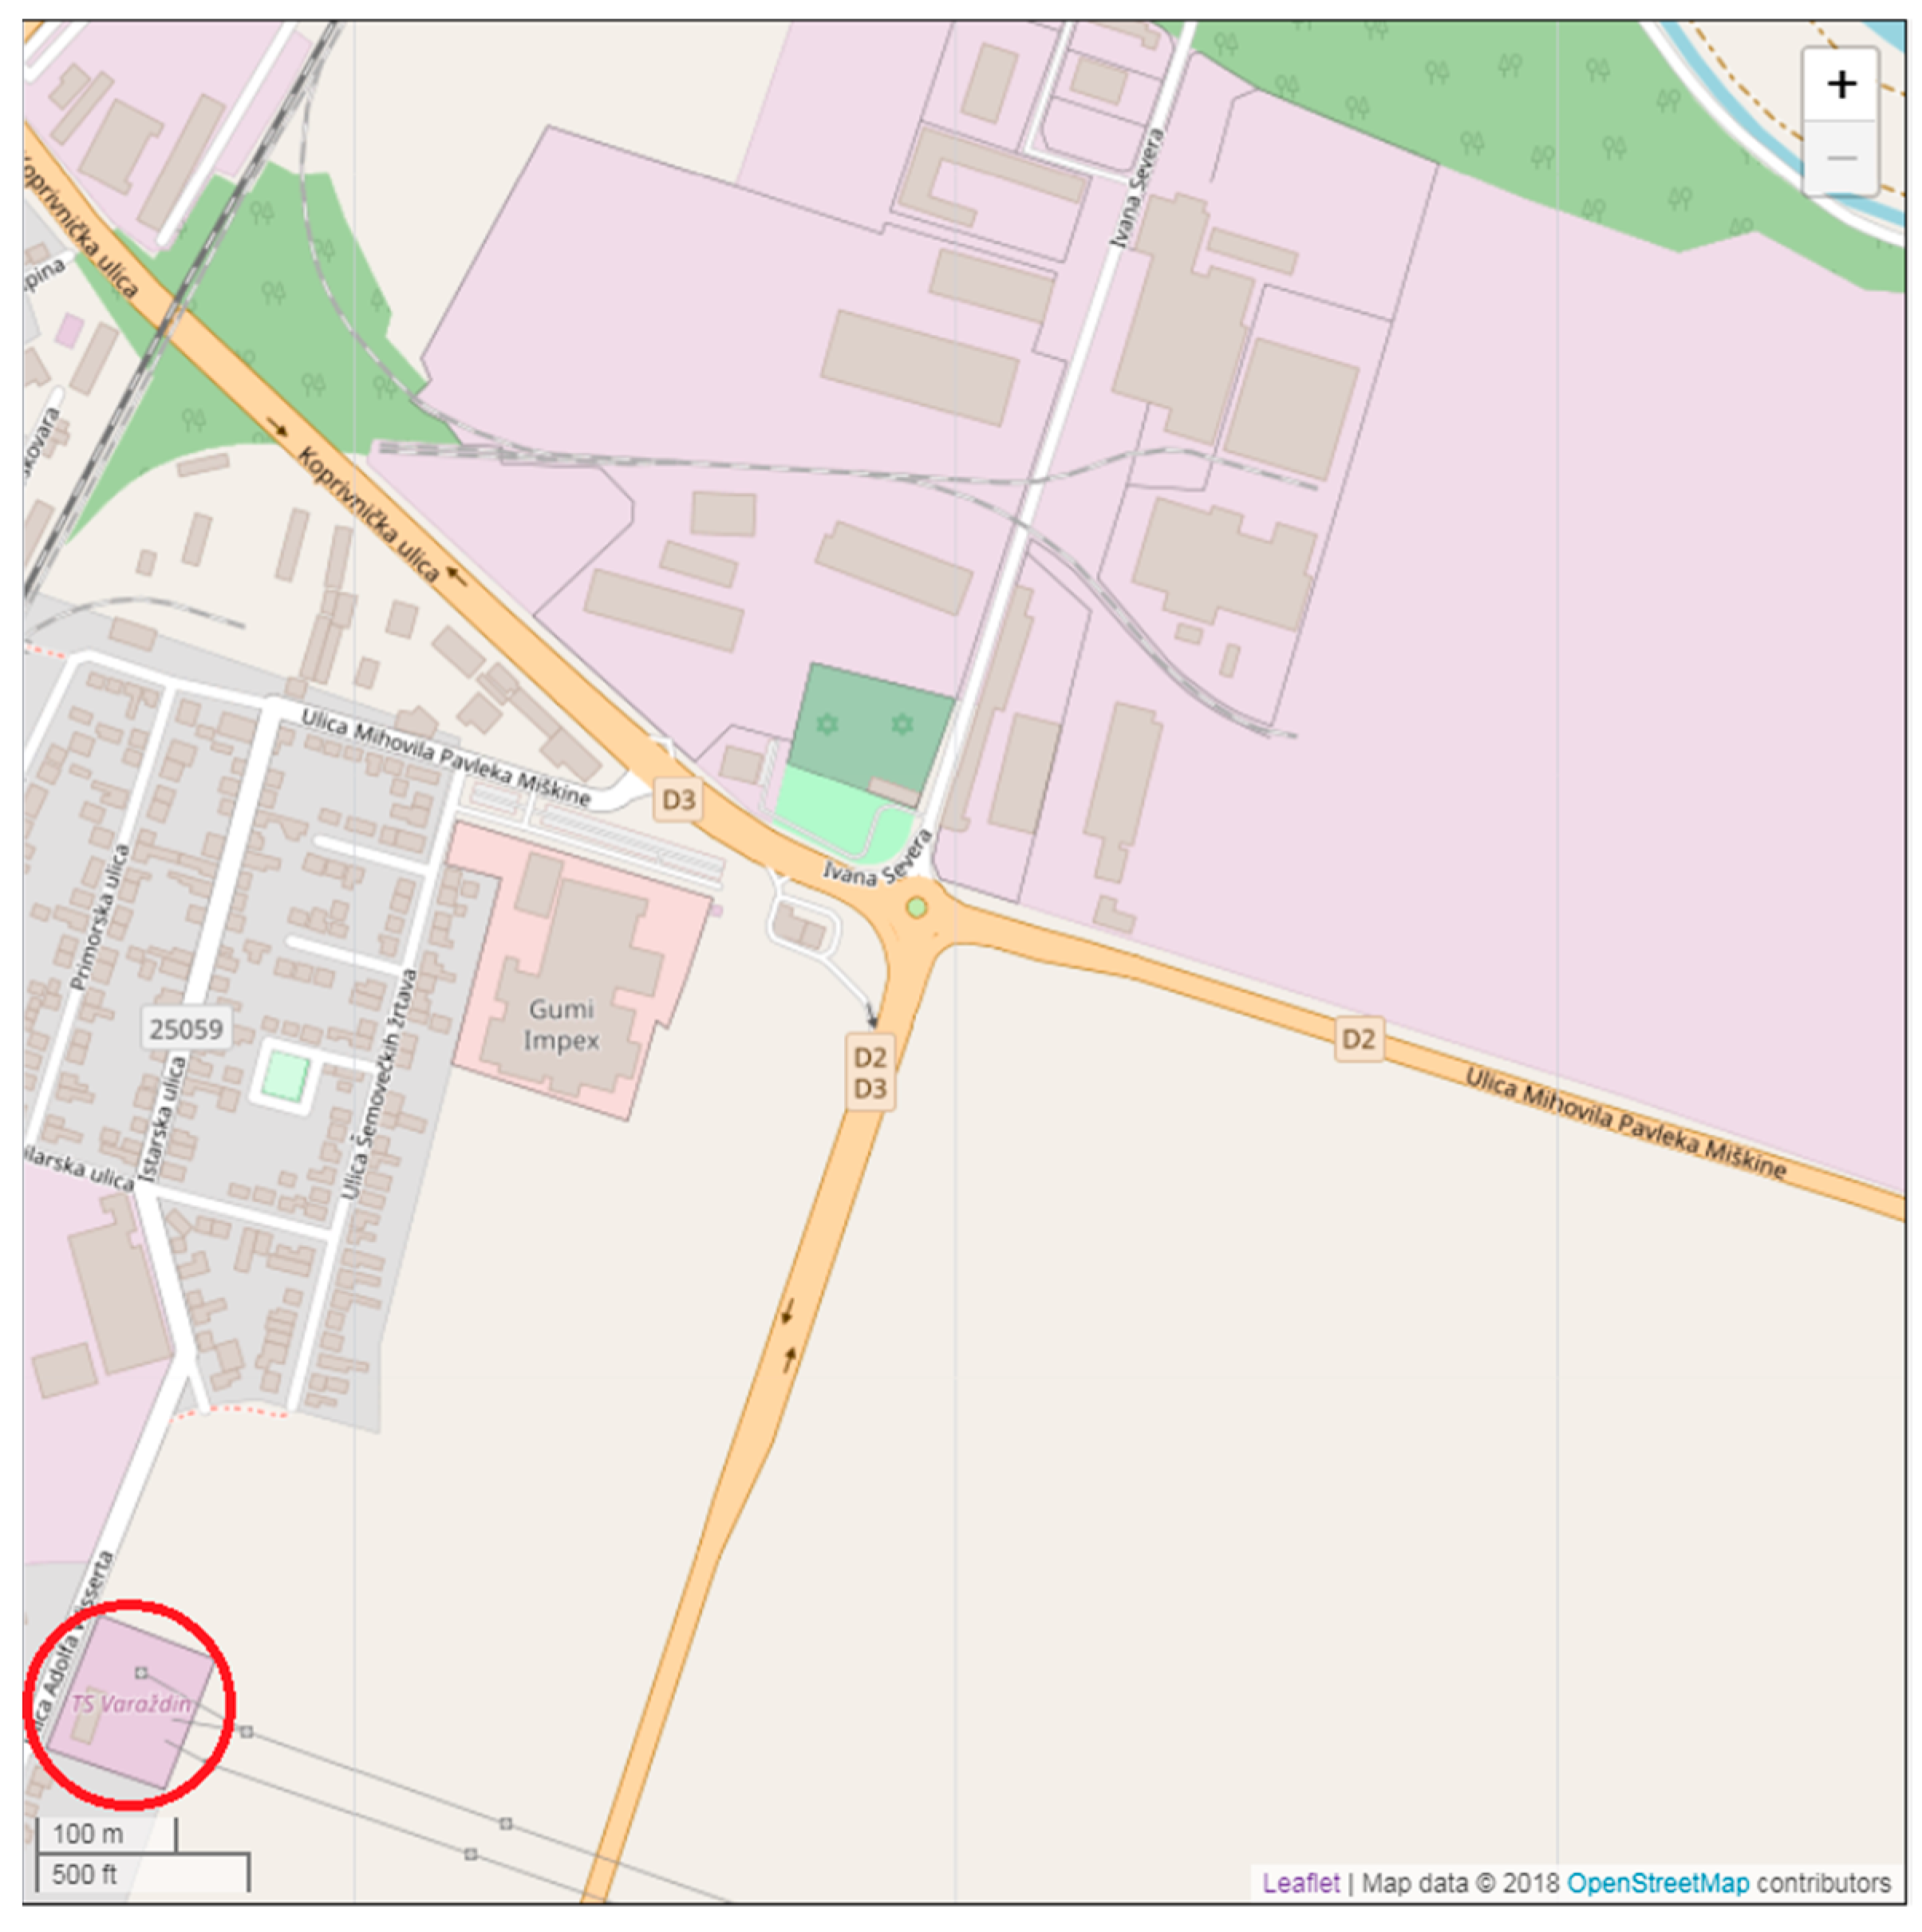
To demonstrate the accuracy of DiNeMo platform, we perform two cases of validation in terms of indicators comparison of the Croatian city of Varaždin. The first one is focused on the city center (urban case), while the second one covers an industrial area located in the east side of the center (semi-urban case). We calculate the indicators from the DiNeMo simulation results and compare them with the data provided by the Croatian DSO. Based on this benchmarking exercise, DiNeMo shows to be a useful tool for creating representative distribution network models.
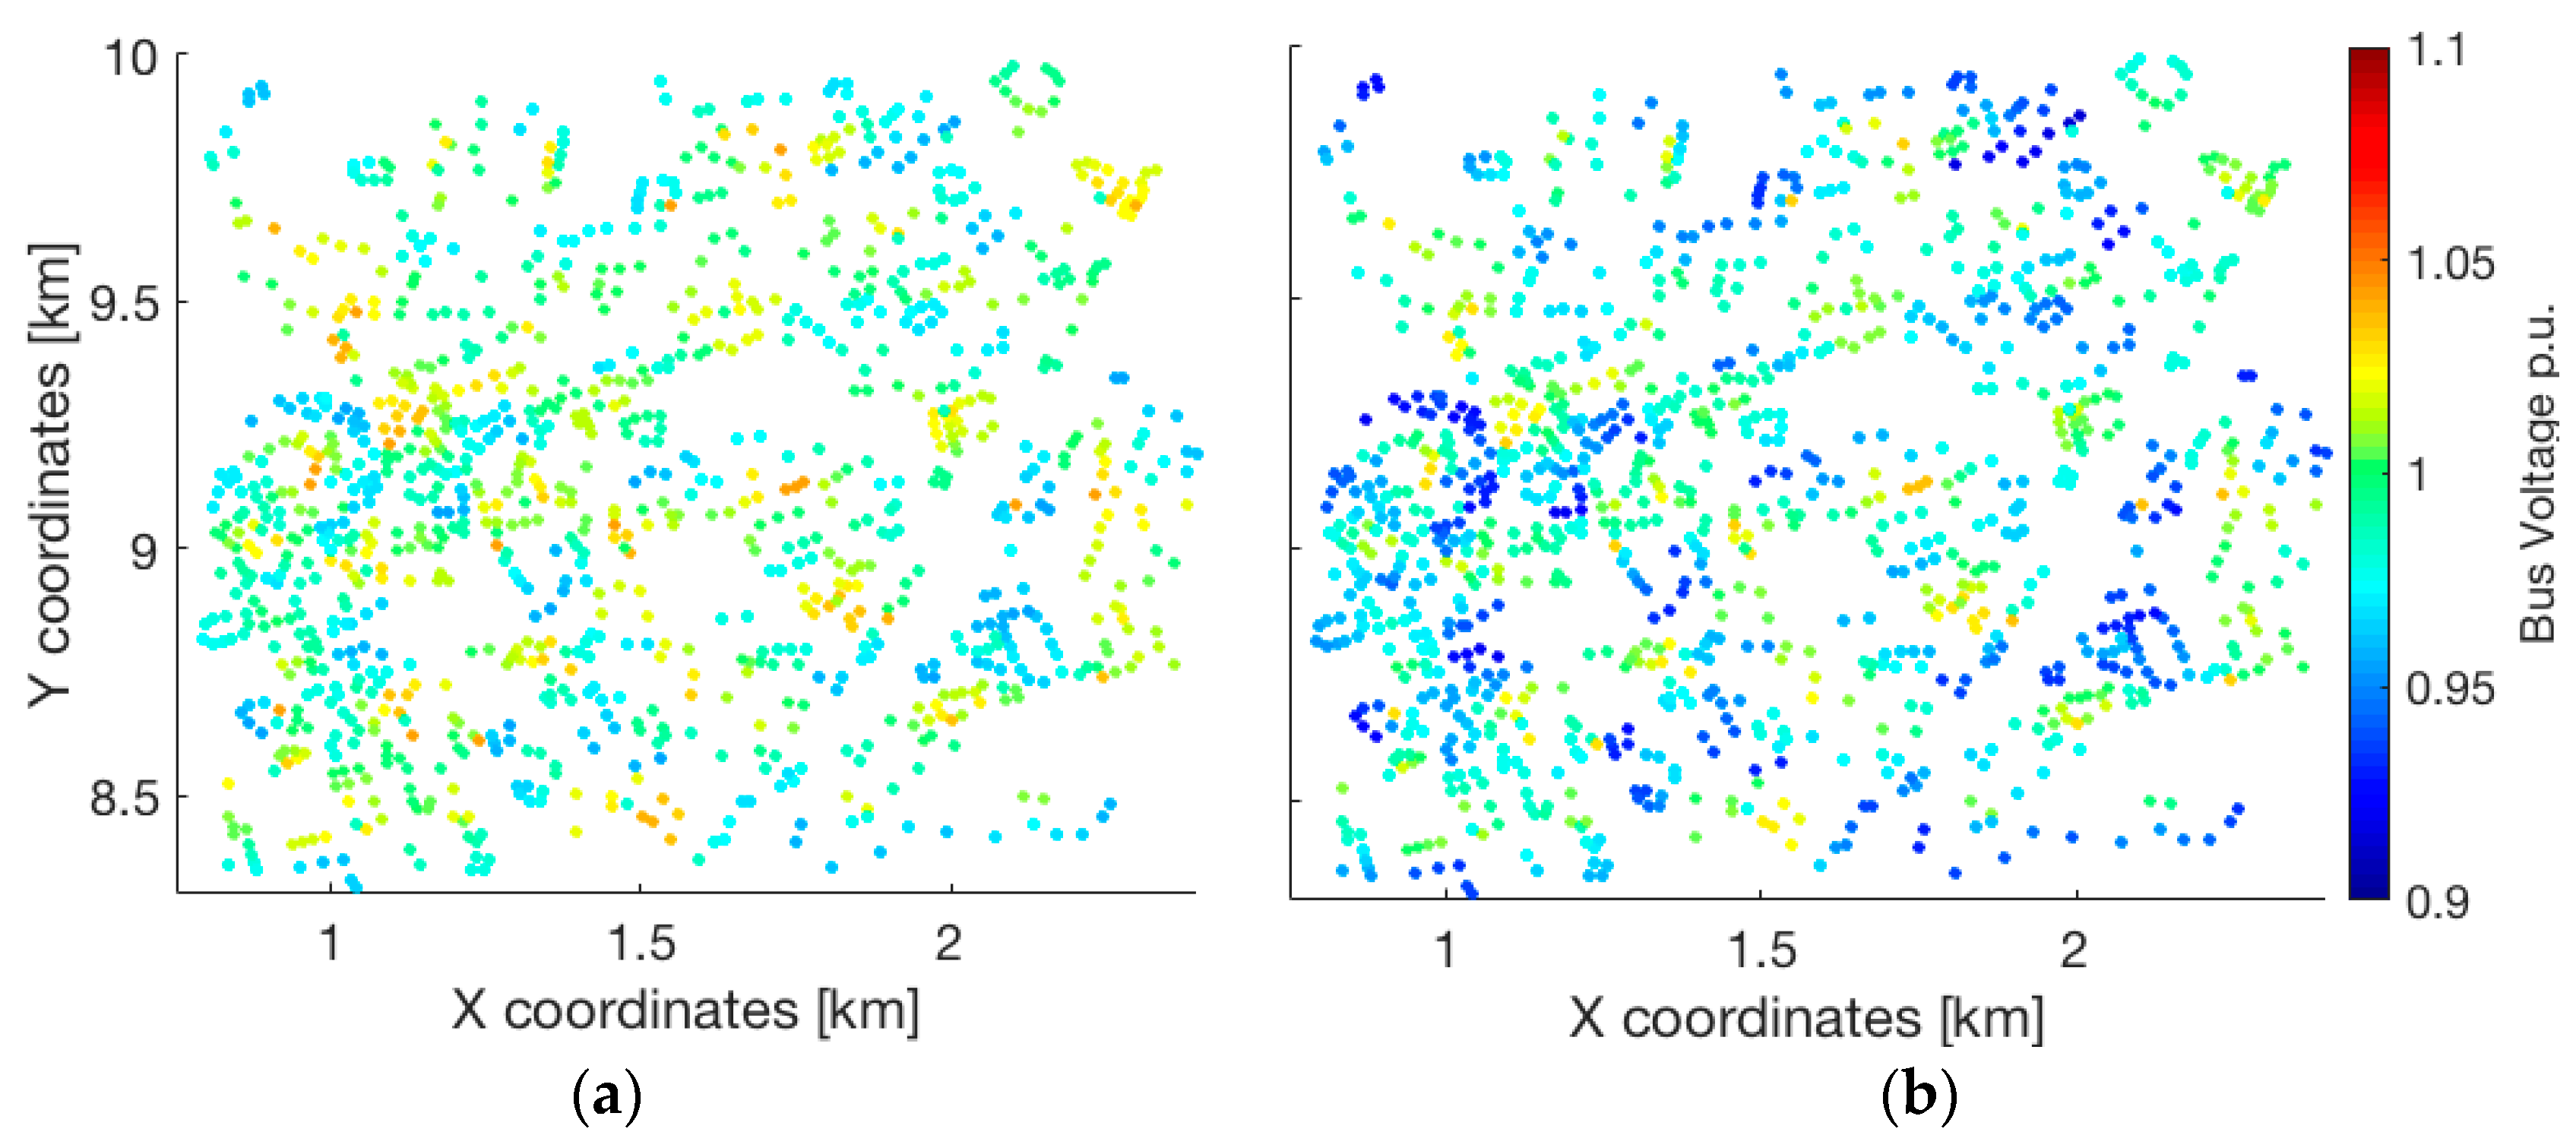
Furthermore, based on the MATPOWER network files of DiNeMo, we investigate the impact of future EVSE integration on the current distribution network. We perform several AC power flow analyses on Varaždin city center with two different levels of EVSE penetration with the focus on voltage deviation and total losses. The results show that in the case of 10% of EVSE penetration, 5% of all buses have voltage drop under 0.9 p.u., while in the case of 20% penetration the network should be considered for reinforcement.
DiNeMo platform is available online and it is open to all stakeholders in the electricity sector working on distribution network analyses and in wider areas.

Author Contributions

M.G; Croatian data collection, M.G. and M.G.F.; methodology, DiNeMo platform testing, NCR modelling, results validation, writing—original draft preparation, M.G.F.; MATLAB simulations, G.P.; writing—review and editing, supervision.

Acknowledgments

We would like to thank Croatian DSO HEP—Operator distribucijskog sustava d.o.o. for providing data required for DiNeMo platform output validation and indicators comparison. These works have been supported in part by Croatian Science Foundation and in collaboration with Distribution System Operator (HEP ODS d.o.o.) under the project IMAGINE (PAR2018-12).

Conflicts of Interest

The authors declare no conflict of interest.

Appendix A

Overhead lines’ characteristics are shown in Table A1:
Table A1. Overhead lines’ characteristics.
NameR (ohms/km)X (ohms/km)Ampacity (A)Voltage (kV)
AL_3_50_0.5950.3021850.4
AL0.4370.2902260.4
AL_3_950.3080.2812830.4
AL_FE_3_10.5950.34517010
AL_FE_3_20.4130.33529010
AL_FE_3_30.3060.33035010
Underground cables’ characteristics are shown in Table A2:
Table A2. Underground cables’ characteristics.
NameR (ohms/km)X (ohms/km)Ampacity (A)Voltage (kV)
CU_11.1160.0891050.4
CU_10.5200.0831650.4
CU_10.3670.0811950.4
PP_410.4430.10016010
PHP_810.2650.10221510
XHP0.2100.12034510

References

  1. Clean Energy for All Europeans. Available online: https://eur-lex.europa.eu/resource.html?uri=cellar:fa6ea15b-b7b0-11e6-9e3c-01aa75ed71a1.0001.02/DOC_1&format=PDF (accessed on 10 July 2019).
  2. Rui, H.; Arnold, M.; Wellssow, W.H. Synthetic Medium Voltage Grids for the Assessment of Smart Grid Techniques. In Proceedings of the 3rd IEEE PES Innovative Smart Grid Technologies Europe (ISGT Europe), Berlin, Germany, 14–17 October 2012. [Google Scholar]
  3. Petretto, G.; Cantù, M.; Gigliucci, G.; Pilo, F.; Pisano, G.; Natale, N.; Soma, G.G.; Coppo, M.; Turri, R. Representative Distribution Network Models for Assessing the Role of Active Distribution Systems in Bulk Ancillary Services Markets. In Proceedings of the 2016 Power Systems Computation Conference (PSCC), Genoa, Italy, 20–24 June 2016. [Google Scholar]
  4. Abeysinghea, S.; Wua, J.; Sooriyabandarab, M. A Statistical Assessment Tool for Electricity Distribution Networks. In Proceedings of the 8th International Conference on Applied Energy—ICAE, Beijing, China, 8–11 October 2016. [Google Scholar]
  5. Birchfield, A.B.; Schweitzer, E.; Athari, M.H.; Xu, T.; Overbye, T.J.; Scaglione, A.; Wang, Z. A Metric-Based Validation Process to Assess the Realism of Synthetic Power Grids. Energies 2017, 10, 1233. [Google Scholar] [CrossRef]
  6. Birchfield, A.B.; Xu, T.; Gegner, K.M.; Shetye, K.S.; Overbye, T.J. Grid Structural Characteristics as Validation Criteria for Synthetic Networks. IEEE Trans. Power Syst. 2017, 32, 3258–3265. [Google Scholar] [CrossRef]
  7. Xu, T.; Birchfield, A.B.; Overbye, T.J. Modeling, Tuning, and Validating System Dynamics in Synthetic Electric Grids. IEEE Trans. Power Syst. 2018, 33, 6501–6509. [Google Scholar] [CrossRef]
  8. Soltan, S.; Loh, A.; Zussman, G. A Learning-Based Method for Generating Synthetic Power Grids. IEEE Syst. J. 2019, 13, 625–634. [Google Scholar] [CrossRef]
  9. Schweitzer, E.; Scaglione, A. A Mathematical Programming Solution for Automatic Generation of Synthetic Power Flow Cases. IEEE Trans. Power Syst. 2019, 34, 729–741. [Google Scholar] [CrossRef]
  10. Espejo, R.; Lumbreras, S.; Ramos, A. A Complex-Network Approach to the Generation of Synthetic Power Transmission Networks. IEEE Syst. J. 2018, 99, 1–4. [Google Scholar] [CrossRef]
  11. Levi, V.; Strbac, G.; Allan, R. Assessment of performance-driven investment strategies of distribution systems using reference networks. IEE Proc.-Gener. Transm. Distrib. 2005, 152, 1–10. [Google Scholar] [CrossRef]
  12. Kellermann, J.; Larscheid, P.; Moser, A. Applying Synthetic Distribution Grids for Sensitivity Studies of Grid Expansion Reduction by Curtailment Schemes. In Proceedings of the NEIS 2017 Conference on Sustainable Energy Supply and Energy Storage Systems, Hamburg, Germany, 21–22 September 2017. [Google Scholar]
  13. Sarstedt, M.; Garske, S.; Blaufuß, C.; Hofmann, L. Modelling of Integrated Transmission and Distribution Grids based on Synthetic Distribution Grid Models. In Proceedings of the 2019 IEEE Milan PowerTech, Milan, Italy, 23–27 June 2019. [Google Scholar]
  14. Schweitzer, E.; Scaglione, A.; Monti, A.; Pagani, G.A. Automated Generation Algorithm for Synthetic Medium Voltage Radial Distribution Systems. J. Emerg. Sel. Top. Circuits Syst. 2017, 7, 271–284. [Google Scholar] [CrossRef]
  15. Trpovski, A.; Recalde Melo, D.F.; Hamacher, T. Synthetic Distribution Grid Generation Using Power System Planning: Case Study of Singapore. In Proceedings of the International Universities Power Engineering Conference UPEC, Glasgow, Scotland, 4–7 September 2018. [Google Scholar]
  16. Kays, J.; Seack, A.; Smirek, T.; Westkamp, F.; Rehtanz, C. The Generation of Distribution Grid Models on the Basis of Public Available Data. IEEE Trans. Power Syst. 2017, 32, 2346–2353. [Google Scholar] [CrossRef]
  17. Amme, J.; Pleßmann, G.; Buhler, J.; Hulk, L.; Kotter, E.; Schwaegerl, P. The eGo grid model: An open-source and open-data based synthetic medium-voltage grid model for distribution power supply systems. J. Phys. Conf. Ser. 2018, 977, 012007. [Google Scholar] [CrossRef]
  18. Cossent, R.; Olmos, L.; Gomez, T.; Mateo, C.; Frias, P. Distribution network costs under different penetration levels of distributed generation. Eur. Trans. Electr. Power 2011, 21, 1869–1888. [Google Scholar] [CrossRef]
  19. Fernández, L.P.; Román, T.G.S.; Cossent, R.; Domingo, C.M.; Frías, P. Assessment of the Impact of Plug-in Electric Vehicles on Distribution Networks. IEEE Trans. Power Syst. 2011, 26, 206–213. [Google Scholar] [CrossRef]
  20. Domingo, C.M.; Román, T.G.S.; Sánchez-Miralles, Á.; González, J.P.P.; Martínez, A.C. A Reference Network Model for Large-Scale Distribution Planning with Automatic Street Map Generation. IEEE Trans. Power Syst. 2011, 26, 190–197. [Google Scholar] [CrossRef]
  21. González-Sotres, L.; Domingo, C.M.; Sánchez-Miralles, Á.; Miró, M.A. Large-Scale MV/LV Transformer Substation Planning Considering Network Costs and Flexible Area Decomposition. IEEE Trans. Power Deliv. 2013, 28, 2245–2253. [Google Scholar] [CrossRef]
  22. Mateo, C.; Prettico, G.; Gómez, T.; Cossent, R.; Gangale, F.; Frías, P.; Fulli, G. European representative electricity distribution networks. Electr. Power Energy Syst. 2018, 99, 273–280. [Google Scholar] [CrossRef]
  23. Prettico, G.; Gangale, F.; Mengolini, A.; Lucas, A.; Fulli, G. DISTRIBUTION SYSTEM OPERATORS OBSERVATORY: From European Electricity Distribution Systems to Representative Distribution Networks; EUR 27927 EN; Publications Office of the European Unio: Brussels, Belgium, 2016. [Google Scholar] [CrossRef]
  24. Prettico, G.; Flammini, M.G.; Andreadou, N.; Vitello, S.; Fulli, G.; Masera, M. Distribution System Operators Observatory 2018. Available online: http://publications.jrc.ec.europa.eu/repository/bitstream/JRC113926/jrc113926_kjna29615enn_newer.pdf (accessed on June 14, 2019).
  25. Kersting, W.H. Radial distribution test feeders. In Proceedings of the 2001 IEEE Power Engineering Society Winter Meeting. Conference Proceedings (Cat. No.01CH37194), Columbus, OH, USA, 28 January–1 February 2001; Volume 2, pp. 908–912. [Google Scholar]
  26. Mousavi, S.M.; Flynn, D. Controlled charging of electric vehicles to minimize energy losses in distribution systems. IFAC-PapersOnLine 2016, 49, 324–329. [Google Scholar] [CrossRef]
  27. Yang, J.; He, L.; Fu, S. An improved pso-based charging strategy of electric vehicles in electrical distribution grid. Appl. Energy 2014, 128, 82–92. [Google Scholar] [CrossRef]
  28. Leemput, N.; Geth, F.; Roy, J.; Büscher, J.; Driesen, J. Reactive power support in residential LV distribution grids through electric vehicle charging. Sustain. Energy Grids Netw. 2015, 3, 24–35. [Google Scholar] [CrossRef]
  29. SES JRC. Available online: https://ses.jrc.ec.europa.eu/dinemo (accessed on 23 July 2019).
  30. Miguez, E.; Cidras, J.; Diaz-Dorado, E.; Garcia-Dornelas, J.L. An improved branch-exchange algorithm for large-scale distribution network planning. IEEE Trans. Power Syst. 2002, 17, 931–936. [Google Scholar] [CrossRef]
  31. EVway. Available online: https://evway.net (accessed on 1 August 2019).
  32. Croatian Population Census 2011. Available online: https://www.dzs.hr/Hrv/censuses/census2011/censuslogo.htm (accessed on 10 June 2019).
  33. Flammini, M.G.; Prettico, G.; Julea, A.; Fulli, G.; Mazza, A.; Chicco, G. Statistical characterisation of real transaction data gathered from electric vehicle charging stations. Electr. Power Syst. Res. 2019, 166, 36–150. [Google Scholar] [CrossRef]
  34. EV30@30 Campaign Document. Available online: https://www.iea.org/media/topics/transport/3030CampaignDocumentFinal.pdf (accessed on 5 August 2019).
  35. European Alternative Fuel Observatory. Available online: https://www.eafo.eu/ (accessed on 20 June 2019).
Figure 1. DiNeMo platform input, core module, and output structure.
Energies 12 04079 g001
Figure 2. Varaždin city center Open Street Map image.
Energies 12 04079 g002
Figure 3. Network image of Varaždin city center in DiNeMo.
Energies 12 04079 g003
Figure 4. Varaždin industrial area-Open Street Map image.
Energies 12 04079 g004
Figure 5. Network image of Varaždin industrial area in DiNeMo.
Energies 12 04079 g005
Figure 6. Bus voltage deviation in Varaždin urban area with 0% of electric vehicle service equipment (EVSE) (a) and with 10% of EVSE (b).
Energies 12 04079 g006
Table 1. Distribution system operators’ (DSOs) indicators.
IndicatorAverage ValueMedian ValueMin ValueMax Value
1. Number of LV consumers per MV consumers671401221946
2. LV circuit length per LV consumer (km/LV consumer)0.030.0250.0120.16
3. LV underground ratio (%)66751199
4. Number of LV consumer per MV/LV substation867617230
5. MV/LV substation capacity per LV consumer (kVA/LV consumer)4.763.882.113
6. MV circuit length per MV supply point (km/MV supply point)1.061.040.541.77
7. MV underground ratio (%)596110100
8. Number of MV supply points per HV/MV substation15512733460
Table 2. Typical transformation capacity indicators.
Indicator 9.Common Values
Typical transformation capacity of MV/LV secondary substation in urban areas (kVA)400,630,1000
Typical transformation capacity of MV/LV secondary substation in rural areas (kVA)50,100,250,400,630
Table 3. Comparison of indicators for city center.
IndicatorDSO_U_Varaz DiNeMo_U_VarazDSO_CroatiaDiNeMo_Croatia
1. Number of LV consumers per MV consumers72379110771213
2. LV circuit length per LV consumer (km/LV consumer)0.0200.0180.0410.015
3. LV underground ratio (%)46%39%30%29%
4. Number of LV consumer per MV/LV substation90.99692.5107
5. MV/LV substation capacity per LV consumer (kVA/LV consumer)5.225.573.695.64
6. MV circuit length per MV supply point (km/MV supply point)0.901.121.481.2
7. MV underground ratio (%)62%95%43%97%
8. Number of MV supply points per HV/MV substation693310537
Table 4. Typical transformation capacity comparison for city center.
IndicatorDSODiNeMo
9. Typical transformation capacity of MV/LV secondary substation in urban areas (kVA)630400, 630
Table 5. Comparison of indicators for industry area.
IndicatorDSO_S_Var DiNeMo_S_Varaz
1. Number of LV consumers per MV consumers723672
2. LV circuit length per LV consumer (km/LV consumer)0.0200.013
3. LV underground ratio (%)46%41%
4. Number of LV consumer per MV/LV substation90.9106
5. MV/LV substation capacity per LV consumer (kVA/LV consumer)5.225.52
6. MV circuit length per MV supply point (km/MV supply point)0.900.90
7. MV underground ratio (%)62%51%
8. Number of MV supply points per HV/MV substation6925
Table 6. Typical transformation capacity comparison for industry area.
IndicatorDSODiNeMo
9. Typical transformation capacity of MV/LV secondary substation in urban areas (kVA)630630,1000
Table 7. DiNeMo input parameters.
Number of consumers per building1357
Percentage %24.3464.519.711.44

