Abstract
With the continuous development of smart distribution networks, their observable problems have become more serious. Research on the optimal placement of the distribution phasor measurement unit (D-PMU) is an important way to improve the measurability, observability and controllability of a smart distribution network. In this paper, the optimal D-PMU placement methods and implementation technology were studied to determine the optimal D-PMU placement scheme. Considering the bus vulnerability index and the different operating states of the system, the more practical one-time optimal placement methods to ensure complete system observability was proposed. On this basis, the system’s measurement redundancy and unobservable depth were considered to realize the multistage optimal D-PMU placement. The corresponding mathematical model and solution flow were given. Then the implementation technology of the methods was studied and the optimal D-PMU placement assistant decision-making software for smart distribution network was developed. Thereby, the structure and requirements of different distribution networks can be satisfied. The application analysis, functional architecture and the overall design process were given. Finally, the methods and software were analyzed by using the IEEE 33 bus system and an actual project, the Guangzhou Nansha Yuan’an Substation. The verification results showed that the method and software mentioned in this paper can provide convenient and quick operation for optimal D-PMU placement, improve the efficiency of smart distribution network planning work, and promote the theoretical application level of smart distribution network planning results.
1. Introduction
With the development of power electronics technology and the continuous growth of power loads, the scale of distribution networks is increasing and their structures are becoming more complex [1]. The large-scale access of distributed generation (DG) and the rapid increase of flexible loads such as electric vehicles have transformed the traditional distribution network into a smart distribution network with complex electrical quantities, insufficient single measurement information, and inaccurate measurement, making its considerable problems are more serious [2]. Facing the strategic goal of building a ubiquitous electric internet of things it is necessary for its state to be fully perceived, information to be processed efficiently, and applications made easy and flexible. In the process of the development of the informatization, automation, and interaction of smart distribution networks, improving the measurability, observability and controllability of smart distribution networks has become an important problem to be solved urgently.
To accommodate the DGs and flexible loads, the need for monitoring and analysis of distribution system behavior in real time is growing. However, the existing supervisory control and data acquisition (SCADA) systems cannot readily meet the need for precision and real-time performance [3]. The sampling period of SCADA is longer and it cannot provide the phase angle data directly [4]. The emergence of phasor measurement units (PMUs) solves this problem. PMUs have become the most effective technical means for observing and recording the dynamic process of systems because of their synchronism and speed. They have been rapidly developed around the world [5]. However, traditional PMUs are only installed in high-voltage substations and main power plants, their optimized placement algorithms are only for high-voltage transmission systems and are no longer suitable in the complex and harsh operating environments of smart distribution networks. Carrying out research on the optimal placement of the distribution phasor measurement units (D-PMUs) to improve the observability of smart distribution networks is an important way to solve the above problems [6].
Compared with traditional PMUs, D-PMUs are mainly improved in the aspect of high-precision synchronous phasor measurement under high noise and strong transient environment conditions, time synchronization technology under weak communication conditions and information security technology [7]. They can realize high-precision measurements under the characteristic environment conditions of strong noise, strong time-variance, and high-frequency transients of power distribution networks caused by strong transient sources and load access such as large-scale distributed power supplies and electric vehicles. For the weak communication environment of the smart distribution network, the hybrid network with wired and wireless combination is used for synchronous timing, which effectively solves the problem of time-to-network synchronization of large-scale D-PMU applications in complex smart distribution network environments. D-PMUs reduce the security risks of satellite timing and communication methods in smart distribution networks, improve the problem of phasor measurement and communication vulnerability to soft attacks, and enhance the security of measurement information. Compared with SCADA, the D-PMU devices based on a wide area measurement system (WAMS) will greatly improve the observability of smart distribution networks and the technology improves the performance of various on-line applications, including overcurrent protection [8], model parameter calibration [9], fault detection and location [10,11], stability assessment [12], system damping control [13], wide-area protection [14], etc.
As a part of the digital power system, the D-PMU provides fast, accurate and reliable measurement data such as voltage and current phasors with higher sample rates [15]. When the voltage phasor of a bus can be measured directly or calculated indirectly, the bus is called an observable bus, otherwise it is an unobservable bus. When all the buses of the distribution network are observable, the network is called an observable network [16]. If a D-PMU is installed on each bus, the network is fully observable. However, it is unnecessary to install D-PMU at each bus in the power system since a D-PMU can make more than one bus observable. Besides, a full deployment of D-PMUs in the network is not feasible and realistic considering the redundancy of system measurement data and the cost of investment operation and maintenance [17]. Optimal D-PMU placement refers to finding out the most representative location and placing a PMU on it. Around the theme of improving the level of observability, the main goals of OPP include minimizing the number of PMUs required, maximizing measurement redundancy and handing contingency constraints [17,18]. The minimum number of PMUs can guarantee the economics of the scheme. The main purpose of improving network measurement redundancy is to improve the accuracy of state estimation.
Taking into account the constraints in the actual project, the optimal D-PMU placement is divided into one-time optimal placement and multistage optimal placement. In the existing literature, the one-time optimal PMU placement model is divided into two types. One that is to realize complete observability of the distribution network only by configuring the PMU [19]. Although the number of configured D-PMUs may increase, the system is guaranteed to be observable in real time and the observed data is highly accurate. Another optimal PMU placement considers conventional measurements like power flow measurements and injection measurements which already exist in SCADA systems [20,21]. The number of configured PMUs is reduced to a certain extent, but since the SCADA system can only provide low-sampling rate and non-real-time data in steady state, the system may not be observable in real time and has low precision. Most of the above two models are equivalent to each bus in the optimal PMU placement, and the differences between buses are not considered. The distribution network realizes observable completely by only one-time configuration, which is not economical [22].
Some scholars have studied multistage optimal PMU placement. In [23], the segmentation iterative method was used to study the optimal placement of PMUs. It is assumed that all buses are equipped with PMUs, and a three-stage iterative algorithm is used to eliminate the buses that are not required to realize complete observability. Reference [24] proposed a multistage optimal PMU placement method that considers measurement redundancy, and divided the optimal PMU placement into two stages. The first stage ensures that the system is observable completely, the second stage guarantees that doesn’t lose the ability to observe the system in the case of branch N-1 failure. The above two methods are also aimed toward a one-time configuration to realize complete observability, which can be applied to a smaller system, but when applied to a large-scale distribution network system, the economy is still poor.
The existing optimal PMU placement methods mainly use mathematical methods or heuristic algorithms for optimization. The results obtained by mathematical methods must be the optimal solution, but the processing speed is relatively slow and has certain limitations. As described in [25], the unconstrained nonlinear weighted least squares (WLS) method was proposed to solve the optimal PMU placement problem. Reference [26] proposed an analytical framework for cost/benefit analysis of optimal PMU placement problems, the economic and existing technical issues were considered to determine the optimal number and location of PMUs. In [27], a PMU positioning model considering the observability requirement was proposed. The position of the PMUs was considered as the segmentation time span, and the optimal solution was considered according to a set of probability criteria. Heuristic algorithms offer great improvements in both computational time and space, but the degree of deviation between the feasible solution and the optimal solution cannot be anticipated. Reference [28] proposed an optimal PMU placement method based on a genetic-simulated annealing algorithm, which improved the optimization ability, realized the dimensionality reduction search, and increased the search efficiency. Reference [29] proposed a new parallel tabu search to solve optimal PMU placement problems and shorten the processing time. In [30], the simulated annealing algorithm was used to solve the optimal PMU placement problem, which led to an adaptive cloning concept and improved the processing speed.
The network topology of the distribution network can be improved to obtain the optimal PMU placement scheme. Reference [31] combined the radial network structure of the distribution network, and proposed an optimal PMU placement method suitable for large-scale distribution networks by dividing them into a main network and subnets. In [32], the problem of optimal PMU placement in a distribution network considering network replacement was studied, and the ant colony optimization algorithm was used to realize system reconstruction to solve the problem of minimum loss. Reference [17] proposed a network compression method based on pre-placement and existing measurements to reduce the number of candidate PMU locations.
At present, the optimal D-PMU placement is mostly performed by selecting a certain algorithm to write a program for simulation calculation, thereby determining the optimal placement number of the D-PMUs and their placement position. Although the optimal placement scheme can also be obtained, the operation is complicated and the function is singular. Therefore, solving the users’ accessibility is a key issue. The development of the optimal D-PMU placement assistant decision-making software for smart distribution networks can meet the needs of different target users, and the graphical user interface can provide users with convenient and fast operation. At present, there is much mature software which is used in the planning and design field of power systems in China. Most of these planning assistant decision-making software programs are aimed at the planning problem of urban power grids [33,34,35], and the corresponding planning assistant decision-making software has not been used to optimize the placement of D-PMUs.
In this paper, the optimal D-PMU placement method and the implementation technology of software in smart distribution network are studied, and a basic mathematical model and solution method of a one-time and multistage optimal placement algorithm are proposed. Combined with the development and implementation of the optimal D-PMU placement assistant decision-making software for smart distribution networks, the functional architecture, design ideas and specific module design of the software system are given. The corresponding case analysis is carried out.
The main objectives of this paper are as follows:
- (1)
- Aiming at solving the problem of equivalent processing of each bus in the current optimal D-PMU placement research, the one-time optimal D-PMU placement method considering bus differences is proposed. This paper uses entropy method, analytic hierarchy process, TOPSIS and grey correlation degree algorithm to calculate the comprehensive vulnerability index of different buses in the smart distribution network as the bus weight in the optimal D-PMU placement model. On this basis, the zero injection bus information, the system’s observability and operating status are considered to realize one-time optimal D-PMU placement.
- (2)
- On the basis of the one-time optimal D-PMU placement, taking into account the constraints of funds or construction progress in the actual construction of the power grid, a multistage optimal D-PMU placement method based on reducing the unobservable depth of the system step by step is proposed The depth-first search algorithm is used to calculate the unobservable depth of the system. At the same time, the measurement redundancy of the system is considered, the optimal D-PMU placement sequence is obtained to make D-PMU work best at every stage. This method is more suitable for large-scale distribution network systems that cannot be observable completely at one time.
- (3)
- Based on the methods proposed in this paper, an optimal D-PMU placement assistant decision-making software adapted to the current different smart distribution network levels is designed and developed. The one-time and multistage D-PMU placement schemes with different placement requirements can be generated and the effect is demonstrated, providing a more convenient and practical operating platform for optimal D-PMU placement.
2. Optimal D-PMU Placement Model and Solving Algorithm
The core of the optimal D-PMU placement problem is to find the scheme with the minimum number of D-PMUs needed to obtain the maximum measurement redundancy. At present, for the optimal D-PMU placement based on topology information, most scholars only consider the one-time optimal placement during normal operation of the system and treat each bus equally in the optimization process. Such a method is not suitable for practical engineering. This paper considers the bus vulnerability index and different operating conditions of the system, realizes the one-time optimal D-PMU placement, and the multistage placement is implemented by reducing the unobservable depth of the system step by step.
2.1. One-Time Optimal D-PMU Placement
For a distribution network system with n buses, the core of the one-time optimal D-PMU placement problem is to determine the minimum number of D-PMU and the optimal placement location to achieve completely observable of system, which is:
where: is the bus weight, which is the comprehensive vulnerability index of the bus, its detailed definition is as in Section 2.2. is a binary coded formal variable, which is defined as shown in formula (2). represents the column vector formed by all buses of the system, is the observability vector of each bus of the system, and matrix is the system bus association matrix, where is defined as shown in Equation (3):
When the D-PMU placement concerns zero injection buses and existing measurements, the number of configured D-PMUs can be reduced. If a D-PMU is already configured in the network, one only needs to set the decision variable of the bus to 1 before optimization. For a zero injection bus, if bus 5 is a zero injection bus, and its associated buses are 1, 2, 3, 4, the set of zero injection bus and its connected buses can be set to . As long as one of the buses is unobservable, an unobservable bus can be made observable by calculation under the condition that other buses are observable, so when considering the effects of zero injection buses, the model constraint is modified to the following form:
where is a binary variable. When it is equal to 1, it means the bus j can be made observable according to the measured data of the adjacent zero injection bus i. When it is equal to 0, it indicates that the bus j cannot be made observable. Where is also a binary variable, a value of 1 indicates that the bus i is a zero injection bus, and a value of 0 indicates that the bus i is a non-zero injection bus.
Because smart distribution network systems have different wide-area and complexity characteristics and a large number of buses, each bus has different features, so different constraints will occur in the optimal D-PMU placement process. Some buses are important and must be monitored. Such buses need to be configured with D-PMUs, some buses cannot be configured with D-PMUs due to their inherent communication or engineering problems. If a D-PMU is configured only based on the system topology map, it may lead to bus configuration locations that cannot be installed in the actual project. Therefore, it is necessary to add certain constraints to the optimal D-PMU placement model. The set represents the set of all buses for which a D-PMU cannot be configured, and represents the set of all buses that must or have configured D-PMUs. The constraints can be expressed as:
In the operation of the smart distribution network system, some buses have lower requirements and only need to be observable during normal operation, but some buses play a key role in grid security, and these buses must still be observable in the condition of the line N-1 or the D-PMU N-1.
(1) The system is running normally
When the power system is in normal operation, the set of D-PMU buses is H1, and the set of buses associated with bus i is Pi. According to the definition of bus observability, the constraints are as follows:
(2) Line N-1
When line N-1, the set of buses that are required to be observable is H2, the set of buses connected to only one line of bus i is P1, and the set of buses connected with two or more lines of bus i is P2. It can be known from the definition of bus observability that one of the following conditions must be met for bus i to satisfy line N-1 observable:
- ①
- Bus i has D-PMU installed.
- ②
- At least two buses in the P1 are installed with D-PMU.
- ③
- At least one bus in the P2 is equipped with a D-PMU.
The constraints can be expressed as follows:
(3) D-PMU device N-1
When any D-PMU in the system fails, it is required that the system still be observable at this time. This problem is a device N-1 problem. Let H3 be the set of buses that need to be observable when any D-PMU in the system fails. P is the set of buses associated with bus i. It can be known from the definition of bus observability that one of the following conditions must be met for bus i to satisfy D-PMU device N-1 observable:
- ①
- At least bus i and one bus in P are installed with D-PMU.
- ②
- At least two buses in P are installed with D-PMU.
The constraints can be expressed as follows:
It can be seen from the above analysis that when the bus i is observable in the case of the D-PMU device N-1, it is inevitably observable in the case of the line N-1.
In summary, the mathematical model of the one-time optimal D-PMU placement is as shown in Equation (9):
where is the constraints of the operating state of the system, which is composed of the Equations (6)—(8), and the corresponding constraints can be selected according to different requirements.
2.2. Bus Vulnerability Index
The bus vulnerability index is used to characterize the importance of the bus in the system and is used as the bus weight in the model of optimal D-PMU placement. When the bus vulnerability index is set for the distribution network, it should be analyzed from the perspective of the static angle of the distribution network. The four degrees of bus degree, cohesion, mediation, tightness are used to measure the bus vulnerability index in this paper:
- (1)
- Bus degree d1. The bus degree indicator reflects the strength of the connection between the bus and other buses through the number of edges connected to the bus. The greater the degree, the greater the impact on nearby buses and the more vulnerable the bus. Due to the radial structural characteristics of the distribution network, many buses have the same degree, so the description of the degree is not comprehensive enough:where di1 represents the degree of bus i and L is the total number of branches.
- (2)
- Bus cohesion d2. In the weighting model of the distribution network, the bus cohesion is defined as:where C = 1/(np) is the degree of cohesion before the contraction of the bus i, n is the number of buses, p is the average shortest path of the network, and Ci is the degree of cohesion after the contraction of the bus i, which can be calculated similarly to C. di2 can reflect the degree to which the bus is located at the center of the distribution network structure. The larger the di2, the closer the bus i is to the center of the distribution network, and the more vulnerable the bus.
- (3)
- Bus mediation d3. In the unprivileged network model of the distribution network, the median index of the bus i is defined according to the role of the bus in the power transmission position of the distribution network:where j is the equivalent power supply bus, k is the equivalent load bus, njk is the total number of shortest paths between buses j, k, njk(i) is the number of passing bus i in njk. The median index can reflect the direction of tidal current flow in the distribution network. When the median is large, the position of the bus in the tidal current flow of the current state is more important.
- (4)
- Bus tightness d4. In the weighted network model of distribution network, the bus tightness reflects the interaction between the bus and other buses. The tightness index of bus i is defined as:where V and V* respectively represent the set of all buses and the set of neighbors with bus i, is the average value of the distribution network, and pmk is the shortest path length between buses m and k in the distribution network. This definition combines the global and local vulnerability of buses in the distribution network, which can better describe the difficulty of the bus reaching all other buses and the role of the bus adjacent to it.
All of the above indicators can reflect the vulnerability of buses in the distribution network, but they are only described from a single angle and have a certain one-sidedness. Therefore, for the actual power grid, comprehensive consideration should be made from multiple angles to measure bus vulnerability. Using the above four indicators as attributes, the problem can be transformed into a multi-attribute decision problem [36]. This paper combines the entropy method [37] and the analytic hierarchy process (AHP) [38] from the objective and subjective perspectives to weight each indicator to measure the role of each indicator in assessing bus vulnerability. This not only reflects the objective risks existing in the distribution network structure, but also can take into account the judge ability of the expert experience, and can avoid the shortcomings in the evaluation only from subjective or objective aspects.
Entropy can be used to measure the disorder state of the system. The larger the disorder state, the more obvious the difference between the states of the system, and the more unstable the system. So entropy can be used to measure how well an indicator works in describing a bus. The entropy value of indicator j is defined as:
where n is the number of buses and hij is derived from the normalized decision matrix T. The row vector of T is the bus of the smart distribution network topology, and the column vector is the vulnerability index of the bus. If rij is an element of the decision matrix, then . The larger the entropy value, the more stable the system, and the smaller the role of the indicator in the evaluation. Based on this, the entropy value of the index j is processed as follows to obtain the objective weight δ1j as:
where m is the number of single indicators. The greater the objective weight, the greater the difference between the buses under the corresponding indicators, and the greater the role of the indicators in the assessment. It can be seen that the entropy weight measures the difference between the buses under each index from an objective point of view, but from this point of view, the importance of the indicator cannot be fully described. Here, the AHP method is used for evaluation. The AHP method combines qualitative and quantitative analysis to quantify the actual understanding of each indicator. The calculation process of AHP [39] is: First, compare the evaluation indicators in pairs and establish a comparison matrix C. Different from the A.L. Saaty1-9 scale method used in the reference, the comparison of this paper adopts the (0,1,2) three-scale method. That is, the element cij in C can take three values of 0, 1 and 2, and the meanings are that the importance of the index i is smaller, the same, and larger than the index j. Secondly, using the method of [39], the comparison matrix is transformed into a judgment matrix, and the corresponding weights are obtained by consistency test. The subjective weight δ2j of the index j is obtained by standardization processing.
The description of the importance of indicators should be combined with the objective and subjective weights. This paper calculates the comprehensive weight δj of each indicator by the following formula:
The comprehensive weight can combine objective and subjective weights, not only reflect the inherent structural information of the smart distribution network, but also measure the quality of the indicators to make the evaluation more reasonable.
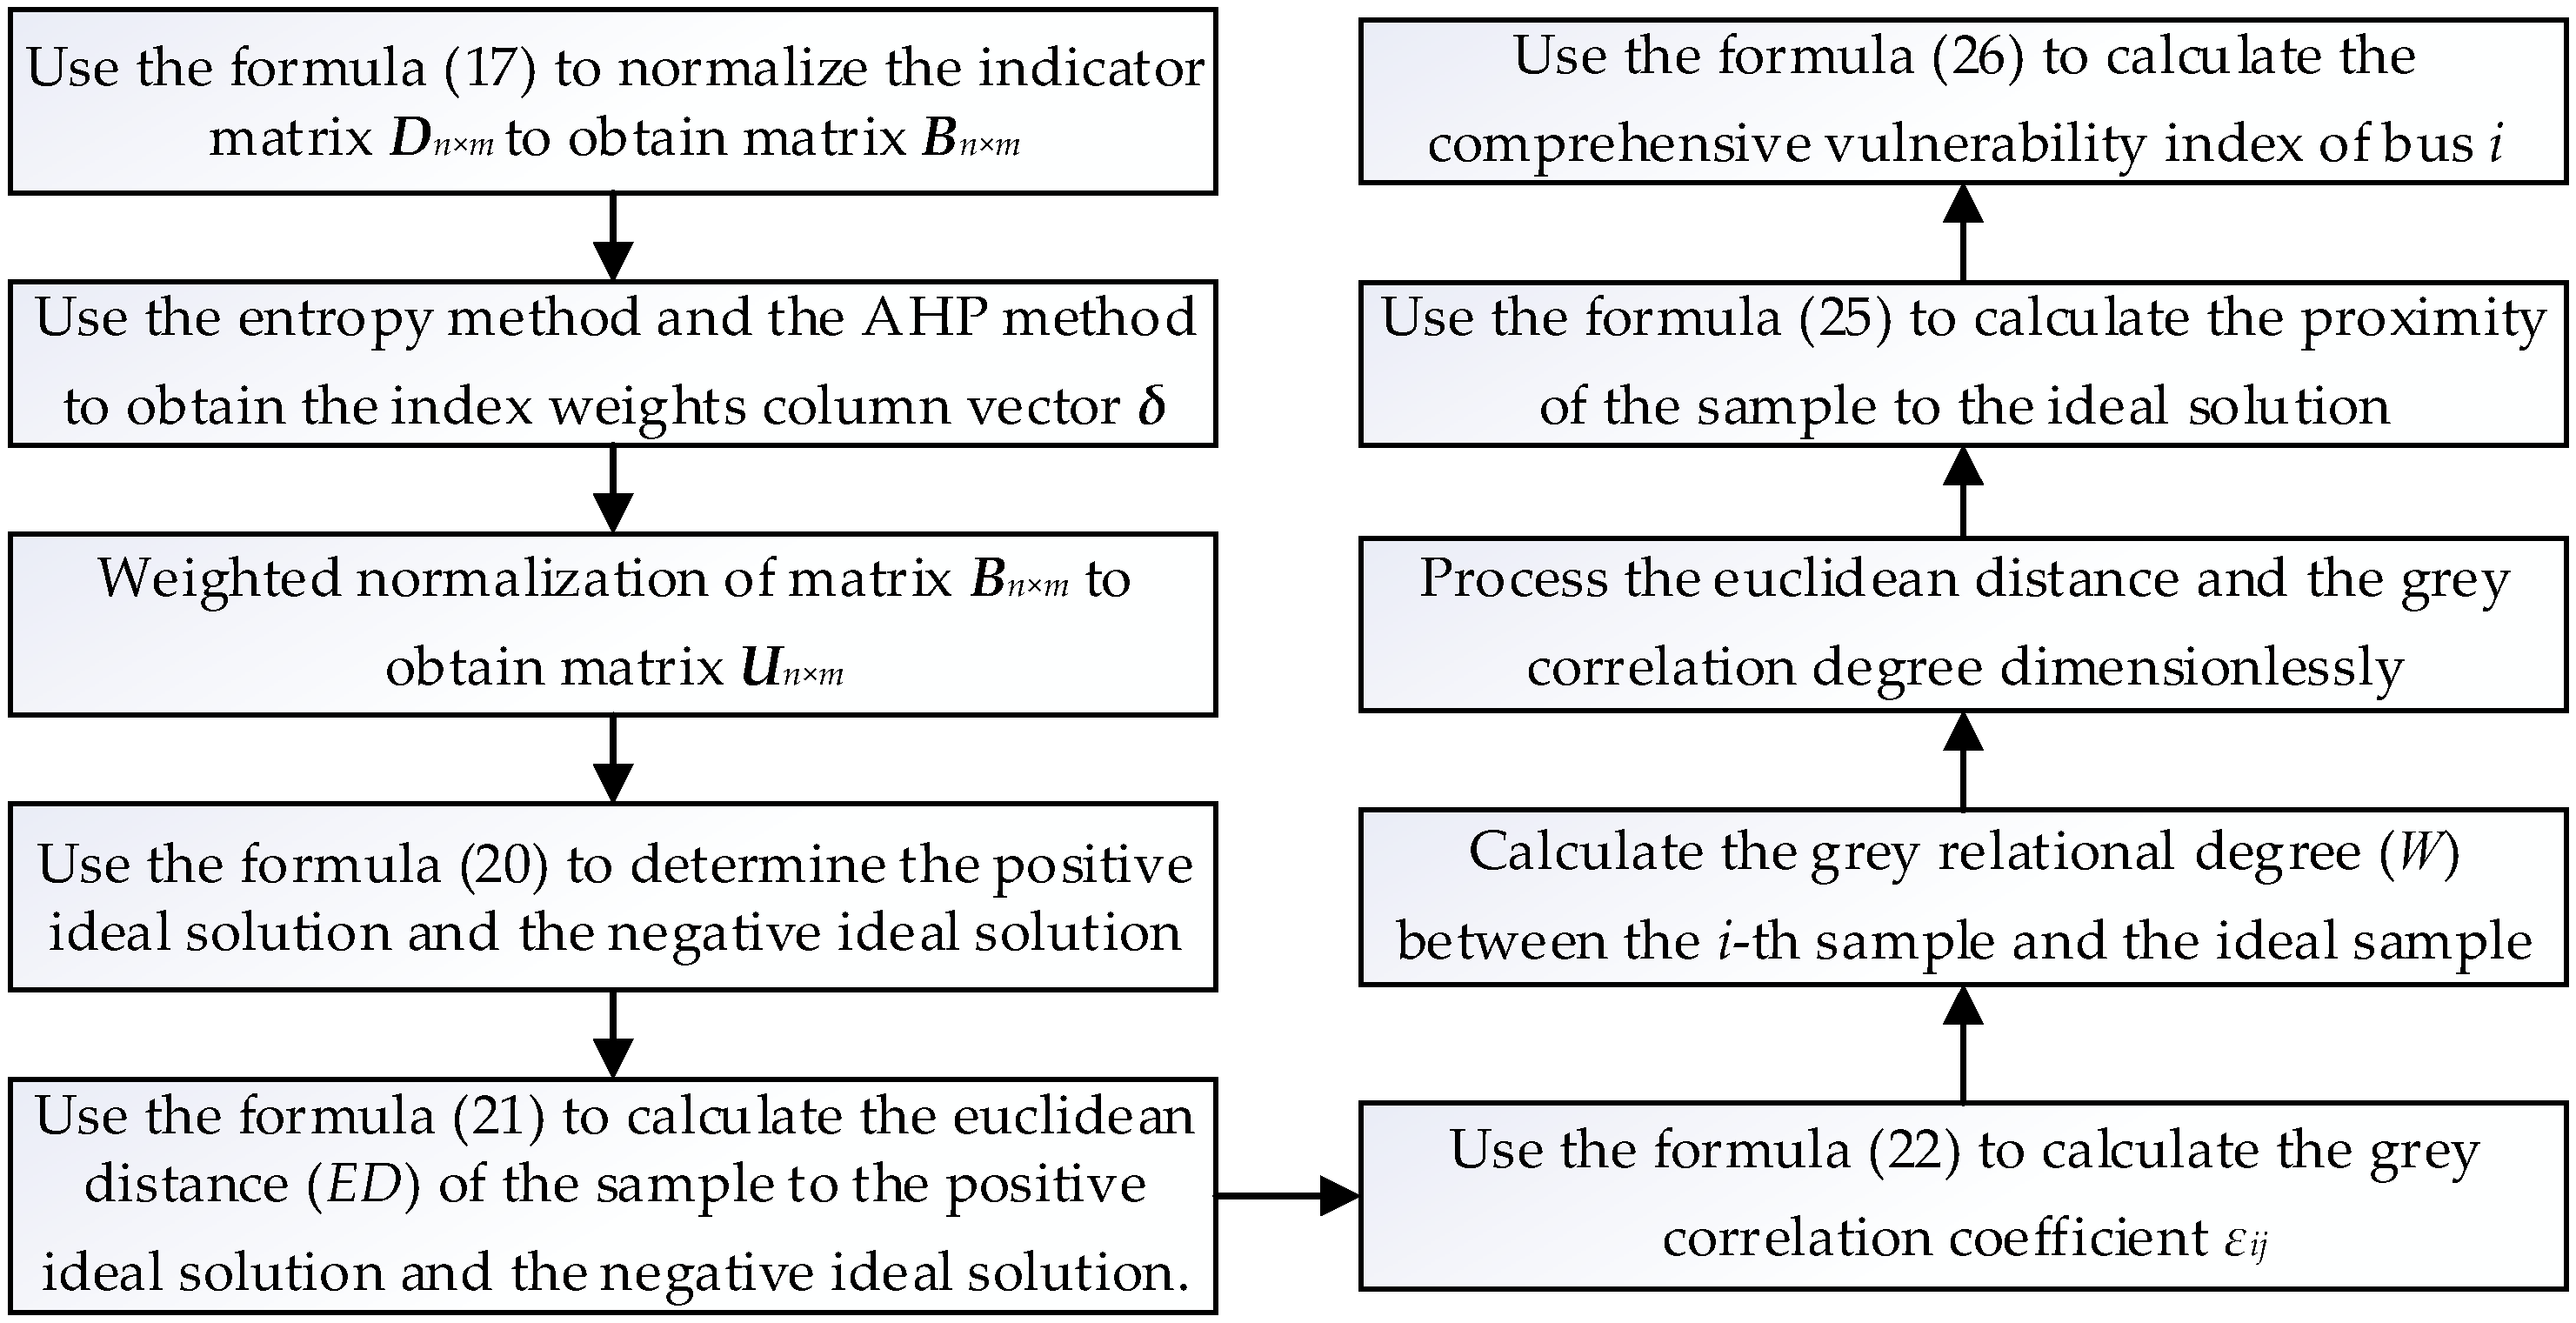
After obtaining the index weights, the combination of TOPSIS algorithm and gray relational analysis algorithm are used to solve the bus comprehensive vulnerability index and use it as the bus weight of the optimal D-PMU placement problem (). The solution steps are as follows:
- (1)
- Normalize the indicator matrix Dn×m containing n buses and m indicators to obtain matrix B:
- (2)
- Use the entropy method and the AHP method to obtain the index weights column vector δ:δ = (δ1, δ2, …, δm)T
- (3)
- Weighted normalization of matrix B to obtain matrix U:U = B·δ = (uij)n×m = (bijδj)n×m
- (4)
- Determine the maximum and minimum values for each indicator set. The positive ideal solution is formed by the maximum value of the forward indicator j+ and the minimum value of the negative indicator j−. The negative ideal solution is formed by the minimum value of the forward indicator j+ and the maximum value of the negative indicator j−:
- (5)
- Calculate the Euclidean distance (ED) of the sample to the positive ideal solution and the negative ideal solution:
- (6)
- Based on the matrix U, calculate the grey correlation coefficient () between the i-th sample and the ideal sample with respect to the j-th index:
- (7)
- Calculate the grey relational degree (W) between the i-th sample and the ideal sample:
- (8)
- Process the Euclidean distance and the grey correlation degree dimensionlessly:where represents , , , , and is the value after the dimensionless process , , , .
- (9)
- Calculate the proximity of the sample to the ideal solution:where and reflect the favor degree of the decision maker for location and shape, and .
- (10)
- Calculate the comprehensive vulnerability index of bus i:
The calculation flow chart of the bus comprehensive vulnerability index is shown in Figure 1.
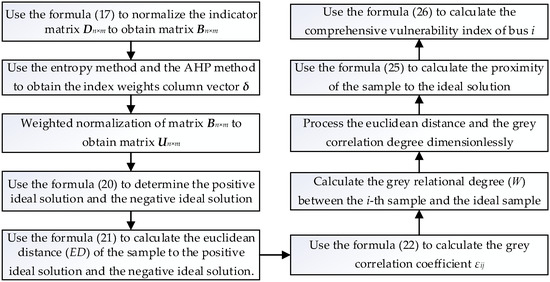
Figure 1.
Calculation flow chart of the bus comprehensive vulnerability index.
2.3. Multistage Optimal D-PMU Placement
When the power company plans the placement of D-PMUs, it is usually necessary to adopt a multistage placement strategy due to the constraints of funding or grid construction progress. In the case of the same number and locations of D-PMUs, the placement schemes of different placement sequences have different improvements in measurement redundancy. The multistage optimal D-PMU placement needs to consider the D-PMUs that have been configured in the previous stage and the D-PMUs that need to be configured in this stage to work together to maximize their effectiveness.
At each stage, the placement problem of the D-PMUs can be described as determining the minimum number of D-PMUs under certain constraints and making the system measurement redundancy as large as possible. The mathematical basic model is as follows:
where p is the number of stages for optimal D-PMU placement. Sk is the state variable of observable condition. When the bus is observable, it takes the value 1, otherwise it takes 0. Xk is the decision variable for configuring the D-PMU in a single phase. When the D-PMU is configured, it takes the value 1, if it is not configured, it takes 0. Sp+1 is the termination state boundary condition of the optimized placement. is a constraint of the model, and its definition is as shown in Equation (30).
The optimal placement scheme at each stage needs to achieve the maximum measurement redundancy. The redundancy of the system represents the number of buses that can be observed by measurement under this placement. The definition of the redundancy indicator R is as follows:
where is the number of current independent measurements.
In the constraint of the multistage placement algorithm, firstly, according to the importance degree of the bus we determine the bus that must be configured. However, some buses are unconditionally configured with D-PMUs due to various factors (such as communication conditions, plant station conditions, engineering construction, etc.), and we also need to add the constraint of unobservable depth.
Unobservable depth is a concept proposed for unobservable buses. It refers to the minimum number of branches (the minimum number of edges in the topology map) required for the unobservable bus i to reach the nearest observable bus in the system with the configured D-PMU, denoted as η. If the bus i is observable, then η(i) = 0. The unobservable depth of the system ηs is the maximum value of η of all buses of the system, expressed as:
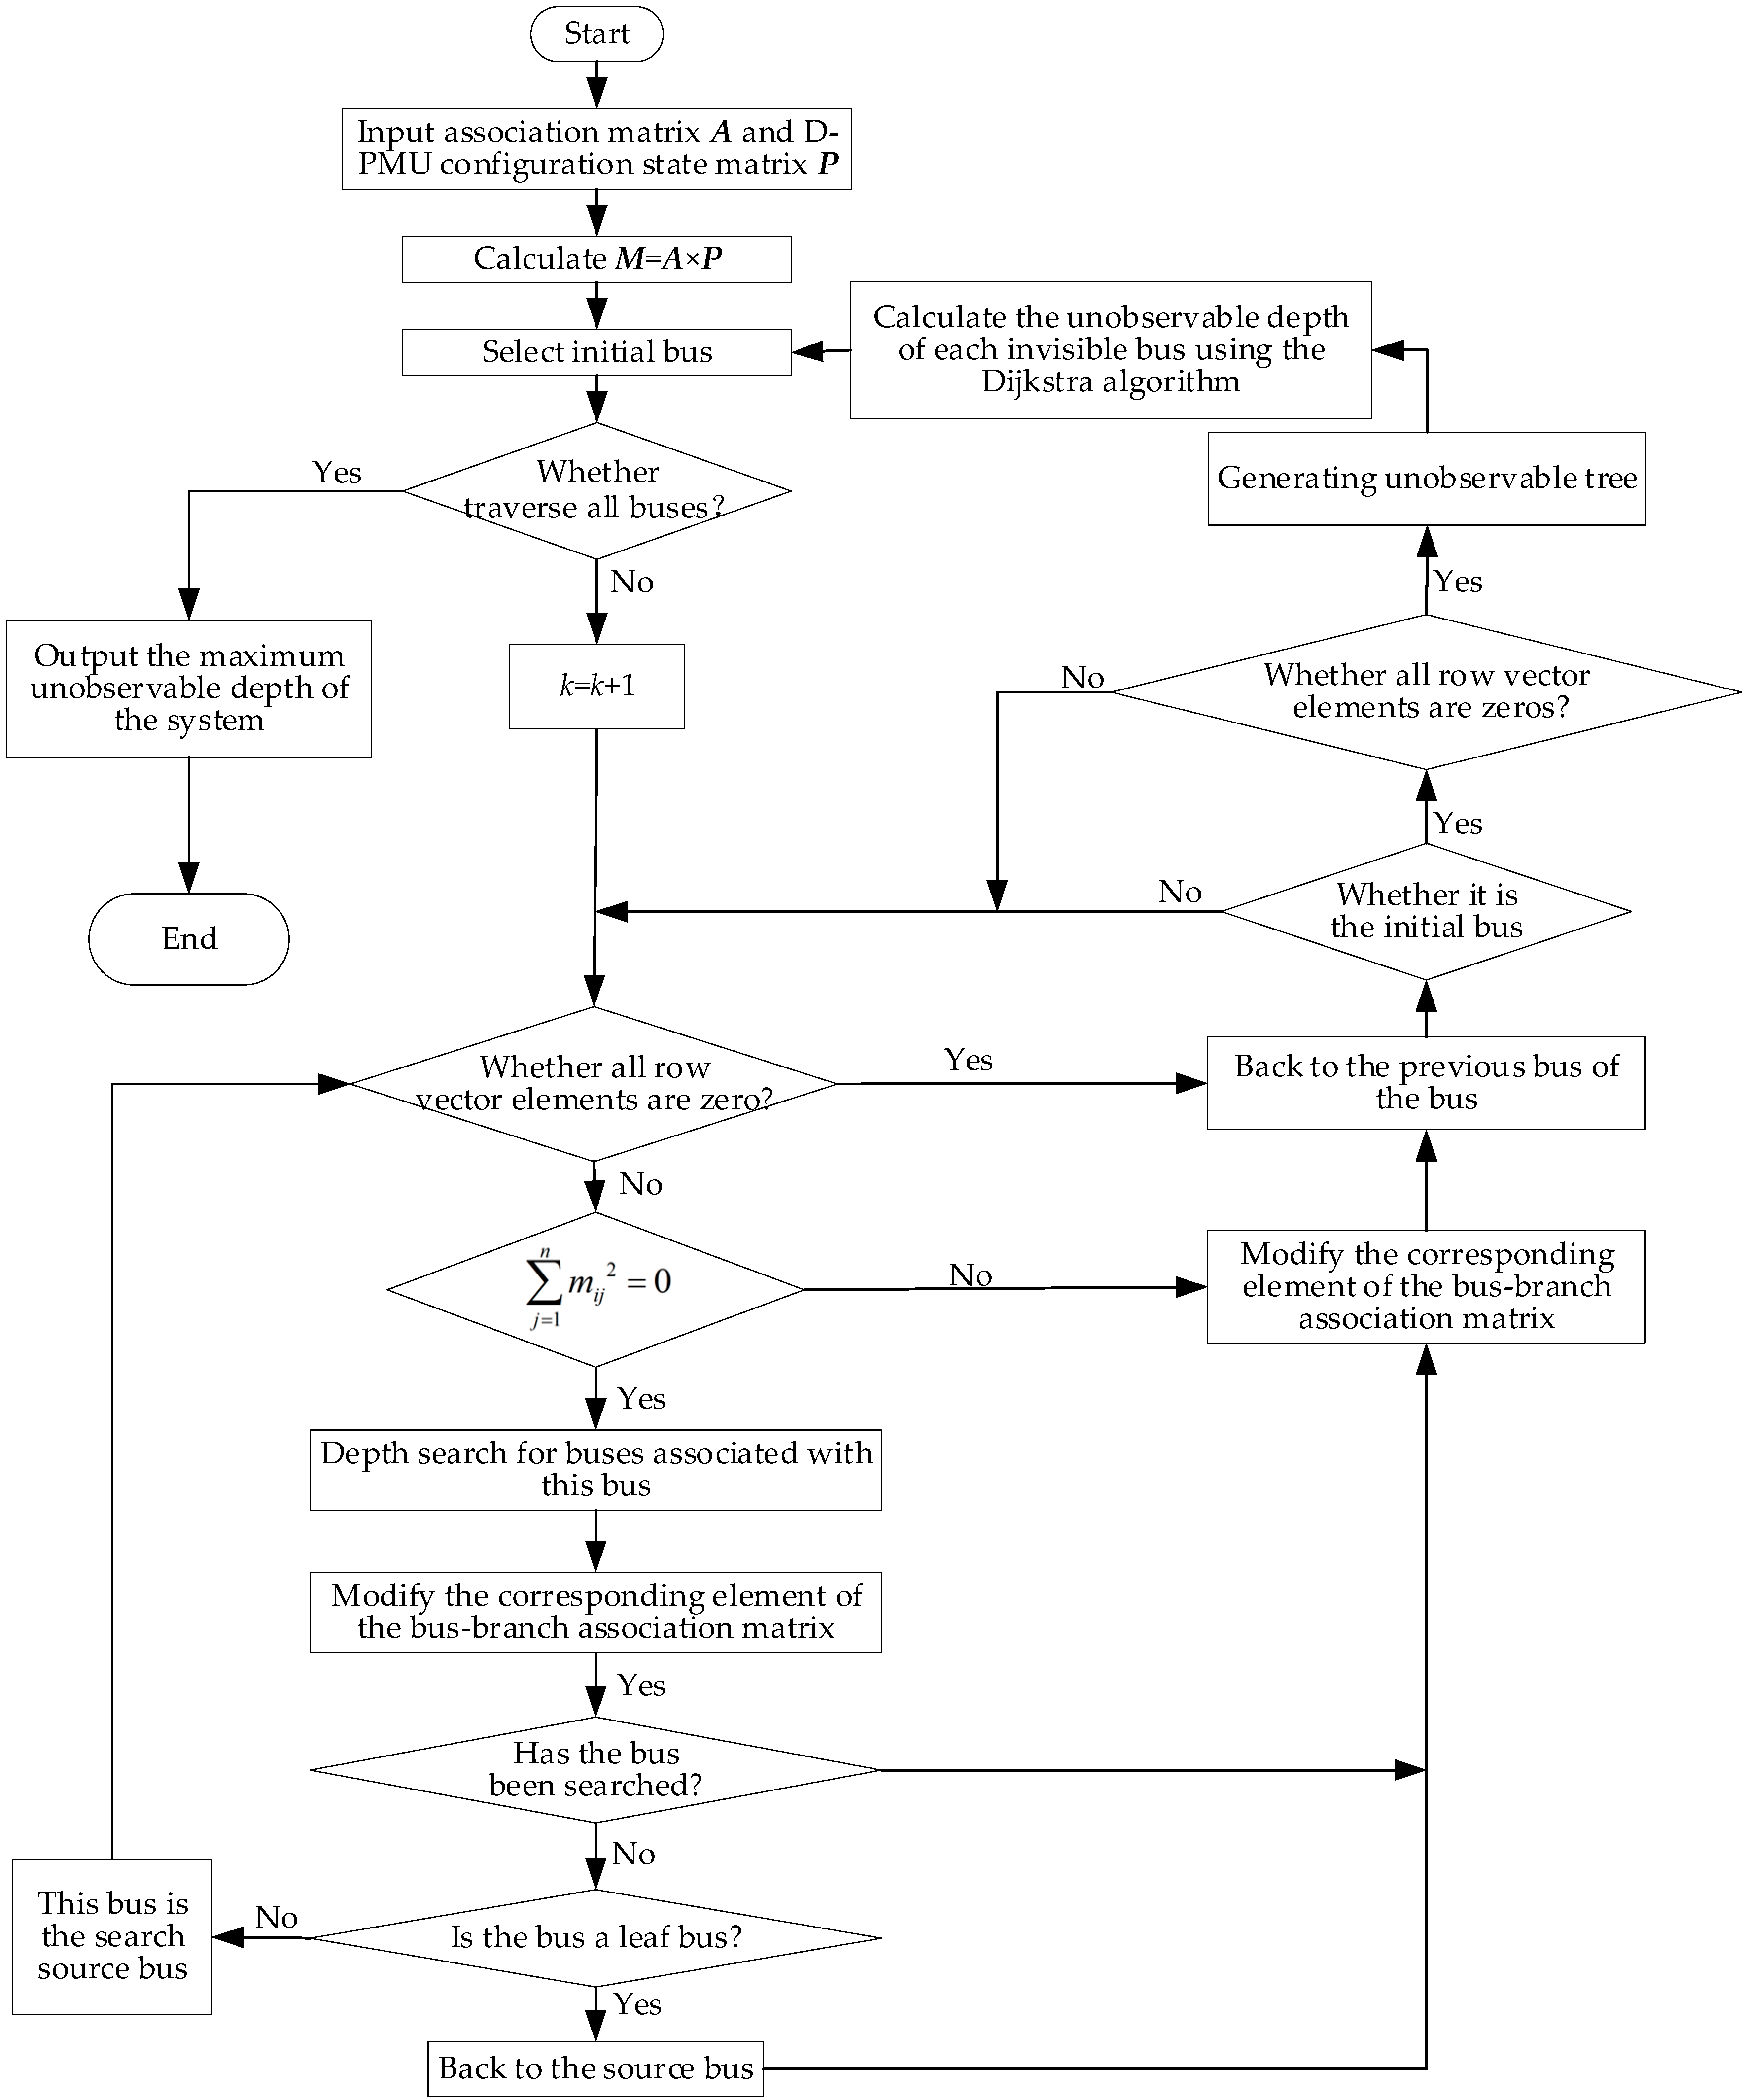
In this paper, the depth-first search algorithm combined with the Dijkstra algorithm is used to calculate the unobservable depth of the system. The input of the algorithm is the state variable Sk and the decision variable Xk, and the output is the unobservable depth η. The detailed calculation process is shown in Figure 2.
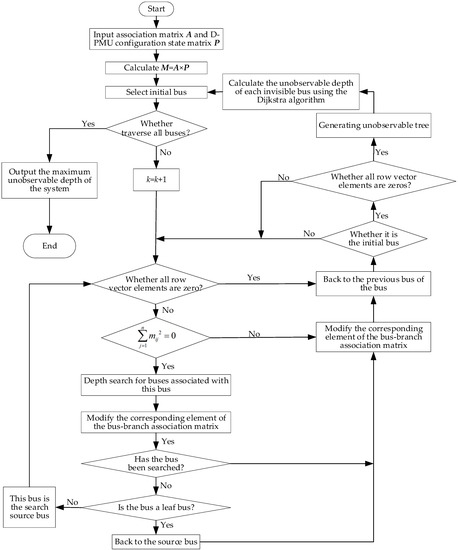
Figure 2.
Flowchart for the calculation of unobservable depth.
The system constraints that consider unobservable depth are:
where O0 is a set of D-PMU buses that are not allowed to be configured; O1 is a set of D-PMU buses that must or have been configured, and Zi is a set of buses that can be connected to bus i only by no more than η + 1 edges. It can be seen from the constraint that as long as there is one bus in which Zi is configured with a D-PMU, the unobservable depth of the bus i does not exceed η.
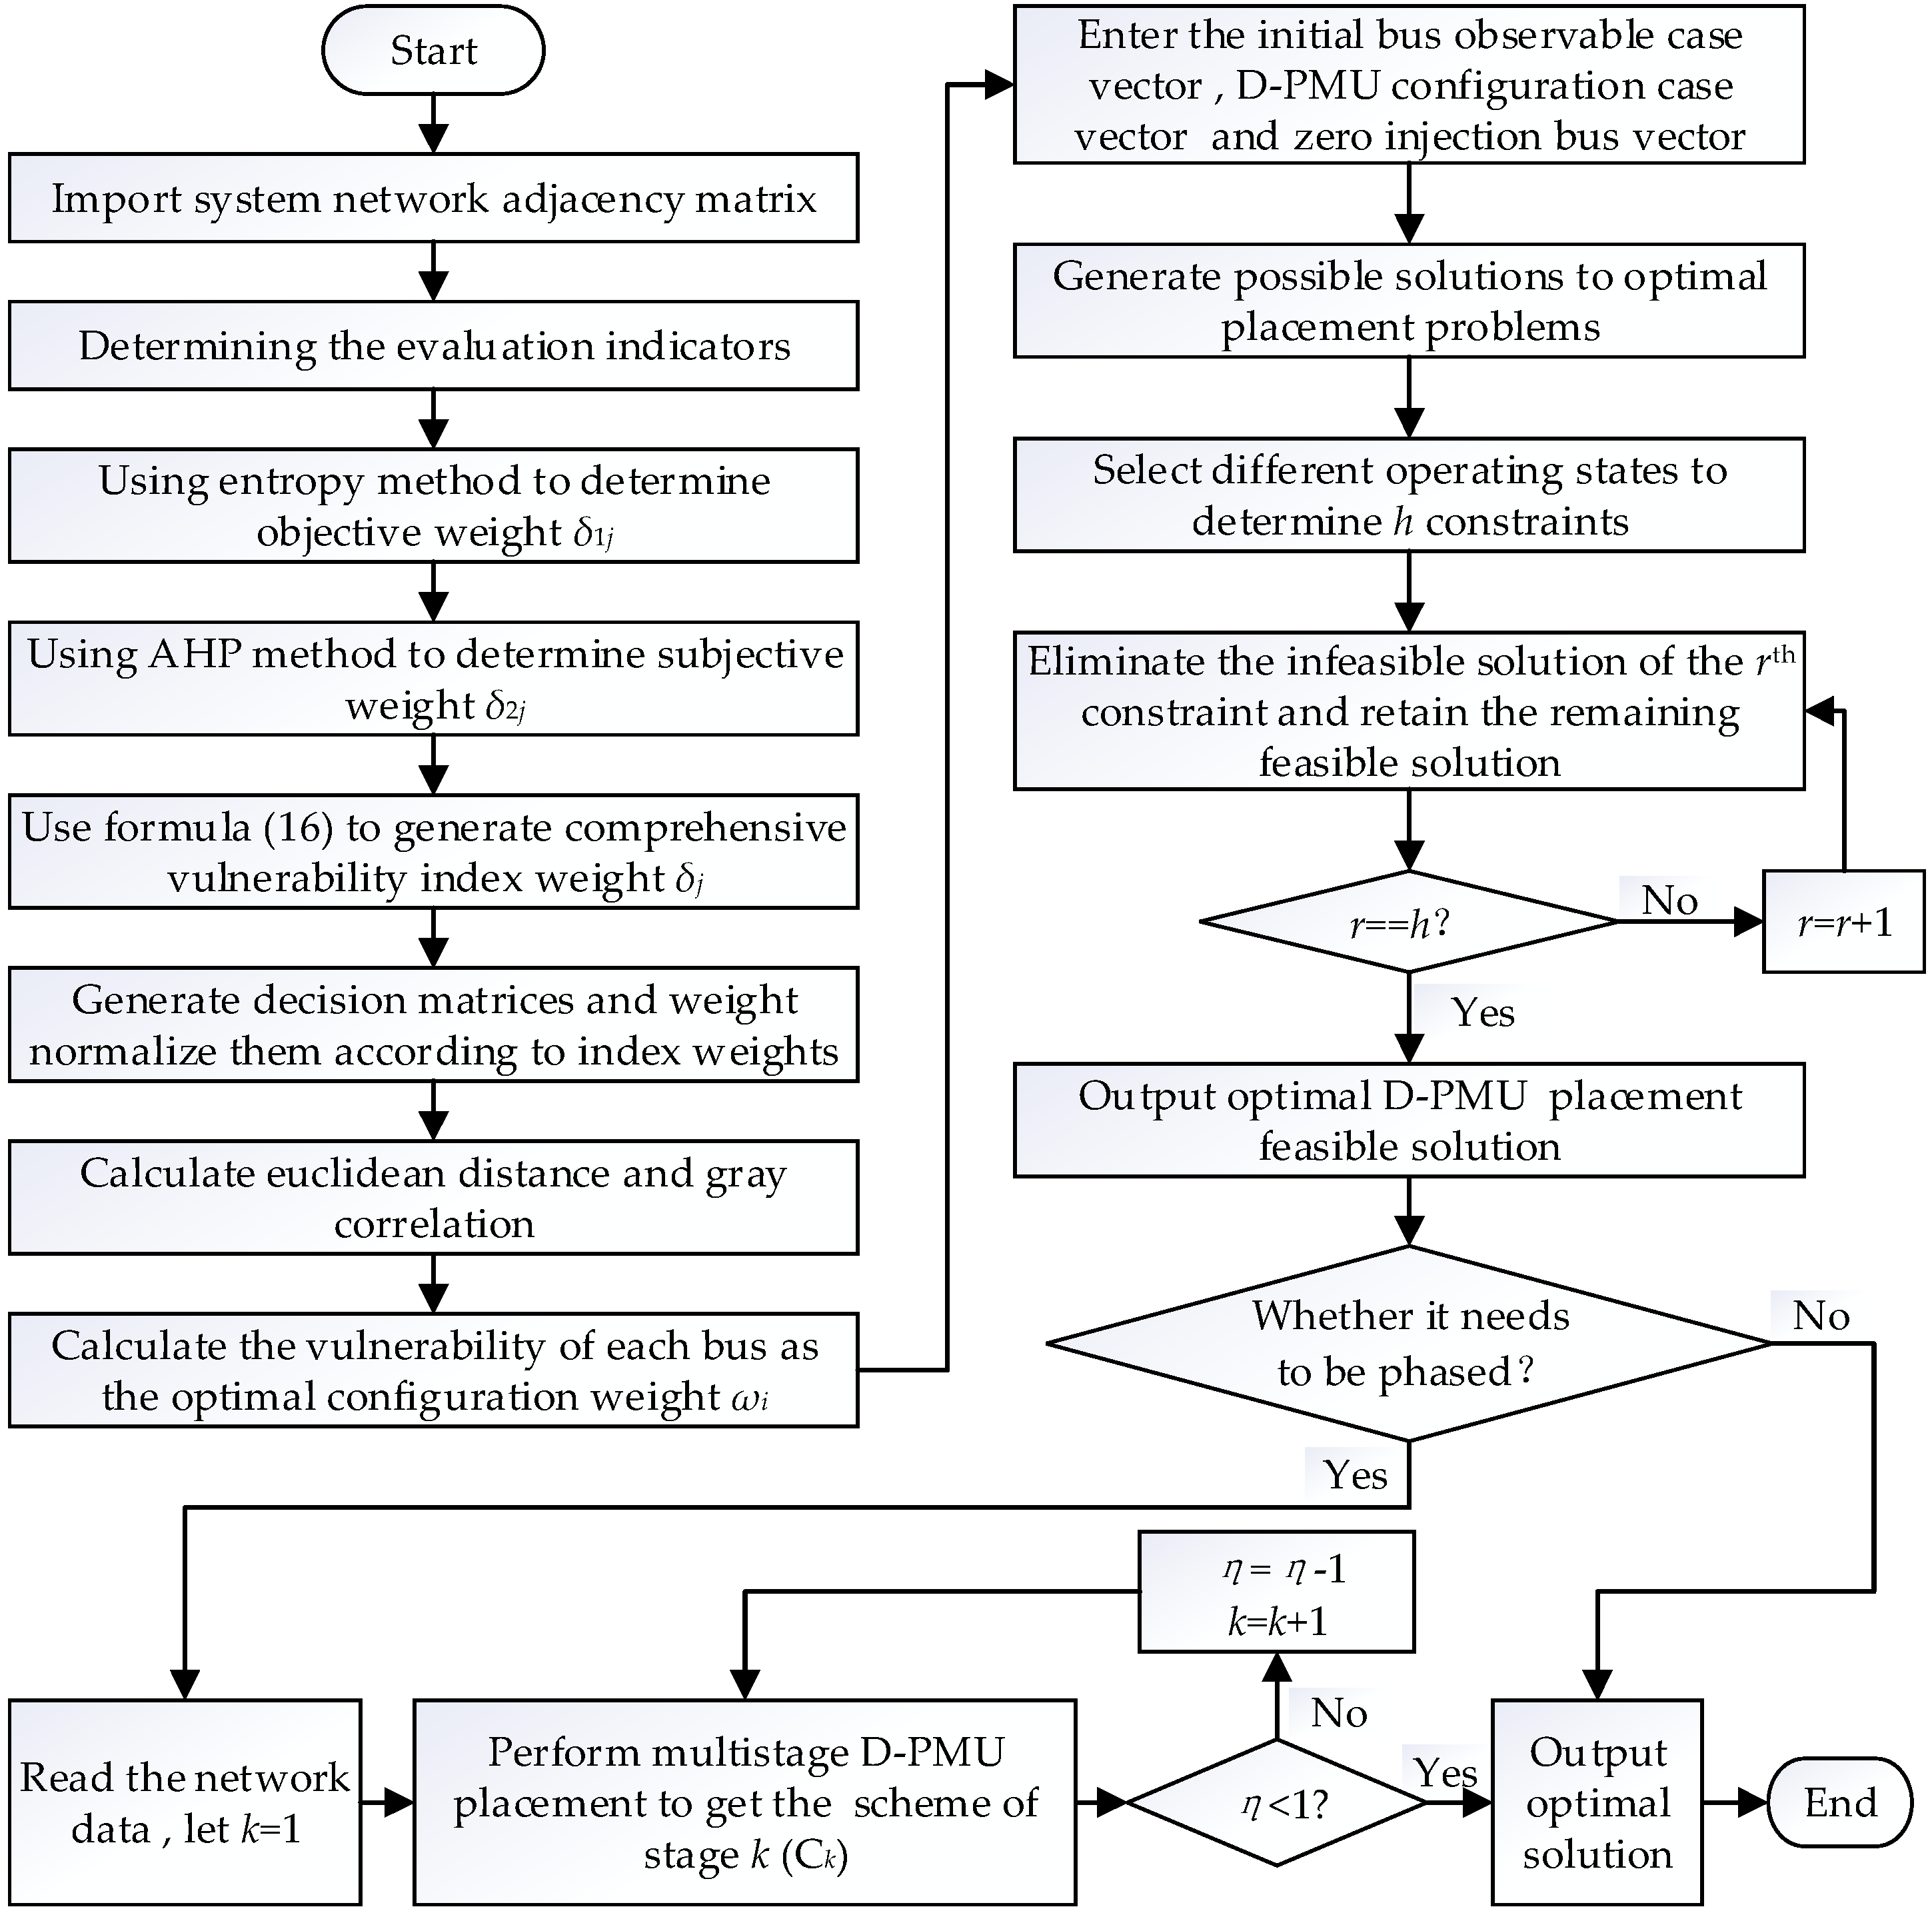
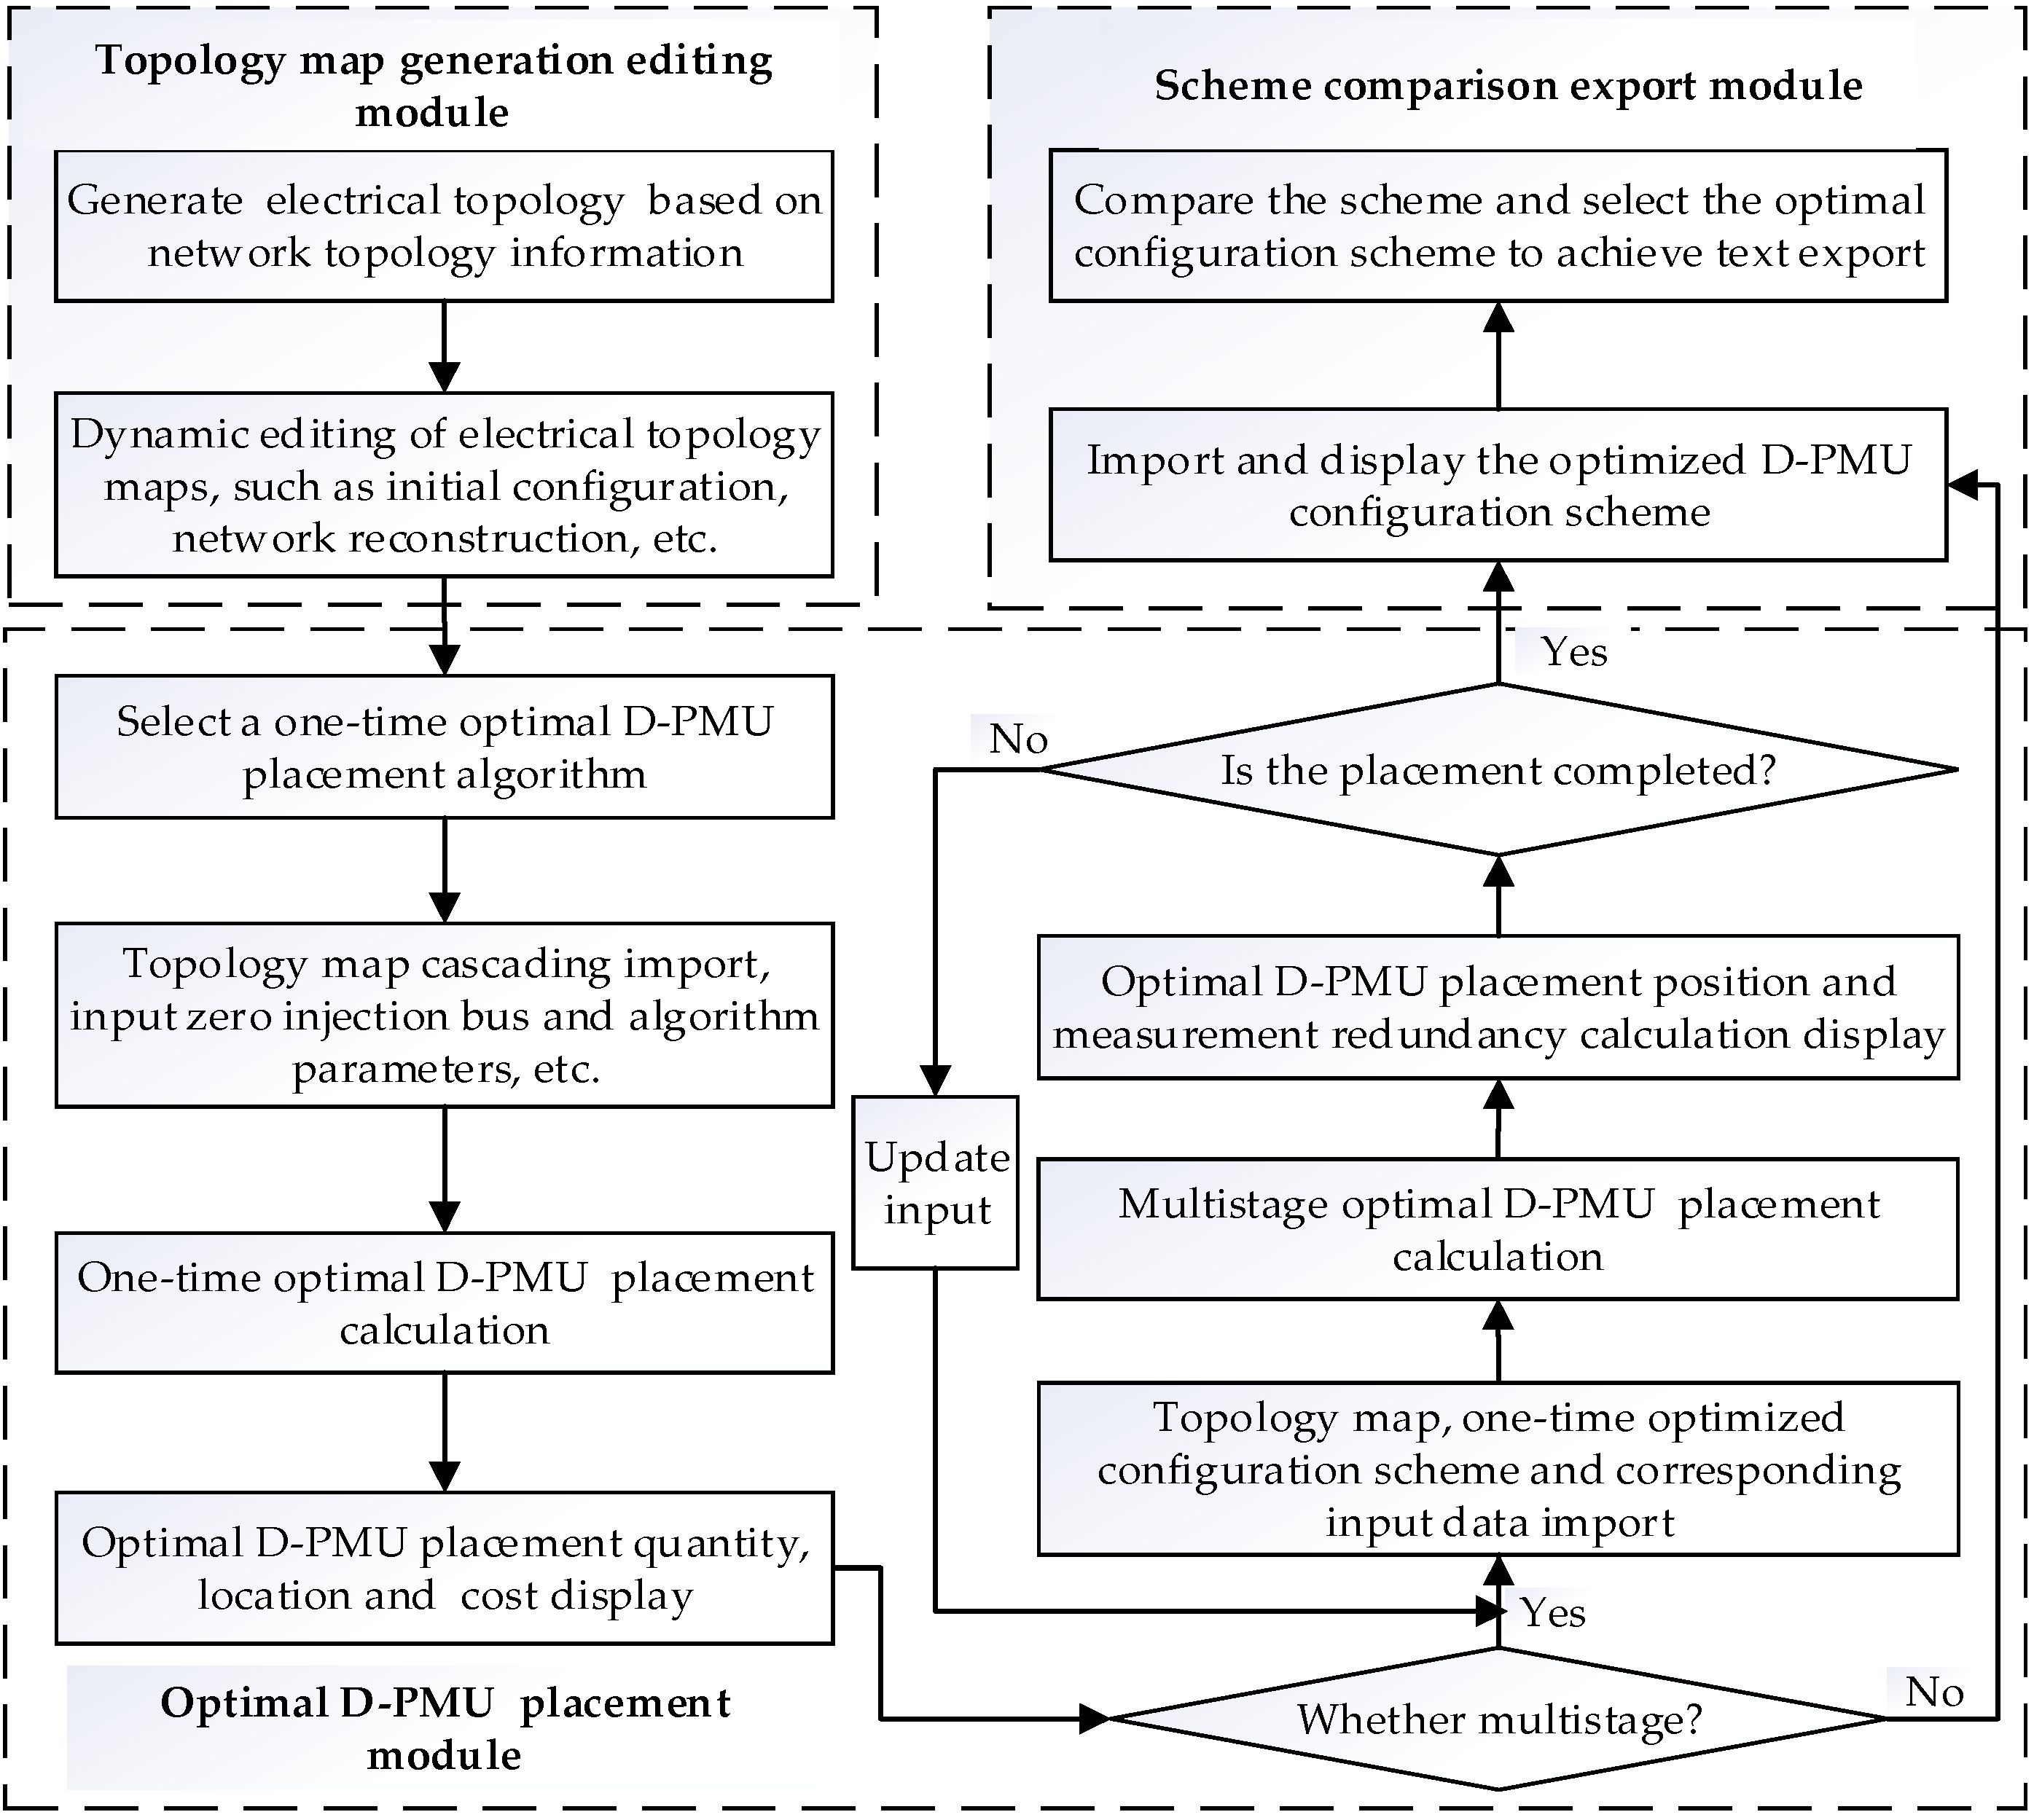
When multistage D-PMU placement is configured based on unobservable depth, the first stage should make the unobservable depth of the system not more than 2, the second stage should make it not more than 1, and the third stage should make the system is observable completely, the unobservable depth is 0. The flow chart of the optimal D-PMU placement is shown in Figure 3.
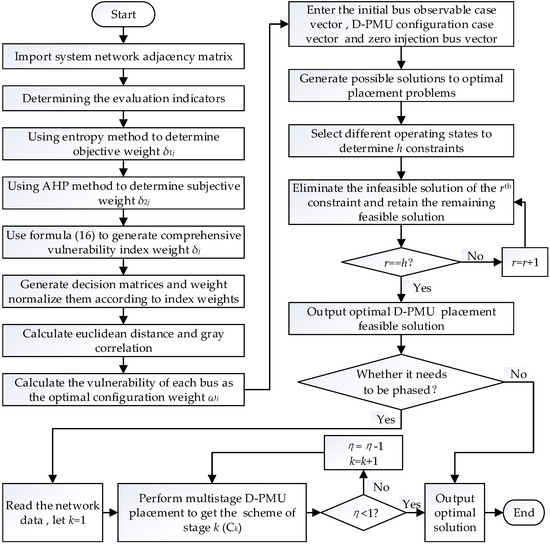
Figure 3.
Flow chart of the optimal D-PMU placement process.
2.4. Solving Algorithm
In this paper, the improved genetic algorithm is used to solve the optimal D-PMU placement problem. Based on the model of optimal D-PMU placement, the fitness function designed to meet the genetic algorithm is:
where n is the total number of system buses and is the total number of D-PMUs installed in the system.
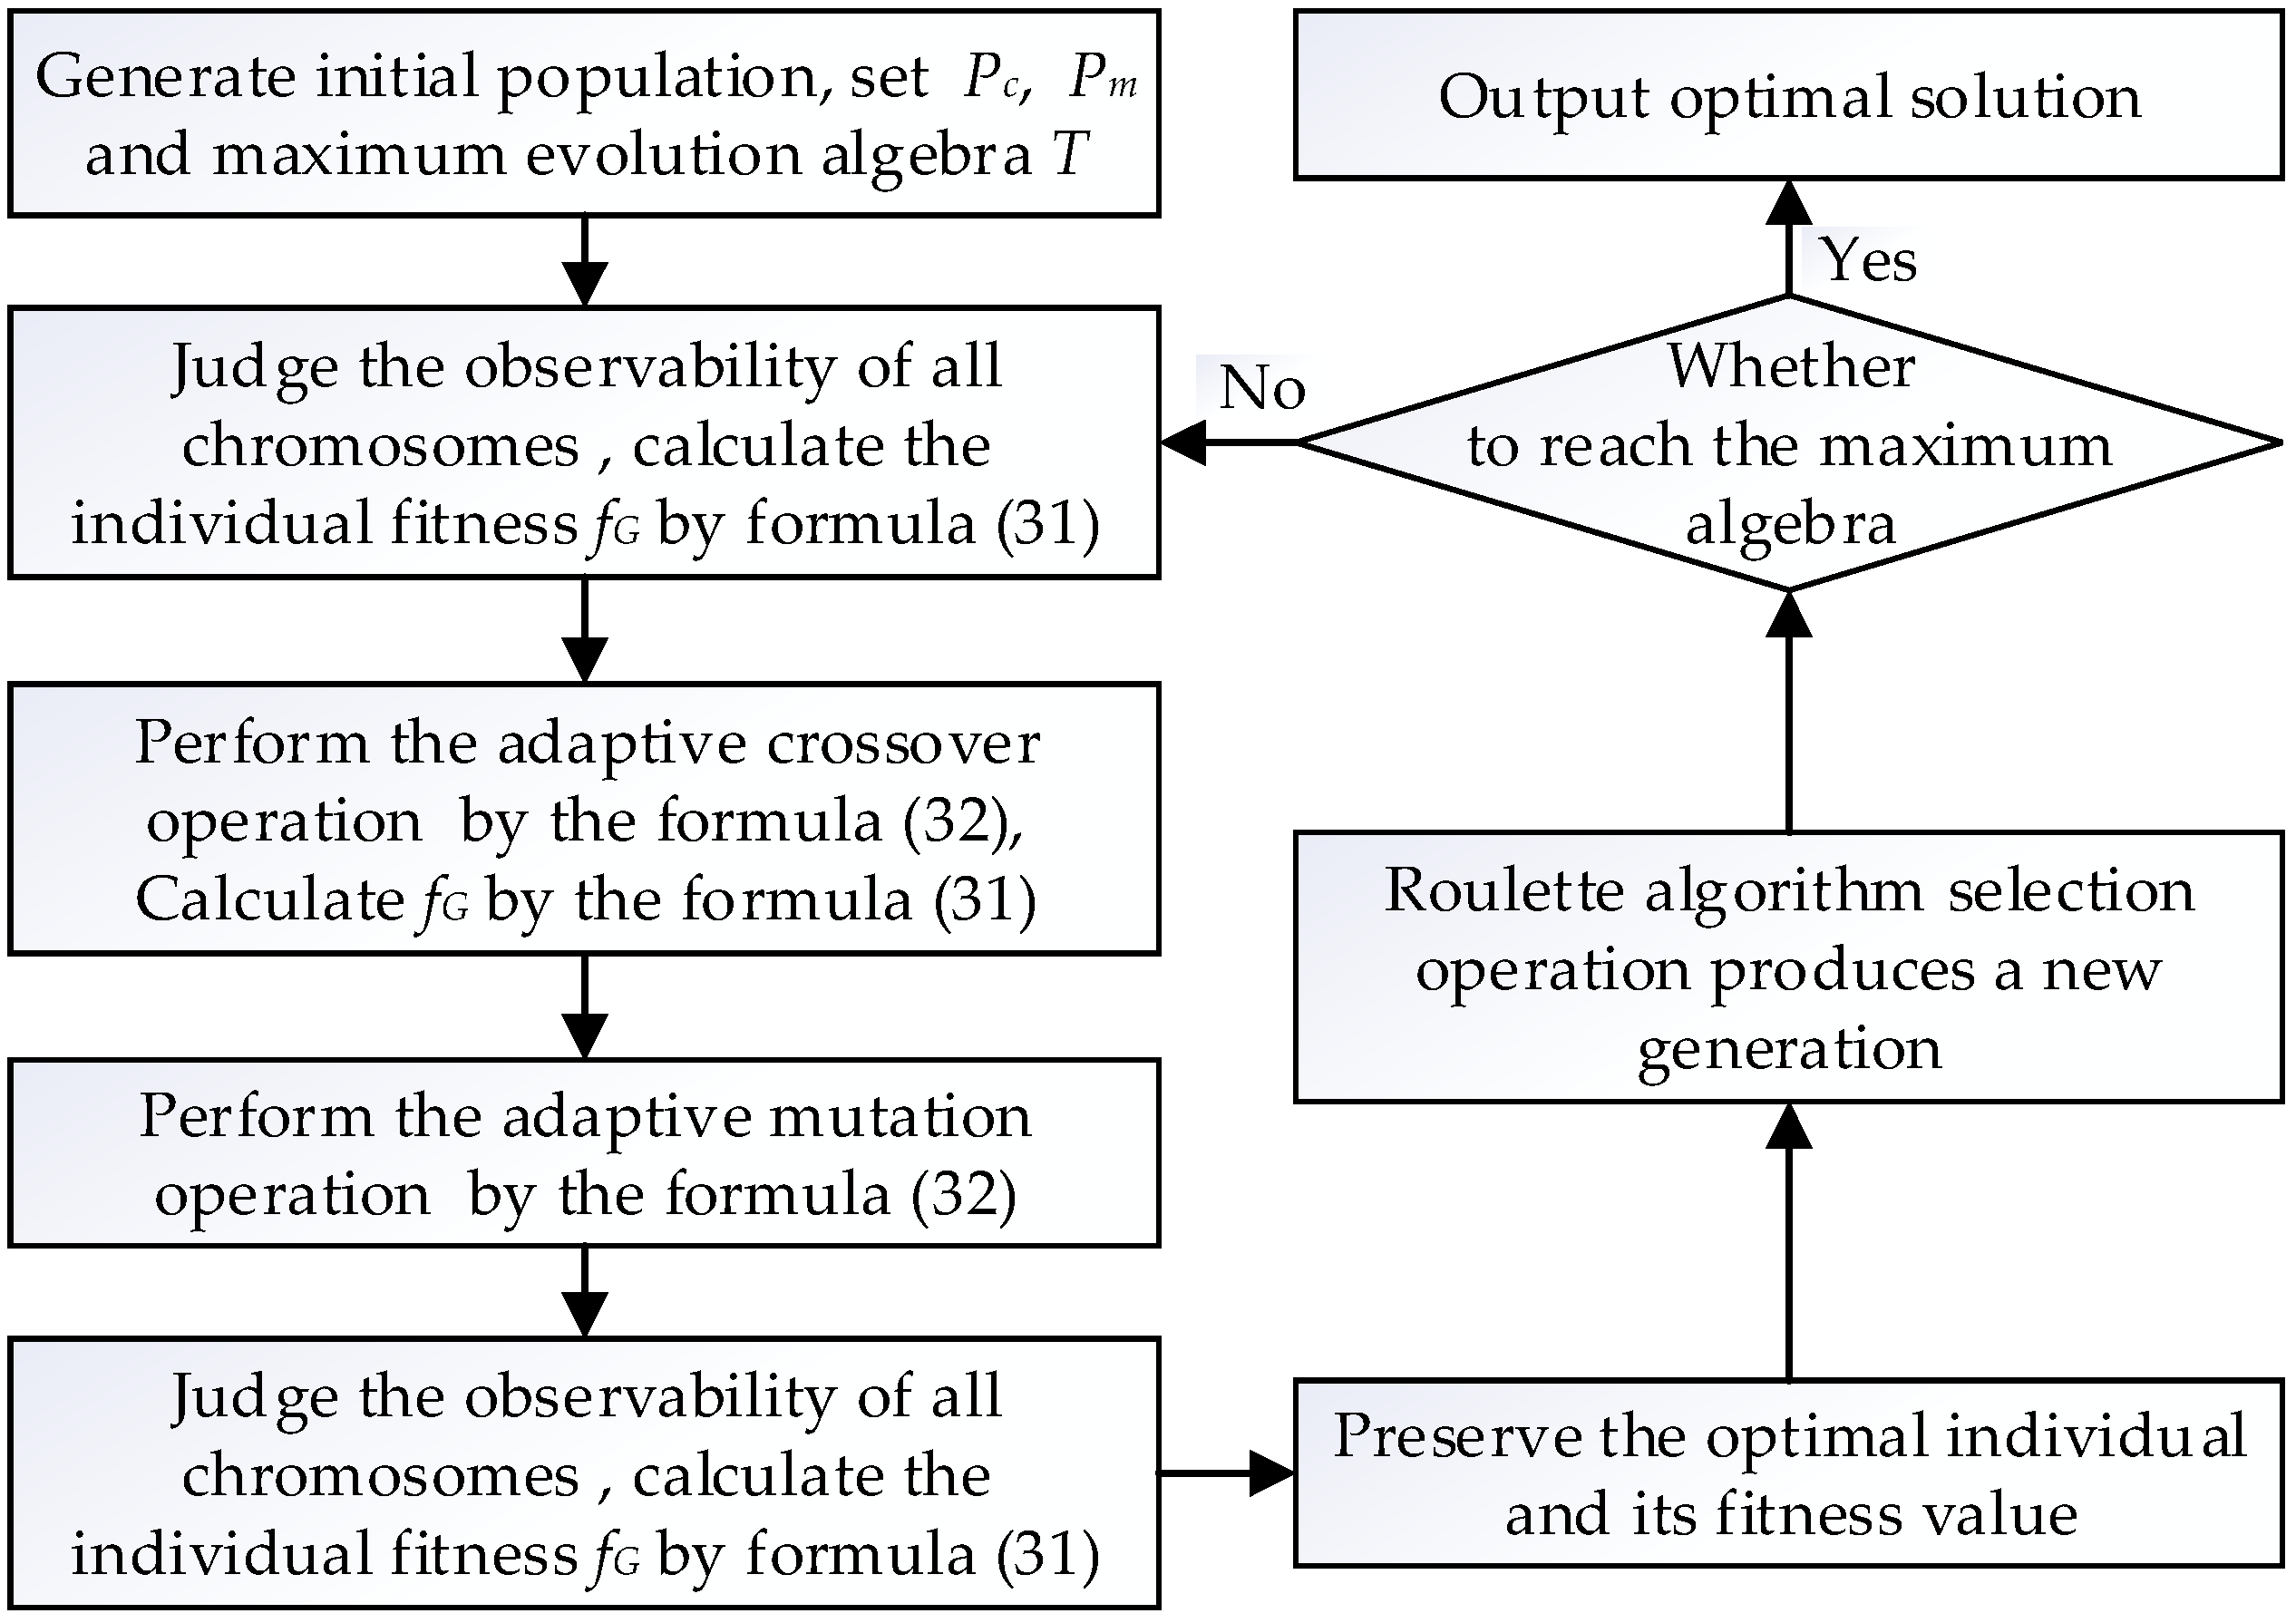
The genetic algorithm mainly includes the operations of selection crossover and mutation. This paper uses the roulette method to perform the selection operation. The choice of crossover probability Pc and mutation probability Pm is a key factor affecting the performance of genetic algorithm. Pc determines the global search ability of the genetic algorithm, and Pm determines the local search ability. This paper uses adaptive Pc and Pm, and its calculation formula is:
Pc1 and Pc2 are the upper and lower limits of the crossover probability. Pc1 = 0.9, Pc2 = 0.6. is the larger fitness value of the two individuals involved in the crossover operation, is the average fitness value of the group, is the maximum fitness value in the group. Pm1, Pm2, and Pm3 are the upper, lower, and intermediate values of the mutation probability. Pm1 = 0.1, Pm2 = 0.01, Pm3 = 0.07.
In the calculation formula of the crossover probability, when , the crossover probability takes its upper limit, although the crossover operation cannot change the genetic composition of the individual at this time, which does not help the evolution of the population, but facilitates the mathematical calculation. In the calculation formula of the mutation probability. When , the probability of mutation takes the intermediate value, which ensures the population still maintains a certain probability of mutation when all individual genetic composition is consistent, prevents evolution from stagnating, and also facilitates mathematical calculations. The solution process of improved genetic algorithm is shown in Figure 4.
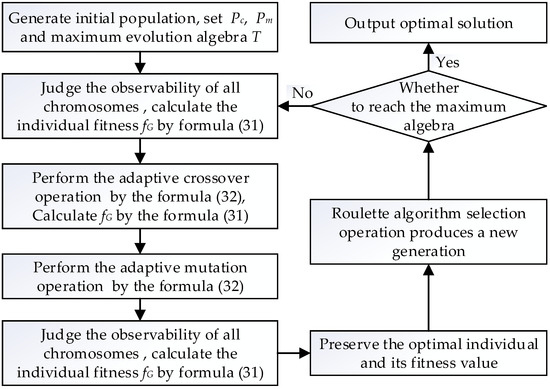
Figure 4.
The solution process of the improved genetic algorithm.
3. Application Requirements Analysis and System Functional Architecture
3.1. Application Requirements Analysis
The requirements analysis lays the foundation for the system. This paper adopts a structured analysis method of top-down, layer-by-layer decomposition to comprehensively analyze the related technologies and functions of the system. Combined with the specific analysis of the actual situation, the system is required to have the following functions:
- (1)
- Dynamic electrical topology generation and editing functions. According to the bus adjacency matrix corresponding to the electrical wiring diagram of the smart distribution network, an editable topology map is generated, which can implement functions such as non-critical bus compression, configured D-PMU bus lighting, and network reconstruction.
- (2)
- Import and modify functions of system parameters and existing measurement data information. Input data includes: line parameters, tie switch information, zero injection bus information, initial parameters of different algorithms, existing D-PMU measurement data.
- (3)
- Optimal D-PMU placement function. Implement one-time and multistage optimal D-PMU placement scheme calculation that meets the needs of various business needs and balances the measurement redundancy and economy.
The optimal D-PMU placement assistant decision-making software system for the smart distribution network includes three modules: electrical topology map generation and editing module, optimal D-PMU placement module and optimized placement scheme comparison export module. The specific application and function of the module are shown in Table 1.

Table 1.
System module function table.
The system adopts the client/server mode (C/S). The client issues a task request to the server, the server processes the client’s request and returns the corresponding result. This reduces the requirements on the client hardware, and it is easier to convert and update the system while preserving the existing investment in the client computer system. Therefore, this development mode has better openness and scalability. This system uses Anaconda 3 as the development platform, uses Python language and Tkinter module library to realize interface design and development. The algorithm uses MATLAB package embedding. From the foregoing requirements analysis and development mode, it can be seen that the system is feasible in design, development, and operation.
3.2. System Functional Architecture
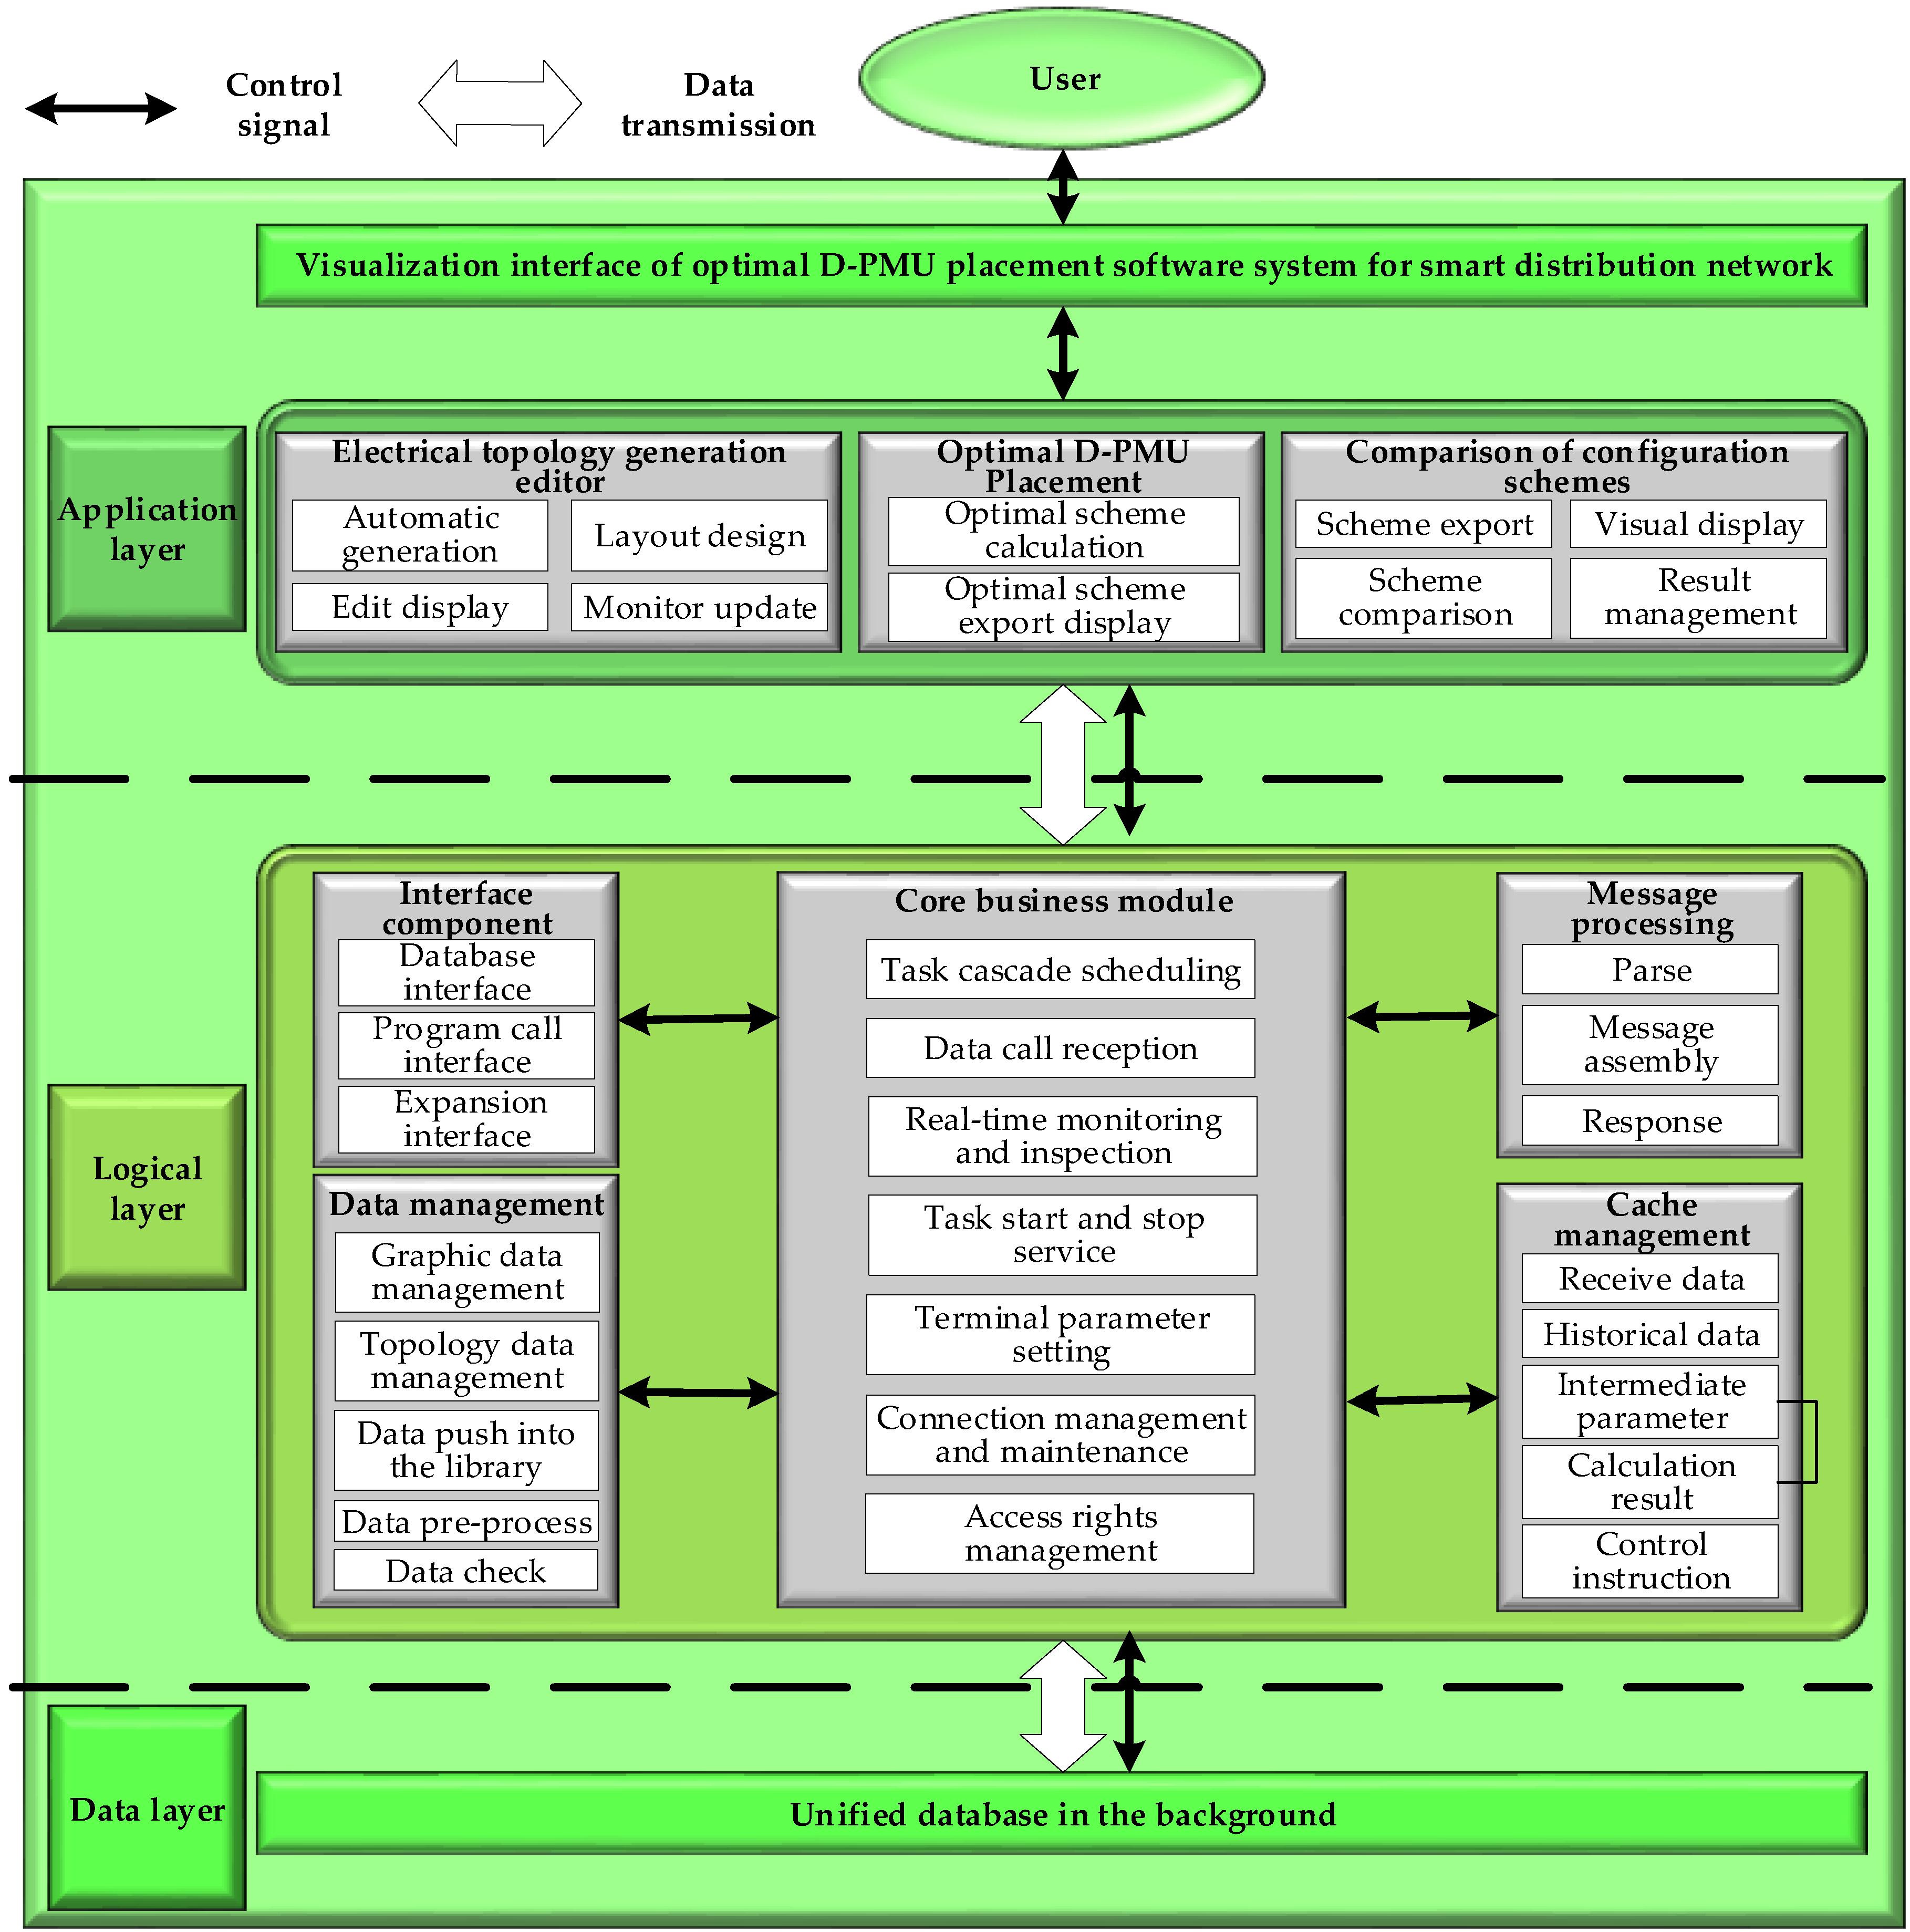
In order to improve the flexibility and maintainability of the entire software system, the software system adopts the three-level application architecture, including a data access layer, a software logic layer and a software application layer. The architecture of the software system is shown in Figure 5.

Figure 5.
System functional architecture diagram.
The data access layer implements data storage and read operations, receives software logic layer requests, and accesses the data required for a specific stage from the database. The accessed data mainly includes core network data sources such as electrical network parameter information data, measurement information data, document data, and access control data.
The software logic layer is in the middle of the data access layer and the application layer. It is the part that reflects the core value in the system architecture and brings together the operational function logic of the entire software system. It mainly includes electrical topology drawing editing, data conversion fusion, interface calling, output calling, exporting planning scheme text and so on. For the data access layer, the logical layer is the caller; for the presentation layer, the logical layer is the callee, so the location of the software logic layer in the architecture is critical.
The software application layer is located at the top of the system and is closest to the user. It is a specific combination of specific functions in the software logic layer according to specific goals, provides an interface between the software system and the user for displaying data and accepting data input by the user. The final access of the system, that is, the end user is the power company, which can be directly operated through the human-computer interaction interface to realize the optimal D-PMU placement scheme determination and document output that meets the specific target needs.
3.3. Transaction Flow and Data Flow Analysis
(1) Transaction flow analysis
When analyzing the organizational structure and functions of the system, it is necessary to string together the data about the transaction flow in the system survey from the perspective of an actual transaction flow for further analysis. Transaction flow analysis can help us understand the specific processing of the transaction, identify and handle errors and omissions in the system’s investigation work, modify and delete the unreasonable parts of the system, and optimize the transaction flow.
Based on the application requirements analysis and system functional architecture, the transaction flow diagram of the whole software system is shown in Figure 6.
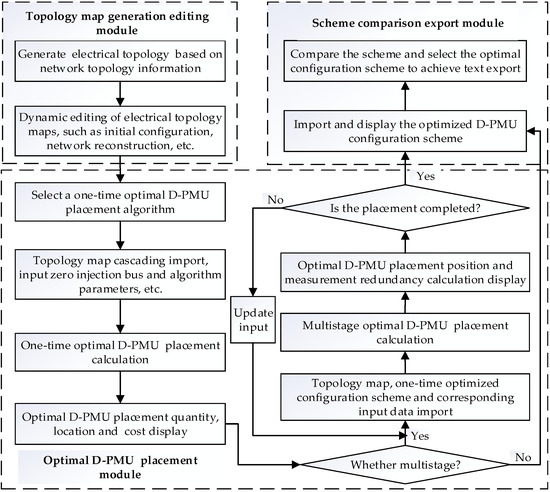
Figure 6.
Transaction flow diagram of the software system.
(2) Transaction flow analysis
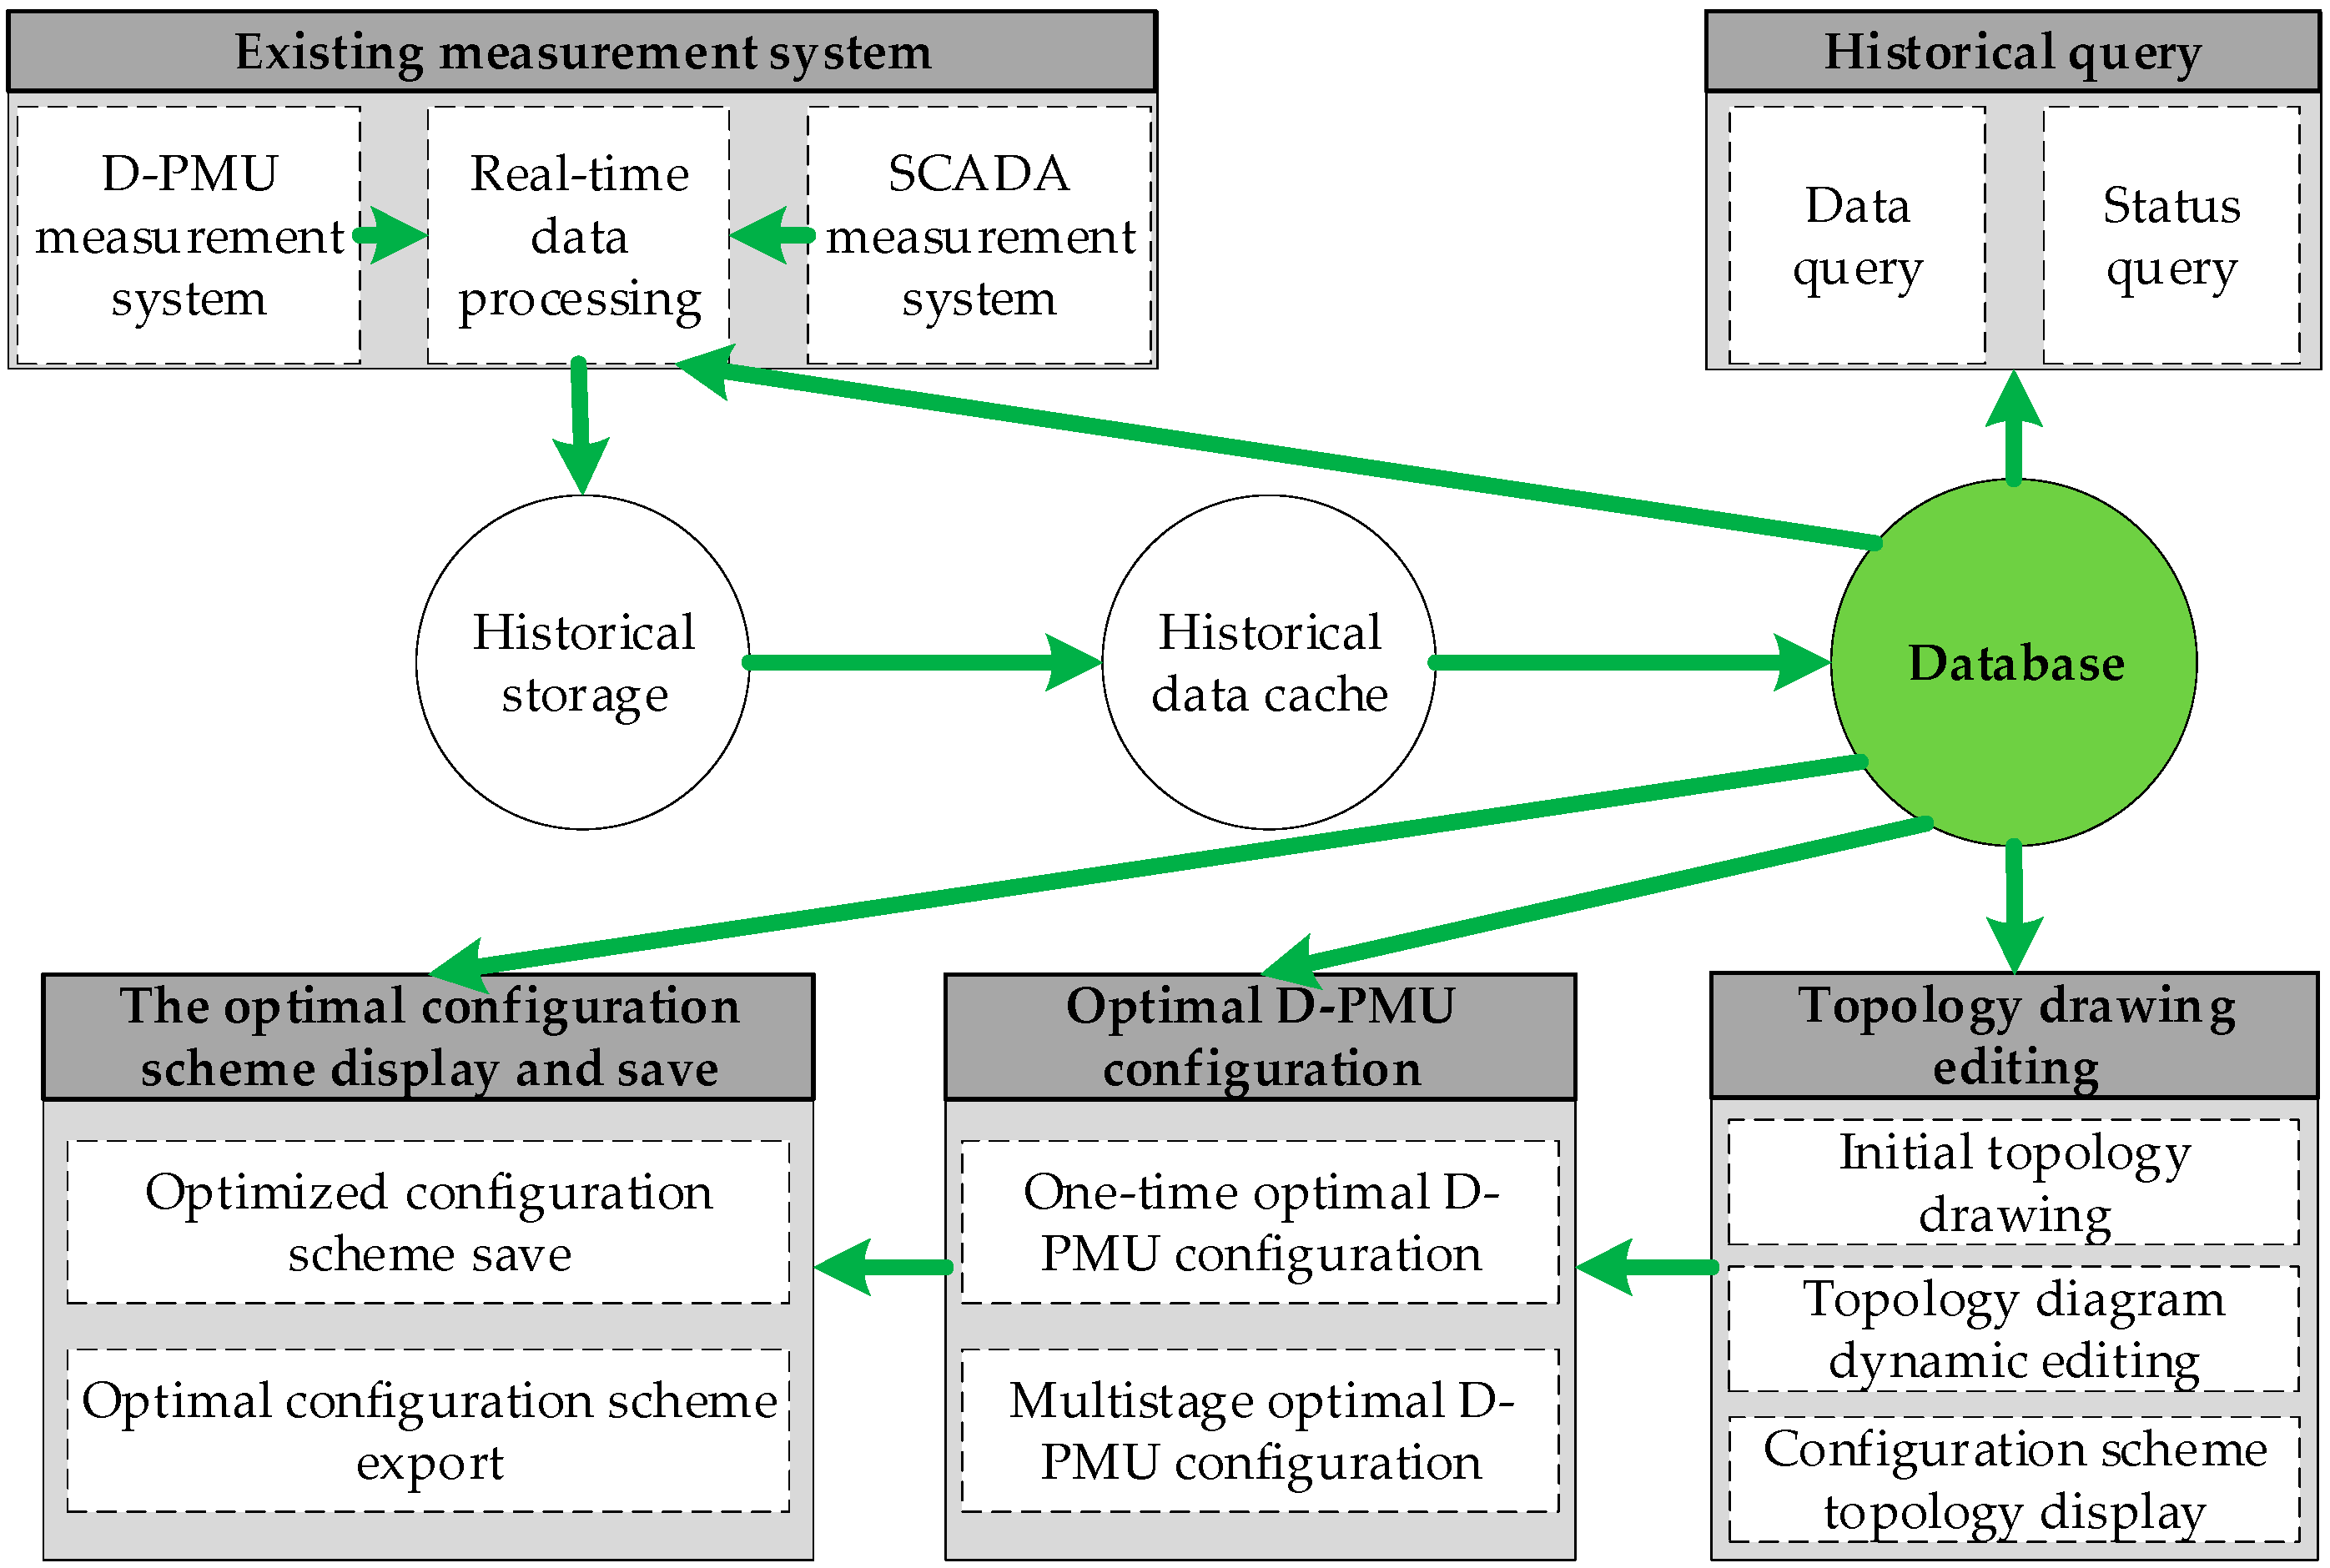
Data flow analysis mainly includes information analysis of the flow, transmission, processing and storage. The purpose of data flow analysis is to identify and resolve problems in data flow. The data flow is then represented by a data flow diagram. The data flow diagram is a graphical technique that depicts the transformation of information flow and data from input to output and is the basic tool for structured system analysis. The data flow diagram of the software system is shown in Figure 7.
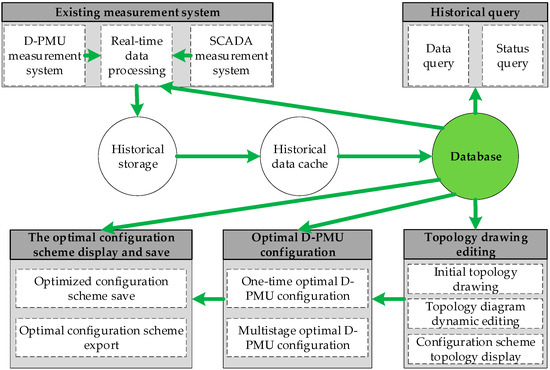
Figure 7.
Data flow diagram of the software system.
4. Application Effect Display and Case Analysis
The method proposed in this paper and the developed software are applied to the IEEE 33 bus system and the actual engineering of the Guangzhou Nansha Yuan’an Station, respectively, and the effectiveness of the algorithm and the practicability of the software are verified.
4.1. IEEE 33 Bus System
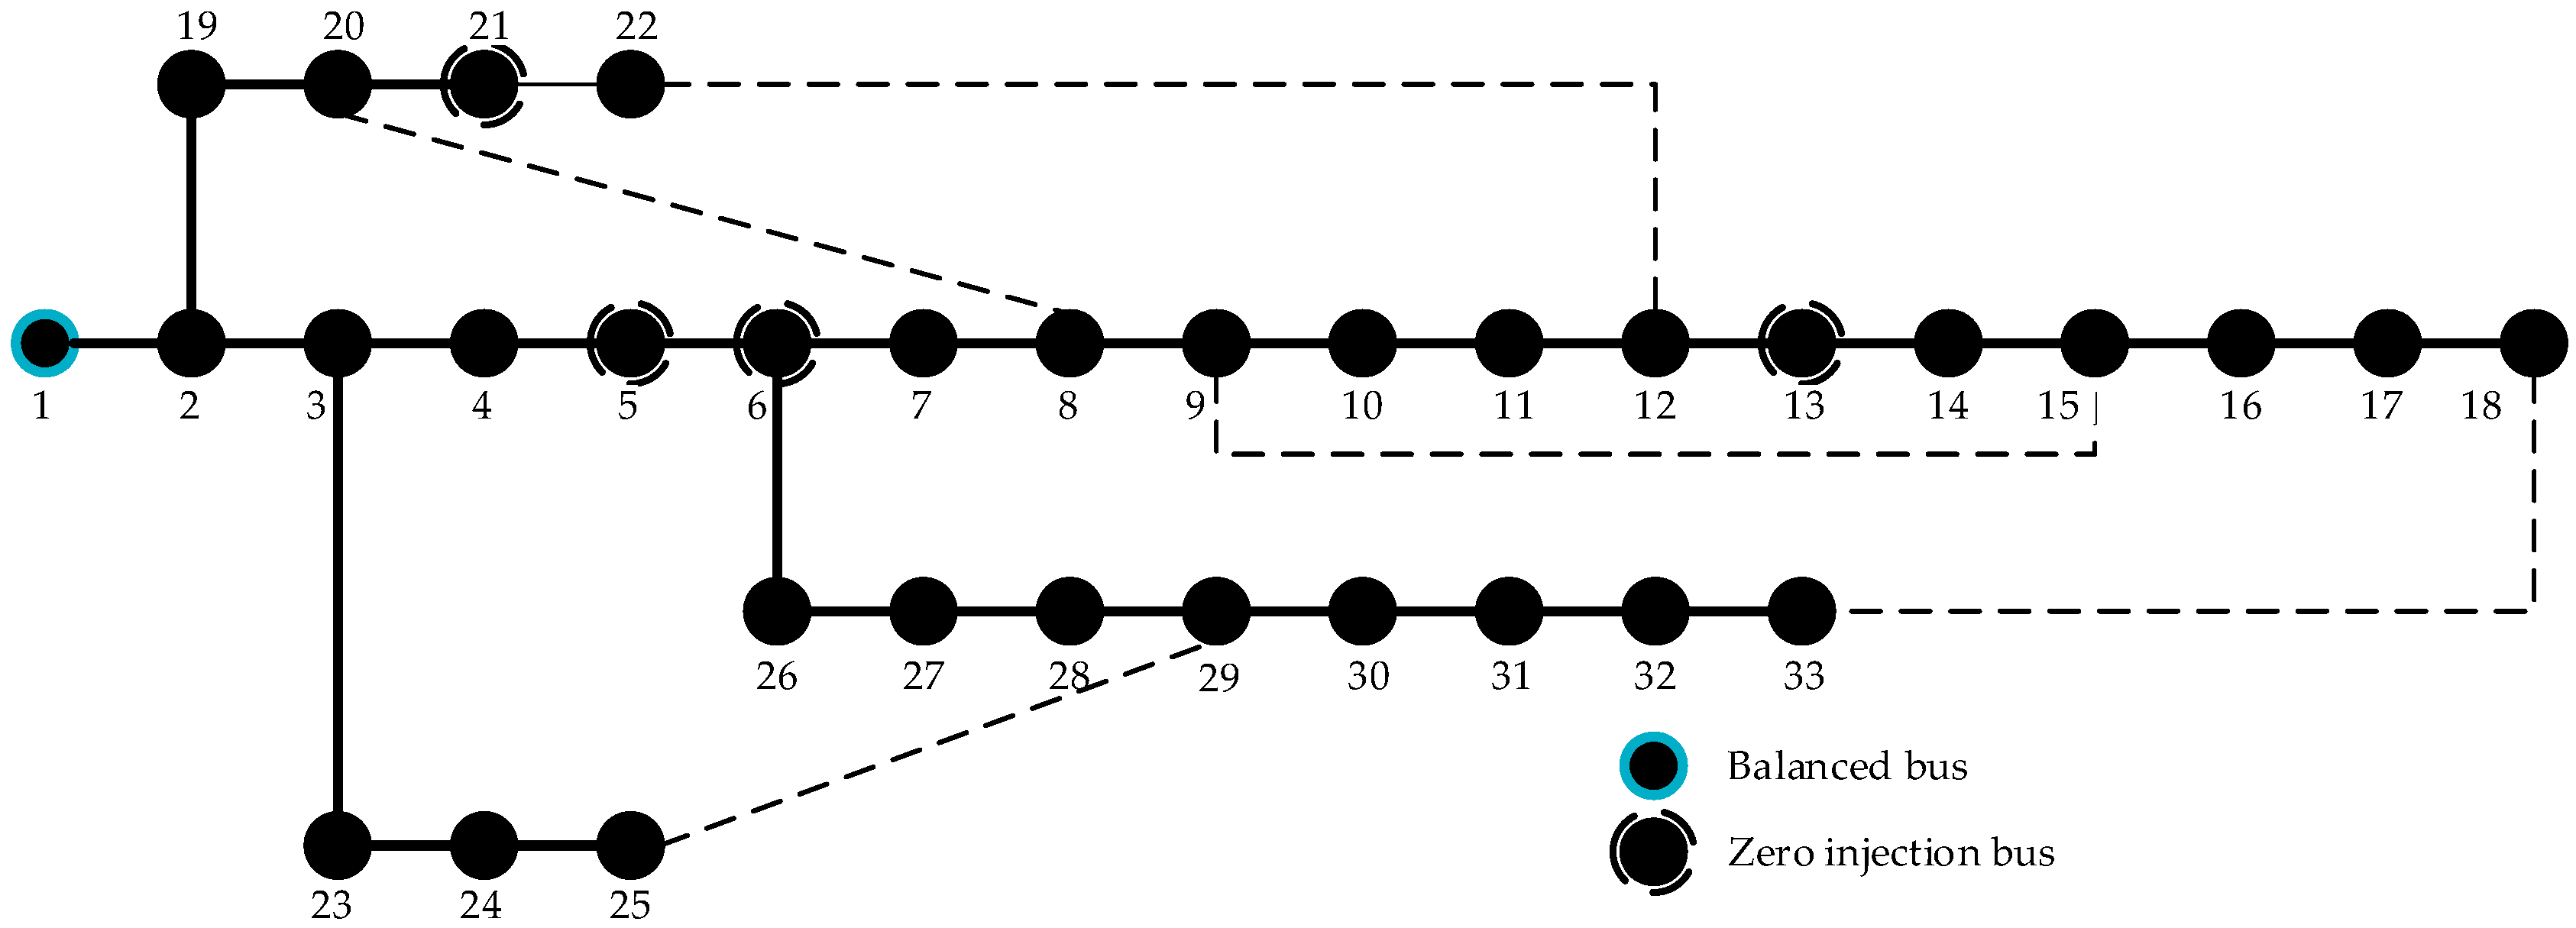
The topology of the IEEE 33 bus system is shown in Figure 8. 1–33 are the bus numbers. In the case of this paper, bus 1 is a balanced bus, buses 5, 6, 13, 21 are zero injection buses, and other buses are PQ buses.
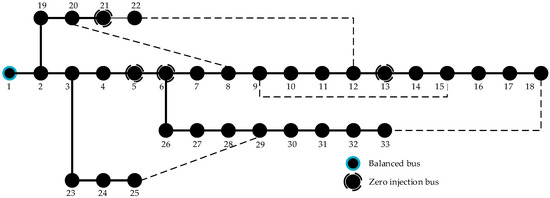
Figure 8.
IEEE 33 bus system.
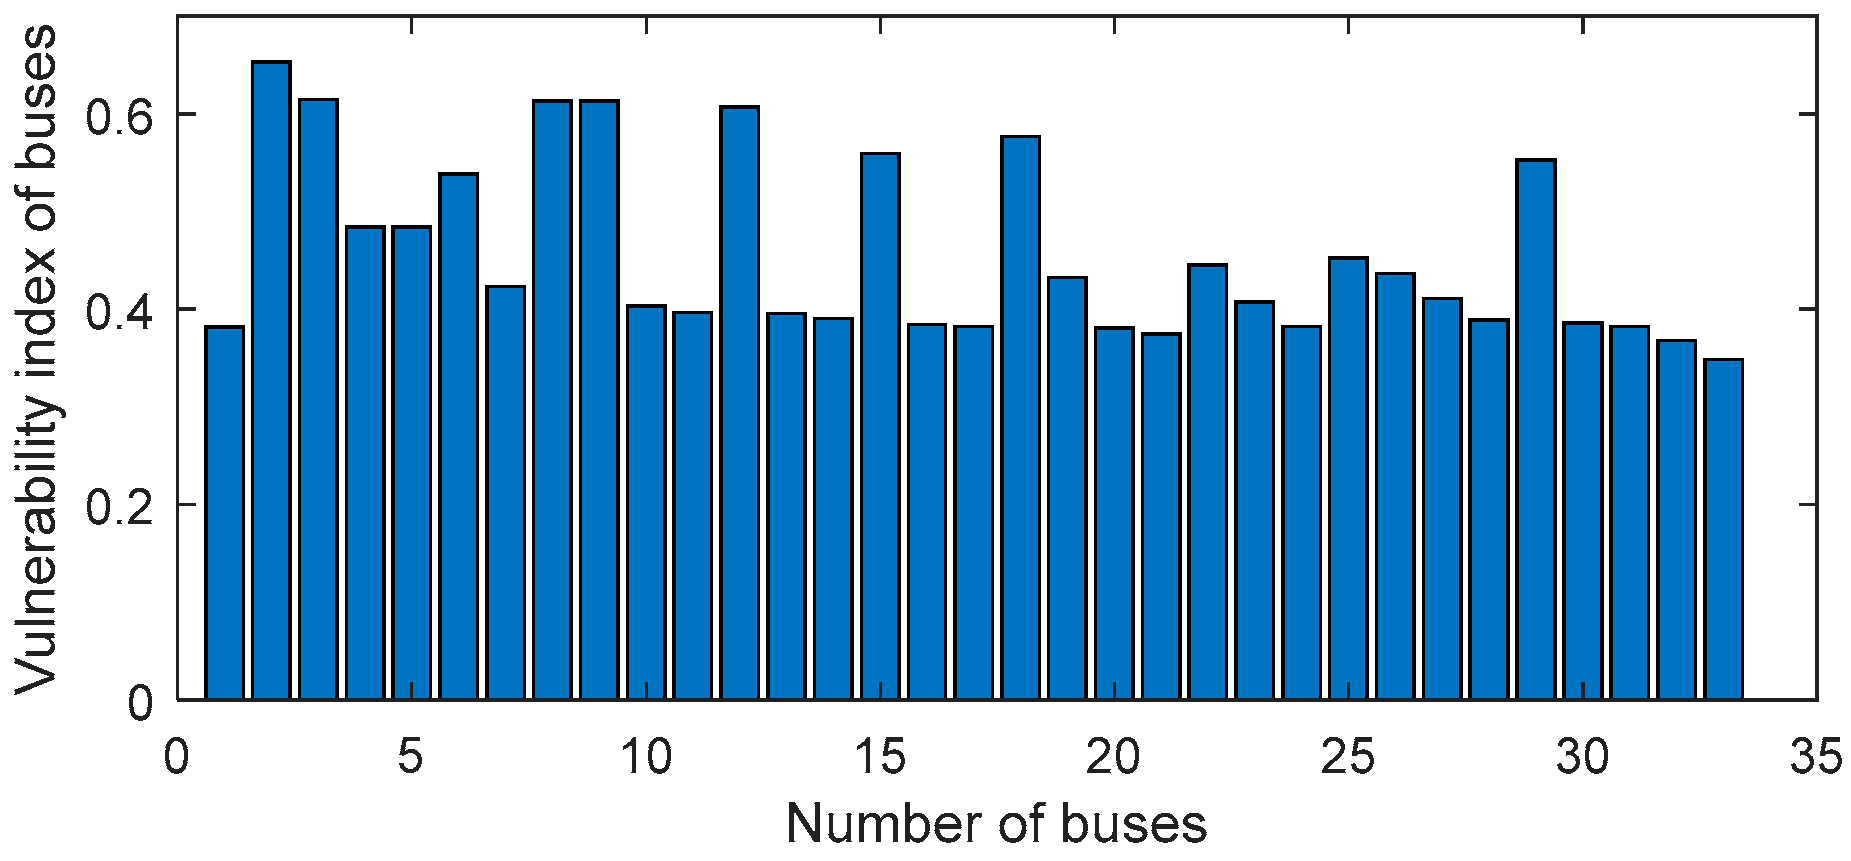
According to the bus vulnerability index determined in the previous section, the objective weights of the four indicators D1~D4 are obtained by entropy method: δ11 = 0.0588, δ12 = 0.4702, δ13 = 0.4127, δ14 = 0.0712, the subjective weights are obtained by analytic hierarchy process method: δ21 = 0.0675, δ22 = 0.5645, δ23 = 0.1845, δ24 = 0.1845. Based on the combination of objective weight and subjective weight, the combined weights of the four indicators are δ1 = 0.0627, δ2 = 0.5138, δ3 = 0.2965, δ4 = 0.1270. Then use TOPSIS algorithm and gray relational analysis algorithm to solve the bus comprehensive vulnerability index. The vulnerability index of each bus is shown in Figure 9.
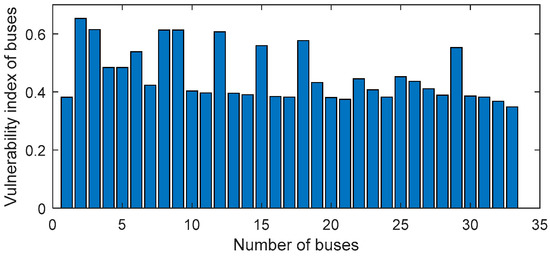
Figure 9.
The vulnerability index of the IEEE 33 bus system.
In order to reflect the effect of the bus vulnerability index on optimal D-PMU placement in the normal operation of the system without considering the zero injection bus, we use the one-time optimal D-PMU placement method proposed in this paper to compare the two cases of considering or not considering bus weight in the model. The result of the comparison is shown in Table 2. As can be seen from the table, considering the bus vulnerability index does not increase the number of D-PMU required and can get better measurement redundancy.

Table 2.
Effect of bus vulnerability index on placement results.
In order to test the impact of zero injection buses on the optimal D-PMU placement, in the case that the other conditions are the same, we only change whether the zero injection buses are considered in the model. The result of the comparison is shown in Table 3. It can be intuitively seen that considering zero injection buses in the model can effectively reduce the number of D-PMU.

Table 3.
Effect of zero injection buses on placement results.
The optimal D-PMU placement scheme that makes the system full observable under the N-1 fault condition of the smart distribution network system is shown in Table 4. It can be intuitively seen from the placement result that when the bus i is observable in the case of the D-PMU device N-1, it is inevitably observable in the case of the line N-1.

Table 4.
Optimal D-PMU placement under N-1 fault condition.
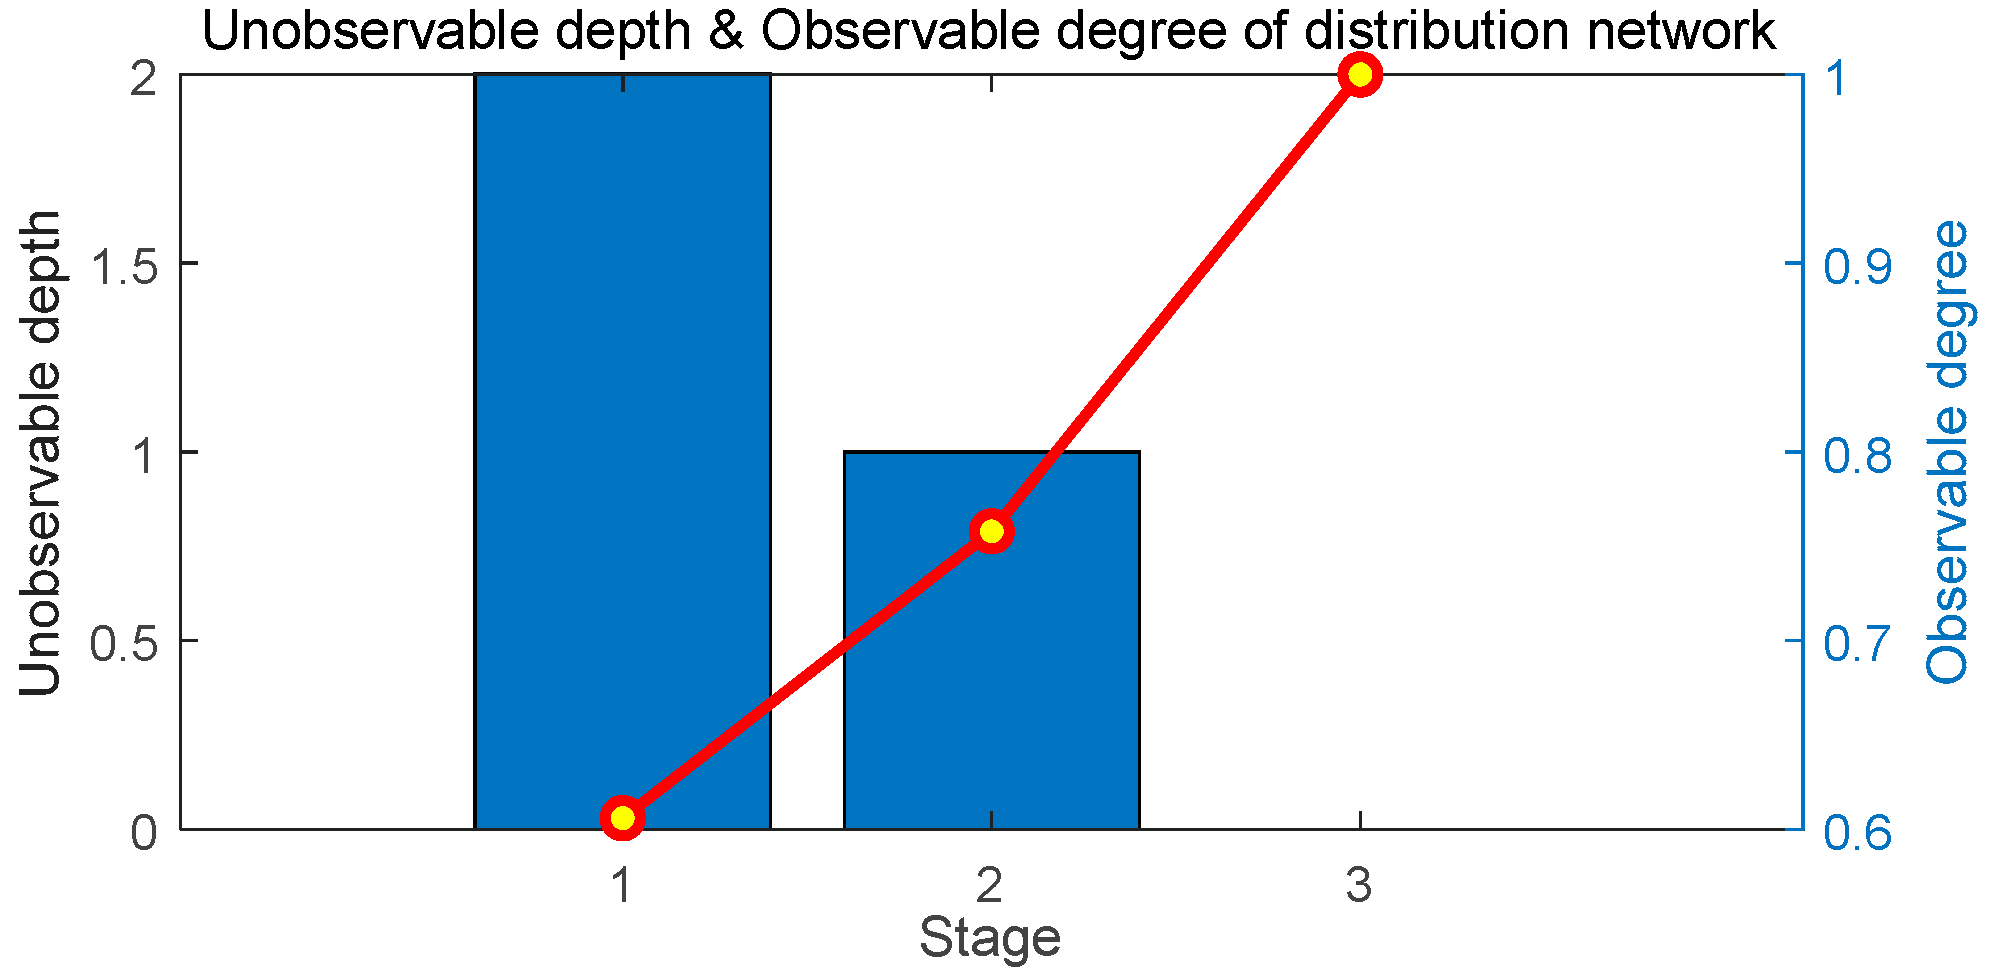
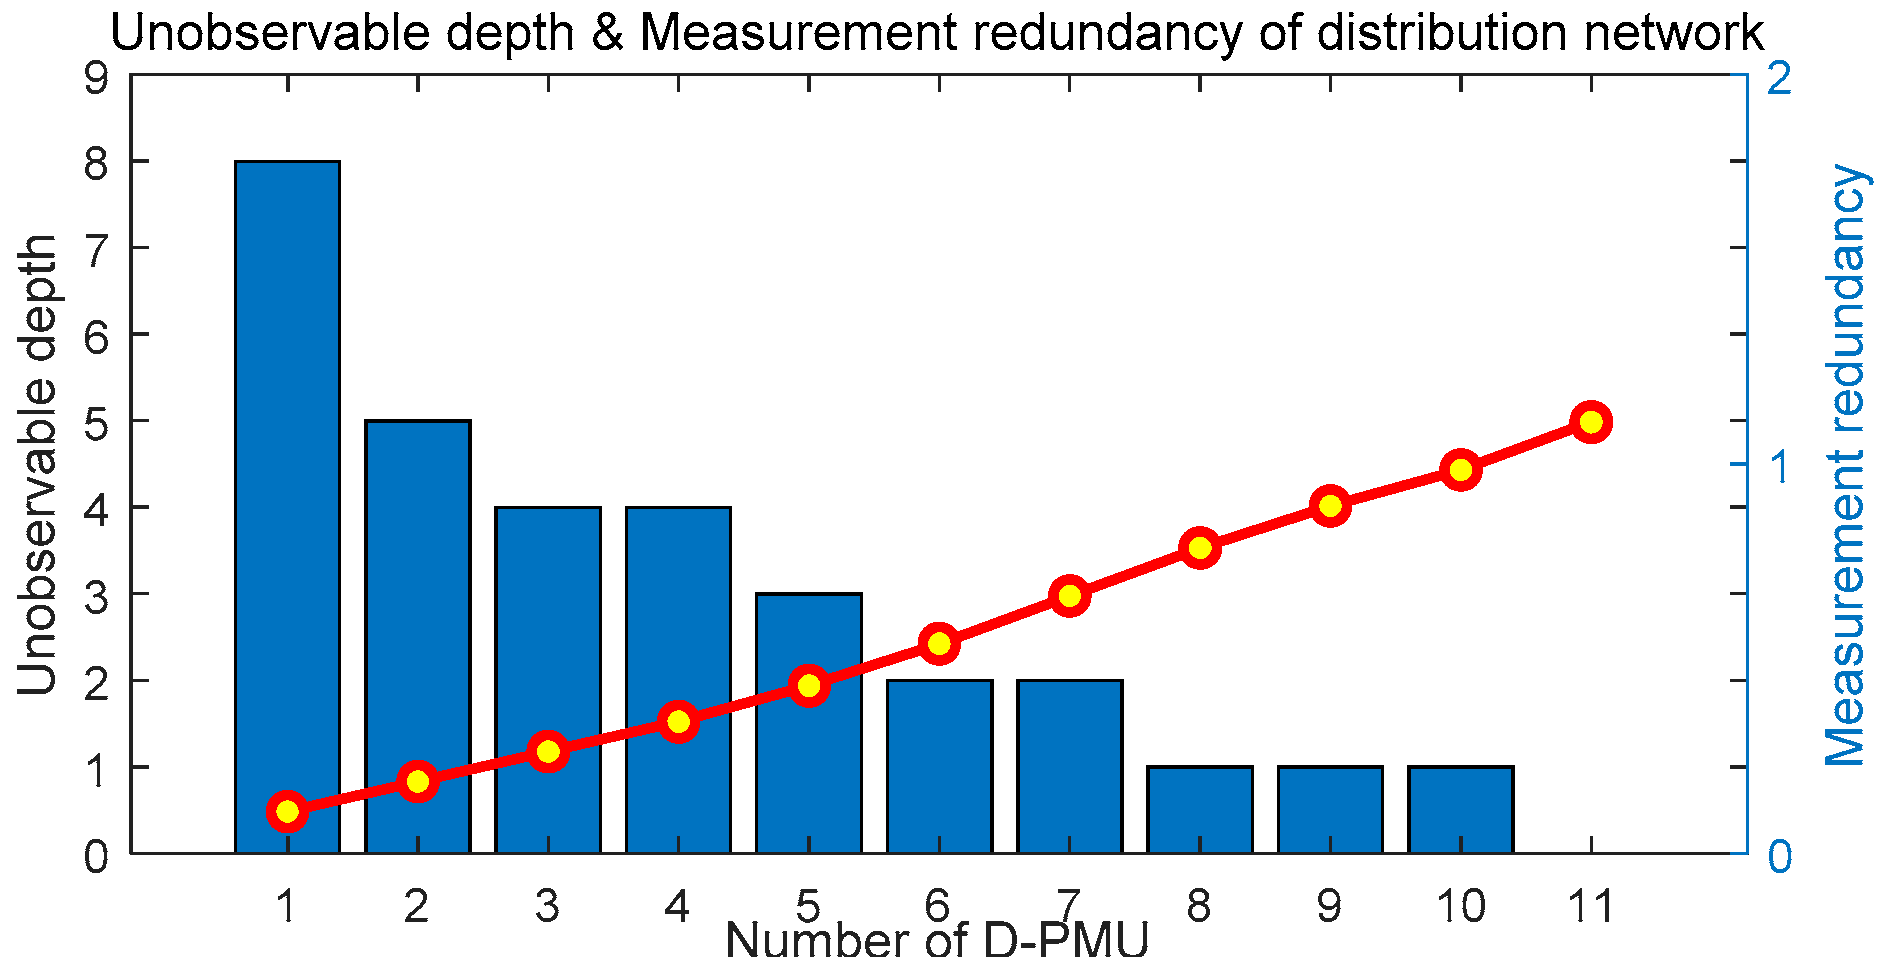
On the basis of the one-time optimal D-PMU placement scheme, the multistage optimal D-PMU placement without considering zero injection buses is realized. The details of the placement scheme are shown in Table 5. The unobservable depth and observable degree of each stage are shown in Figure 10, and the change of the unobservable depth and measurement redundancy of the system with the number of D-PMU placement are shown in Figure 11.

Table 5.
Multistage D-PMU placement of IEEE 33 bus system.
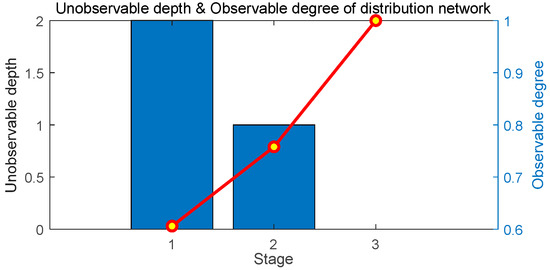
Figure 10.
Unobservable depth and observable degree of the IEEE 33 bus system.
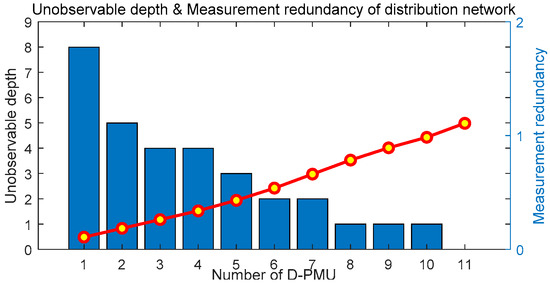
Figure 11.
Unobservable depth and measurement redundancy of the IEEE 33 bus system.
4.2. Distribution System of Yuan’an Substation
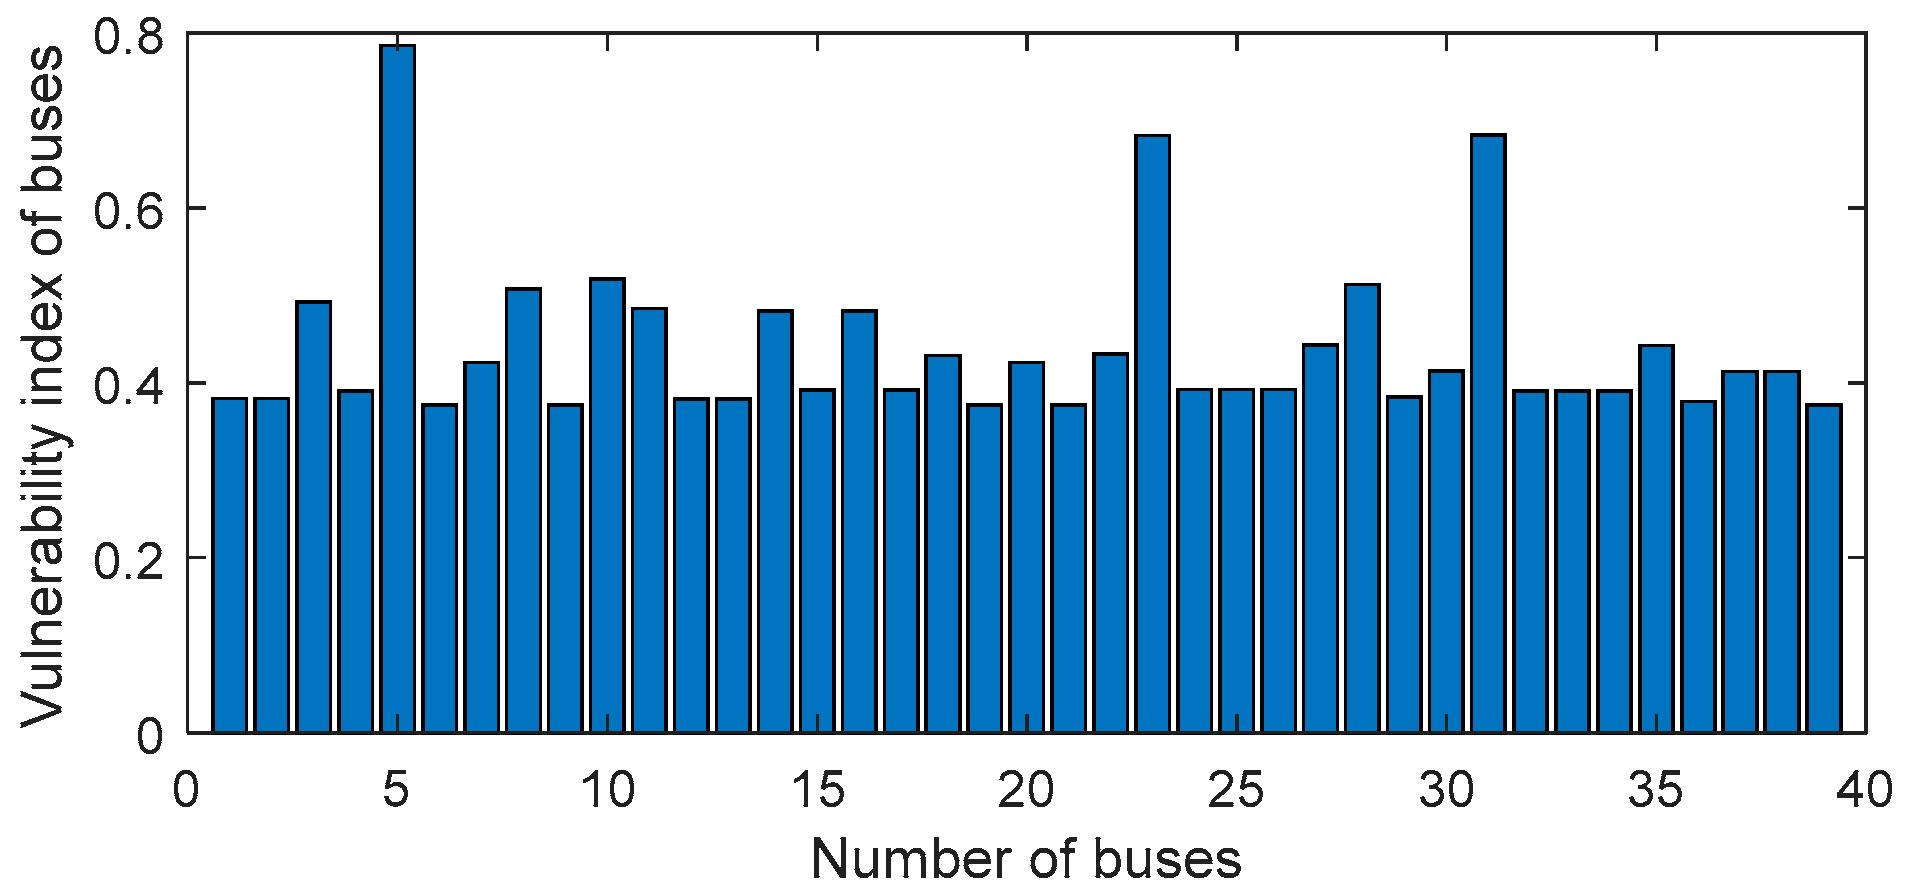
In order to verify the significance of the optimal D-PMU placement method proposed in this paper to a practical project, we apply the developed software to the actual project of the Yuan’an substation. There is no zero injection bus in this system. The corresponding electrical topology diagram is generated for the given electrical wiring diagram adjacency matrix. The entropy method and analytic hierarchy process are used to obtain the weights of the four indicators of bus vulnerability. δ1 = 0.0732, δ2 = 0.5361, δ3 = 0.2775, δ4 = 0.1458. The vulnerability index of each bus is shown in Figure 12.
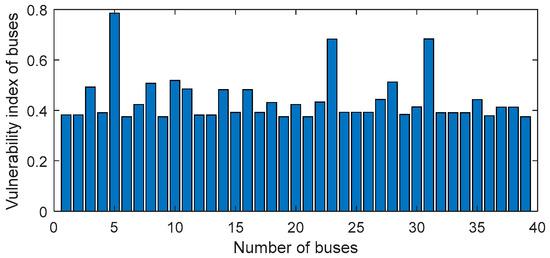
Figure 12.
The vulnerability index of the Yuan’an substation.
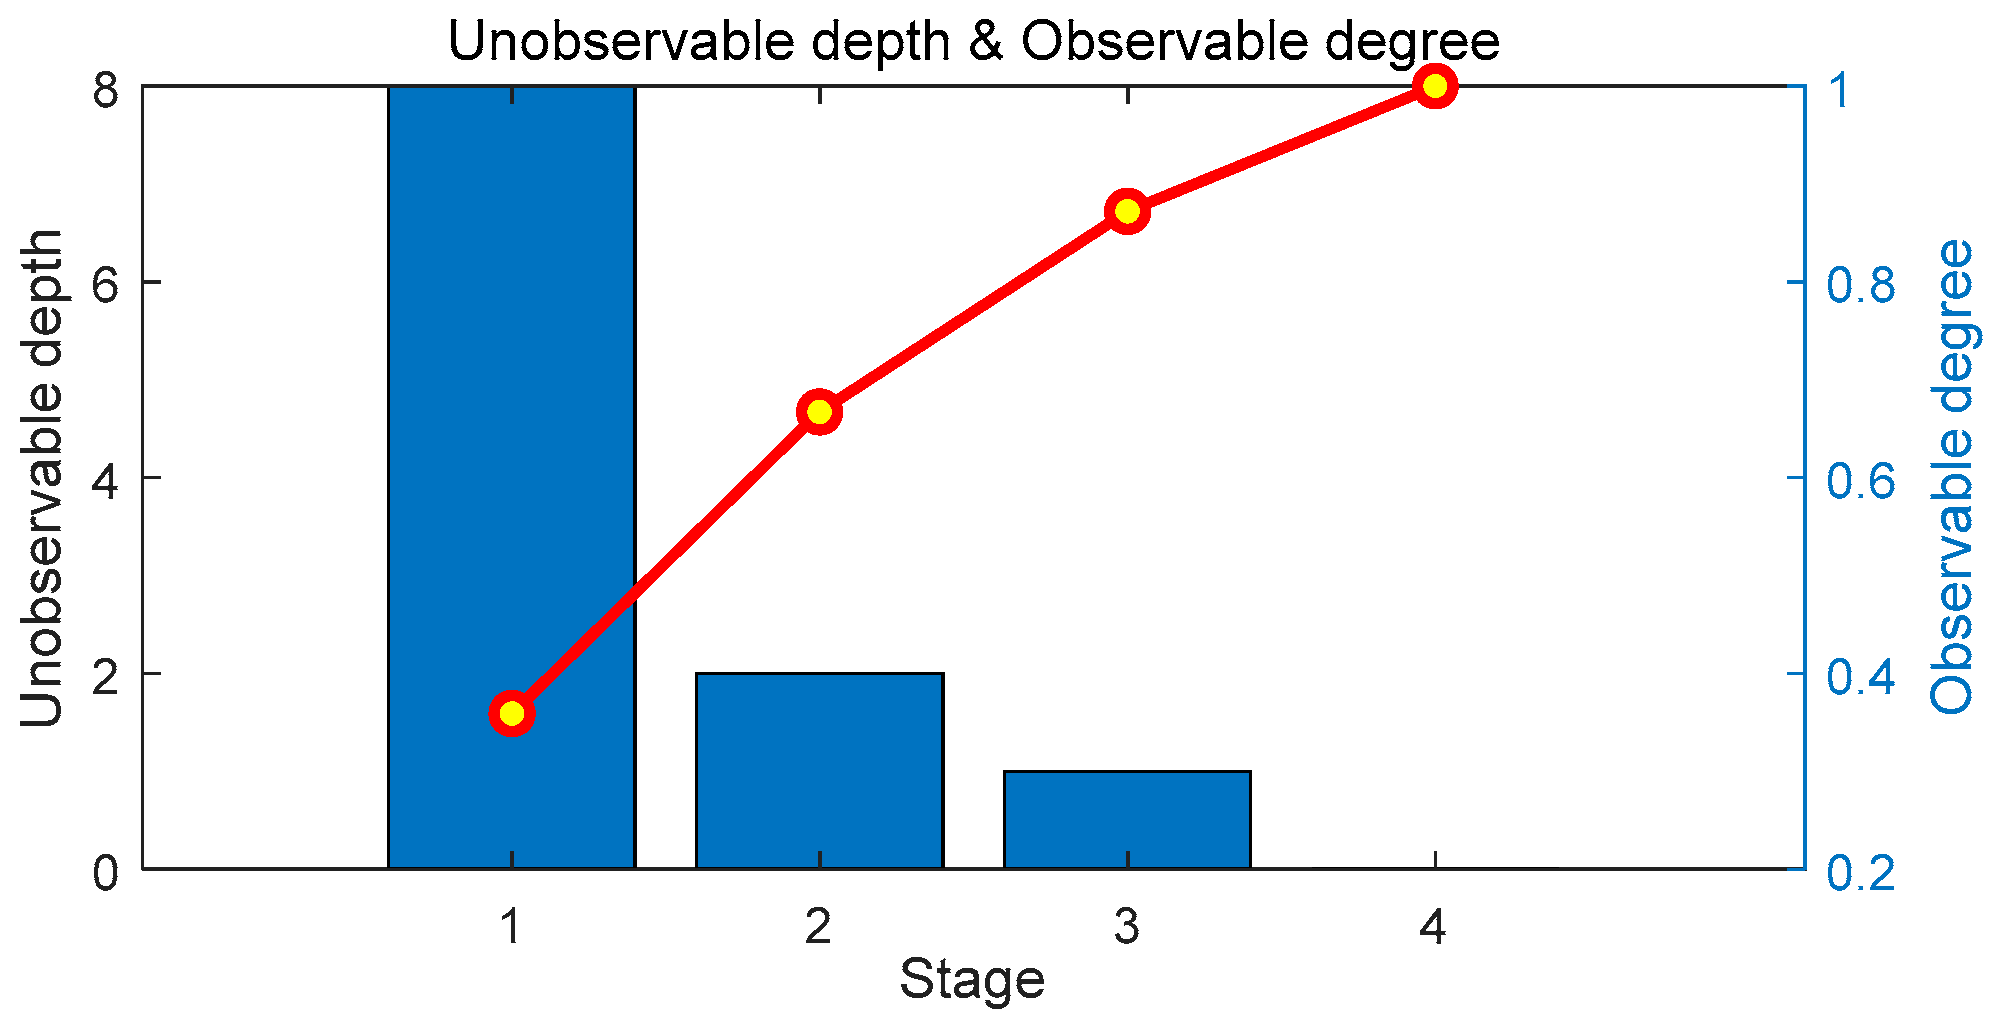
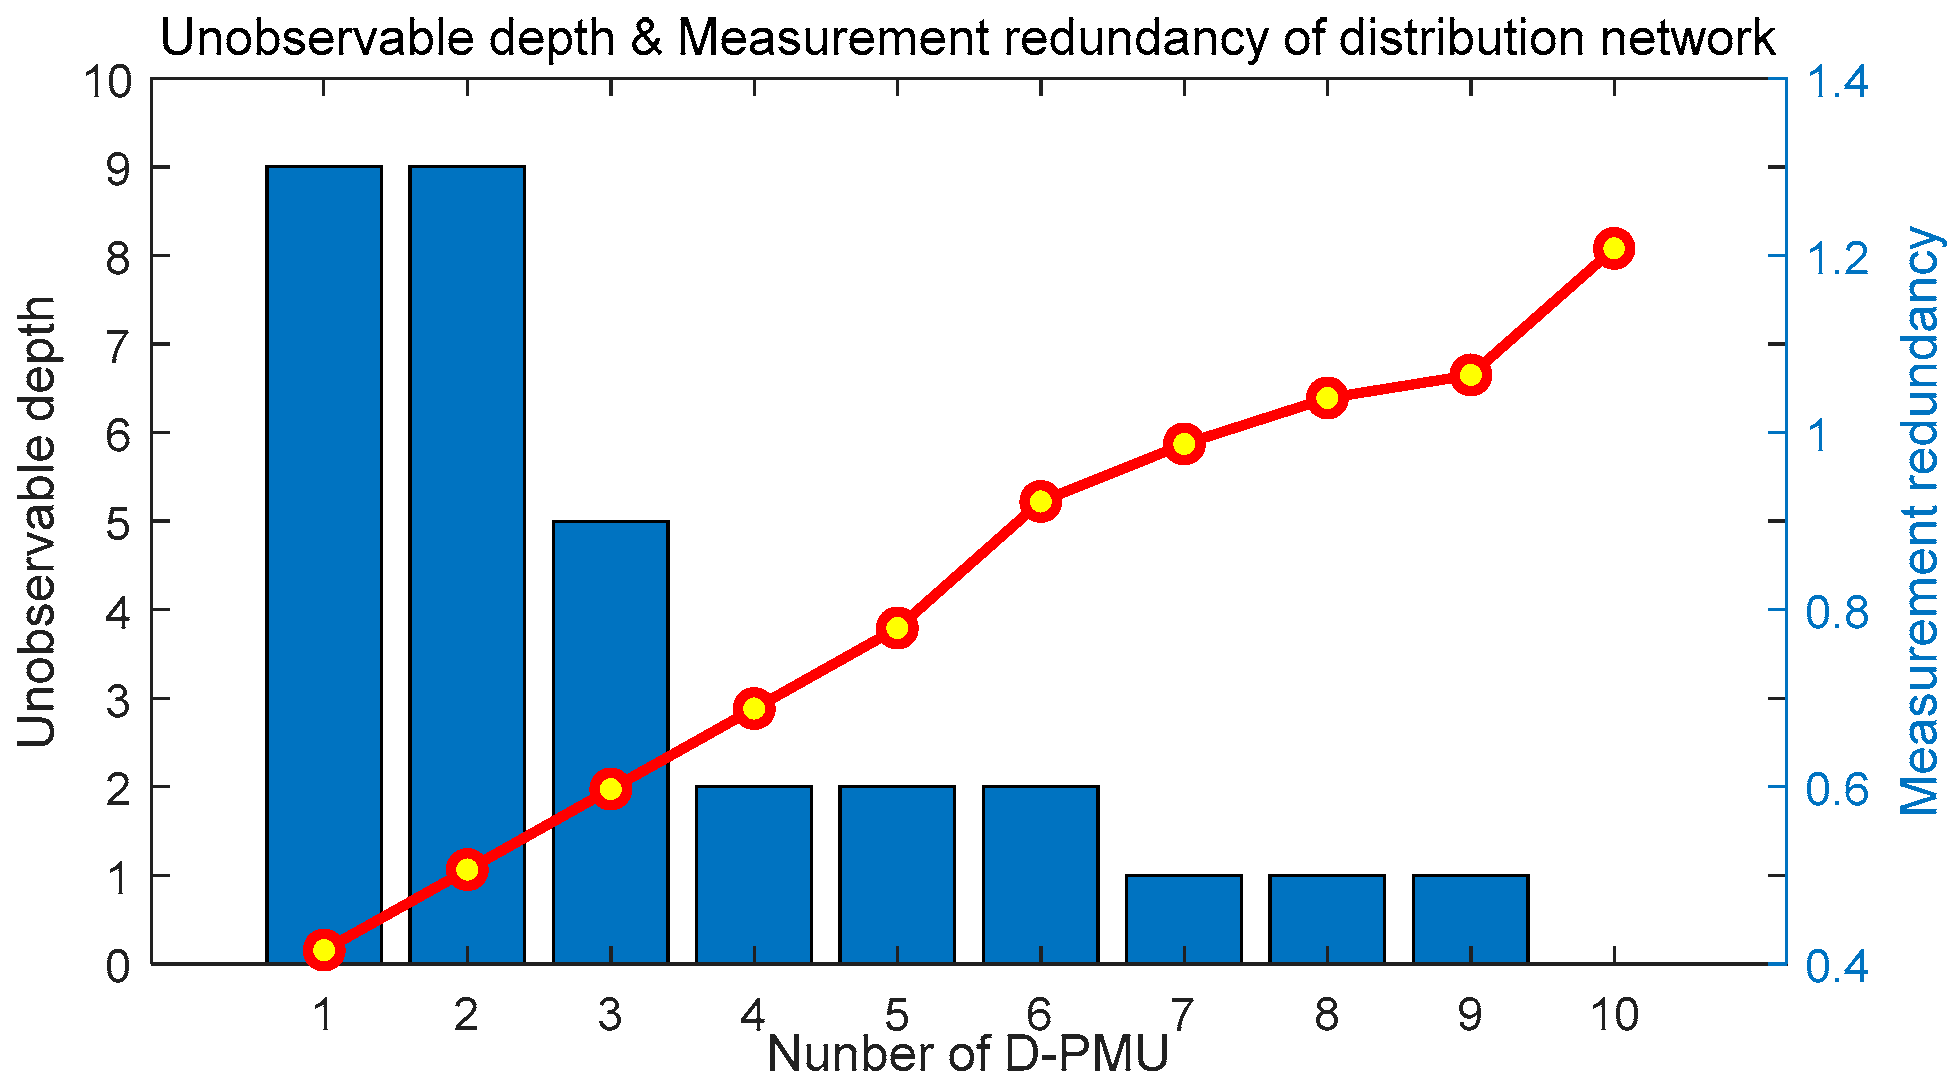
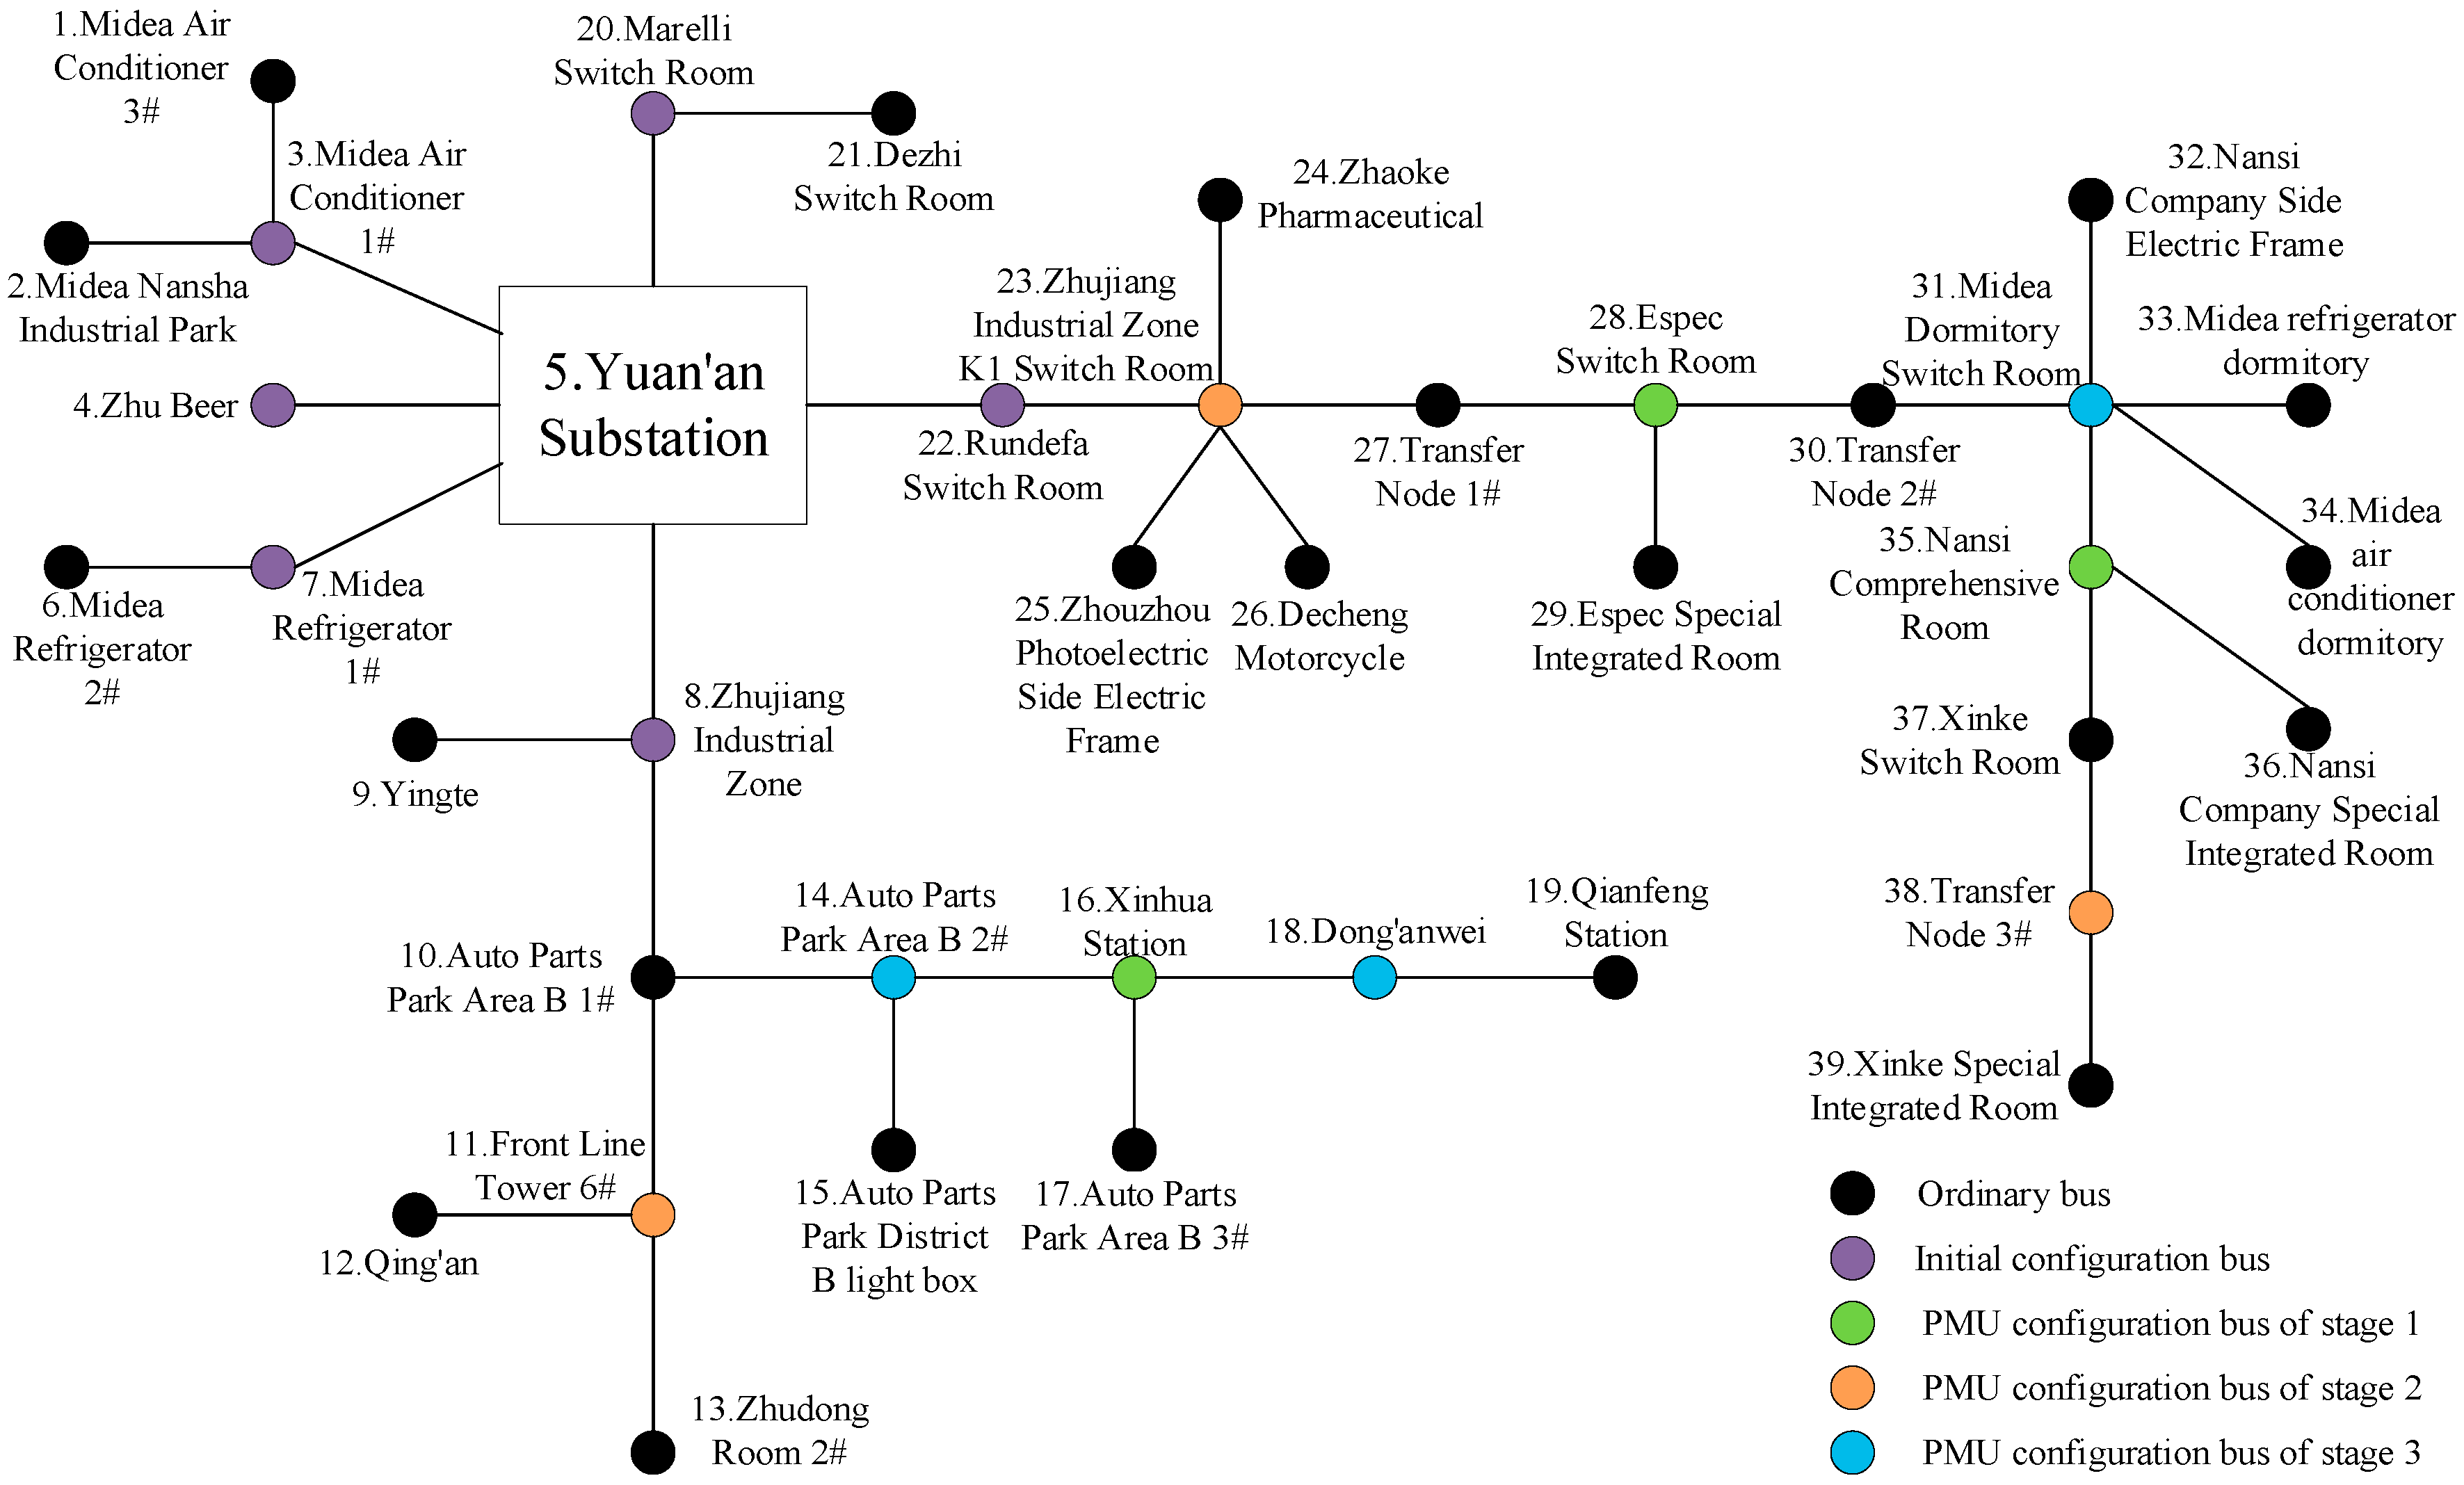
The specific conditions in the actual project are considered to ensure the communication of the Yuan’an substation: D-PMUs are initially placed at buses 3, 4, 7, 8, 20, 22. After the initial placement is completed, the number of observable buses in the system is 14, and the unobservable depth is 8. Using the method proposed in this paper to perform optimal D-PMU placement, the placement scheme and the placement effect of each stage are shown in Table 6. The unobservable depth and observability of each stage are shown in Figure 13, and the change of the unobservable depth and measurement redundancy of the system with the number of D-PMU placement is shown in Figure 14. The D-PMU placement topology are shown in Figure 15.

Table 6.
The specific scheme of the Yuan’an station.
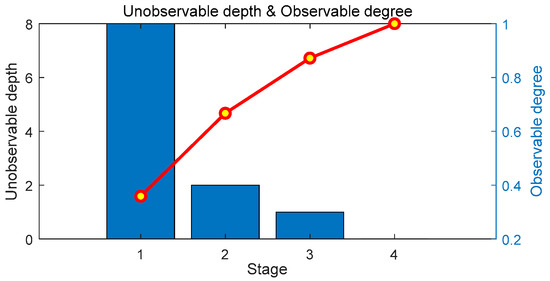
Figure 13.
Unobservable depth and observable degree of theYuan’an substation.
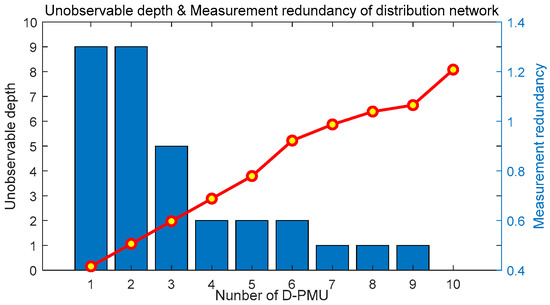
Figure 14.
Unobservable depth and measurement redundancy of the Yuan’an substation.
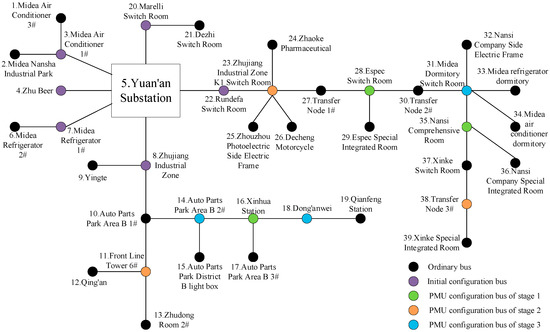
Figure 15.
D-PMU placement topology of the Yuan’an substation.
In order to further analyze the performance of the proposed method, the simulation results of the proposed method in IEEE 33 system and Yuan’an substation system are compared with those of other methods in [28,32]. The comparison results are shown in Table 7.

Table 7.
Comparison of optimal solutions in the IEEE 33 system and the Yuan’an substation systems.
As shown in Table 7, compared with the methods in references [28,32], in terms of the effect of the solution, the optimal D-PMU placement method proposed in this paper can provide the optimal solution with the minimum number of D-PMU required for complete observability. It shows that the proposed method is practical. In terms of the speed of the solution, the computational complexity is increased because the bus vulnerability index is considered in the optimal placement, so the calculation time is slightly longer than the ordinary genetic algorithm, but still within an acceptable range.
5. Conclusions
A one-time and multistage optimal D-PMU placement method for smart distribution networks and software implementation technology are studied in this paper. Taking the bus differences into consideration, the one-time optimal D-PMU placement method considering bus vulnerability index and zero injection bus is proposed. The constraints in the different operating states of the system are considered in the method. The proposed method can provide the most economical solution with the minimum number of D-PMUs required to ensure complete observability Even if the number of D-PMUs is the same, under the constraint of the bus weights, the optimal locations can be determined to obtain the maximum measurement redundancy, thereby improving the state estimation accuracy. On the basis of the one-time method, the multistage optimal D-PMU placement method based on reducing the unobservable depth of the system step by step is proposed. It can obtain the optimal D-PMU placement sequence to make D-PMUs work best at every stage. An optimal D-PMU placement assistant decision-making software for smart distribution network is designed and developed to provide a more convenient operating platform. The example verification analysis is carried out on the EEE 33 bus system and the Yuan’an substation system, which proves the validity and practicability of the proposed method and developed software. Compared with other methods, the proposed method has better performance in solving effect and solving speed. The expected future work will take the influence of existing conventional measuring equipment and network reconfiguration into consideration.
Author Contributions
X.K. and X.Y. conceived the idea of the study and conducted the research. X.Y. and Y.W. analyzed most of the data and wrote the initial draft of the paper. Y.X. and L.Y. contributed to finalizing this paper.
Funding
This work was supported in part by the Project Supported by the National Key Research and Development Program of China (2017YFB0902900, 2017YFB0902902).
Conflicts of Interest
The authors declare no conflict of interest.
References
- Nielsen, J.J.; Ganem, H.; Jorguseski, L.; Alic, K.; Smolnikar, M.; Zhu, Z.; Pratas, N.K.; Golinski, M.; Zhang, H.; Kuhar, U.; et al. Secure real-time monitoring and management of smart distribution grid using shared cellular networks. IEEE Wirel. Commun. 2017, 24, 10–17. [Google Scholar] [CrossRef]
- Li, P.; Ji, H.R.; Wang, C.S.; Zhao, J.; Song, G.; Ding, F.; Wu, J. Coordinated control method of voltage and reactive power for active distribution networks based on soft open point. IEEE Trans. Sustain. Energy 2017, 8, 1430–1442. [Google Scholar] [CrossRef]
- Stewart, E.M.; Kiliccote, S.; Shand, C.M.; McMorran, A.W.; Arghandeh, R.; von Meier, A. Addressing the challenges for integrating micro-synchrophasor data with operational system applications. In Proceedings of the 2014 IEEE PES General Meeting, National Harbor, MD, USA, 27–31 July 2014; pp. 1–5. [Google Scholar]
- Suh, J.; Hwang, S.; Jang, G. Development of a transmission and distribution integrated monitoring and analysis system for high distributed generation penetration. Energies 2017, 10, 1282. [Google Scholar] [CrossRef]
- Phadke, A.G.; Thorp, J.S. Synchronized Phasor Measurements and Their Applications; Springer: New York, NY, USA, 2008; pp. 29–48. [Google Scholar]
- Wang, B.; Sun, H.D.; Zhang, D.N. Review on data sharing and synchronized phasor measurement technique with application in distribution systems. Proc. CSEE 2015, 35, 1–7. [Google Scholar]
- Li, J.; Liu, H.; Tian, J.N.; Bi, T.S.; Yang, Q.X. Communication protocol and performance analysis for the PMU of distribution network. J. Electr. Power Sci. Technol. 2019, 34, 3–10. [Google Scholar]
- Hooshyar, H.; Baran, M.E.; Firouzi, S.R.; Vanfretti, L. PMU-assisted overcurrent protection for distribution feeders employing Solid State Transformers. Sustain. Energy Grids Netw. 2017, 10, 26–34. [Google Scholar] [CrossRef]
- Welikala, S.; Thelasingha, N.; Akram, M.; Ekanayake, P.B.; Godaliyadda, R.I.; Ekanayake, J.B. Implementation of a robust real-time non-intrusive load monitoring solution. Appl. Energy 2019, 238, 1519–1529. [Google Scholar] [CrossRef]
- Pathirikkat, G.; Balimidi, M.; Maddikara, J.B.R.; Dusmanta, K.M. Remote monitoring system for real time detection and classification of transmission line faults in a power grid using PMU measurements. Prot. Control Mod. Power Syst. 2018, 3, 1–10. [Google Scholar]
- Jia, K.; Gu, C.; Li, L.; Xuan, Z.; Bi, T.; Thomas, D. Sparse voltage amplitude measurement based fault location in large-scale photovoltaic power plants. Appl. Energy 2018, 211, 568–581. [Google Scholar] [CrossRef]
- Su, H.Z.; Wang, C.S.; Li, P.; Liu, Z.; Wu, J. Novel voltage-to-power sensitivity estimation for phasor measurement unit-unobservable distribution networks based on network equivalent. Appl. Energy 2019, 250, 302–312. [Google Scholar] [CrossRef]
- Bento, M.E.C. A hybrid procedure to design a wide-area damping controller robust to permanent failure of the communication channels and power system operation uncertainties. Int. J. Electr. Power Energy Syst. 2019, 110, 118–135. [Google Scholar] [CrossRef]
- Yu, F.Z.; Booth, C.; Dysko, A.; Hong, Q.T. Wide-area backup protection and protection performance analysis scheme using PMU data. Int. J. Electr. Power Energy Syst. 2019, 110, 630–641. [Google Scholar] [CrossRef]
- Li, J.; Liu, H.; Bi, T.S.; Yang, Q.X. A Synchrophasor Measurement Method for Protection and Control. Autom. Electr. Power Syst. 2019, 43, 158–165. [Google Scholar]
- Kong, X.Y.; Wang, Y.T.; Yuan, X.X.; Yu, L. Multi Objective for PMU Placement in Compressed Distribution Network Considering Cost and Accuracy of State Estimation. Appl. Sci. Basel 2019, 9, 1515. [Google Scholar] [CrossRef]
- Korres, G.N.; Georgilakis, P.S.; Koutsoukis, N.C.; Manousakis, N.M. Numerical observability method for optimal phasor measurement units placement using recursive Tabu search method. IET Gener. Transm. Distrib. 2013, 7, 347–356. [Google Scholar]
- Khorram, E.; Taleshian Jelodar, M. PMU placement considering various arrangements of lines connections at complex buses. Int. J. Electr. Power Energy Syst. 2018, 94, 97–103. [Google Scholar] [CrossRef]
- Mao, Y.; Lv, F.P. Optimal PMU placement method based on evolutionary game algorithm. Electr. Power Autom. Equip. 2017, 37, 184–188. [Google Scholar]
- Azizi, S.; Gharehpetian, G.B.; Dobakhshari, A.S. Optimal integration of phasor measurement units in power systems considering conventional measurements. IEEE Trans. Smart Grid 2013, 4, 1113–1121. [Google Scholar] [CrossRef]
- Pal, A.; Mishra, C.; Vullikanti, A.K.S.; Ravi, S.S. General optimal substation coverage algorithm for phasor measurement unit placement in practical systems. IET Gener. Transm. Distrib. 2017, 11, 347–353. [Google Scholar] [CrossRef]
- Kumar, V.S.S.; Thukaram, D. Approach for Multistage Placement of Phasor Measurement Units Based on Stability Criteria. IEEE Trans. Power Syst. 2016, 31, 2714–2725. [Google Scholar] [CrossRef]
- Zhao, H.; Zhao, S.H.; Wang, H.J.; Yue, Y.J. Research on optimal PMU allocation based on section iterative method. Electr. Meas. Instrum. 2016, 53, 14–18. [Google Scholar]
- Wu, S.; Wei, Z.N.; Sun, G.Q.; Zheng, Y.P. Multistage PMU optimal placement considering redundancy. J. Hohai Univ. 2013, 41, 184–188. [Google Scholar]
- Manousakis, N.M.; Korres, G.N. A weighted least squares algorithm for optimal PMU placement. IEEE Trans. Power Syst. 2013, 13, 3499–3500. [Google Scholar] [CrossRef]
- Aminifar, F.; Fotuhi-Firuzabad, M.; Safdarian, A. Optimal PMU placement based on probabilistic cost/benefit analysis. IEEE Trans. Power Syst. 2013, 28, 566–567. [Google Scholar] [CrossRef]
- Aminifar, M.; Fotuhi-Firuzabad, M.; Shahidehpour, M.; Khodaei, A. Probabilistic multistage PMU placement in electric power systems. IEEE Trans. Power Deliv. 2011, 26, 841–849. [Google Scholar] [CrossRef]
- Yuan, P.; Ai, Q.; Zhao, Y.Y. Research on Multi-objective Optimal PMU Placement Based on Error Analysis Theory and Improved GASA. Proc. CSEE 2014, 34, 2178–2187. [Google Scholar]
- Jamuna, K.; Swarup, K. Power system observability using biogeography based optimization. In Proceedings of the International Conference on Sustainable Energy and Intelligent Systems, Chennai, India, 20–22 July 2011; pp. 384–389. [Google Scholar]
- Li, Q.; Cui, T.; Weng, Y.; Negi, R.; Franchetti, F.; Ilic, M. DAn information-theoretic approach to PMU placement in electric power systems. IEEE Trans. Smart Grid 2013, 4, 446–456. [Google Scholar] [CrossRef]
- Chen, X.; Chen, T.; Tseng, K.J.; Sun, Y.; Amaratunga, G. Hybrid approach based on global search algorithm for optimal placement of μPMU in distribution networks. In Proceedings of the IEEE Innovative Smart Grid Technologies, Melbourne, Australia, 28 November–1 December 2016; pp. 559–563. [Google Scholar]
- Abdelsalam, H.A.; Abdelaziz, A.Y.; Osama, R.A.; Salem, R.H. Impact of distribution system reconfiguration on optimal placement of phasor measurement units. In Proceedings of the IEEE Power Systems Conference, Clemson, SC, USA, 11–14 March 2014; pp. 1–6. [Google Scholar]
- Liu, Y.H. Development of Auxiliary Software for Planning and Design of Distribution Network Based on C#. Master’ Thesis, Nanchang University, Nanchang, China, 2018. [Google Scholar]
- Jia, W.J. Design and Implementation of the Auxiliary Decision System for Power Network Planning. Master’ Thesis, North China Electric Power University, Beijing, China, 2016. [Google Scholar]
- Xiao, D.K. Distribution Network Operation, Planning Information Analysis and Software Design. Master’ Thesis, Southeast University, Nanjing, China, 2015. [Google Scholar]
- Yu, H.; Liu, Z.; Li, Y.J. Key nodes in complex networks identified by multiattribute decision-making method. Acta Phys. Sin. 2013, 62, 020204. [Google Scholar]
- Ding, M.; Guo, Y.; Zhang, J.J.; Qian, Y.C.; Qi, X.J.; He, J.; Yi, J. Node vulnerability assessment for complex power grids based on effect risk entropy-weighted fuzzy comprehensive evaluation. Trans. China Electro Tech. Soc. 2015, 30, 214–223. [Google Scholar]
- Ding, S.Q.; Lin, T.; Xu, X.L.; Huang, J.H.; Tian, C.Z. Research on comprehensive vulnerability of grid assessment method based on the improved AHP-entropy. Electr. Meas. Instrum. 2017, 54, 28–33. [Google Scholar]
- Ji, Y.Q. Analytic Hierarchy Process (AHP) Weight Vector Calculation and Its Application Analysis. China Urban Econ. 2015, 52, 47–49. [Google Scholar]
© 2019 by the authors. Licensee MDPI, Basel, Switzerland. This article is an open access article distributed under the terms and conditions of the Creative Commons Attribution (CC BY) license (http://creativecommons.org/licenses/by/4.0/).

