Article

Development of Virtual Air Flow Sensor Using In-Situ Damper Performance Curve in VAV Terminal Unit

1
Department of Architectural Engineering, Graduate School of Yeungnam University, 280 Daehak-Ro, Gyeongsan 38541, Korea
2
Division of Architecture, Inha University, 100 Inha-ro, Incheon 22212, Korea
3
School of Architecture, Yeungnam University, 280 Daehak-Ro, Gyeongsan 38541, Korea
*
Author to whom correspondence should be addressed.
Energies 2019, 12(22), 4307; https://doi.org/10.3390/en12224307
Submission received: 26 September 2019 / Revised: 6 November 2019 / Accepted: 7 November 2019 / Published: 12 November 2019

Abstract

:
In this study, we developed a virtual air flow sensor using an in-situ damper performance curve to secure the stability of control of the variable air volume (VAV) terminal unit, and also established the in-situ measurement procedure. The minimum air flow rate of the VAV terminal unit was related to the energy consumption, it was important to determine the minimum air flow rate suitable for the situation of each room in terms of energy saving. However, it was difficult to set the minimum air flow rate low setpoint due to the low accuracy of the air flow sensor of the VAV terminal unit. This paper suggested a virtual air flow sensing method using an in-situ damper performance curve in the VAV terminal unit. The input factors of the virtual sensor were developed on the basis of the supply fan speed and damper opening ratio, which could be easily obtained from the existing control system. In addition, the in-situ measurement procedure of the virtual air flow sensor was developed by dividing the procedure into five steps. Finally, reliability of the virtual air flow sensor was evaluated through uncertainty analysis of input variables and relative error analysis, in comparison with the conventional air flow rate measurement method. The developed virtual air flow sensor was found to have an uncertainty of up to 8.8%, and it was also found that the closer to the maximum the values of the input variables, the lower the uncertainty. In addition, verification of relative error with respect to the measured values by the hot-wire anemometer was conducted by varying operation conditions to a total of 12 cases, and as a result, relative error was found to be up to 5.6%. In addition, the results of long-term experiment showed that relative error was within about 9.5%, and thus, the feasibility for field application and control was confirmed.

1. Introduction

In general, when the variable air volume (VAV) terminal unit is used, the maximum air flow rate according to the indoor load is estimated at the time of design and the minimum air flow rate is set at 30% to 50% of the maximum air flow rate [1,2]. Since the minimum air flow rate of the VAV terminal unit is related to energy consumption, it is important to determine the minimum air flow rate suitable for the situation of each room, in terms of energy saving [3,4]. However, it is difficult to set the minimum air flow rate setpoint at a low value due to indoor environmental problems, such as indoor air quality and temperature stratification and the low accuracy of the air flow sensor of the VAV terminal unit [5].
The air flow sensor of the VAV terminal unit generally measures air velocity by a pitot tube [6]. However, the accuracy of the sensors is generally low at low air velocities, making it difficult to secure the stability of control [7]. If a hot-wire anemometer is used to measure low air velocities, the accuracy of the sensor can be increased, but it is expensive compared to the pitot-tube anemometer [8]. Therefore, it can incur high costs to install it at every point where air flow measurement is required in the building. Liu [9] studied the feasibility of designing a flow conditioner to increase the airflow measurement accuracy for a VAV terminal unit. However, it is difficult to apply to the existing installed VAV terminal unit because of cost and site conditions. Therefore, a low-cost, high-accuracy air-flow-sensing technology is required to control the minimum air flow rate of the VAV terminal unit.

1.1. VAV Terminal Unit and Volume Damper

The typical VAV terminal unit is composed of an air flow sensor, a damper, and a reheating coil [1,10]. In order to control the air flow supplied to each room, the air flow rate is checked through the air flow sensor installed at the inlet of the terminal unit, and the air flow rate is controlled by adjusting the damper opening ratio. The damper of the terminal unit has operating characteristics according to the type and size, and there is a relationship between the air flow rate according to the change of the opening ratio and differential pressure.
Air volume control dampers are used to adjust unbalanced air flow, change the air flow rate, and partially seal a space. Dampers are classified according to the shape into a single blade, louver type (parallel blade and opposed blade), and slide dampers. The most common type of damper is a louver-type damper. The louver-type damper is a damper with two or more blades, and it has parallel blades that are opened and closed parallel to the shaft as the shaft rotates and opposed blades that are opened and closed in the left and right directions; the opposed blades have better air flow characteristics [11]. The damper control performance can be expressed by the ratio of the pressure loss when no damper is installed in the duct system to the pressure loss when the damper is fully open, as shown in Equation (1).
A = P 1 P 2
The air flow characteristic curve of the damper is shown in Figure 1 [11]. It can be seen that the air flow passing through the air flow control damper is linearly proportional to the opening ratio and pressure loss of the damper. Based on this relationship, the possibility of calculating the air flow rate can be confirmed. The damper of the terminal unit is almost a single blade damper. The damper of the VAV terminal unit accounts for a relatively low amount of the pressure loss in most situations. Thus, the damper tends to operate above the line with a low authority curve [12].

1.2. Typical Airflow Measurement of the VAV Terminal Unit

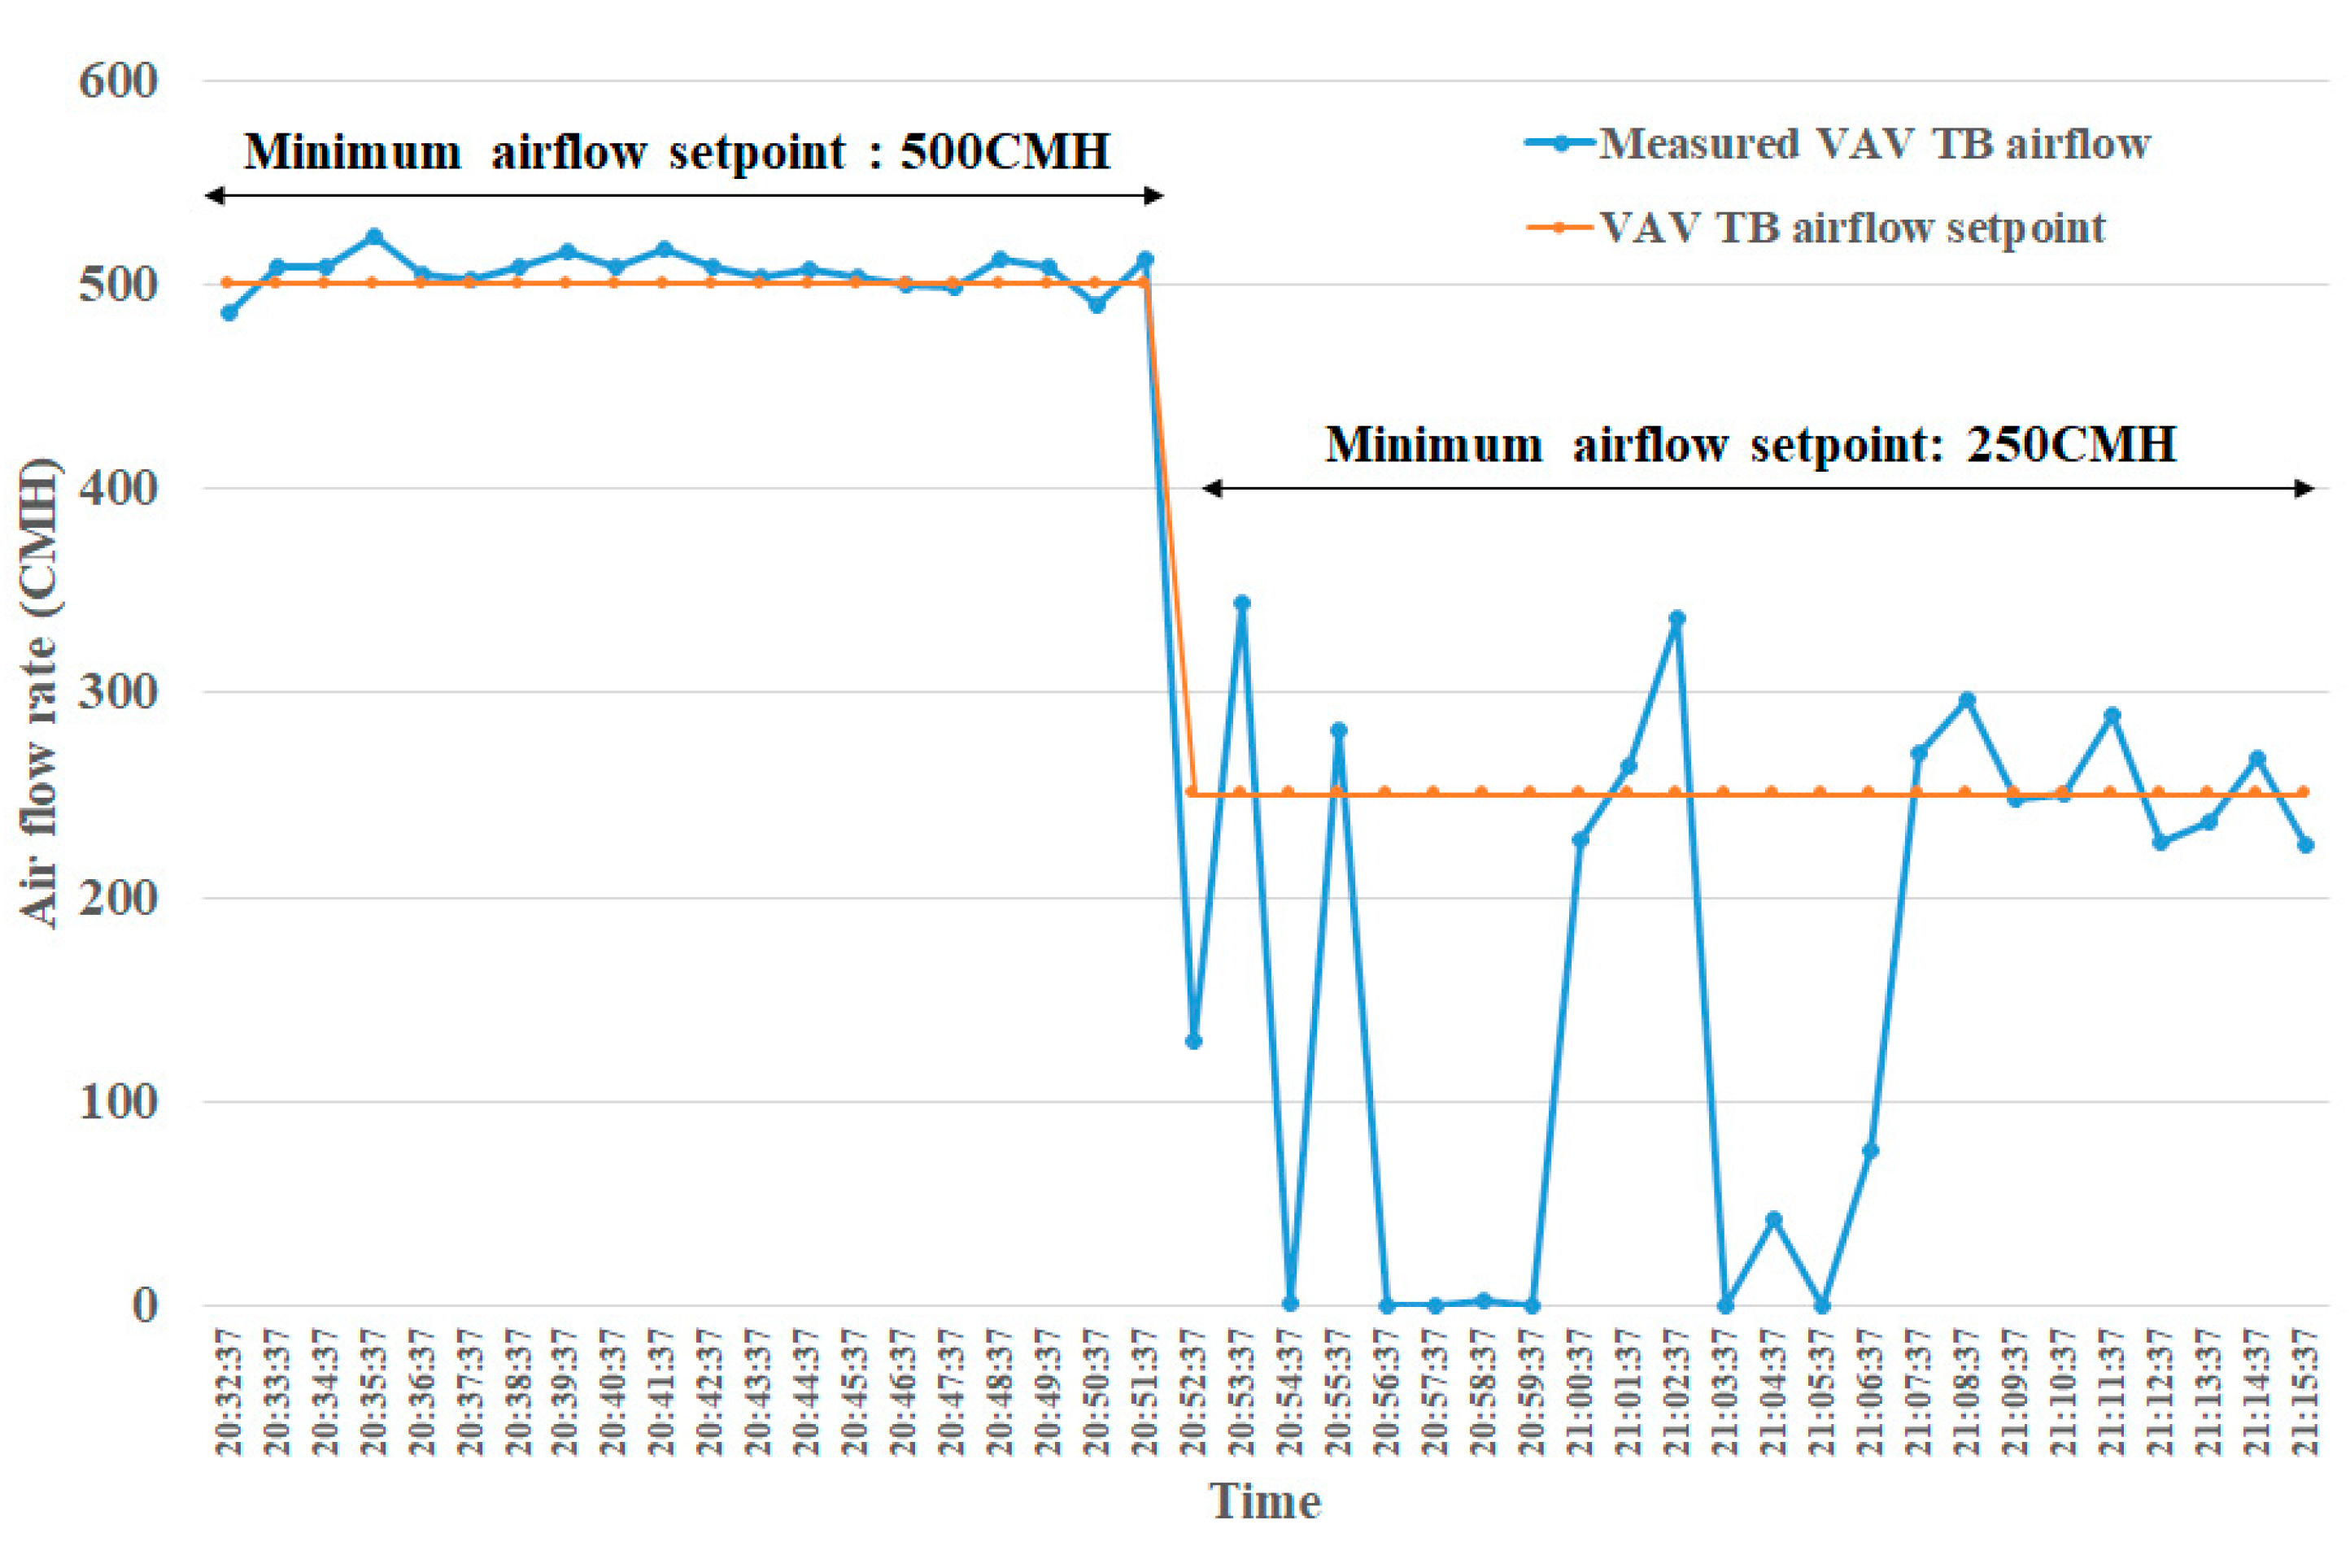
In order to examine the accuracy of the air flow sensor of the VAV terminal unit when the system is operated at the minimum air flow rate, the supply air flow rates according to the change of the minimum air flow rate setpoint were analyzed. The VAV terminal unit used for the analysis of the current status was a terminal unit with the reheating coil. The maximum air flow rate is 0–1360 cubic meter per hour (CMH), and a terminal unit that enables the monitoring and control of the air flow rate by a building automation system (BAS) was selected. The minimum air flow rate setpoint was set at 500 CMH (50% of the maximum air flow rate) and at 250 CMH (25% of the maximum air flow rate), and the air flow rate was measured at 1 min intervals through the BAS. Figure 2 shows the measurement results of air flow rates, according to the change of the minimum air flow setpoint of the VAV terminal unit.
When the minimum air flow rate of the VAV terminal unit was set at 500 CMH, the measured value of the supply air flow rate was 480–524 CMH, so reliability within 5% of the setpoint was confirmed. When the minimum air flow rate was changed to 250 CMH, the measured values of the air flow rate ranged from 0 to 346 CMH, which showed that there was a lack of stability of the air flow control due to the low accuracy of the air flow sensor.
Precise measurement of the minimum air flow is essential for energy saving through advanced VAV system control, such as DCV (demand controlled ventilation) [13], OBC (occupancy-based control) [14], and temperature setpoint reset [15]. It can also be used to fault the detection and diagnostic of air flow sensors and air flow controls in VAV systems [16,17,18]. In recent research, the virtual sensor is a method for estimating a new physical quantity using existing physical quantities [19], and has been developed and applied in many parts (water flow rate of pump [20,21], mixing air temperature [22], etc.) of the heating, ventilation and air conditioning (HVAC) system. Liu [23] has developed a mathematical-based virtual air flow sensor called fan airflow station (FAS). FAS was used to predict the air flow rate in air handling unit (AHU). Wang [24] and Yu [25] developed a virtual air flow sensor using fan power consumption and heat transfer theory, respectively.
In this study, we developed a virtual air flow sensing technology using an in-situ damper performance curve to secure the stability of control of the VAV terminal unit, and also established the in-situ measurement procedure. In addition, the reliability of the virtual air flow sensor was evaluated through an analysis of the uncertainty of input factors and the comparison between the developed and existing air flow measurement methods.

2. Methodology

2.1. Virtual Air Flow Sensor of VAV Terminal Unit

The influencing factors for the HVAC system affecting the air flow rate of the VAV terminal unit are the damper opening ratio, damper differential pressure, and supply fan speed. The in-situ damper performance curve of the VAV terminal unit can be expressed by the quadratic equation of the air flow rate and damper differential pressure at the maximum speed of the supply fan, as shown in Equation (2). In order to derive the coefficients ( a 0 , a 1 , a 2 ) of the in-situ damper performance curve, it is necessary to measure the air flow rate and damper differential pressure, while varying the damper opening ratio with the supply fan running at full speed.
P d p , f = a 0 Q f 2 + a 1 Q f + a 2
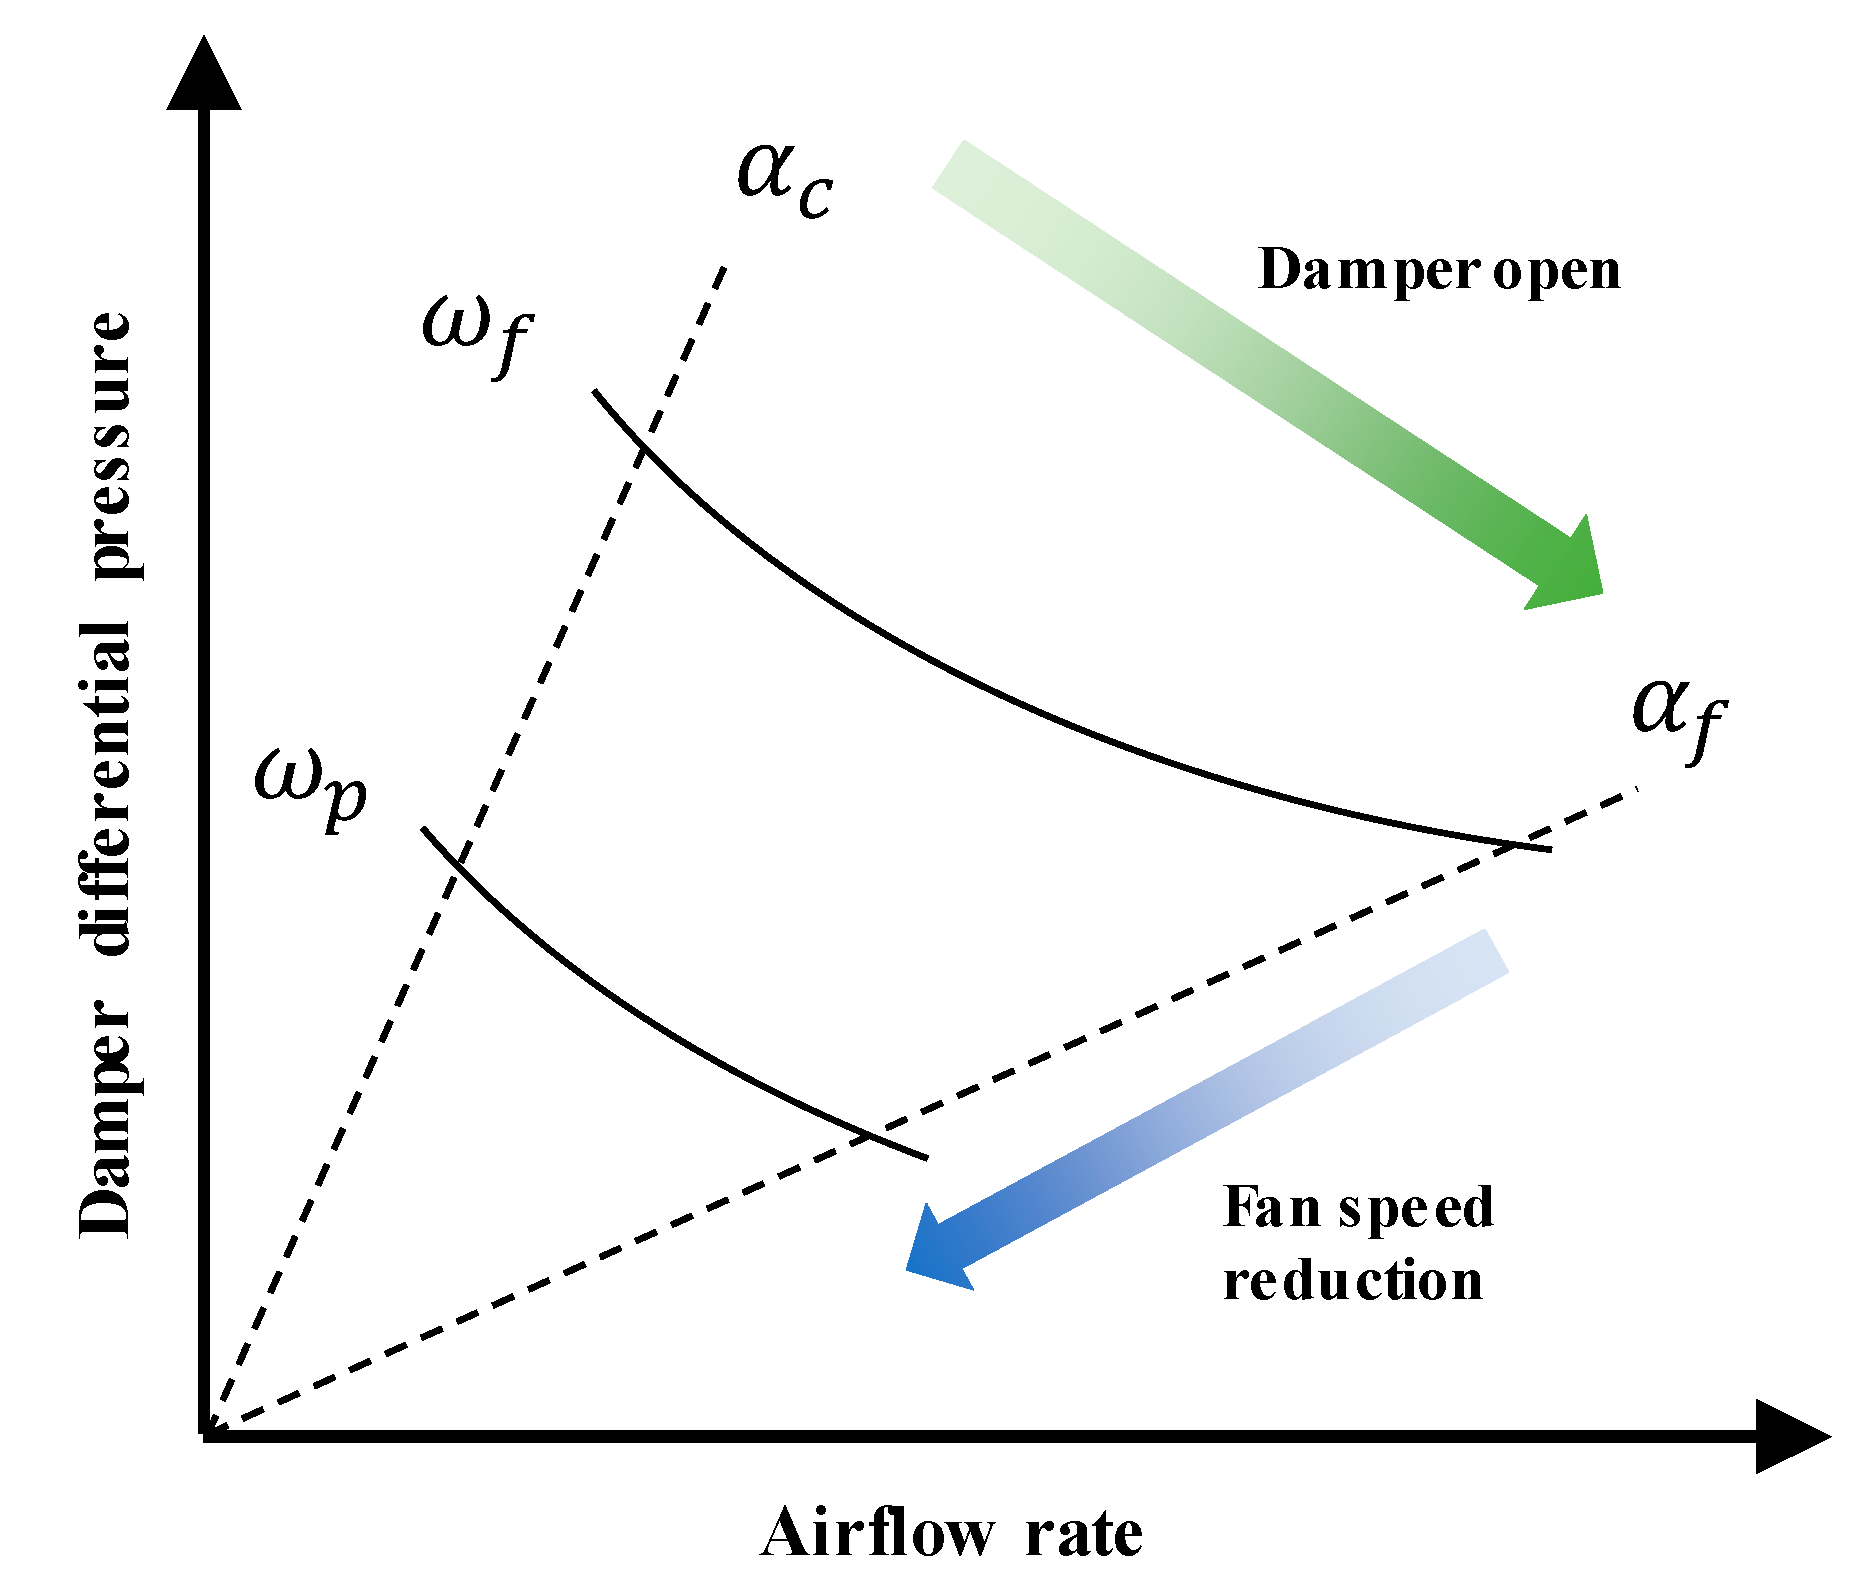
As shown in Figure 3, the air flow rate and damper differential pressure of the VAV terminal unit vary according to the damper opening ratio and the supply fan speed. As the speed of the supply fan changes, the relationship between the air flow rate and differential pressure can be corrected using Equation (3), based on the Fan Laws, and Equation (4) can be derived [6,23].
P d p , f P d p , p = ( ω ¯ f ω ¯ p ) 2 = ( Q f Q p ) 2
P d p , p = a 0 Q p 2 + a 1 Q p ω ¯ + a 2 ω ¯ 2
Q p = a 1 ω ¯ ( a 1 ω ¯ ) 2 4 a 0 ( a 2 ω ¯ 2 P d p , p ) 2 a 0
Using Equation (5), the air flow rate of the VAV terminal unit can be calculated, using the fan speed and damper differential pressure as input values. However, the damper differential pressure sensor must be additionally installed to measure the virtual air flow of the VAV terminal unit. In a building with multiple terminal units, the installation of a damper differential pressure sensor at every point gives rise to the problem of high costs. Therefore, we intend to analyze the relationship between the damper opening ratio and the damper differential pressure, which is one of the existing control factors of terminal units in order to substitute it for damper differential pressure and use it as an input value.
The damper differential pressure can be measured by changing the fan speed at the minimum damper opening ratio, and the relationship between the damper opening ratio and the damper differential pressure ratio can be derived as a cubic equation, as shown in Equation (6). The damper differential pressure ratio can be expressed as the ratio of the partial damper differential pressure to the maximum damper differential pressure for the same fan speed, as shown in Equation (7).
β = b 0 α 3 + b 1 α 2 + b 2 α + b 3
β = P d p , p P d p , m a x
The maximum damper differential pressure according to the change in the fan speed can be derived, as shown in Equation (8).
P d p , m a x = c 0 ω ¯ 3 + c 1 ω ¯ 2 + c 2 ω ¯ 1 + c 3
By combining Equations (6)–(8), Equation (9), which contains the damper opening ratio and fan speed as its components, can be derived from the measured differential pressure. Additionally, Equations (5) and (9) can be combined to derive Equation (10), the final equation for virtual sensing of the air flow rate of the VAV terminal unit.
P d p , p = β P d p , m a x = ( b 0 α 3 + b 1 α 2 + b 2 α + b 3 ) ( c 0 ω ¯ 3 + c 1 ω ¯ 2 + c 2 ω ¯ 1 + c 3 )
Q p = a 1 ω ¯ ( a 1 ω ¯ ) 2 4 a 0 ( a 2 ω ¯ 2 ( b 0 α 3 + b 1 α 2 + b 2 α + b 3 ) ( c 0 ω ¯ 3 + c 1 ω ¯ 2 + c 2 ω ¯ 1 + c 3 ) ) 2 a 0

2.2. In-Situ Measurement Procedure

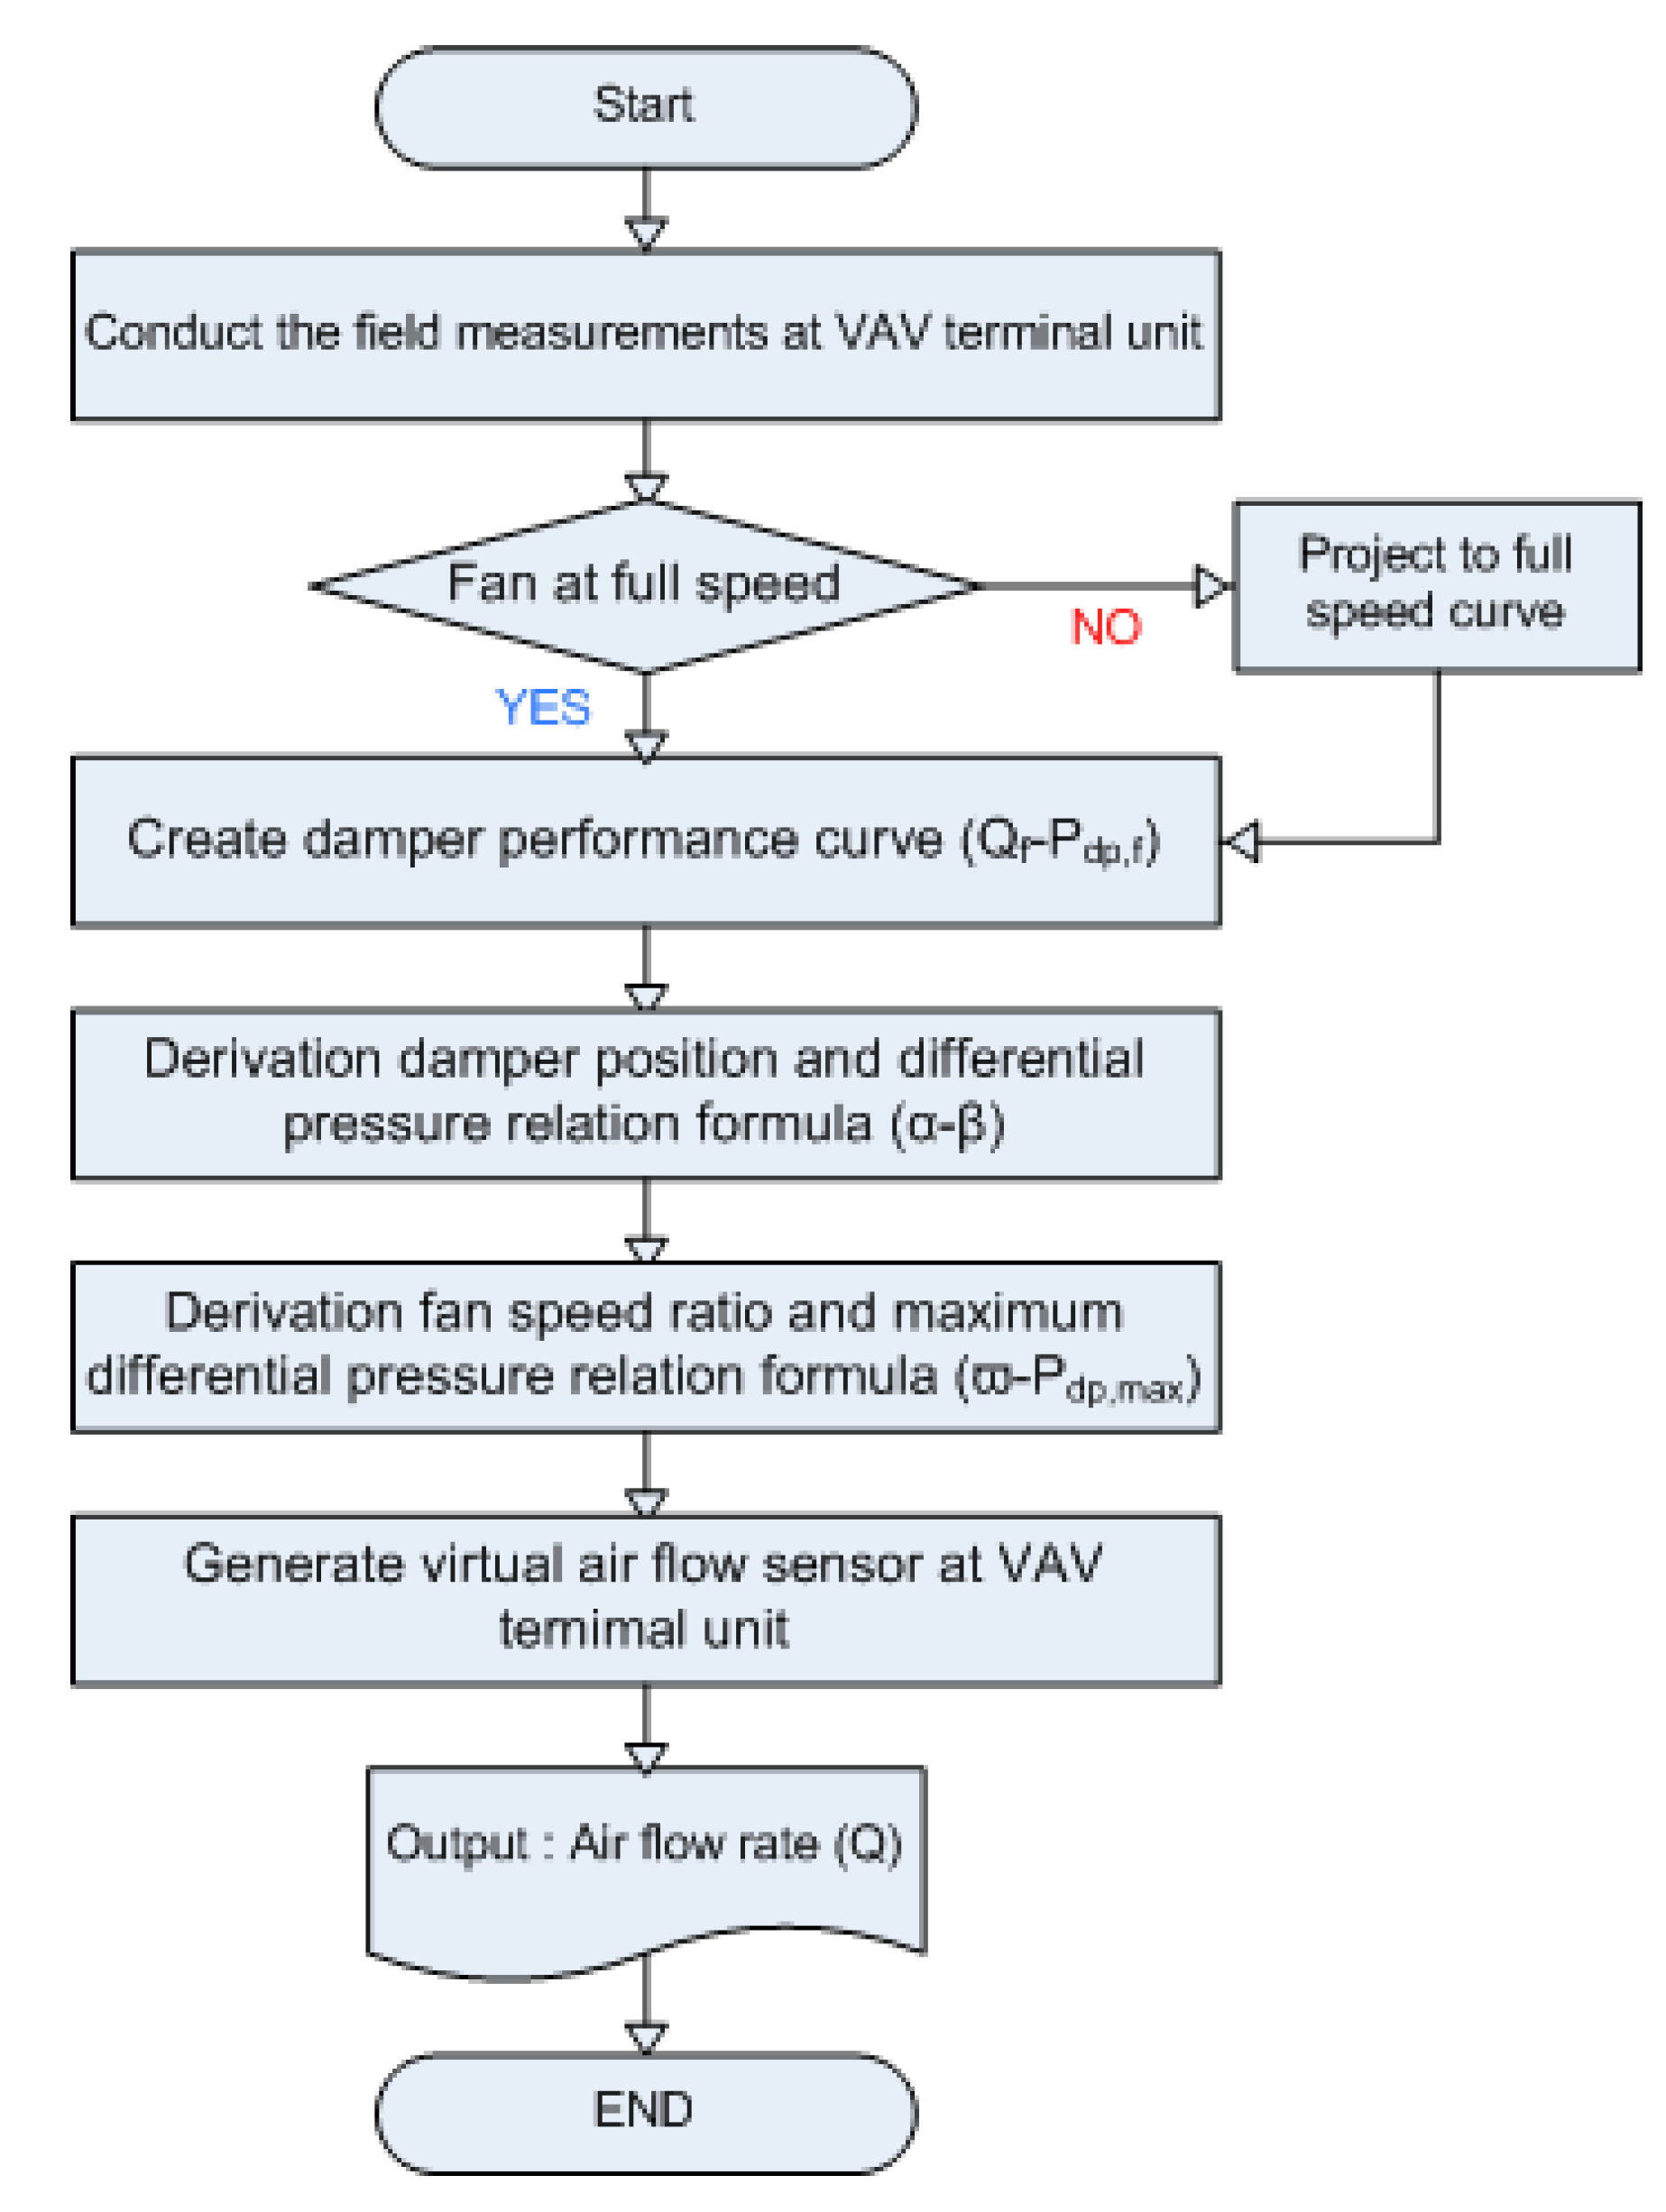
When the hot-wire anemometer, differential pressure sensor, and the BAS system which enables control and measurement of the damper opening ratio and fan speed are prepared, measurements are performed according to the following procedure.
Step 1: The in-situ measurement of the VAV terminal unit is conducted. The measurement is performed twice. First, the damper differential pressure and the air flow rate (or air velocity) are measured by varying the damper opening ratio of the terminal unit at the maximum fan speed. Second, the damper opening ratio of the terminal unit is fixed at the minimum value, and the damper differential pressure and air flow rate (or air velocity) are measured by varying the fan speed.
Step 2: The in-situ damper performance curve is derived from the damper differential pressure and air flow rate of the VAV terminal unit measured by varying the damper opening ratio at the maximum fan speed.
Step 3: The equation for the relationship between the damper opening ratio and differential pressure ratio is derived using the damper differential pressure and the air flow rate of the VAV terminal unit measured by varying the damper opening ratio at the maximum fan speed.
Step 4: The equation for the relationship between the fan speed and the damper differential pressure is derived using the damper differential pressure of the VAV terminal unit measured by varying the supply fan speed at the minimum damper opening ratio.
Step 5: Equation (10) was derived using Equations (3)–(9) for calculating the virtual air flow rate of the VAV terminal unit.
Figure 4 shows the in-situ measurement procedure algorithm for the development of the virtual air flow sensor of the VAV terminal unit.

2.3. Error Analysis

The virtual air flow rate of the VAV terminal unit is calculated using various input variables. The measurement sensors can generate errors in all the input variables, and all the errors in the input variables can affect the calculated air flow rates. Common sensor errors include accuracy and bias errors, and errors can be detected as combined errors [26].
The errors of input variables affecting the calculated virtual air flow rates can be estimated using the Taylor series method, and uncertainty can be calculated using Equation (11) [21,25]. The types and sources of errors in input variables are shown in Table 1.
u Q = ( Q ω ¯ δ ω ¯ ) 2 + ( Q P d p δ P d p ) 2 + ( Q α δ α ) 2 + δ a c u r v e 2 + δ b c u r v e 2 + δ c c u r v e 2
Statistical methods for error analysis, such as the absolute error (AE), relative error (RE), root-mean square error (RMSE), and coefficient of determination (R2), were used to validate the developed virtual air flow sensor. Smaller RMSE and error values indicate a better virtual sensor, in which the R2 value is close to 1 [27]. The statistical values are expressed as Equations (12)–(15).
A E = x m e a s x v i r
R E = x m e a s x v i r x m e a s
R M S E = 1 n ( x m e a s x v i r ) 2 n
R 2 = 1 1 n ( x m e a s x v i r ) 2 1 n ( x v i r ) 2

3. Experimental Verification

3.1. Experimental Setup

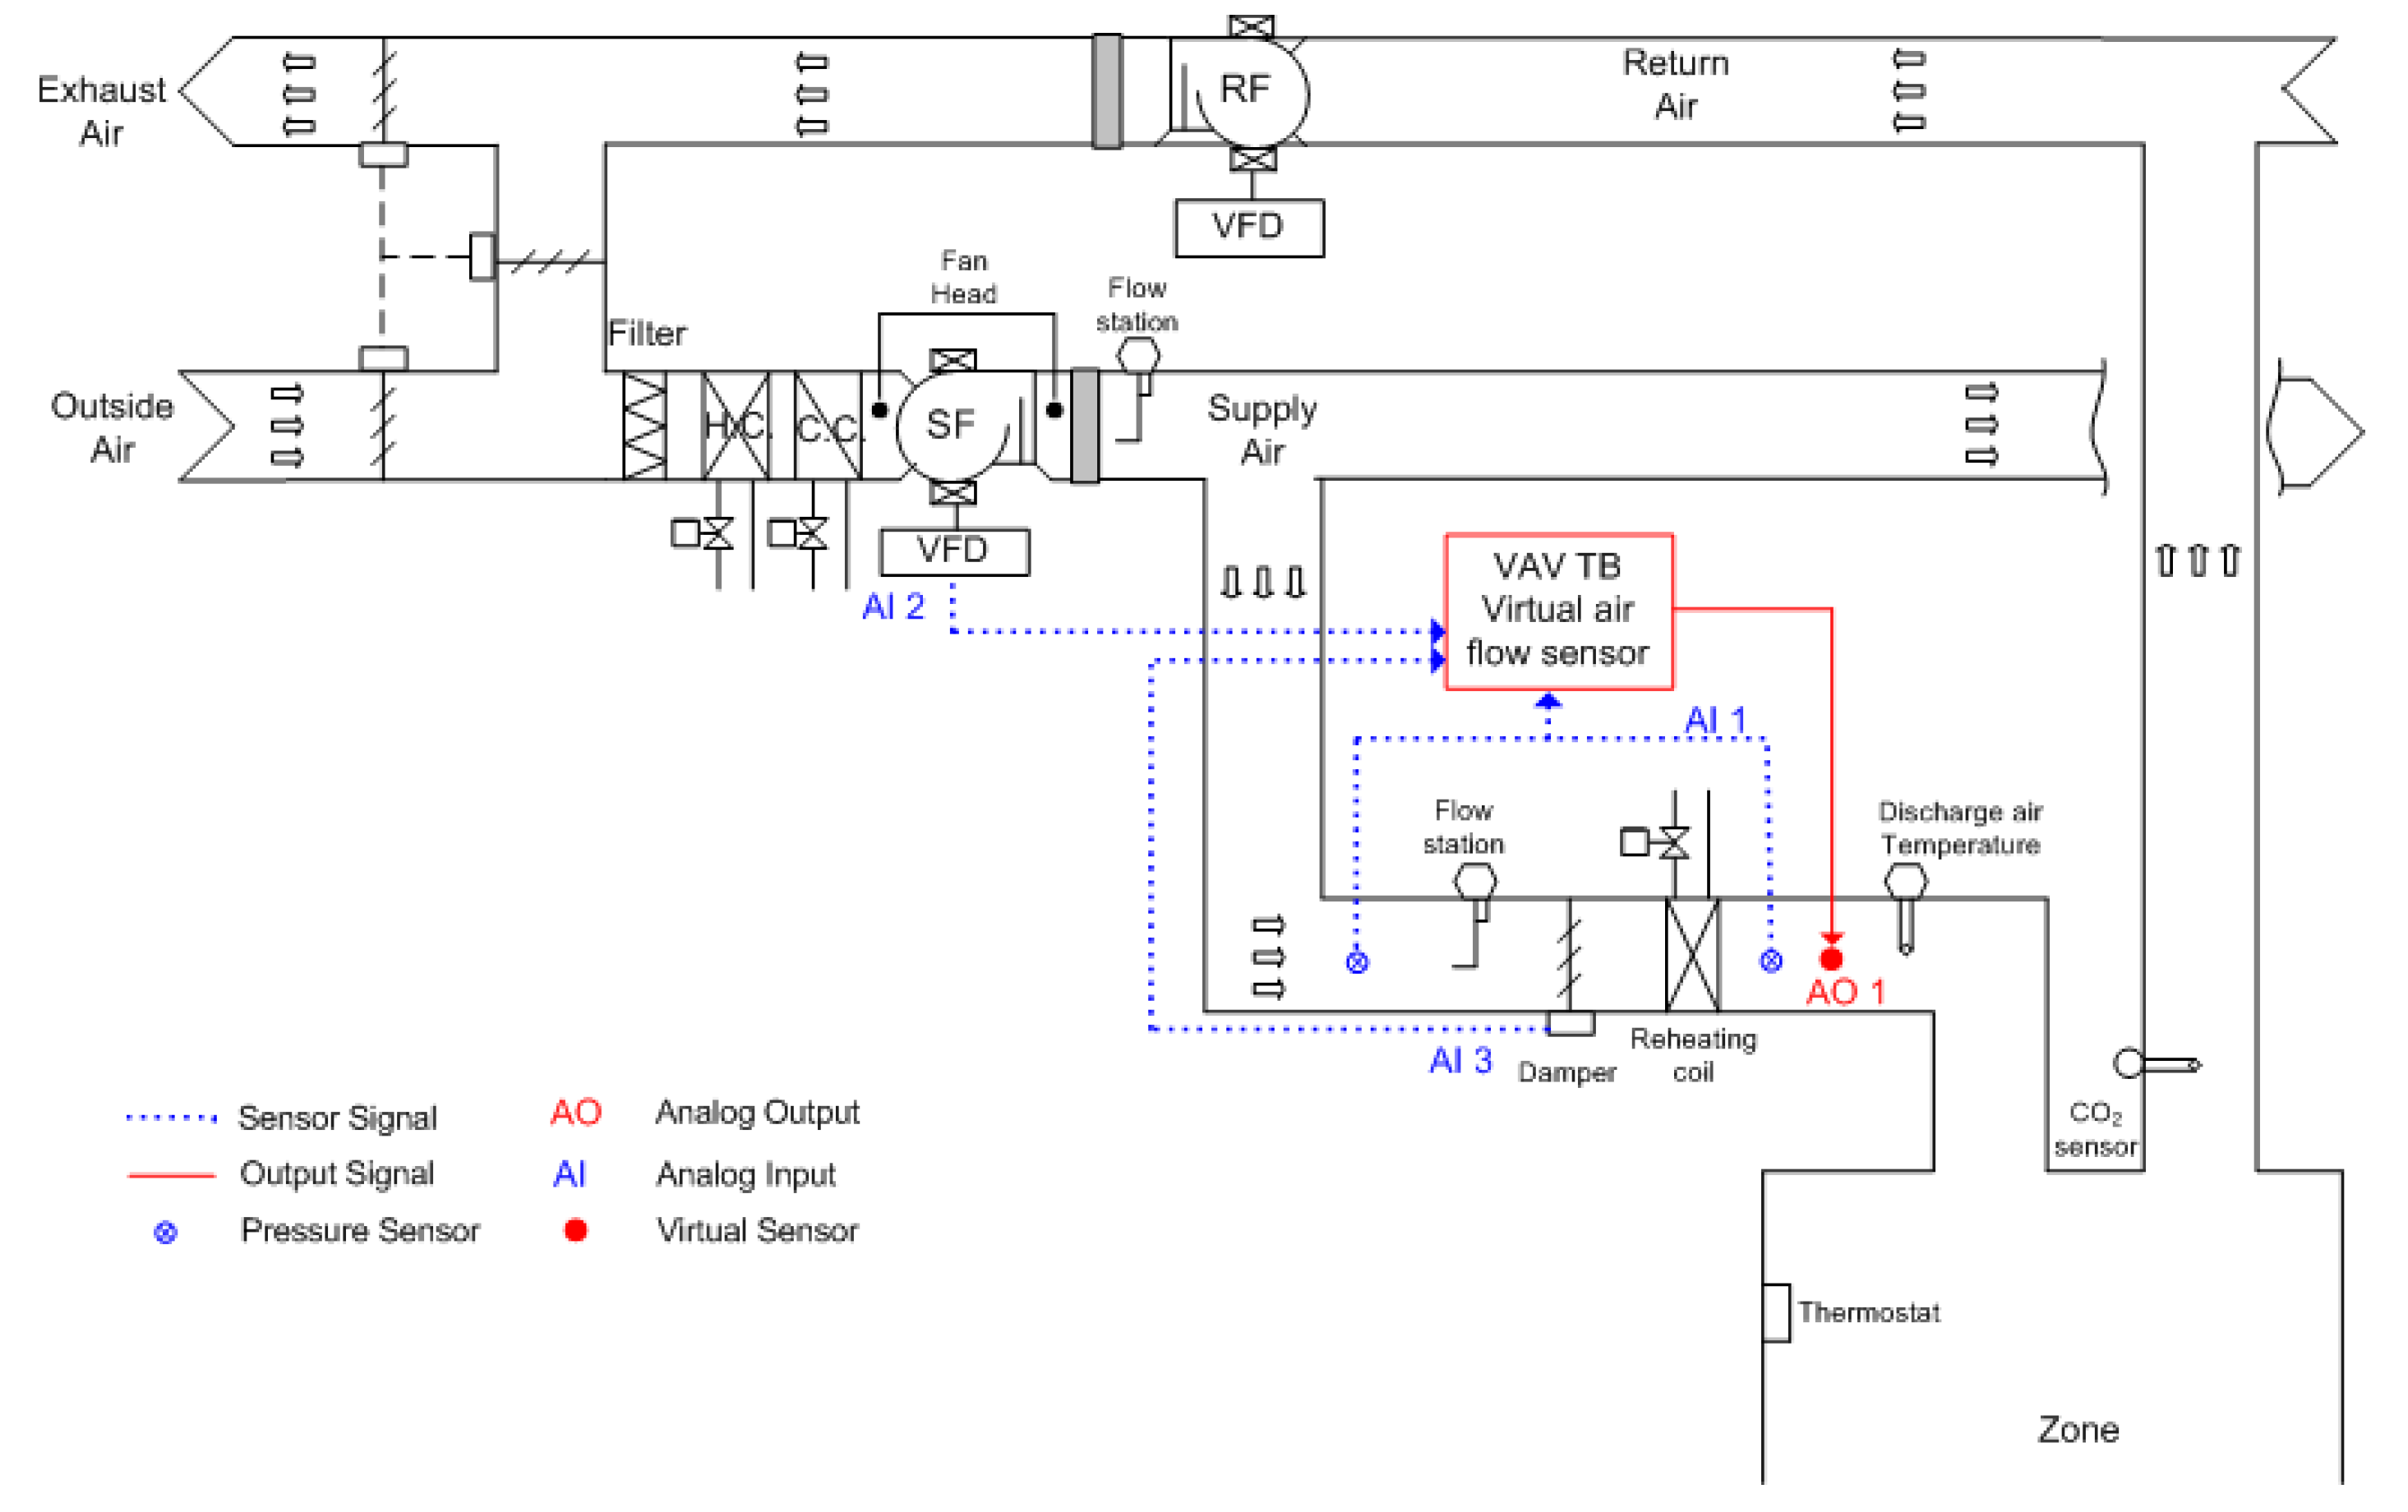
A university laboratory where it was possible to conduct experiments on the HVAC systems was selected as the test-bed for the verification experiment of the virtual air flow sensor of the VAV terminal unit. The target HVAC system provides cooling and heating for a space with 80 m2 of floor area, shown in Figure 5.
The experimental system installed on the test-bed was composed of a VAV terminal unit, a HVAC system, an air-cooled heat pump and a pump. The VAV terminal unit was equipped with a reheating coil, the design air flow rate was 1360 CMH, and heating capacity of the reheating coil was 4000 kcal. The HVAC system was equipped with cold and hot water coils and supply and return fans, and it was capable of variable air volume control through the variable frequency drive (VFD). The air-cooled heat pump supplied cold water to the chilled water coil of the HVAC system and also supplied hot water to the hot water coil of the HVAC system and the reheating coil of the terminal unit. The hot and cold water pumps allowed for variable flow rate control through the VFD. In addition, the entire system was monitored and automatically controlled through the BAS. In this study, the hot-wire anemometer, differential pressure sensor, damper actuator, and VFD of the supply fan were used for development and verification of the virtual air flow sensor. The input data were measured at 1 min intervals. Hot-wire anemometers were installed and measured using ASTM D3464-96 [28]. In addition, another measurement sensor collected data through the BAS. Table 2 shows the specification of the test-bed.

3.2. Implementation of In-Situ Measurement Procedure

Step 1: In-situ measurement was conducted to collect the damper performance data. The measurement results obtained by varying the damper opening ratio of the terminal unit at the maximum fan speed are shown in Table 3. The measurement results obtained by varying the fan speed are shown in Table 4.
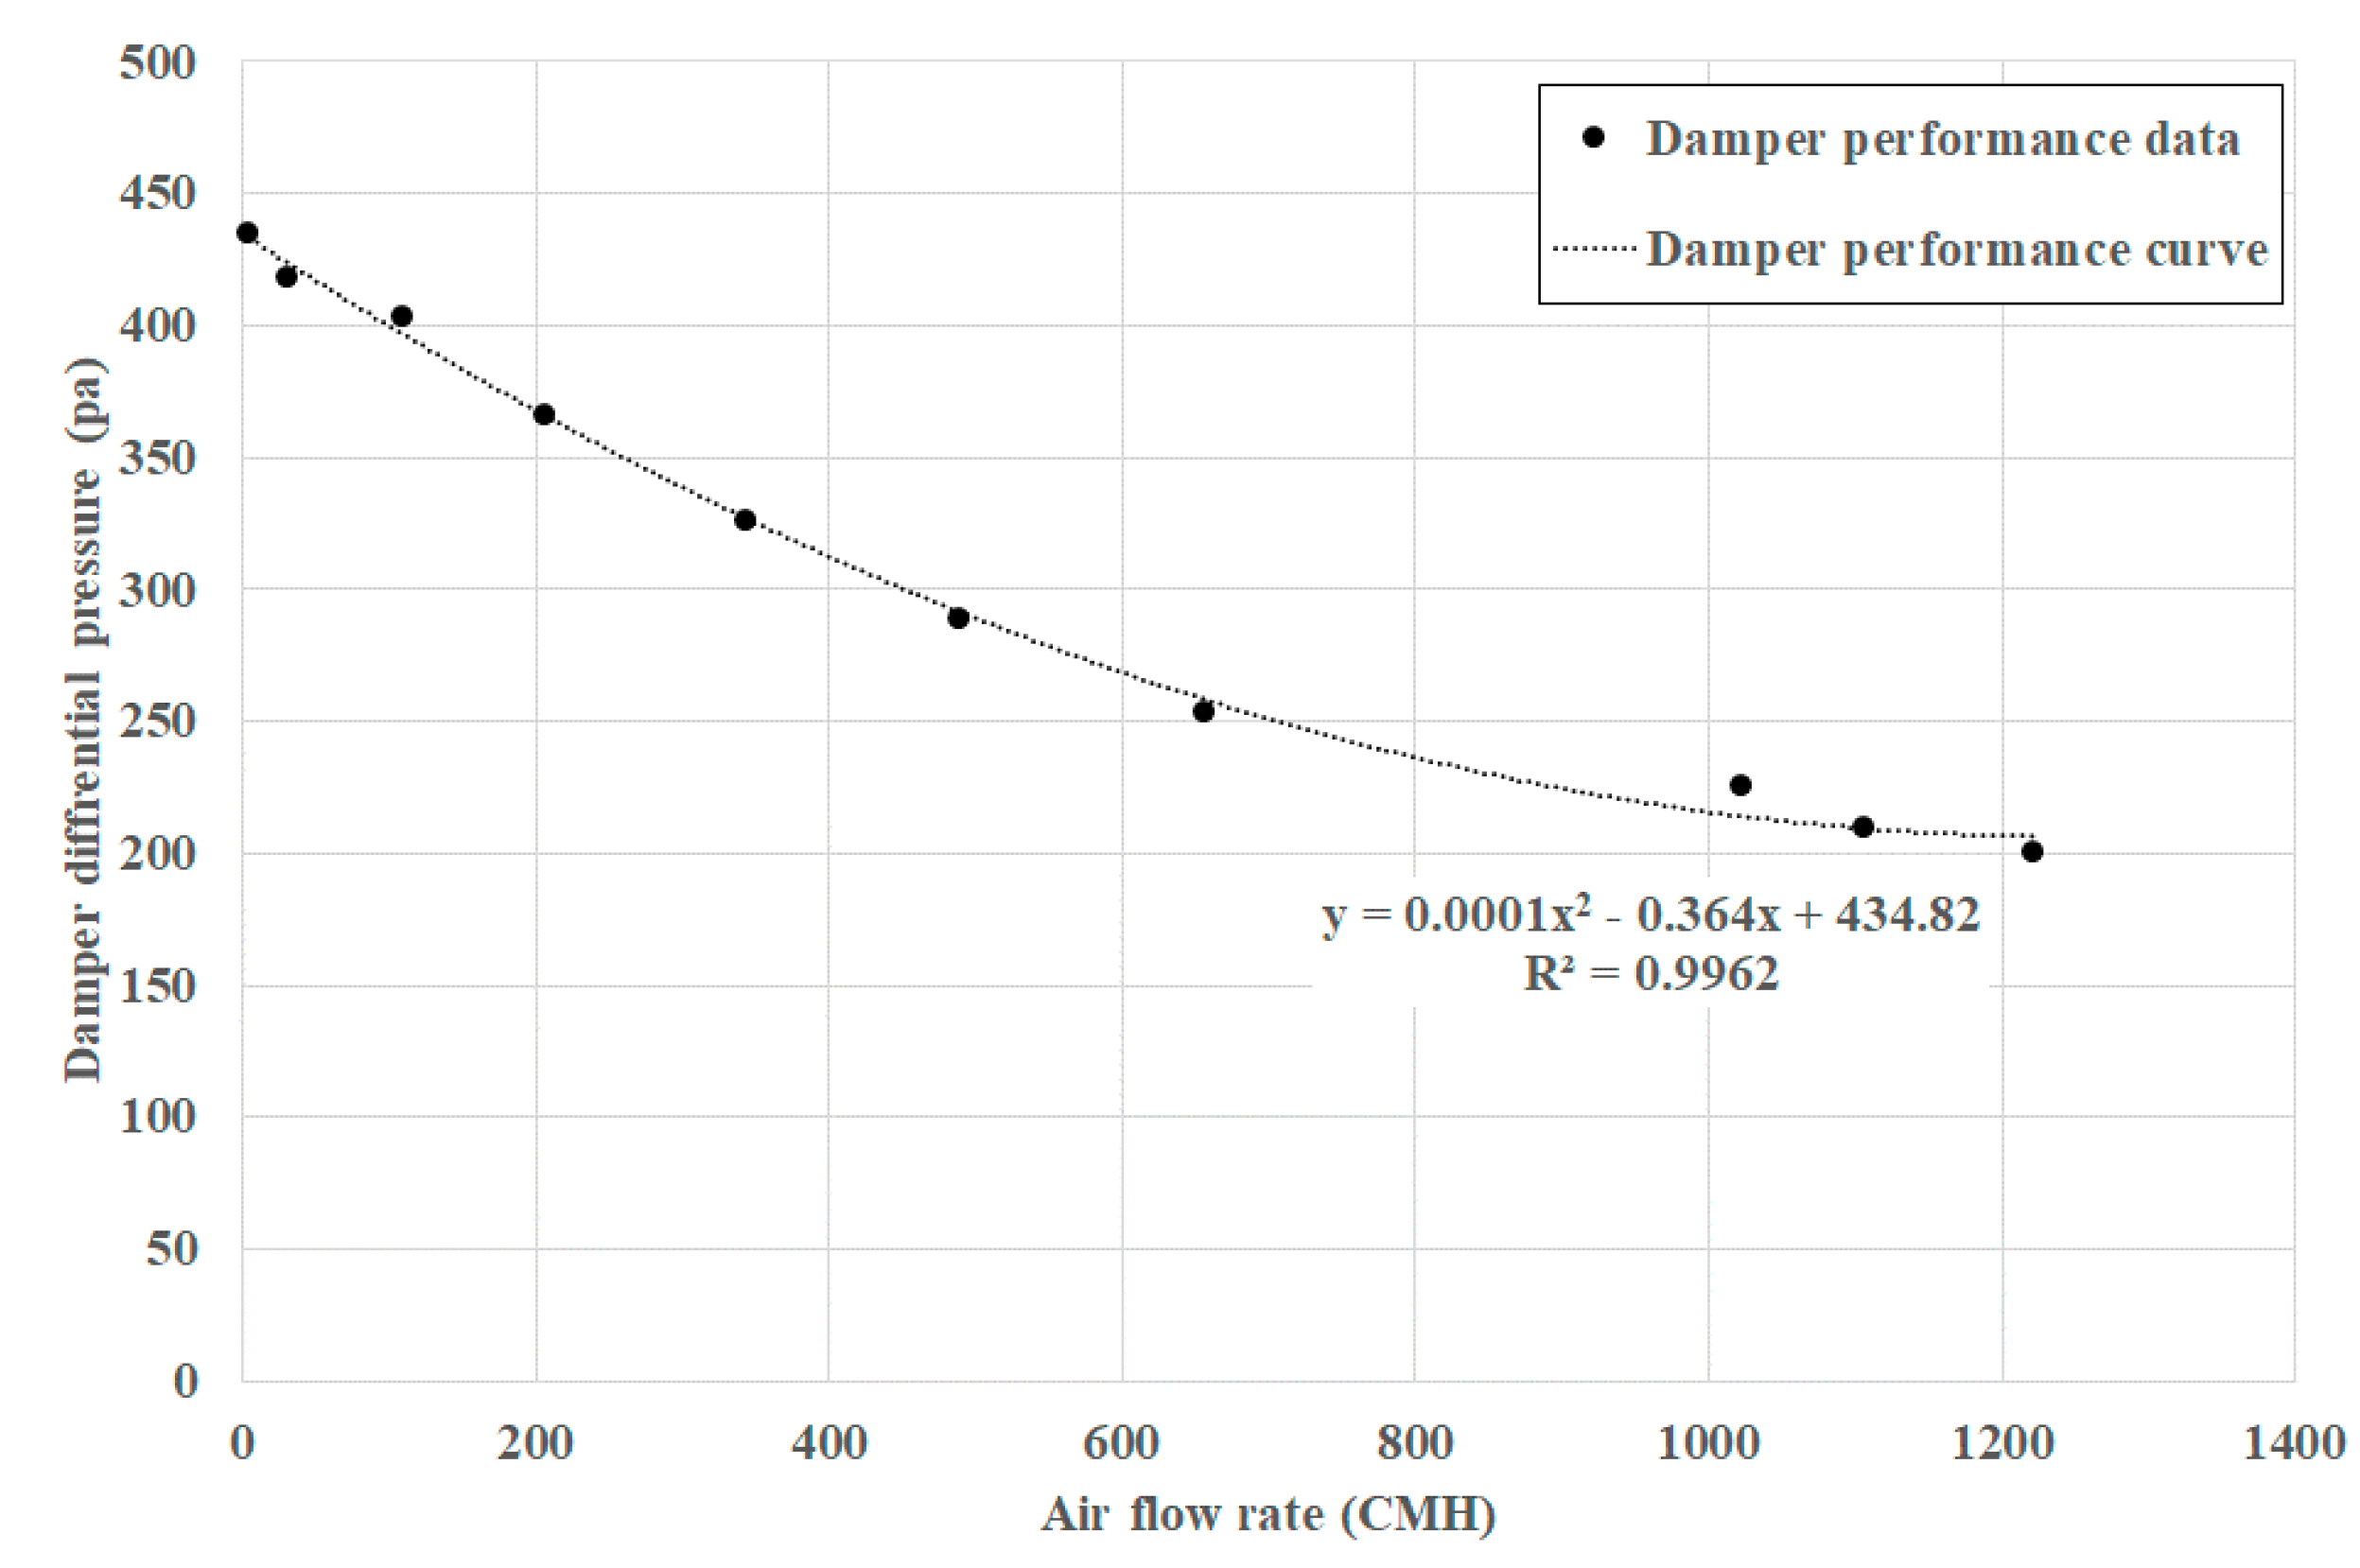
Step 2: The in-situ damper performance curve was derived from the damper differential pressure and air flow rate measured by varying the damper opening ratio at the maximum fan speed, as shown in Figure 6. The in-situ damper performance curve can be represented as a quadratic curve, as shown in Equation (16).
P d p = 0.0001 Q 2 0.364 Q + 434.82
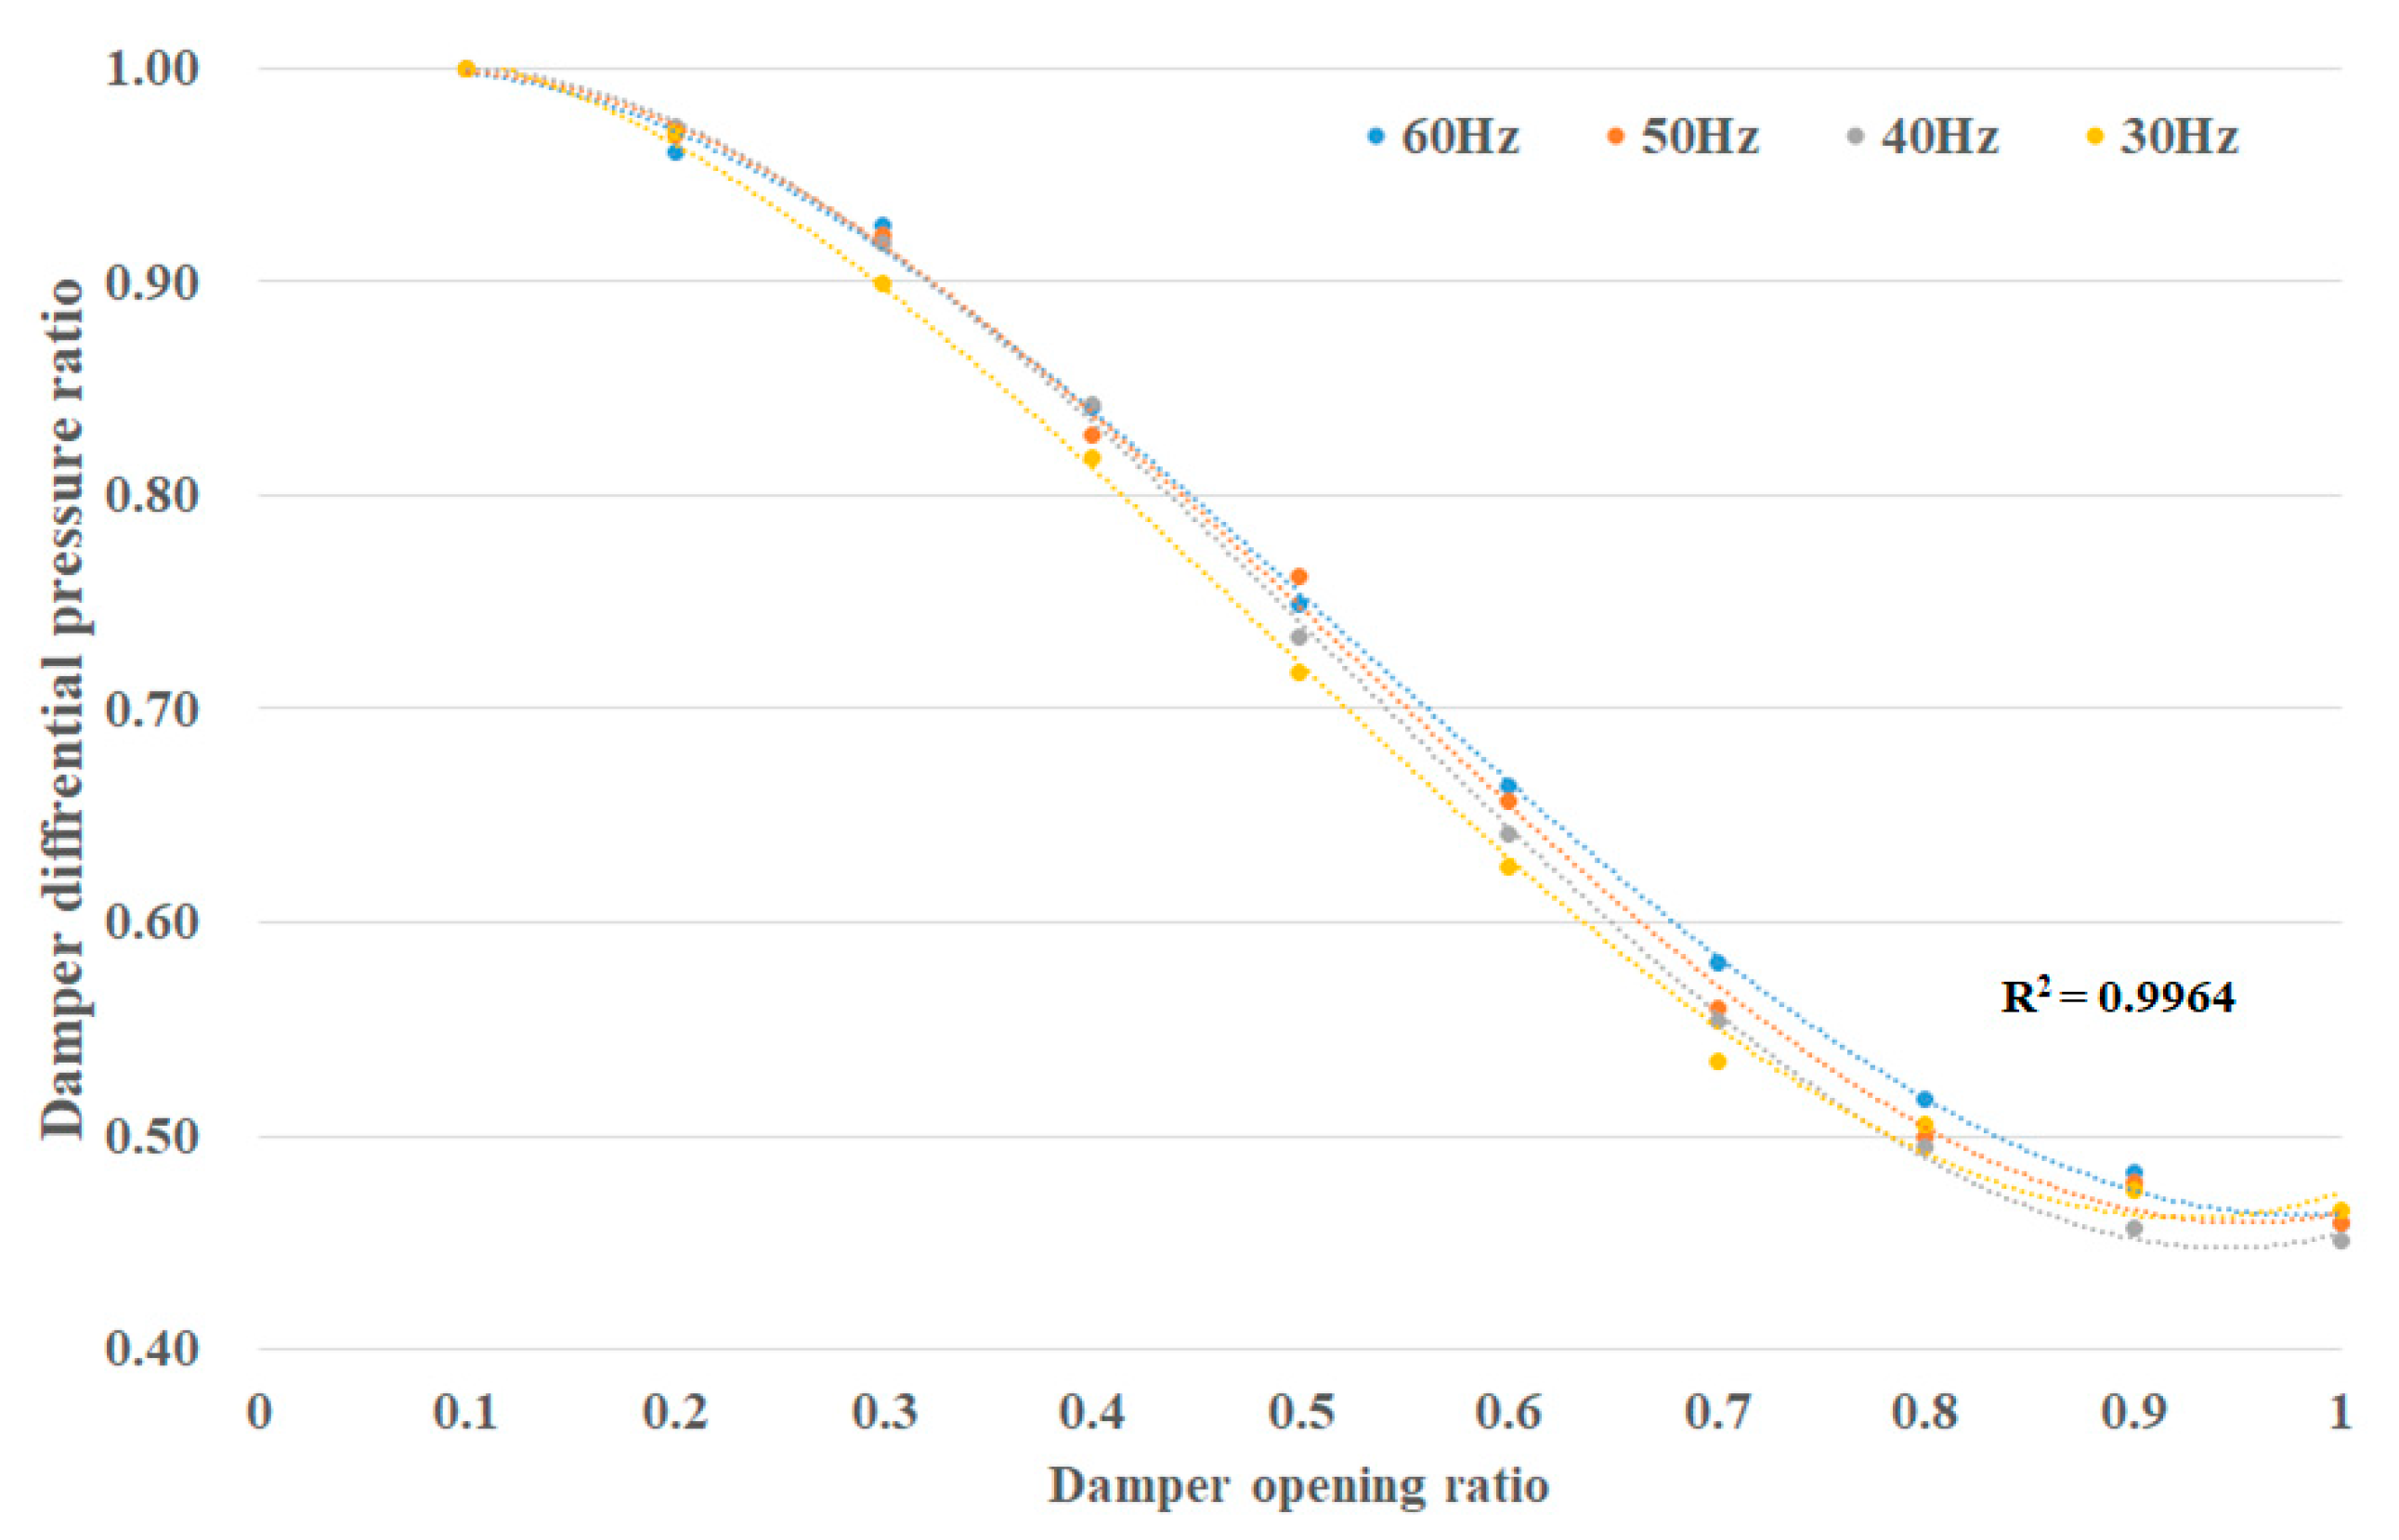
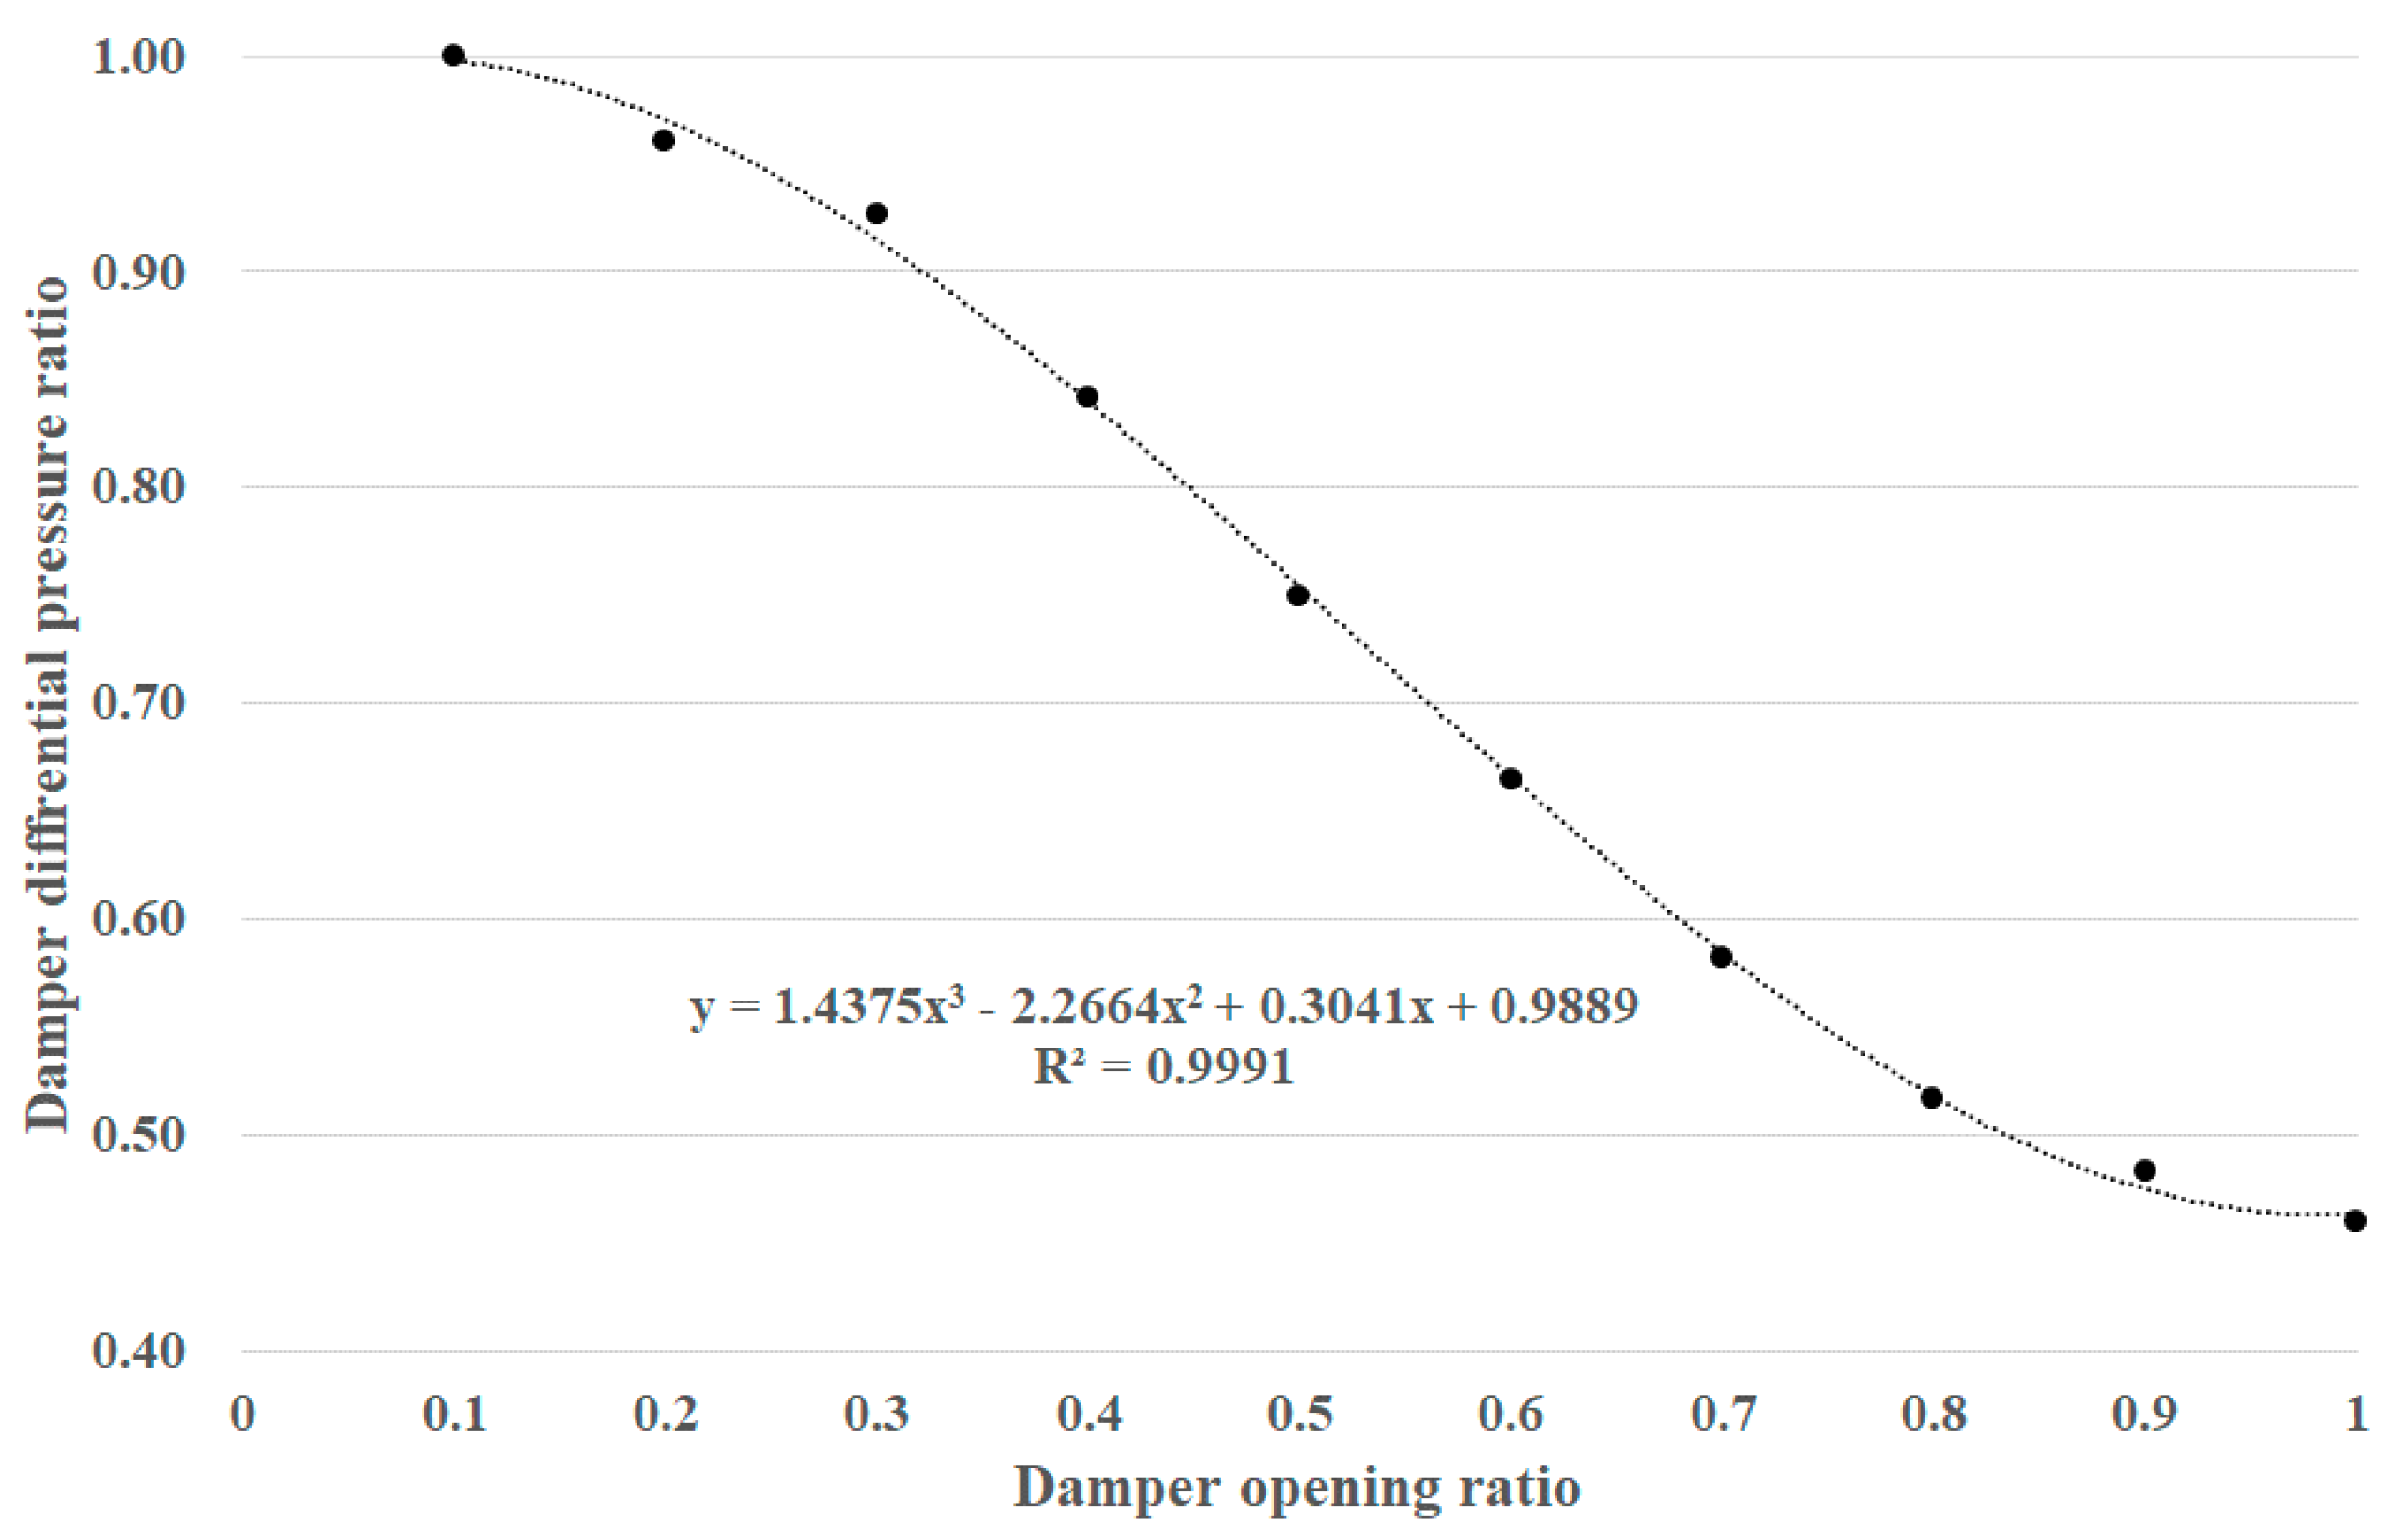
Step 3: The equation for the relationship between the damper opening ratio and differential pressure ratio was derived using the damper differential pressure and air flow rate of the VAV terminal unit measured by varying the damper opening ratio at the maximum fan speed. As shown in Figure 7, analysis of the relationship between the damper opening ratio and damper differential pressure ratio revealed that the variation of the fan speed showed a similar tendency, and the correlation coefficient R2 of 0.9964 indicated a strong correlation. Accordingly, the equation for the relationship between the damper opening ratio and differential pressure ratio was derived by using the measured data at the maximum fan speed, as shown in Figure 8. The relationship between the damper opening ratio and the differential pressure ratio can be represented by a cubic equation, as shown in Equation (17).
β = 1.4375 α 3 2.2664 α 2 + 0.3041 α + 0.9889
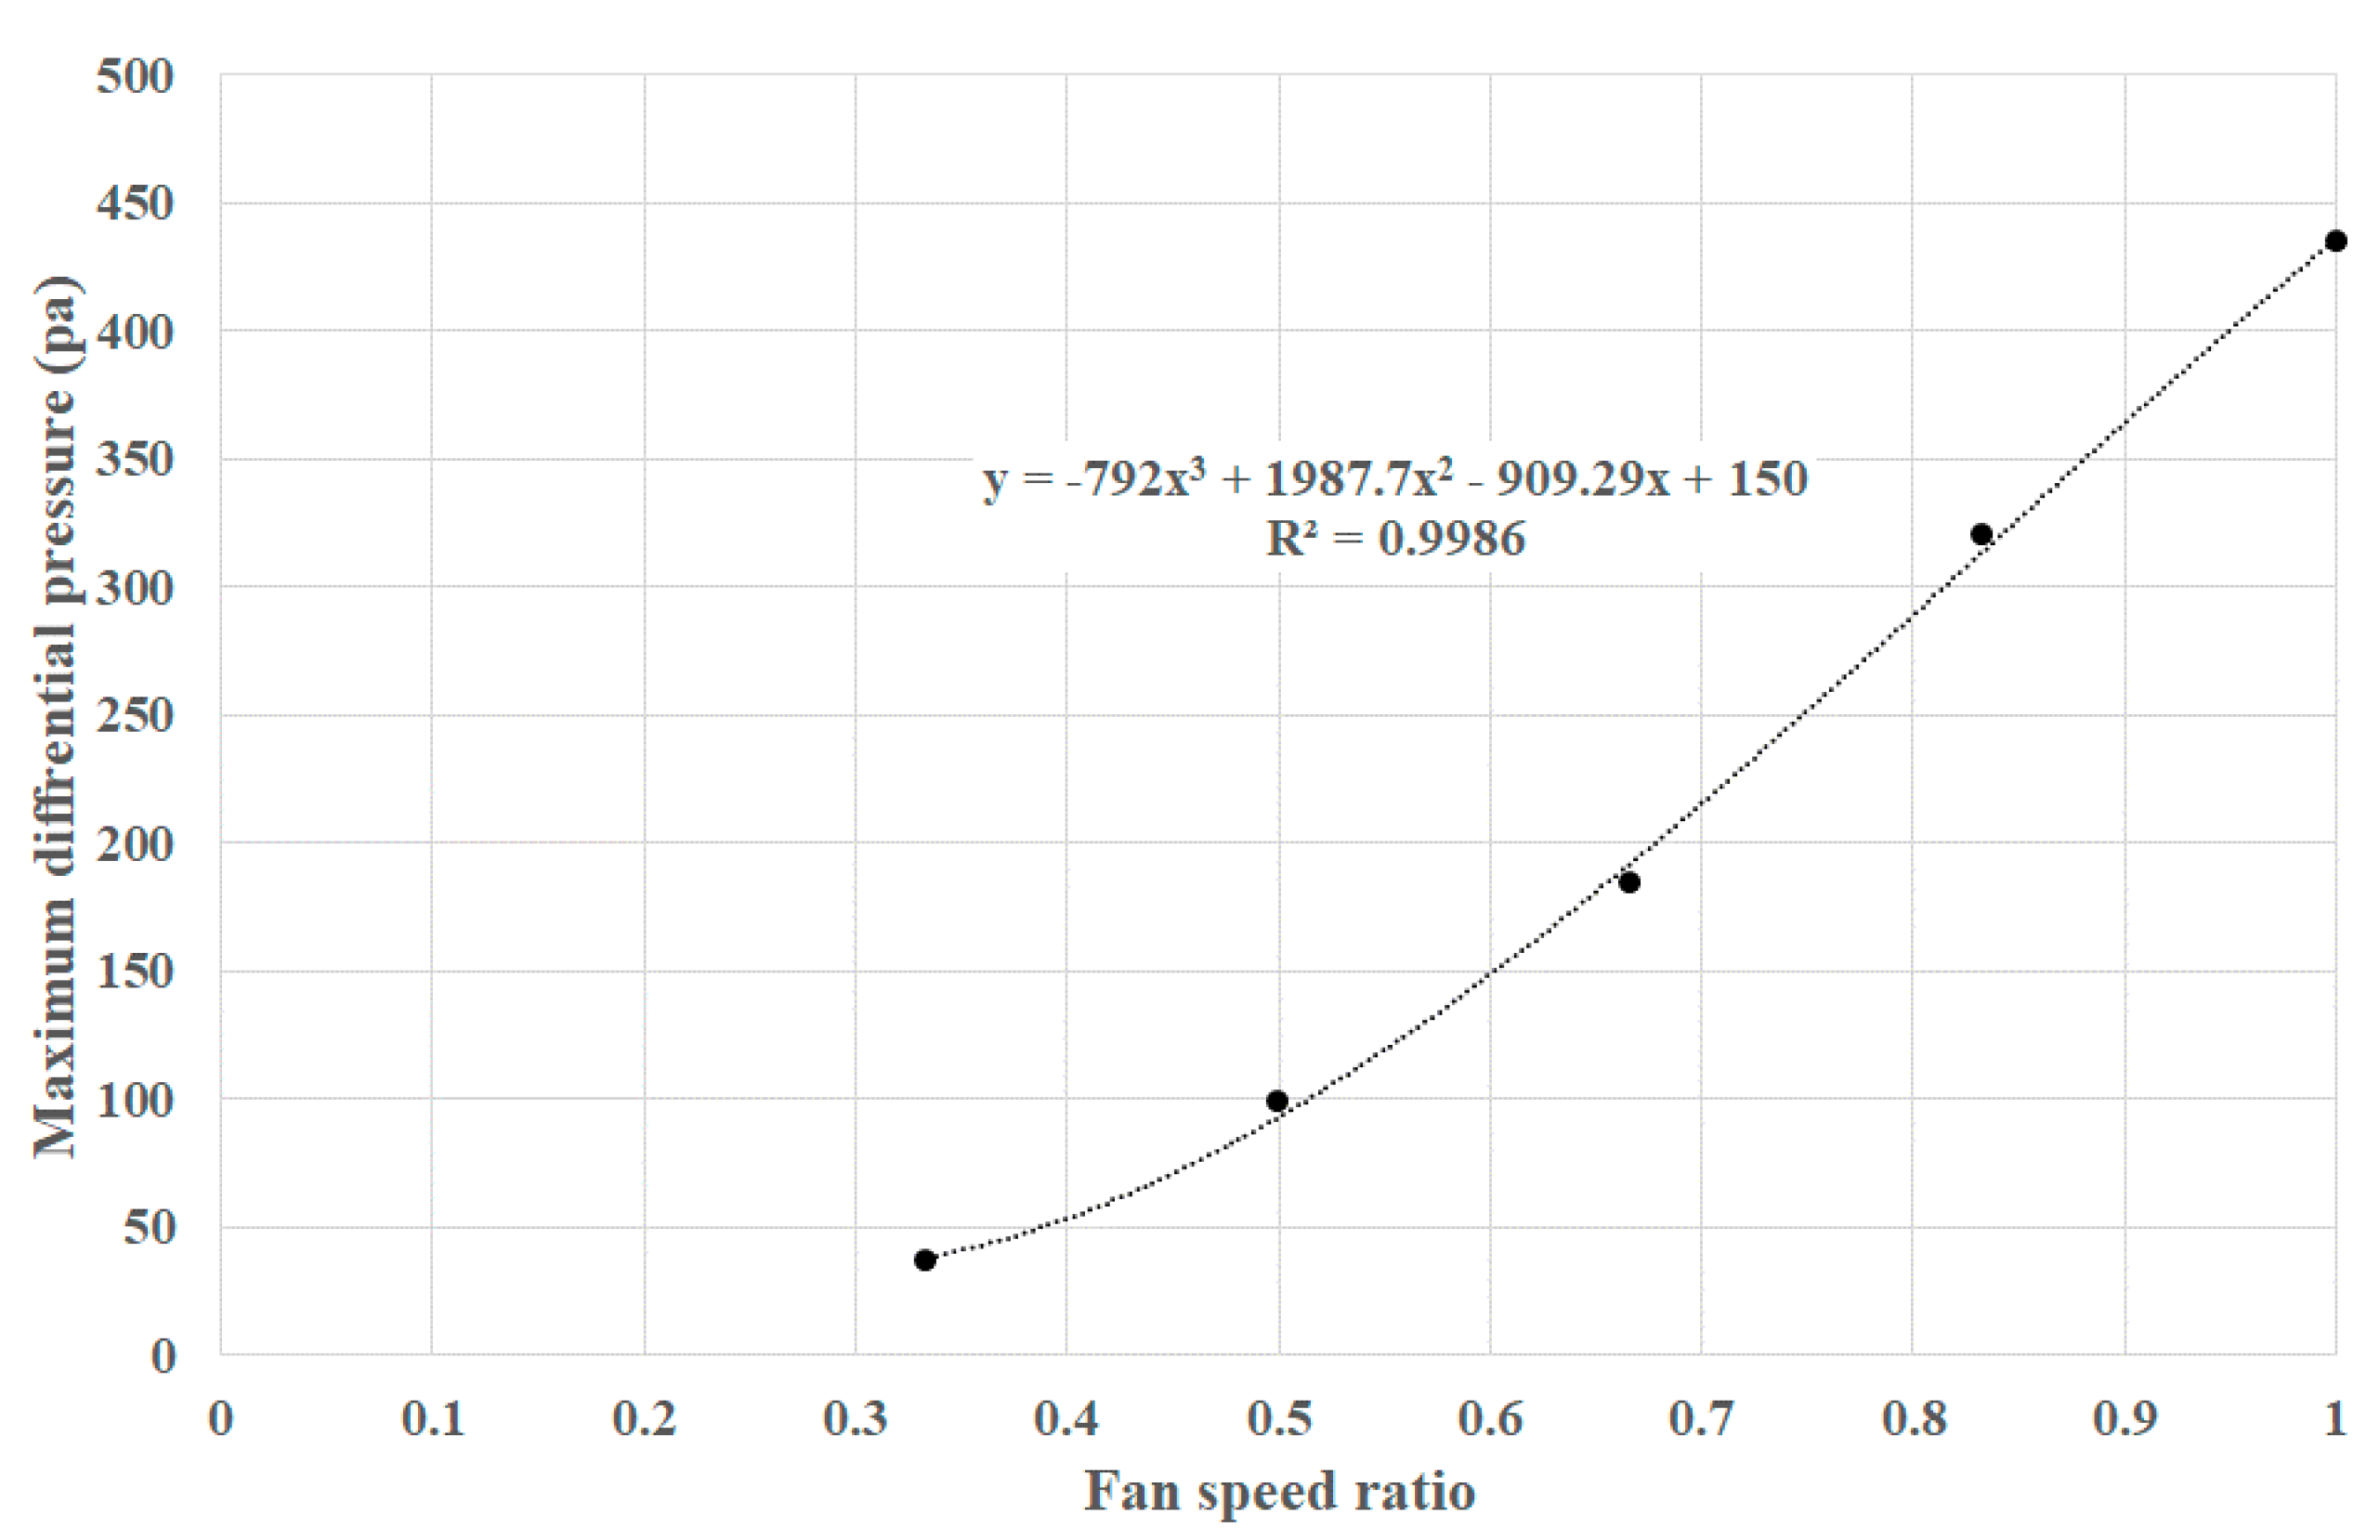
Step 4: The damper differential pressure of the VAV terminal unit measured by varying the supply fan speed at the minimum damper opening ratio was used to derive the relationship between fan speed and damper differential pressure. In the equation derived at Step 3, the maximum differential pressure according to the fan speed was needed to convert the differential pressure ratio. For this purpose, the equation for the relationship between the damper differential pressure and fan speed was derived, as shown in Figure 9. The relational equation could be expressed as a cubic equation, as shown by Equation (18) below.
P d p , m a x = 792 ω ¯ 3 + 1987.7 ω ¯ 2 909.29 ω ¯ + 150
Step 5: The equation for calculating the virtual air flow rate of the VAV terminal unit was derived using Equations (16)–(18).

3.3. Verification of VAV Virtual Air Flow Sensor

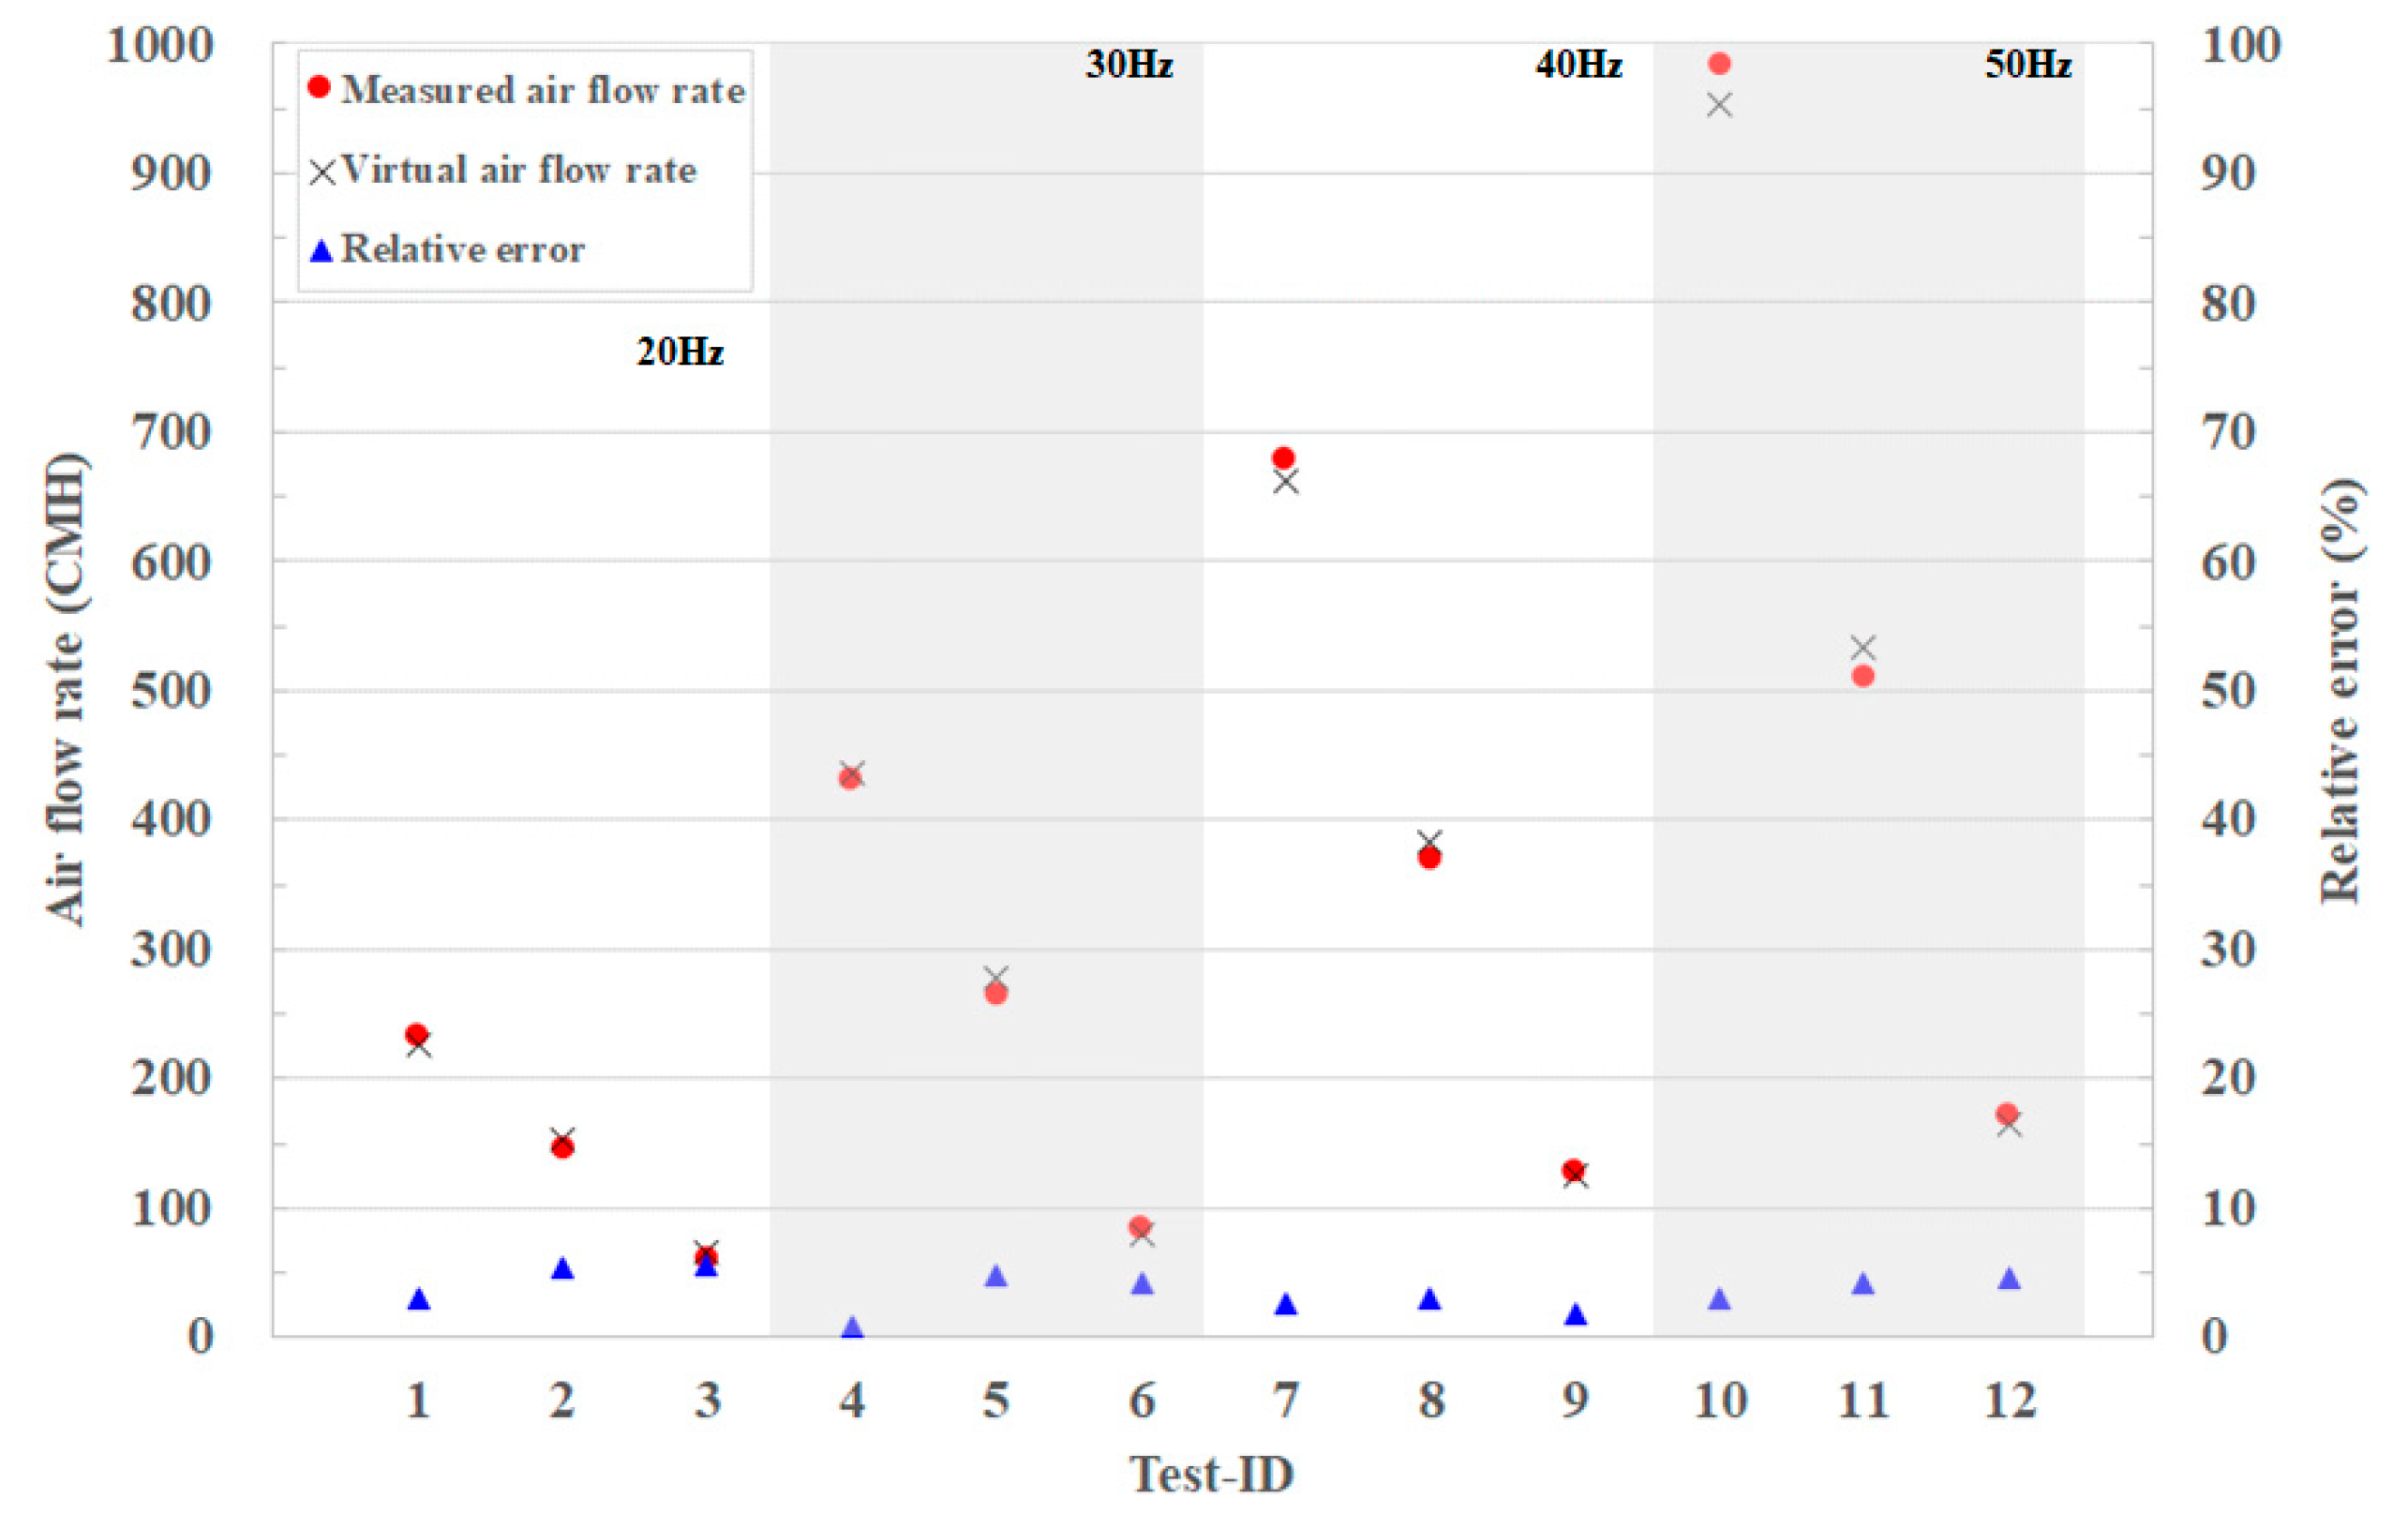
To verify the developed virtual air flow sensor of the VAV terminal unit, datasets of 12 cases were collected by varying the fan speed and damper opening ratio. The data of the fan speed, damper opening ratio, and damper differential pressure were collected through the BAS, and the supply air flow rate was measured using a hot-wire anemometer. Figure 3 and Equation (10) were used to apply the virtual air flow rate measurement procedure and calculate the air flow rate. The uncertainty of the calculated air flow rate was verified using Equations (11) and (12). The measured and calculated results are shown in Figure 10. The error analysis result are shown in Table 5. The uncertainty of the virtual air flow rate was within ±8.8%, and as the fan speed and the damper opening ratio decreased, the uncertainty of the virtual air flow rate increased. The comparison of relative error regarding the measured and virtual air flow rates was up to 5.6%. Additionally, the absolute error, RMSE, and R2 showed −22 to 18 CMH, 13.4 CMH, and 0.999, respectively. The absolute error and RMSE values were small. In addition, R2 close to 1, and the virtual airflow sensor was effective for predicting the airflow rate in the VAV terminal unit.
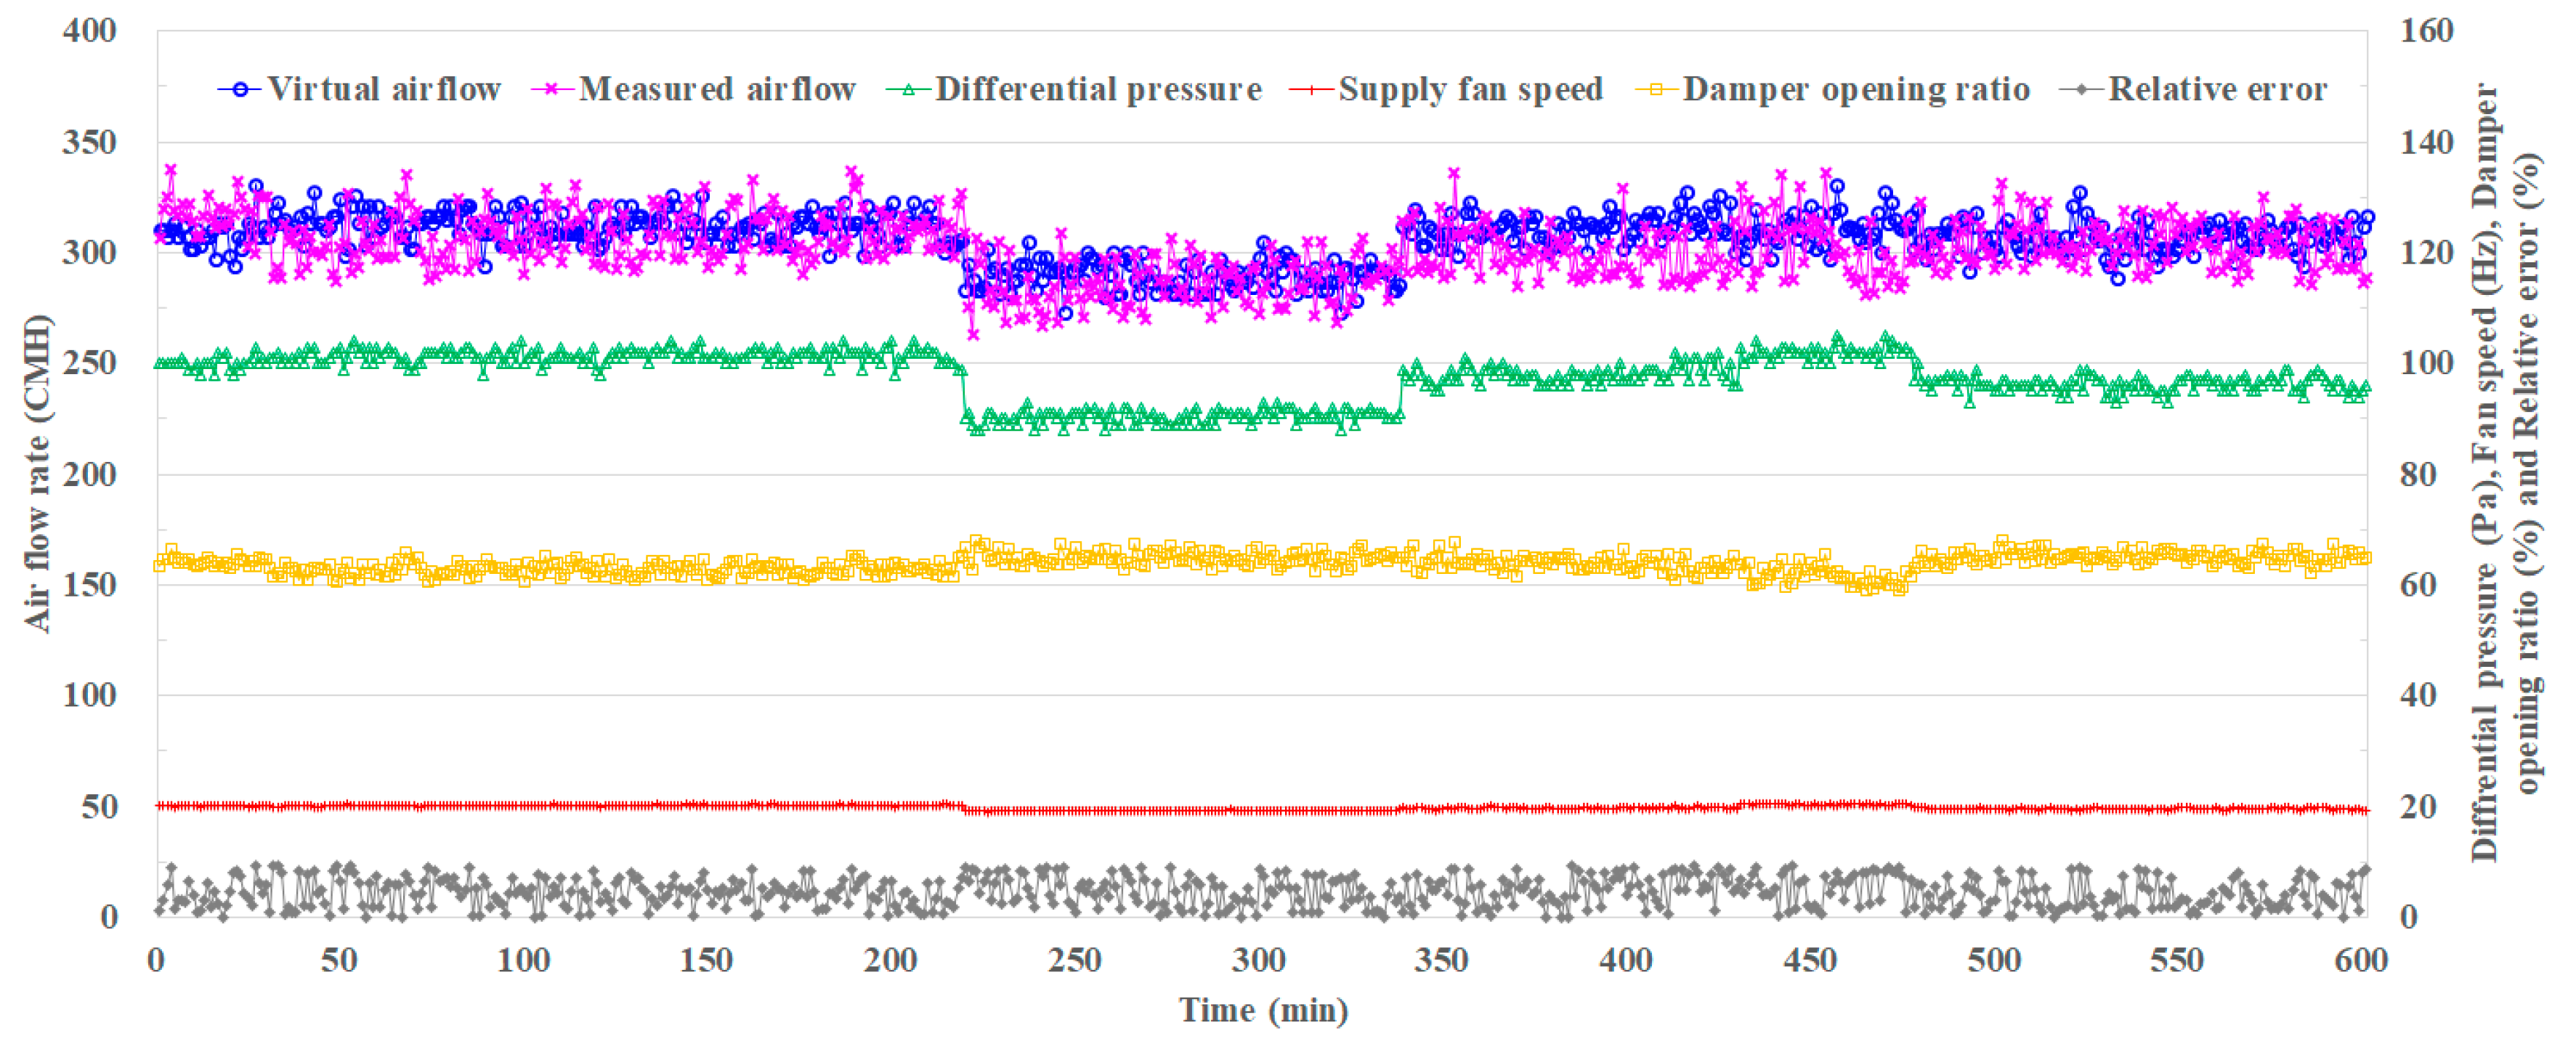
Figure 11 shows the long-term experimental results of the virtual air flow sensor. The virtual air flow rate was measured continuously for 10 h at 1 min intervals. In the long-term experiment, the terminal unit was controlled according to the load variation of the target space. During the experimental period, the supply fan was operated at a frequency of 19 to 21 Hz and the damper opening ratio was 59% to 68.2%. The damper differential pressure was 88 to 105 Pa. As the load changed from 220 min, the supply fan speed, the air flow rate and the damper differential pressure decreased, the damper opening ratio increased. At this time, the virtual air flow rate showed a relative error of up to 9.4% with respect to the air flow rate measured by the hot-air anemometer, and it was shown that it could be efficiently applied to the prediction of the air flow rate of the VAV terminal unit.

4. Conclusions and Discussion

In this study, we developed a low-cost, high-performance virtual air flow sensor to secure the stability of measurement of the minimum air flow rate, one of the important control factors of the VAV terminal unit. Additionally, the in-situ measurement procedure of the virtual air flow sensor was established. The input factors of the virtual air flow sensor were developed based on the supply fan speed and damper opening ratio, which could be easily obtained from the existing control system. In order to use the damper opening ratio and supply fan speed as input factors, the relationship between these factors and the damper differential pressure was analyzed, and it was found that there was a high correlation between the differential pressure ratio and the damper opening ratio and between the differential pressure and supply fan speed. Therefore, the estimation method of the virtual air flow rate was derived as a function consisting of the damper opening ratio, supply fan speed, and damper performance coefficient. In addition, the in-situ measurement procedure of the virtual air flow sensor was developed by dividing the procedure into five steps.
The test-bed for verification of the developed virtual air flow sensor and in-situ measurement procedure was selected and the verification was conducted. The damper performance data of the terminal unit was collected by varying operation conditions 14 times in total, and the relational equations such as the in-situ damper performance curves were derived.
Finally, in order to examine the errors of the virtual air flow sensor, reliability of the virtual air flow sensor was evaluated through uncertainty analysis of the input variables and relative error analysis, in comparison with the conventional air flow rate measurement method. The developed virtual air flow sensor was found to have an uncertainty of up to 8.8%, and it was also found that as the closer to the maximum values that the values of the input variables were, the lower was the uncertainty. In addition, verification of relative error with respect to the measured values by the hot-wire anemometer was conducted by varying the operation conditions to a total of 12 cases, and as a result, the relative error was found to be up to 5.6%. In addition, the results of the long-term experiment showed that relative error was within about 9.5%, and thus, the feasibility for field application and control was confirmed. In future studies, it is necessary to develop and verify air flow rate control technology based on the developed VAV virtual air flow sensor.

Author Contributions

All authors contributed to this work. H.-J.K. performed the result analysis and wrote the major part of this article. J.-H.J. performed the result discussion and gave technical support. Y.-H.C. was responsible for this article and gave conceptual advice.

Acknowledgments

This research was supported by Basic Science Research Program through the National Research Foundation of Korea (NRF) funded by the Ministry of Education (2016R1D1A1B03935800).

Conflicts of Interest

The authors declare no conflict of interest.

Nomenclature

A Damper authority
P Pressure (pa)
Q Air flow rate (m3/h)
ω ¯ Fan speed ratio
α Damper opening ratio
β Pressure ratio
a 0 , a 1 , a 2 Coefficient of in-situ damper performance curve
b 0 , b 1 , b 2 Coefficient of damper opening ration-pressure ratio curve
c 0 , c 1 , c 2 Coefficient of fan speed ratio-maximum differential pressure curve
e Relative error
Subscripts
d p differential pressure
f full speed
p partial speed
maxMaximum
virvirtual
measmeasurement

References

  1. ASHRAE. ASHRAE Handbook 2015 Application: Design and Application of Controls; ASHRAE: Atlanta, GA, USA, 2015.
  2. Kang, S.; Kim, H.; Cho, Y. A Study on the control method of single duct VAV terminal unit through the determination of proper minimum air flow. Energy Build. 2014, 69, 464–472. [Google Scholar] [CrossRef]
  3. Cho, Y.-H.; Liu, M. Minimum airflow reset of single duct VAV terminal boxes. Build. Environ. 2009, 44, 1876–1885. [Google Scholar] [CrossRef]
  4. Kim, H.; Cho, Y. A Study on a Control Method with a Ventilation Requirement of a VAV System in Multi-zone. Sustainability 2017, 9, 2066. [Google Scholar] [CrossRef]
  5. Paliaga, G.; Zhang, H.; Hoyt, T.; Arens, E. Eliminating Overcooling Discomfort While Saving Energy. ASHRAE J. 2019, 61, 14–28. [Google Scholar]
  6. Liu, G.; Liu, M. Development of simplified in-situ fan curve measurement method using the manufacturers fan curve. Build. Environ. 2012, 48, 77–83. [Google Scholar] [CrossRef]
  7. Klopfenstein, R. Air velocity and flow measurement using a pitot tube. ISA Trans. 1998, 37, 257–263. [Google Scholar] [CrossRef]
  8. Schwenk, D. Air Flow Measurement Accuracy, US Army Corps of Engineers, Construction Engineering Research Laboratories; Conference Proceedings; HQUSACE: Washington, DC, USA, 1998. [Google Scholar]
  9. Liu, R.; Wen, J.; Waring, M. Improving airflow measurement accuracy in VAV terminal units using flow conditioners. Build. Environ. 2014, 71, 81–94. [Google Scholar] [CrossRef]
  10. Kim, H.; Kang, S.; Cho, Y. A study on the control method without stratification of single duct VAV terminal units. J. Asian Archit. Build. Eng. 2015, 14, 467–474. [Google Scholar] [CrossRef]
  11. ASHRAE. ASHRAE Handbook 2017 Fundamentals: Fundamentals of Controls; ASHRAE: Atlanta, GA, USA, 2017.
  12. ASHRAE. Dampers and Airflow Control; ASHRAE: Atlanta, GA, USA, 2009.
  13. Zhang, B.; Li, Y.; Lau, J.; Liu, M. Demand control ventilation: Influence of terminal box minimum airflow setting on system energy use. Energy Build. 2014, 79, 173–183. [Google Scholar] [CrossRef]
  14. Zhang, J.; Lutes, R.G.; Liu, G.; Brambley, M.R. Energy Savings for Occupancy-Based Control of Variable Air Volume Systems (PNNL-22072); Pacific Northwest National Laboratory: Richland, WA, USA, 2013. [Google Scholar]
  15. Papadopoulos, S.; Kontokosta, C.E.; Vlachokostas, A.; Azar, E. Rethinking HVAC temperature setpoints in commercial buildings: The potential for zero-cost energy savings and comfort improvement in different climates. Build. Environ. 2019, 115, 350–359. [Google Scholar] [CrossRef]
  16. Kim, W.; Katipamula, S. A review of fault detection and diagnostics methods for building systems. Sci. Technol. Built Environ. 2018, 24, 3–21. [Google Scholar] [CrossRef]
  17. Deshmukh, S.; Samouhos, S.; Glicksman, L.; Norford, L. Fault detection in commercial building VAV AHU: A case study of an academic building. Energy Build. 2019, 201, 163–173. [Google Scholar] [CrossRef]
  18. Deshmukh, S.; Glicksman, L.; Norford, L. Case study results: Fault detection in air-handling units in buildings. Adv. Build. Energy Res. 2018, 1–17. [Google Scholar] [CrossRef]
  19. Li., H.; Yu, D.; Braun, J. A review of virtual sensing technology and application in building systems. HVAC&R Res. 2011, 17, 619–648. [Google Scholar]
  20. Swamy, S.; Song, L.; Wang, G. A Virtual Chilled-Water Flow Meter Development at Air Handling Unit Level. ASHRAE Trans. 2012, 118, 1013–1020. [Google Scholar]
  21. Song, L.; Joo, I.; Wang, G. Uncertainty analysis of a virtual water flow measurement in building energy consumption monitoring. HVAC&R Res. 2012, 18, 997–1010. [Google Scholar]
  22. Wichman, A.; Braun, J. A Smart Mixed-Air Temperature Sensor. HVAC&R Res. 2009, 15, 101–115. [Google Scholar]
  23. Liu, M.; Liu, G.; Joo, I.; Song, L.; Wang, G. Development of in situ fan curve measurement for VAV AHU systems. J. Sol. Energy Eng. 2005, 127, 287–293. [Google Scholar] [CrossRef]
  24. Wang, G.; Liu, M. Development of power-head based fan aiflow station. In Proceedings of the 5th International Conference for Enhanced Building Operations, Pittsburgh, PA, USA, 11–13 October 2005. [Google Scholar]
  25. Yu, D.; Li, H.; Yang, M. A virtual supply airflow rate meter for rooftop air-conditioning units. Build. Environ. 2011, 46, 1292–1302. [Google Scholar] [CrossRef]
  26. Taylor, J.R. An Introduction to Error Analysis: The Study of Uncertainties in Physical Measurements, 2nd ed.; University Science Books: Sausalito, CA, USA, 1997. [Google Scholar]
  27. Shin, J.; Kim, Y.; Cho, Y. Development of operating method of multi-geothermal heat pump system using variable water flow rate control and a cop prediction model based on ANN. Energies 2019, 12, 3894. [Google Scholar] [CrossRef] [Green Version]
  28. ASTM. ASTM D3463-96 Standard Test Method for Average Velocity in a Duct Using a Thermal Anemometer; ASTM: West Conshohocken, PA, USA, 2014.
Figure 1. (A) PARALLEL-BLADE, (B) OPPOSED-BLADE. Characteristic curves of the installed dampers (from ASHRAE Handbook Fundamentals 2017, Chapter 07).
Energies 12 04307 g001
Figure 2. Comparison of air flow according to the setpoint change in the variable air volume (VAV) terminal unit.
Energies 12 04307 g002
Figure 3. Relationship between air flow rate and damper differential pressure in the VAV terminal unit.
Energies 12 04307 g003
Figure 4. In-situ measurement procedure algorithm for the development of the virtual air flow sensor.
Energies 12 04307 g004
Figure 5. Schematic of VAV virtual air flow sensor.
Energies 12 04307 g005
Figure 6. Generation of in-situ damper performance curve at full speed.
Energies 12 04307 g006
Figure 7. Relationship between differential pressure and damper opening ratio according to fan speed change.
Energies 12 04307 g007
Figure 8. Relationship between differential pressure and damper opening ratio at full speed.
Energies 12 04307 g008
Figure 9. Relationship between maximum differential pressure and fan speed ratio (α = 0.1).
Energies 12 04307 g009
Figure 10. Comparison of measured and virtual air flow rate.
Energies 12 04307 g010
Figure 11. Long-term experiment result.
Energies 12 04307 g011
Table 1. Input error sources and precision.
ErrorsParametersSymbolsValuesError SourcesAccuracyFull Scale
InputDamper differential pressure P d p VariableError caused by differential pressure transducer to the controller1 Pa1000 Pa
InputSupply fan speed ω ¯ VariableOutput variable from the controller to the VFD 1 Hz60 Hz
InputDamper opening ratio α VariableOutput variable from the VAV damper actuator1%100%
InputDamper performance coefficient a 0 , a 1 , a 2 ConstantPropagated error through hot-wire anemometer, damper differential pressure and fan speed when developing damper performance coefficient --
b 0 , b 1 , b 2 , b 3
c 0 , c 1 , c 2 , c 3
Table 2. HVAC system specification in test-bed.
CategorySpecification
AHUSupply Air FanReturn Air Fan
Air Flow (CMH)Static Pressure (mmAq)Power (kW)Air Flow (CMH)Static Pressure (mmAq)Power (kW)
12,000925.59600353.7
VAV Terminal unitRated air flow rate (CMH)Capacity of reheating coil (kcal)
13604000
Table 3. Measurement data at full speed.
Supply Fan Speed (Hz)Damper Opening RatioAir Flow Rate (CMH)Damper DP (Pa)
6011222200
0.91107210
0.81023225
0.7657253
0.6490289
0.5344326
0.4207366
0.3110403
0.231418
0.14435
Table 4. Measurement data at the damper closed.
Damper Opening RatioSupply Fan Speed (Hz)Air Flow Rate (CMH)Damper DP (Pa)
0.1604435
500320
400184
30099
20037
Table 5. Error analysis result of the virtual air flow sensor.
Test-IDMeasured Air Flow Rate (CMH)Virtual Air Flow Rate (CMH)Uncertainty (%)Absolute Error (CMH)Relative Error (%)Root mean Square Error (CMH)Coefficient of Determination
1234227±5.373.013.40.999
2146153±6.1−85.4
36265±8.8−35.6
4432436±0.8−30.8
5265277±1.8−134.8
68480±3.244.2
7679661±0.9182.6
8370382±2.3−113.1
9128126±5.621.8
10983954±1.2293.0
11512533±2.7−224.3
12172164±7.284.7