1. Introduction
While both consumer demand for and public investment in renewable energy increased significantly in the United States and many other nations in the past two decades, generating more electricity from renewable sources is a focus of government investment and policies across nations. Renewable electricity is a focus partially because electricity is used by almost every household and business, and partially because electricity generation contributes a large proportion of greenhouse gas (GHG) emissions [
1,
2]. For example, in the United States, electricity generation contributed 28.4% of the GHG emissions in 2016, only slightly behind the transportation sector’s contribution of 28.5% [
3]. Because generating electricity from renewable sources such as solar, wind, and biomass is much more environmentally sound than from coal and other fossil fuels, and because it can significantly reduce GHG emissions, increasing the share of electricity from renewable sources is a major goal of the energy plans in many regions [
4,
5,
6]. For example, the 2011 Vermont Comprehensive Energy Plan (CEP) sets out a pathway for Vermont to obtain 75% of its electricity from renewable sources by 2032 and enacted Act 45 to use alternative policy measurements, including grants and subsidies, to support renewable energy projects [
6].
With dairy as its largest agricultural sector, Vermont made great efforts in developing anaerobic digester systems (ADS) to convert cow manure and other farm wastes into electricity and other marketable products such as composts and animal bedding since the early 2000s [
7,
8,
9,
10,
11]. The Cow Power program of Green Mountain Power (GMP), the largest utility in the state, offers its electricity customers the option of paying a premium of
$0.04 per kWh in addition to their standard electric rates to obtain 25%, 50%, or 100% of their electricity use from on-farm ADS in the state. The premium paid by electricity customers is transferred to the participating farmers that supplied the electricity, and such payments provide the farmers a steady stream of additional income to offset the costs of operating their ADS [
7,
8,
11].
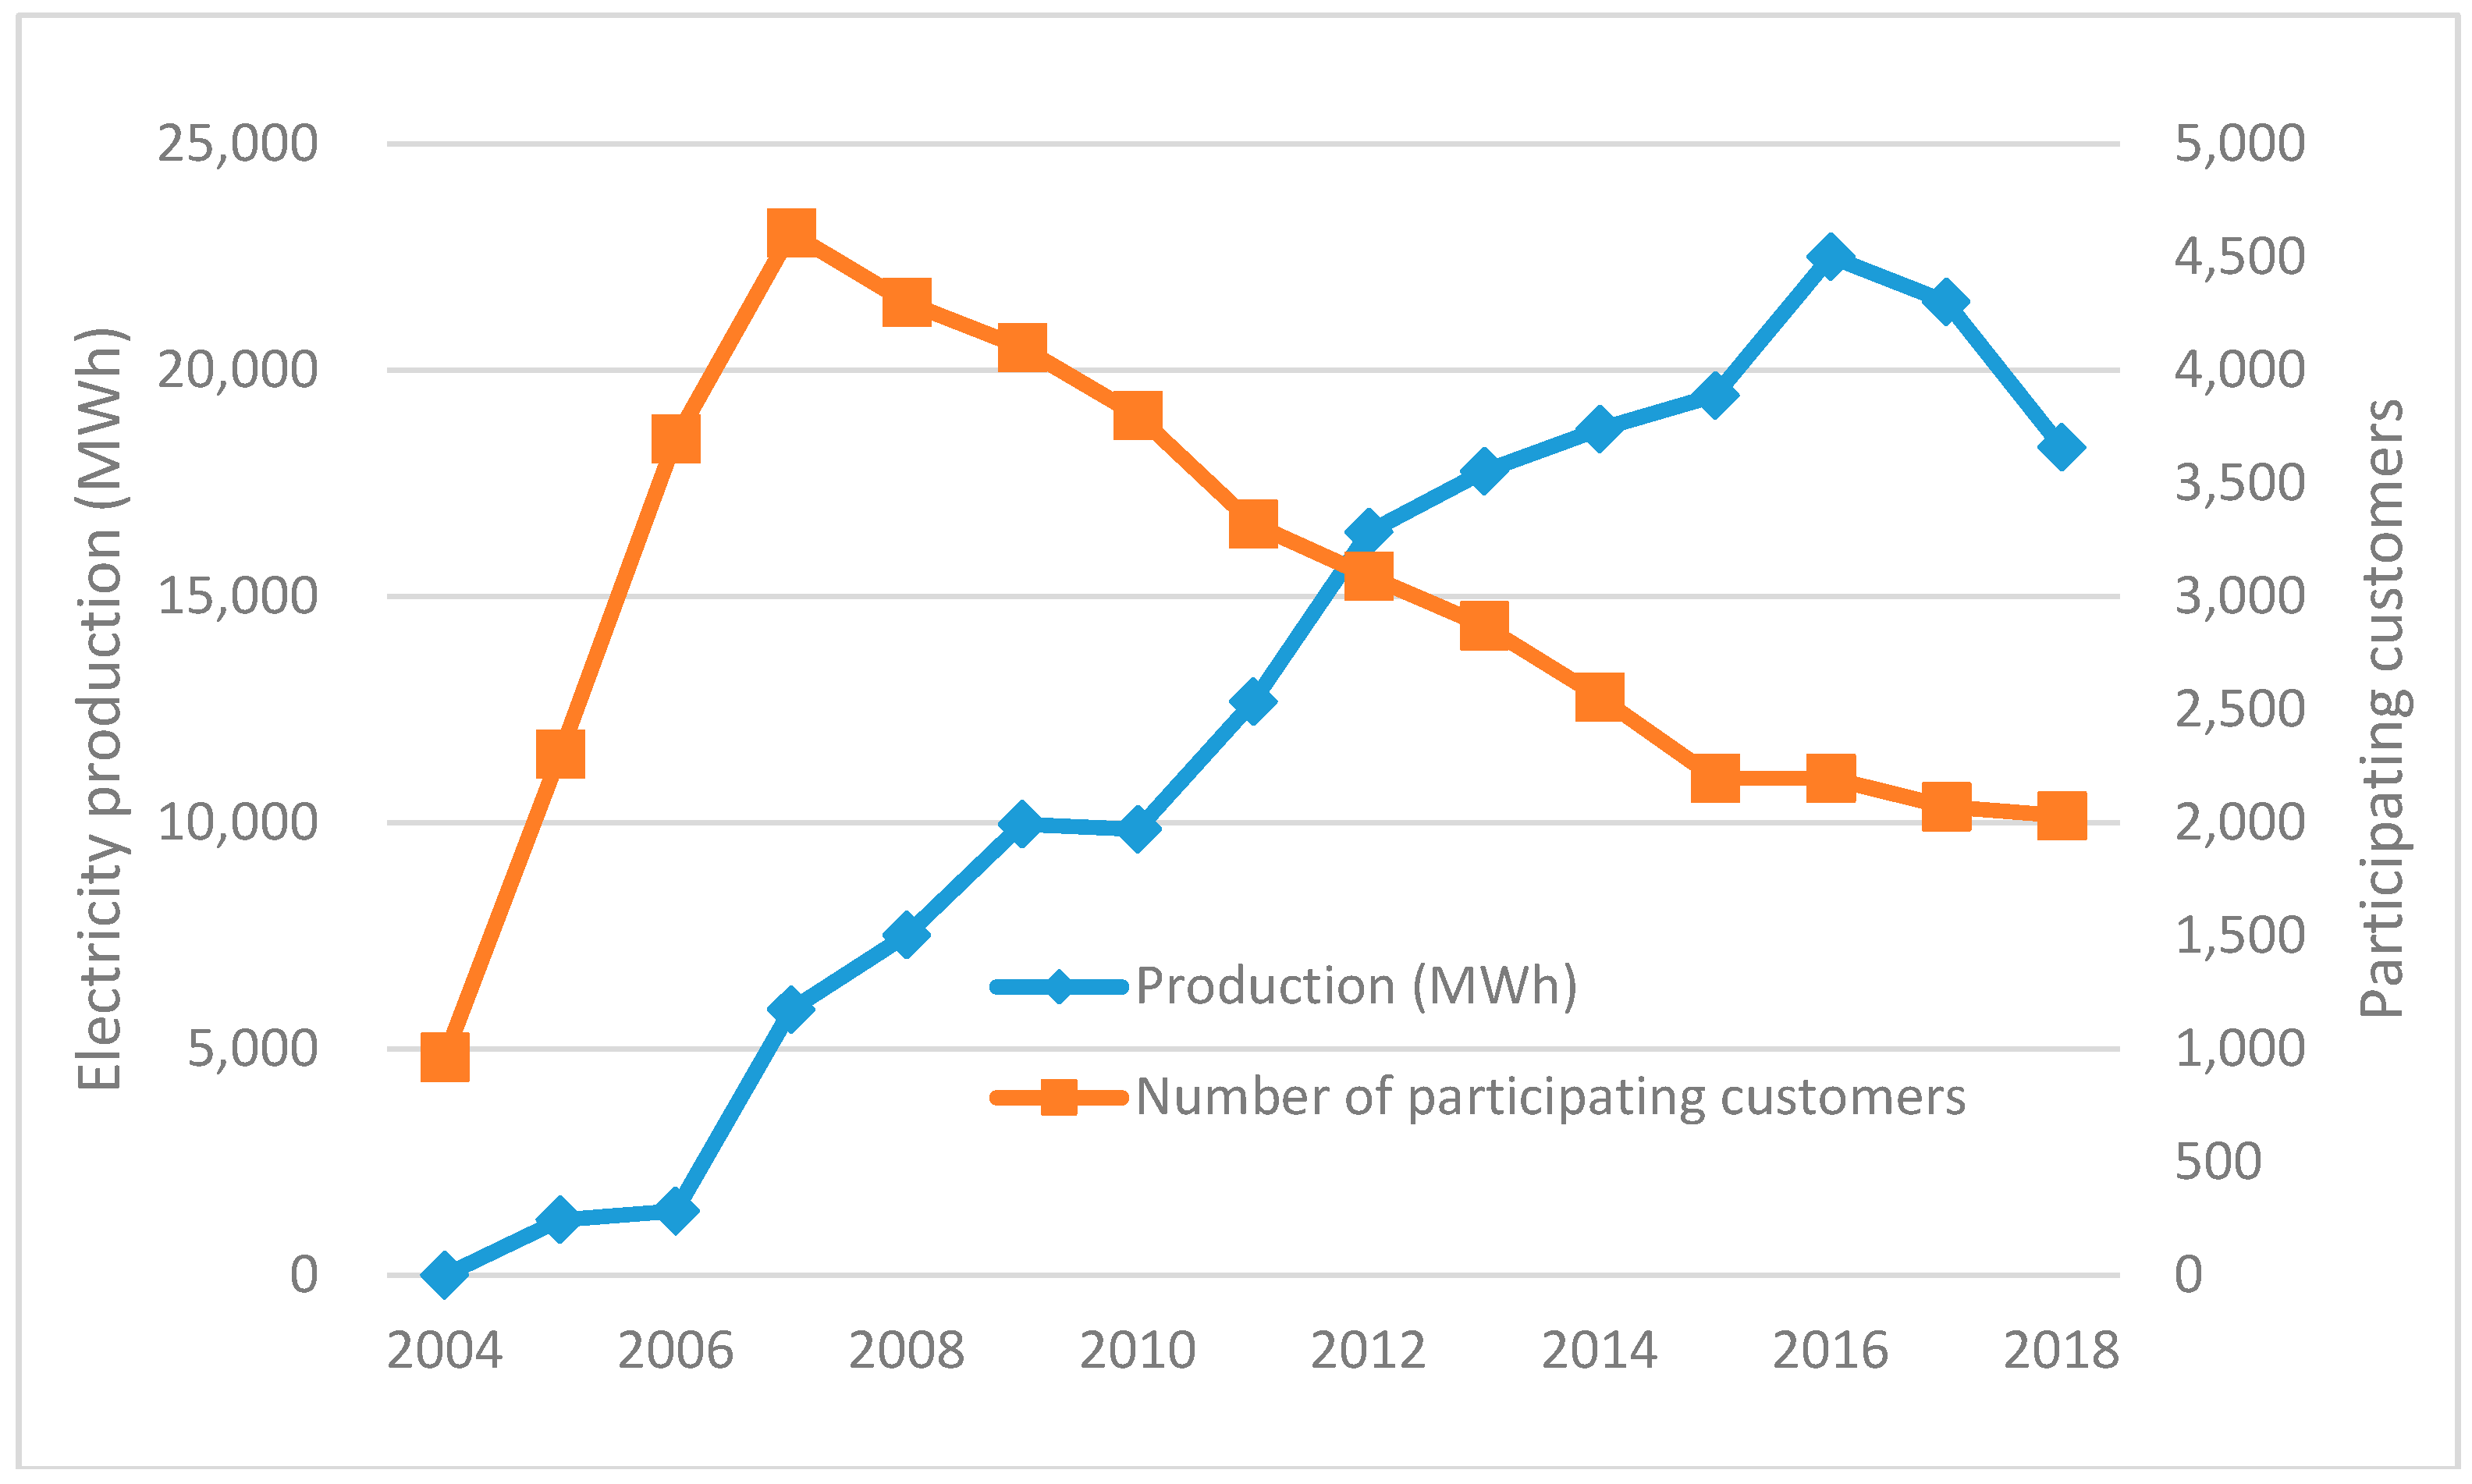
As shown in
Figure 1, electricity produced from on-farm ADS under the GMP Cow Power program in Vermont increased steadily from 1223 megawatt-hours (MWh) in 2005 to the record high of 22,510 MWh in 2016, and then dropped to 18,292 MWh in 2018. The growth in the production from 2005 to 2016 was the result of significant increases in both the number of participating farms and the electricity production of individual farms. The decrease in electricity production in 2017 and 2018 was mainly the consequence of two farms that exited the program to pursue carbon credits [
12].
On the demand side, the number of participating electricity customers in the GMP Cow Power program increased sharply from 2004 to 2007 and reached the record high of 4606 in 2007, but declined steadily since 2007 and dropped to 2031 at the end of 2018 [
12]. As a result, the total amount of premiums paid by participating customers at
$0.04 per kWh declined steadily since 2007, and the premium can be applied to only a fraction of the electricity produced from ADS. Possible reasons for the declining consumer participation in the GMP Cow Power program include increasing availability of renewable electricity from other sources such as solar and wind, the lack of educational programs and public campaign to promote the GMP Cow Power program, and financial challenges faced by many electricity customers [
10,
13]. The declining customer participation emerges as a major threat to the survival of the GMP Cow Power program.
Understanding public support and willingness to pay (WTP) for renewable energy from alternative sources can help policymakers and public service boards to develop effective policies and programs. Because almost all renewable energy projects in the United States and many other nations are subsidized by the government through grants or tax incentives, it is important to assess public preferences and support for spending tax dollars on alternative renewable energy projects. For example, for the on-farm ADS constructed in the state of Vermont from 2004 to 2009, grants from government agencies and other organizations accounted for about 34.67% of the average investment of
$2.03 million per anaerobic digester system [
8]. Because public funds are always limited and many renewable energy projects are competing for the limited funds, it is critically important to understand consumer preferences for public investment in alternative renewable energy projects. For example, for Vermont to achieve its goal of obtaining 75% of its electricity from renewable sources by 2032, how should the state allocate its limited funds among solar, wind, biomass, hydro and other renewable electricity projects? Also, information on public support on renewable energy from alternative sources can help public service boards to set subsidized purchase rates for electricity from alternative sources such as solar, wind, and ADS.
In addition to public investment, consumer contributions, such as the premium of $0.04 per kWh paid by participating electricity customers under the GMP Cow Power program in Vermont, can help make electricity from renewable sources economically competitive with electricity from conventional sources. It is important to understand consumer support for public investment, as well as their WTP for renewable energy from alternative sources. For example, while the GMP Cow Power program faces the challenge of declining consumer participation, it is important to understand the factors behind the downward trends.
The major objectives of this study were to assess consumer support for public investment and WTP for electricity from solar panels, wind turbines, and ADS and to derive policy recommendations. This paper is organized into five sections. Following this introduction section,
Section 2 summarizes the relevant literature,
Section 3 presents a conceptual model and introduces the data and analysis methods,
Section 4 reports the empirical findings, and
Section 5 summarizes the major conclusions and policy recommendations.
2. Literature Review
Electricity generation capacity from renewable sources expanded significantly in the past two decades in the United States and many other nations such as Germany [
2,
14]. For example, electricity from renewable sources accounted for nearly two-thirds of the net increase in power capacity worldwide in 2016, with solar and wind accounting for most of the net increase [
2]. Biomass energy derived from farm waste and other organic materials contributed less than solar and wind energy but is a growing source in many nations [
8,
15]. For example, in the United States, the 253 on-farm ADS currently generate approximately 994,000 MWh of electrical or thermal energy from biogas captured from livestock manure and other organic materials annually, reducing CO
2-equivalent emissions by 3.96 million metric tons annually [
16]. While solar and wind technologies generate electricity using solar panels and wind turbines, respectively, ADS are based on the process via which the gases, primarily methane, formed during the breakdown of organic matter in cow manure and other materials are converted into electricity through combustion [
8,
11,
17,
18,
19,
20]. In addition, ADS eliminate the volatilization of methane from manure and, therefore, reduce manure odor and other environmental problems associated with methane from farms [
17]. While ADS were an available technology for several decades, recent research in process optimization and the use of nanoparticles shows promise for improving the energy yield of organic materials [
20].
There is very rich literature on consumer preferences and WTP for alternative renewable energies in the United States and many other nations. While the preferences and WTP are significantly different across energies and regions, the major factors affecting consumer WTP for renewable energies from alternative sources identified by previous studies include income, education, access to information, social values such as concern over environmental issues like climate change, etc. [
21,
22,
23,
24,
25,
26,
27,
28,
29,
30,
31,
32]. For example, while lack of consumer knowledge about particular methods of energy generation was observed to decrease the WTP for corresponding alternative energies [
23,
27,
28], younger, wealthier respondents were found to be willing to pay significantly more than those with the opposite traits [
23]. Also, homeowners were found to be less likely to be willing to pay a premium for renewable energies than renters, and race was not found to be a significant factor [
23,
27,
33,
34].
While supporting renewable energies may be a form of civic engagement for many consumers, their likelihood and amount of WTP for renewable energies could be affected by social, cultural, and environmental factors, in addition to economic factors [
23,
35], and this potential relationship is similar to that analyzed in some multi-criteria evaluation studies [
36,
37]. For example, ADS as a technology of converting cow manure and other agricultural wastes into renewable energy products are closely related to the food systems, and consumer engagement in local food systems may affect their WTP for electricity generated from on-farm ADS [
8,
23]. The potential impacts of respondents’ membership of community-supported agriculture (CSA) on the likelihood of WTP for electricity from three renewable sources are examined in this study.
Various methods were used to measure WTP for goods and services, including renewable energies from alternative sources [
30,
31,
32,
38,
39,
40,
41,
42]. For example, Nomura and Akai [
24] used contingent valuation (CV) to estimate consumer WTP for green electricity in Japan, whereas Graber et al. used choice experiment to assess consumer valuation of and WTP for renewability and other attributes of electricity in rural India [
32]. While most of previous studies on the WTP for renewable energies were based on CV through mail, online, or phone surveys, the accuracy of their estimated WTP was highly affected by a major limitation of the CV method, i.e., consumers’ WTP reported in a survey could be significantly different from their true WTP [
38]. On the other hand, CV through well-designed surveys remains a feasible and commonly used research method for assessing consumer valuation of and WTP for many goods and services [
38], especially for assessing the relative valuation of and WTP for alternative products such as electricity from alternative sources [
30,
31].
The estimated WTP for renewable electricity in terms of the probability, numerical amount, or percentage of the regular electricity costs varies significant across regions and nations due to the significant differences in electricity price, subsidy from the government, purchase and payment schedule (e.g., most electricity customers in the United States pay their monthly electrical bills according to the actual usage and price, but many electricity customers in China have to purchase and pay for electricity first, and their usage is then deducted from the balance daily or instantly), definition of renewable electricity, etc. For example, while Ntanos et al. [
30] reported that the “WTP for a wider penetration of renewable energy source (RES) into the electricity mix was estimated to be 26.5 euros per quarterly electricity bill” in an urban area in Greece, Bigerna and Polinori [
31] estimated the median WTP for renewable electricity in Italy to be between 4.62 and 8.05 euros every two months per household. Ntanos et al. [
30] also compared their estimate with that from other studies and discussed the likely reasons behind their relatively higher estimate.
Based on the literature review and our research objectives, this study uses data collected through the CV method to examine consumer support for renewable energy investment and WTP for electricity from wind, solar, and ADS. While using CV methods to measure WTP involves asking consumers how much they are willing to pay for a good or service, Mitchell and Carson [
38] suggested that questions should be phrased in such a way that the good or service is clearly identified and that a plausible scenario through which to purchase the good is conveyed. Given accurate and appropriate phrasing of the survey question, respondents from diverse experiential, educational, and economic backgrounds can think realistically about purchasing the good or service in question [
22,
23,
25,
26,
27]. The potential limitations of the CV method in the context of this study are discussed in
Section 4.
This study focuses on electricity from three renewable sources: wind, solar, and cow manure and other farm wastes through ADS. While solar and wind energies have widespread recognition due to their rapid development in recent years [
28,
43,
44], energy from cow manure and other farm wastes through ADS may be less widely recognized by the public because of its association with agriculture and decreased availability in urban areas. Borchers et al. [
42] found that farm methane and biomass energy production was less preferred by consumers than solar and wind, although the study was confined geographically to a single mid-Atlantic state. This study is expected to contribute to the literature with quantitative evidence on consumer support for public investment and WTP for electricity from three renewable sources, as well as provide information and policy recommendations for promoting the development and utilization of renewable electricity.
3. Conceptual Model, Data, and Methods
Based on the attribute model of Lancaster [
45] that defines the value of a good to a consumer as the sum of utilities from its attributes, the random utility model for discrete choice asserts that the utility from good j for individual i is the sum of an observable component (m
ij) and a random component (e
ij), and that the observable component (m
ij) can be further divided into two parts (a
j and b’X
ijk) [
46,
47,
48].
where a
j is the choice-specific constant, X
ijk is a vector of k attributes presented to the individual, and b is a vector of the corresponding marginal utilities of the attributes.
When the observable heterogeneity in utility levels across individuals is considered, the utility function in Equation (1) becomes
where Z
in is a vector of observable sociodemographic characteristics of individual i (e.g., age and sex), and c is a vector of the marginal impacts of the socioeconomic characteristics on the utility.
If the individual is assumed to maximize their total utility from the available goods subject to a budget constraint, the resulting indirect utility function can be presented as V(P, X, Z, I), where P is the price vector, X is the attribute vector, Z is the vector of sociodemographic variables, and I is the total income.
Now, consider the choice between electricity from a renewable source, denoted with the subscript r, and electricity from the conventional source, denoted as c. A consumer chooses the electricity from the renewable source when
This framework can then be used to recover the amount of premium the individual is willing to pay for the renewable electricity over the conventional electricity [
46]. The WTP can be implicitly defined in the following equation:
For example, if Mr. Smith is willing to pay $20 extra per month for electricity generated from cow manure through biodigesters, the reason for his WTP is that his utility from this choice (paying $20 extra on electricity and only (I − 20) on other goods and services) is equal to the utility of spending I on conventional electricity and other goods and services.
In our empirical analysis of the WTP for renewable electricity from alternative sources, a logit model was estimated to identify the factors that affect the likelihood of being willing to pay a premium and quantify their impacts on the likelihood for electricity from each of the three sources. The selection of independent variables was based on literature review, the conceptual model presented above, and data availability.
Data used in this study were collected as part of the 2012 Vermonter Poll, a large annual survey conducted since 1995 in the state of Vermont by the Center for Rural Studies at the University of Vermont. The 2012 Vermonter Poll collected data from a total of 699 respondents, of which 459 provided complete responses for the questions on renewable energy. Polling was conducted using the computer-aided telephone interviewing (CATI) method. A random sample for the poll was drawn from a list of Vermont telephone numbers, which is updated quarterly and includes listed and unlisted telephone numbers. Cellular phone numbers were not included in the sampling frame. According to Blumberg et al. [
49], only 5.1% of Vermont households did not have a landline telephone, making Vermont the state with the lowest proportion of “wireless only” households in the United States. In total, 2522 households were successfully contacted, and 27.72% of the calls resulted in completed surveys. Based on the sample size in relation to the population size, the survey had a margin of error of ±4%, with a confidence interval of 95%. Note that the Vermont Poll conducted in more recent years included both landline and cell-phone numbers due to the significant increase in the number of Vermont households with only cell-phone numbers.
The survey included several questions on renewable electricity. Firstly, for public investment in the three renewable sources for electricity generation (solar, wind, and biodigesters), each respondent was asked to identify the choice that they were “most likely to support” and the choice that they were “least likely to support”. (b) Secondly, under the hypothetical condition that the electricity used by the respondent’s household is generated from one of the three renewable sources, the respondent was asked to indicate the maximum amount of premium they would be willing to pay per month in additional to the regular electricity bill. This question was asked three times, for each of the three sources (solar, wind, and biodigesters). Before the WTP questions were asked, each respondent was asked about their household’s average monthly electricity bill. The purpose of asking this question was to provide a reference or reminder about how much their household pays for electricity per month and to help the respondent determine the WTP for electricity from each of the three renewable sources.
The data were analyzed using cross-tabulation with chi-square tests and a binary logit regression model for electricity from each of the three renewable sources. Ordinary least squares (OLS) regression was also used to analyze the impacts of selected independent variables on the amount of WTP for each renewable electricity, but the results are not reported in this paper due to the insignificance of the OLS regression results. The insignificance of the OLS regression results was likely due to data limitation and requires further research. For example, data from a choice experiment may collect more detailed data for assessing the factors that determine the amount of WTP for renewable electricity from alternative sources [
32].
5. Conclusions and Policy Recommendations
Expanding the output of renewable energy in Vermont and other regions, particularly from wind, solar, and cow manure and other farm wastes, is important in achieving those areas’ energy goals, such as Vermont’s goal of sourcing 75% of its electricity from renewable sources by 2032 and 90% of its energy needs from renewable sources by 2050 [
6]. Understanding the relative public support for electricity from alternative sources will help effectively direct public resources toward effective renewable energy projects and programs. Information on consumer preferences and WTP for electricity from alternative sources can also help estimate potential private contributions to renewable electricity. This case study, based on data from Vermont, assessed public support for investment in solar, wind, and ADS and identified consumer demographics associated with the likelihood of being willing to pay a premium for electricity generated from the three renewable sources. This information can help policymakers, energy producers, utility providers, and educators understand how to achieve the greatest public support for renewable energy projects and programs, as well as how to encourage and promote private support for renewable electricity.
The empirical results suggest that solar power was the respondents’ top choice for public investment in the state of Vermont, and cow power was the least-favored choice. Also, the variation in the likelihood of being willing to pay a premium was closely associated with factors such as education, political affiliation, homeownership, and local agricultural engagement.
This study suggests four major policy recommendations. Firstly, while alternative sources of renewable electricity such as solar, wind, cow manure, and hydro have their potentials and limitations, each region firstly needs to assess its resource endowment, potentials, obstacles, relative costs, and returns for each energy source and then develop a balanced portfolio for achieving its energy goals. For example, generating electricity from cow manure through ADS can be a good choice for areas with a high density of dairy farms, such as Vermont’s Addison County, but may not be a choice for an urban area like Vermont’s Chittenden County. For the state of Vermont to achieve its goal of obtaining 75% of its electricity from renewable sources by 2032, it must target all the renewable sources in the state.
Secondly, the relatively low level of public support and WTP for cow power is likely the result of not only many respondents’ unfamiliarity with this renewable source of electricity but also the debate in the past several years about community-based biodigesters and recycling facilities, which damaged public perception about ADS as a technology for generating renewable energy from cow manure and other farm wastes [
10,
13]. As reported in the introduction, the number of electricity customers participating in the GMP Cow Power program dropped steadily, from 4606 in 2007 to only 2031 at the end of 2018. For the GMP Cow Power program to survive, it urgently needs to reverse this declining trend and regain consumer support for the program, which was once considered a leading program of renewable energy in the nation [
8,
10]. The potential factors for the decline in consumer support discussed in the previous section could help to guide the efforts. For example, educational materials about ADS and community-based ADS need to be developed from unbiased information and provided to community members through various channels.
Thirdly, there is a strong need for collaboration among government agents at federal, state, city, and town levels to develop holistic and consistent policies and regulations regarding the development of renewable energy projects and programs. For example, GMP announced plans in the early 2010s to build several community-scale ADS in the state of Vermont, but every planned project faced huge challenges in obtaining various permits from different government agents. As a result of this permitting difficulty, and because of resistance from many community members and groups, none of the planned community-scale ADS were constructed [
10,
13]. The failure of such projects not only resulted in significant financial losses from the planning and permitting stages of the projects but also damaged public perceptions about the potential of the technology.
Fourthly, the push for an increase in consumer support for the GMP Cow Power program may be enhanced by marketing this technology not only to CSA members but also to other segments of the population engaged in local agriculture movement, thereby leveraging the growing interest in local food and agriculture. Given that CSA membership positively affected the likelihood of WTP for wind and cow power, it may be inferred that those in support of local agriculture also support alternative energy generation.
This exploratory study is limited by the data available, and the empirical findings should be interpreted with caution. For example, while previous studies indicated that general regard for others and non-selfish behavior were indicative of support for alternative energies [
25,
27,
51], the impacts of such factors were not examined in this study due to data limitation. Also, another factor not measured in this study but important to note from the literature is the effect of consumers’ sense of responsibility for the externalities of energy usage [
51,
52,
53,
54]. On the other hand, this is likely one of the first empirical studies on public support and WTP for electricity from alternative renewable sources in the state of Vermont and is expected to contribute to our understanding of consumer preferences and WTP for renewable energy in a state with defined renewable energy goals and challenges in achieving the goals.


