Abstract
The effect of kinetic hydrate inhibitors (KHIs) on the growth of methane hydrate in the gas–liquid phase separation state is studied at the molecular level. The simulation results show that the kinetic inhibitors, named PVP and PVP-A, show good inhibitory effects on the growth of methane hydrate under the gas–liquid phase separation state, and the initial position of the kinetic hydrate inhibitors has a major effect on the growth of methane hydrates. In addition, inhibitors at different locations exhibit different inhibition performances. When the inhibitor molecules are located at the gas–liquid phase interface, increasing the contact area between the groups of the inhibitor molecules and methane is beneficial to enhance the inhibitory performance of the inhibitors. When inhibitor molecules are located at the solid–liquid phase interface, the inhibitor molecules adsorbed on the surface of the hydrate nucleus and decreased the direct contact of hydrate nucleus with the surrounding water and methane molecules, which would delay the growth of hydrate nucleus. Moreover, the increase of hydrate surface curvature and the Gibbs–Thomson effect caused by inhibitors can also reduce the growth rate of methane hydrate.
1. Introduction
Natural gas, mainly composed of methane, has become an important energy source because of its high combustion heat and environmental protection. It is expected to alleviate the increasingly serious environmental problems and energy crisis. The natural gas required in various cities and industrial sites is mainly transported through pipelines, and generally the pipelines are in high-pressure and low-temperature environments. Therefore, hydrates may form and block the pipelines and valves and other components, causing serious industrial problems [1,2]. The traditional solution is to add thermodynamic inhibitors (TIs) to the system. However, the large quantity use of TIs is costly and easily produces environmental pollution problems. At present, more attention is being paid to the more economical and practical low-dose hydrate inhibitors (LDHIs) [3,4], which are not only used in low dosage, but also effectively prevent the occurrence of hydrate clogging during natural gas transportation. As one of the typical LDHIs, kinetic hydrate inhibitors (KHIs), with the advantages of low dosage and high efficiency [5,6], have attracted the attention of many researchers. KHIs can inhibit hydrate formation by effectively delaying the hydrate nucleation or inhibiting hydrate growth [7,8,9,10,11,12,13]. Polyvinylpyrrolidone (PVP) is one representative KHI found by Long et al. [14]. Subsequently, a series of polymeric KHIs have been developed and synthesized successfully [7,8,9]. Recently, our group successfully synthesized one kinetic inhibitor, named PVP-A, which has been proven to have good inhibitory property [15,16].
Although the inhibition performance of KHIs can be tested by experiment, the inhibition mechanism is still unclear. In recent years, molecular dynamics (MD) simulation has become an important tool to research the inhibitors on hydrate nucleation and growth process. Oluwunmi et al. explored eight different inhibitors on the initial formation of hydrates by MD simulation [17], and showed that MD simulation can be used as an effective screening method for potential kinetic inhibitors. Yagasaki et al. used the MD simulation method to study polyvinylcaprolactan (PVCap) and found that PVCap is irreversibly adsorbed on the surface of the hydrate, due to the entropic stabilization [18,19]. Our group simulated the growth of methane hydrate in the presence of three KHIs and found that the binding interaction between inhibitors and water molecules plays an important role in the inhibitory properties of the inhibitors. The gas-adsorbing mechanism was proposed, i.e., the KHIs inhibit methane hydrate growth by facilitating the formation of methane bubbles [20,21].
However, in practice, the methane and water molecules are not in a homogeneous solution but in different phases under experimental conditions. Based on previous work, the effects of KHIs on the growth of methane hydrate in the gas–liquid phase separation systems is further studied. MD simulation is adopted to track the growth process of the methane hydrate under gas–liquid phase separation state. The inhibition effects of different kinetic inhibitors are analyzed by comparing the potential energy changes of different systems, the dissolution rate of methane, and the number of hydrate cages. At the same time, the configurations of kinetic inhibitors in different states are observed and analyzed. The results are expected to provide information that can be referenced in future research on the design of novel, high-efficiency hydrate kinetic inhibitors.
2. Simulation Configuration and Calculation Method
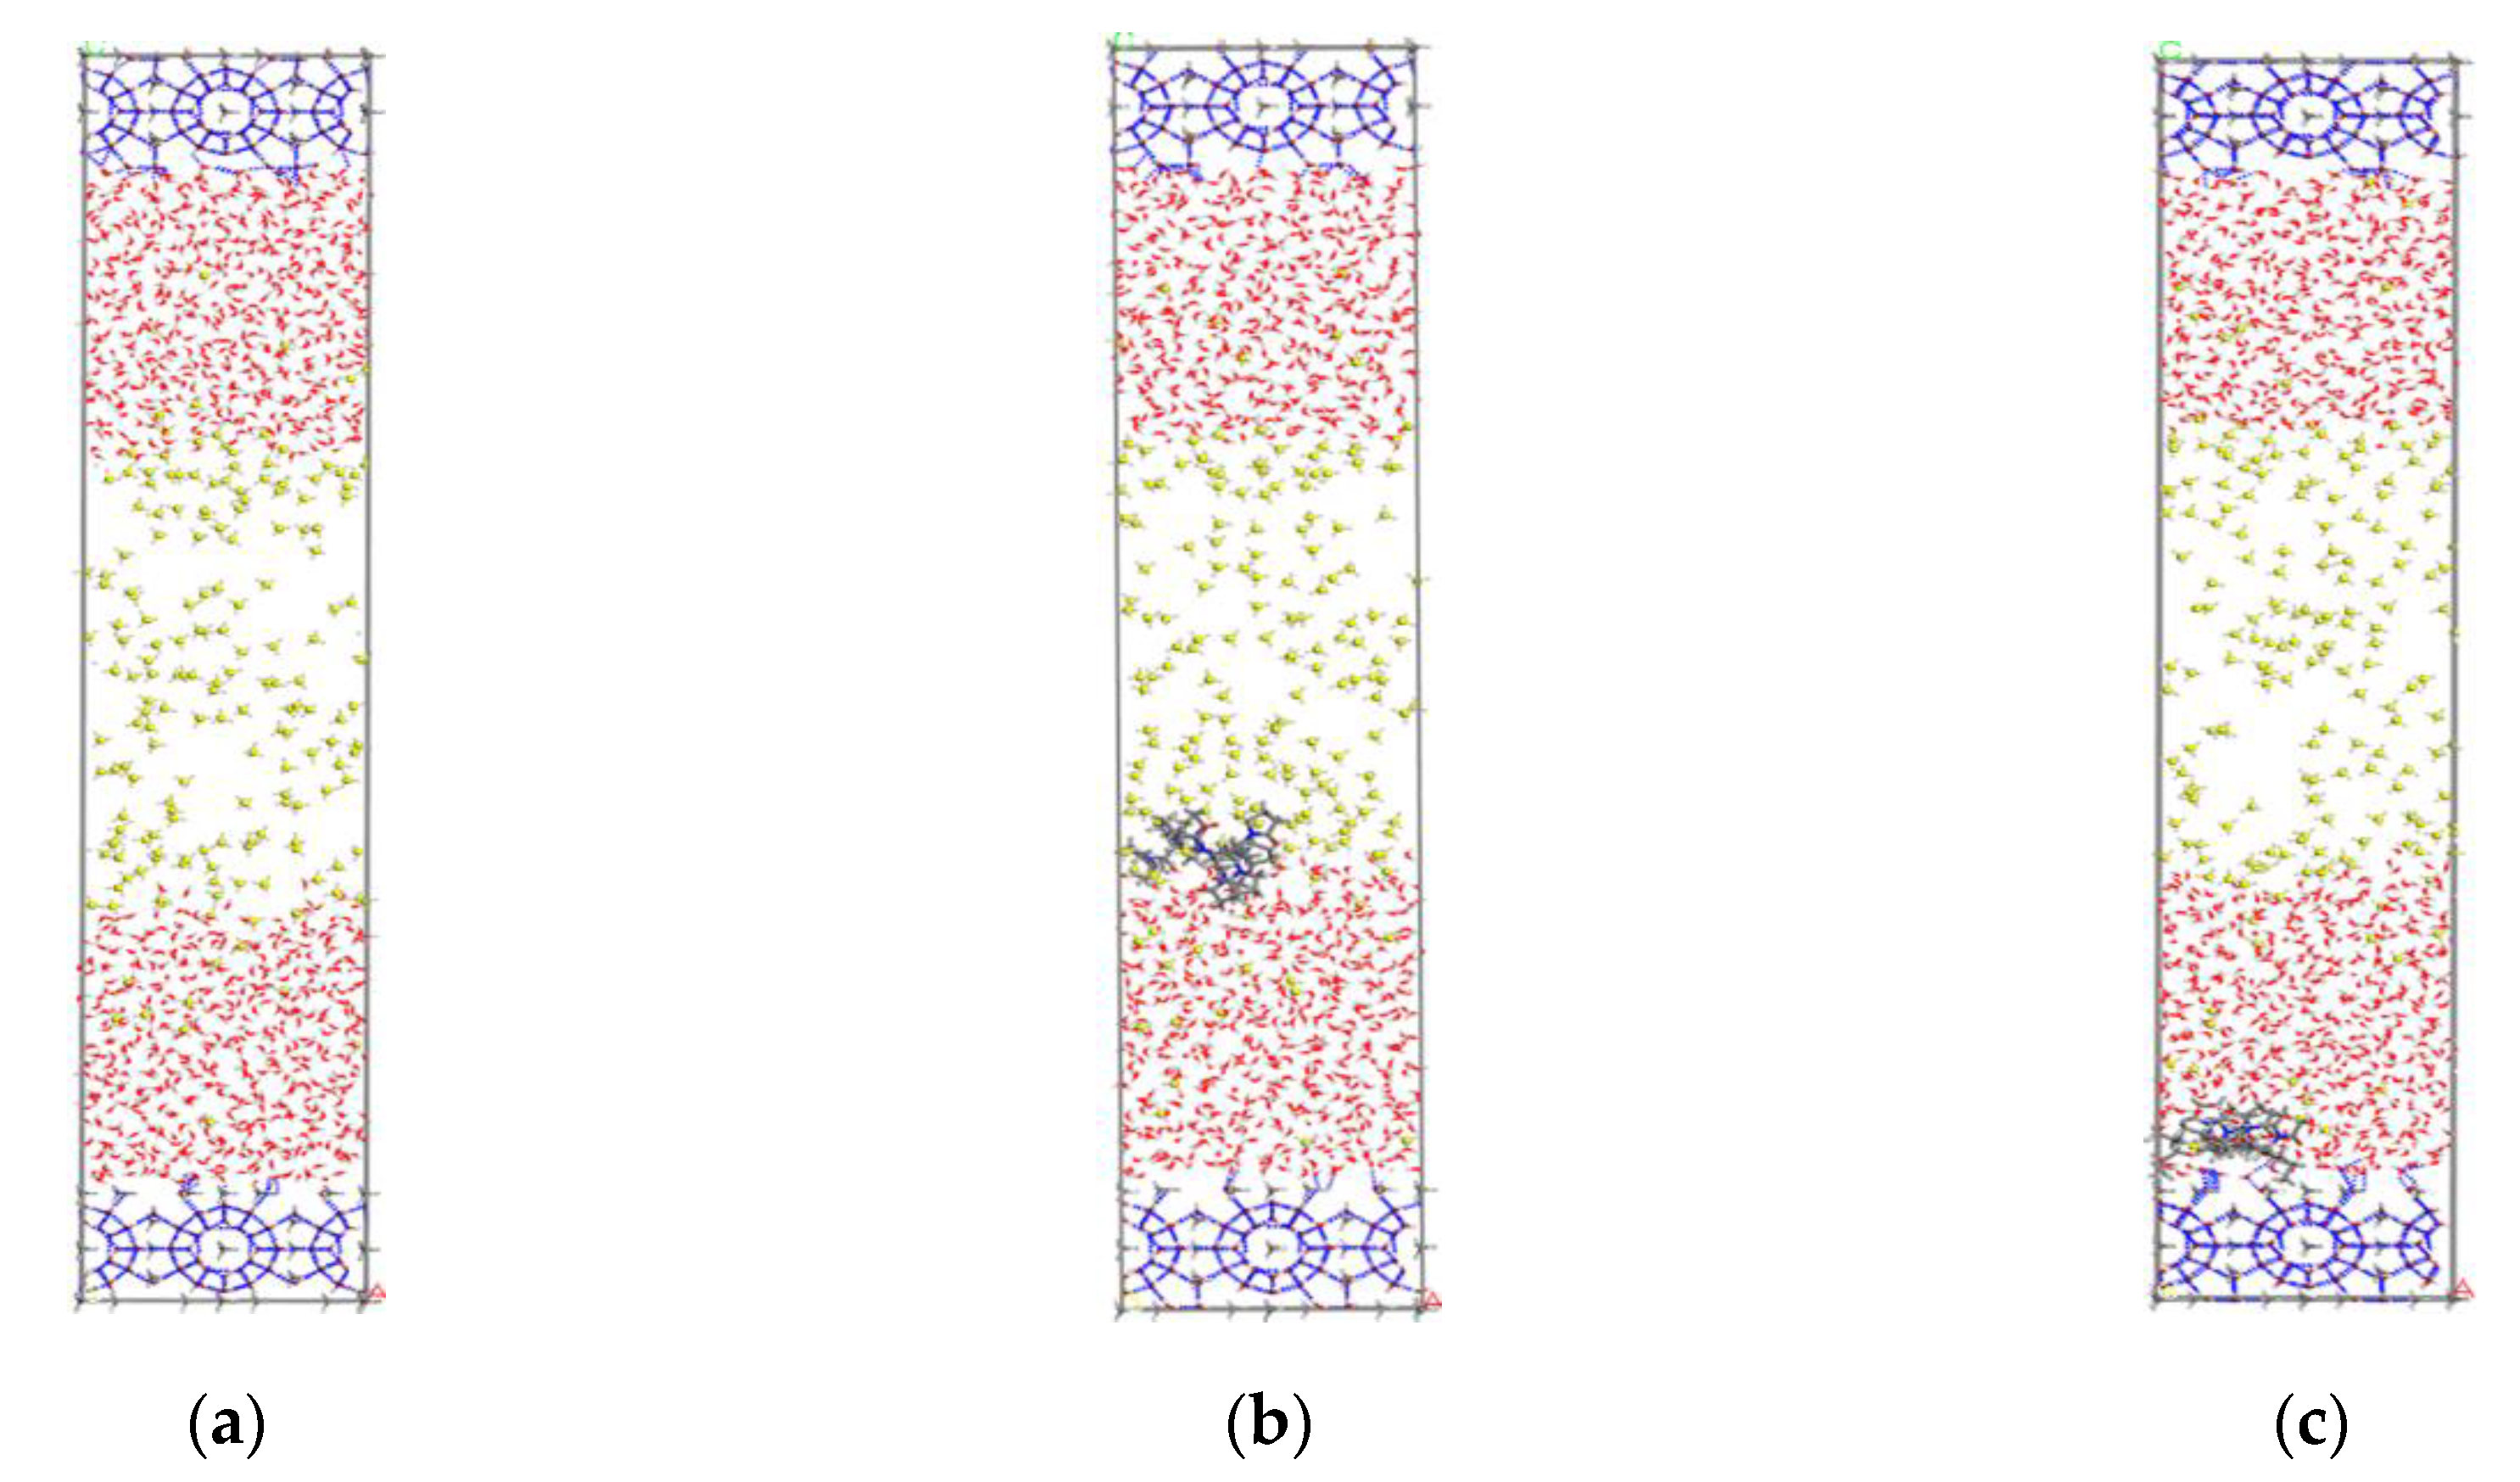
The open source program LAMMPS [22] was used for the parallel molecular dynamics simulation. The simulation box was set as 2.376 nm × 2.376 nm × 9.6 nm, and the systems were set to three-dimensional periodic boundary conditions. The simulation systems were composed of the solid hydrate crystals, gas phase methane molecules, liquid water molecules, and kinetic inhibitor molecules. The initial configuration of the pure methane-water system is shown in Figure 1a. Two 2 × 2 × 1 unit cells of structure sI methane hydrate nucleus were placed on the top and bottom of the simulation box. In addition, 183 methane molecules and 1086 water molecules were inserted into the box. For the inhibitors-containing systems, two KHIs, named PVP and PVP-A, were used as the model objects. PVP is one typical KHI, which is composed of vinyl-pyrrolidone polymer. PVP-A was developed by introducing the t-butyle group into PVP polymer molecule. The structures of the monomers of PVP and PVP-A were the same as our previous work. [20] The chain length of PVP was 8 and that of PVP-A was 4. During the simulation, the inhibitor molecules were initially placed on the gas–liquid phase interface and the surface of the hydrate nucleus for molecular dynamics simulation, respectively. The initial configurations of inhibitor-containing systems were shown in Figure 1b,c.
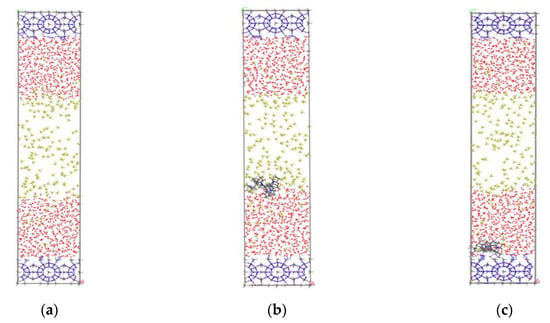
Figure 1.
The initial structures of different systems: (a) no-inhibitor-containing system, (b) inhibitor-containing system with KHIs at the gas–liquid phase interface, and (c) inhibitor-containing system with KHIs at the solid-liquid phase interface. The inhibitor molecules are shown in stick model, C of CH4 are shown in yellow, O of water are shown in red, and hydrogen bonds are shown in blue dashed lines.
In the simulation, molecular interactions were calculated by Lennard-Jones potential. The LJ cutoff radius of the systems was set to 9.5 Å. The kinetic inhibitor molecules were described by CVFF force field [23], OPLS-AA [24] force field was used to described the methane molecules, and the water molecules were described by TIP4P-EW [25] model. The Lorentz–Berthelot mixing rule was used to denote the Lennard-Jones interaction between different types of atoms, except that σ = 3.032 Å, ε = 0.255 kcal/mol [26,27] were used for the O (of water) and C (of methane). The initial structures were energy-minimized and 400 ps NVT (T = 276 K) calculation was used to relax the systems. Finally, the hydrate growth process was simulated under the NPT (P = 15 MPa, T = 276 K) ensemble. The temperature and pressure of the systems were kept constant by Nóse–Hoover thermostat and barostat. The damping constants of temperature and pressure were set as 0.2 ps and 0.1 ps, respectively. The time steps in the calculation process were set as 1 fs.
3. Results and Discussion
3.1. Effects of Kinetic Inhibitors Located at the Gas–Liquid Phase Interface
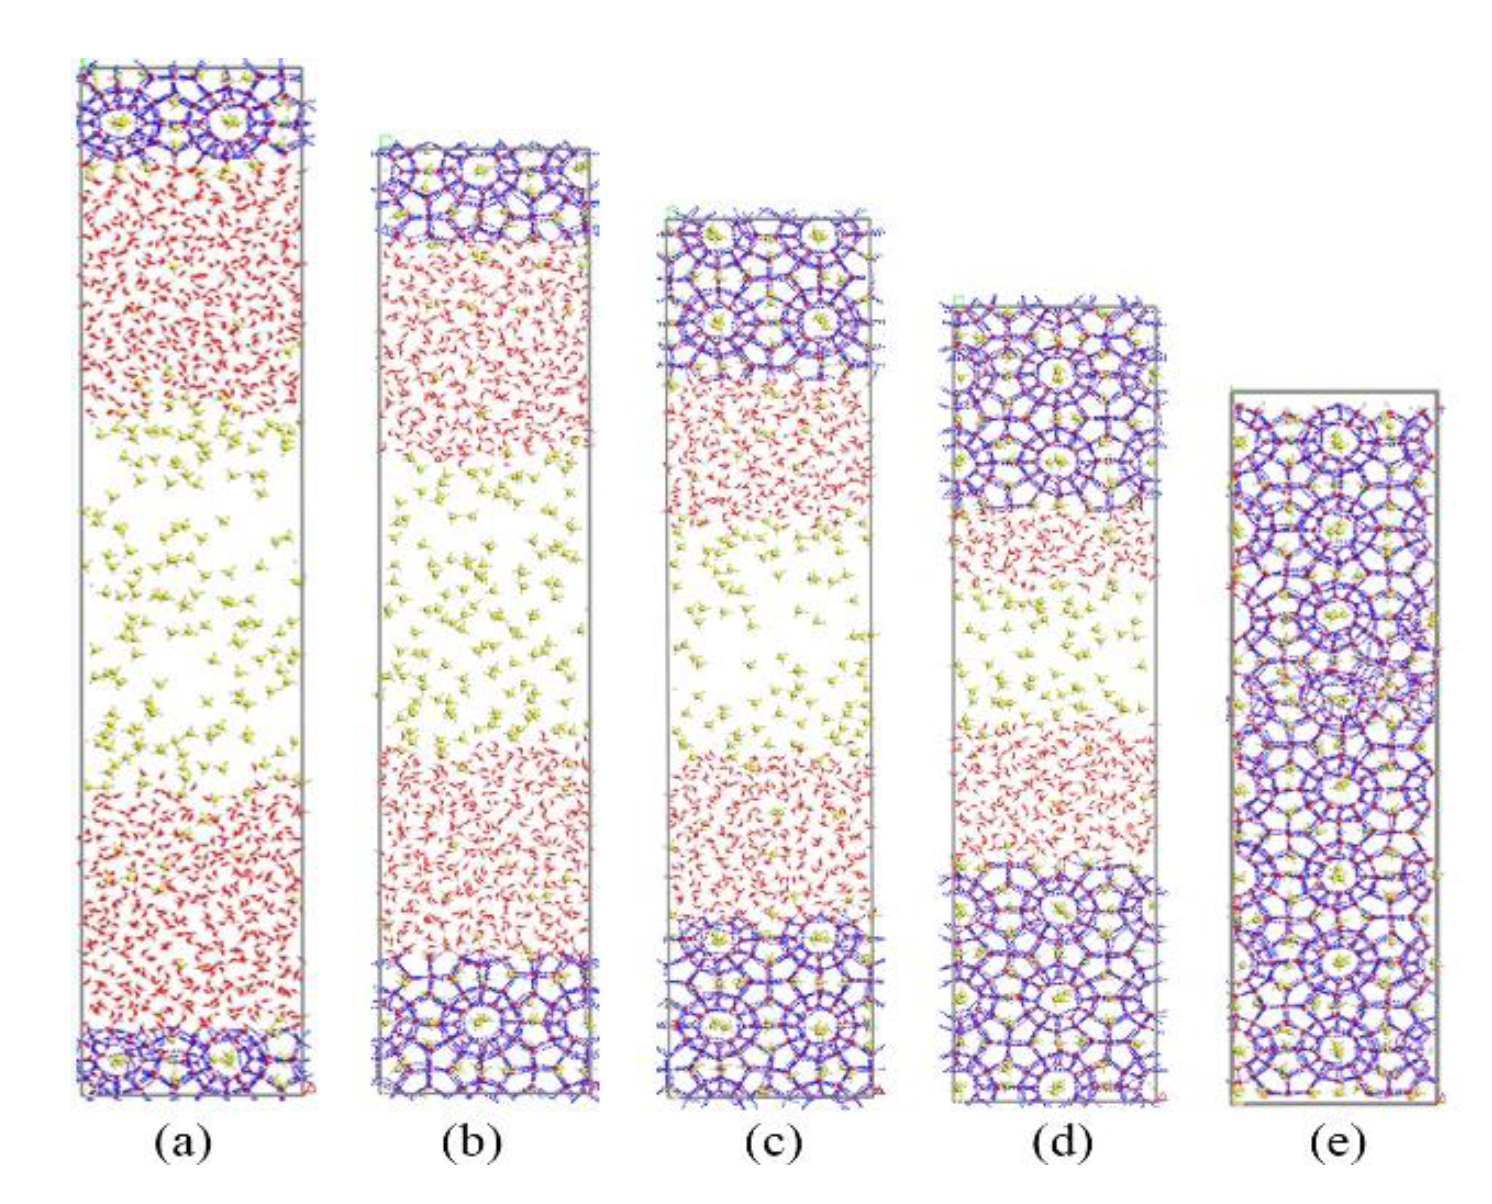
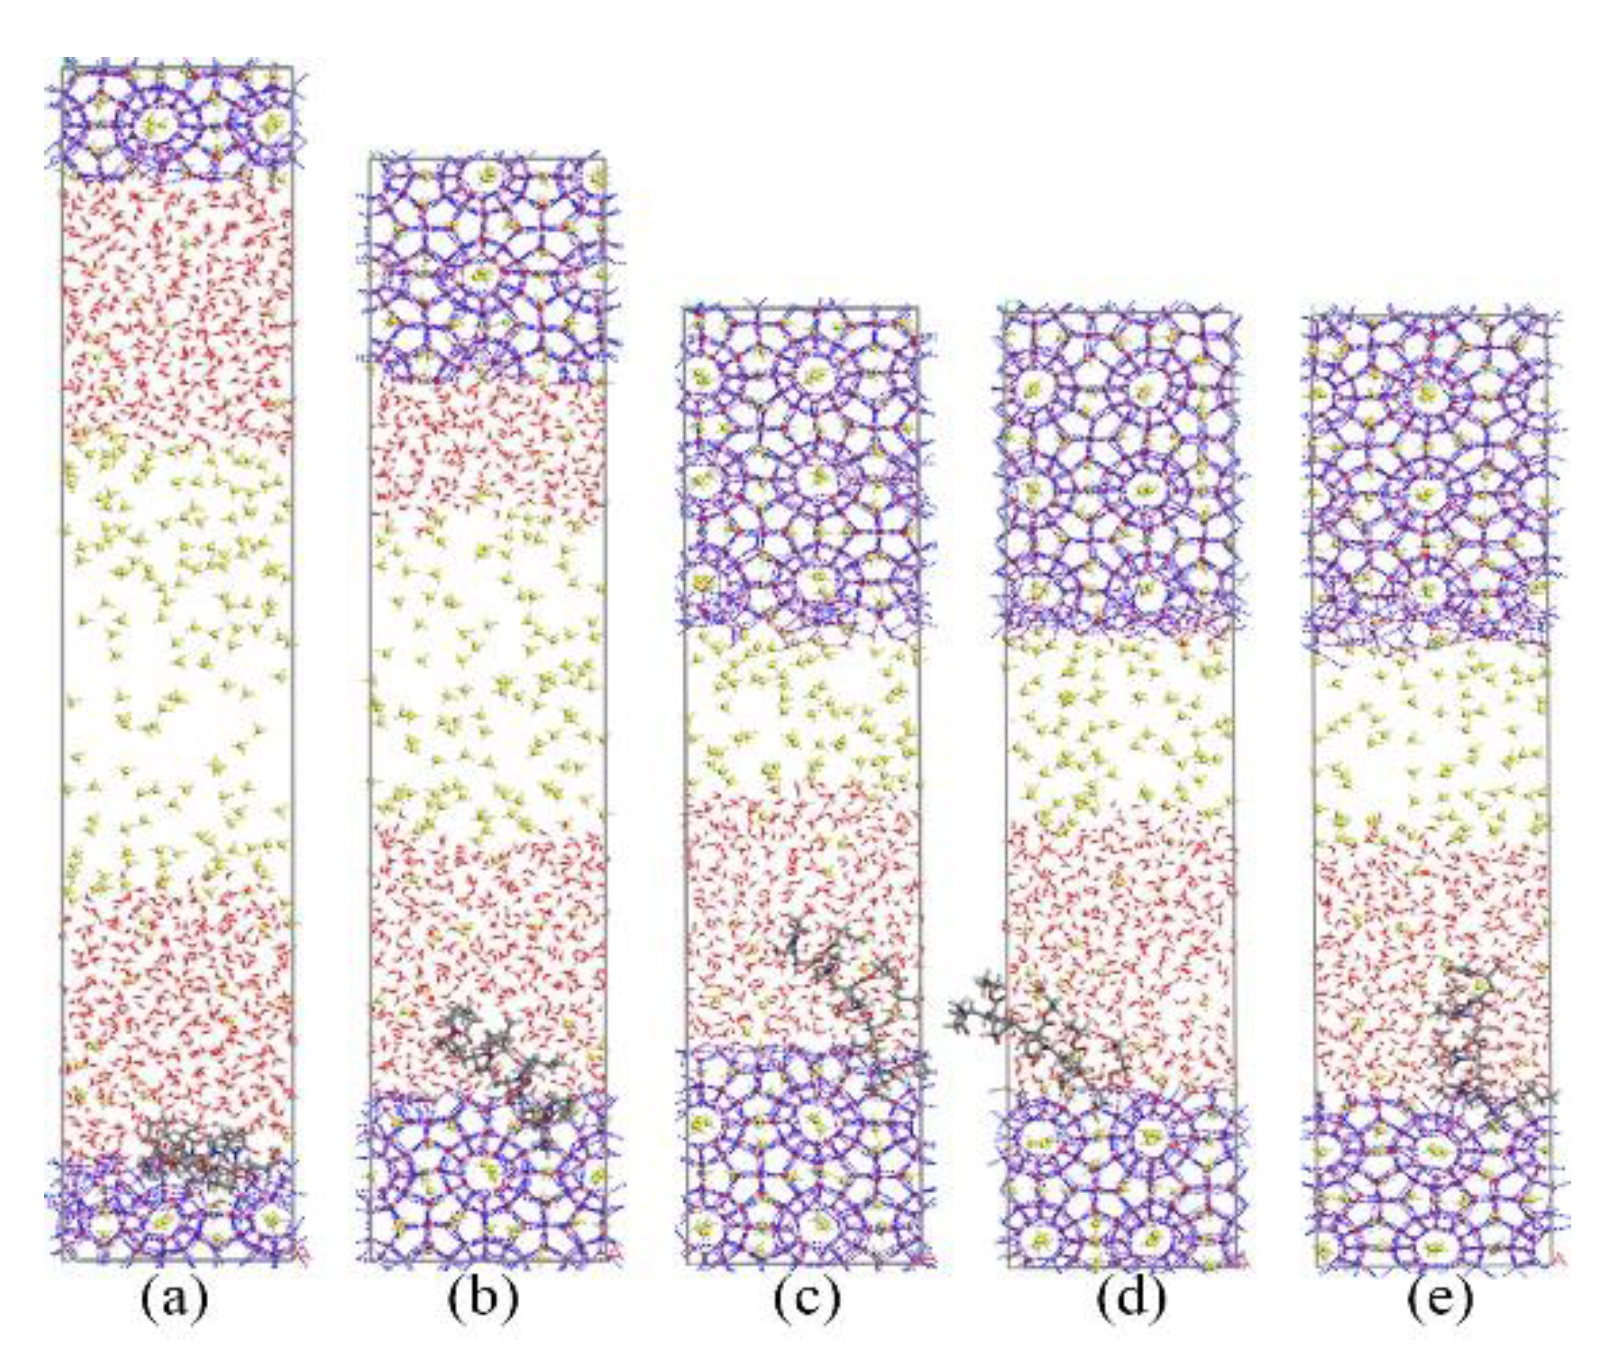
First, we simulated the growth process of methane hydrate in the no-inhibitor system as a reference. The simulation results are shown in Figure 2. Gradually dissolved methane molecules could be found in the liquid phase. Then, methane and water molecules formed new methane hydrate cages near the existing hydrate nucleus by self-assembly. As the simulation proceeded, the hydrate crystal nucleus continued to grow and the simulation box was completely filled with methane hydrate cages at about 70 ns.
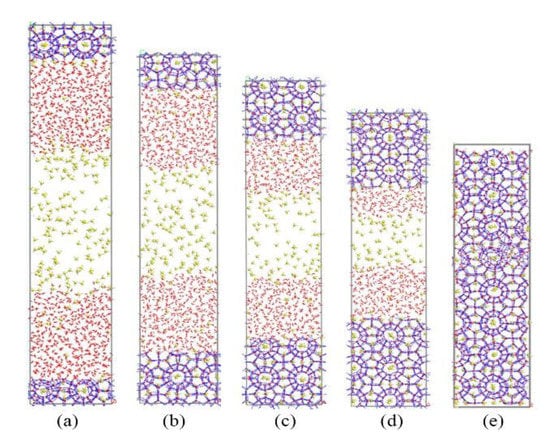
Figure 2.
Snapshots of non-inhibitor system: (a) 0 ns, (b) 20 ns, (c) 40 ns, (d) 60 ns, and (e) 70 ns.
Subsequently, we simulated the growth process of methane hydrate with KHIs at the gas–liquid phase interface. The simulation results are shown in Figure 3 and Figure 4. The simulation results showed that PVP and PVP-A could prolong the time of methane hydrate growth in the gas–liquid phase separation state. PVP-containing system and PVP-A-containing system were filled up with methane hydrate at 80 ns and 105 ns, respectively. This indicated that the growth of hydrates in inhibitors-containing systems were slower than that of no-inhibitor-containing system. It can clearly be seen that the PVP-A molecule is more effective in inhibiting the growth of methane hydrate than PVP. Our results are consistent with the experimental and simulation results of Li et al. [20].
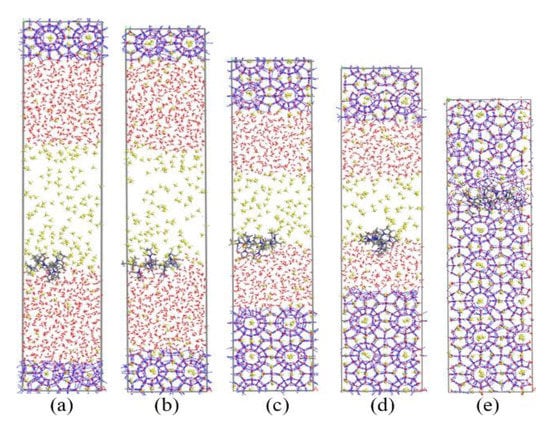
Figure 3.
Snapshots of PVP-containing system: (a) 0 ns, (b) 20 ns, (c) 40 ns, (d) 60 ns, and (e) 80 ns.
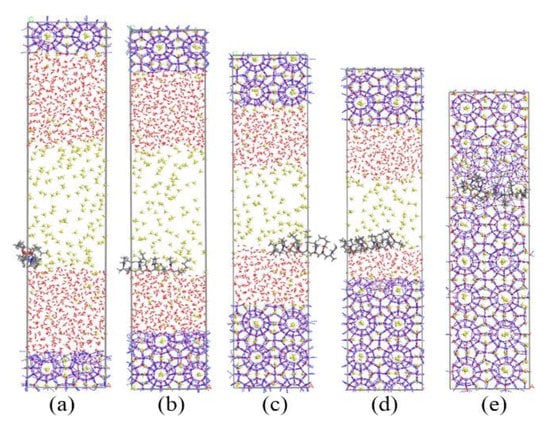
Figure 4.
Snapshots of PVP-A-containing system: (a) 0 ns, (b) 40 ns, (c) 70 ns, (d) 90 ns, and (e) 105 ns.
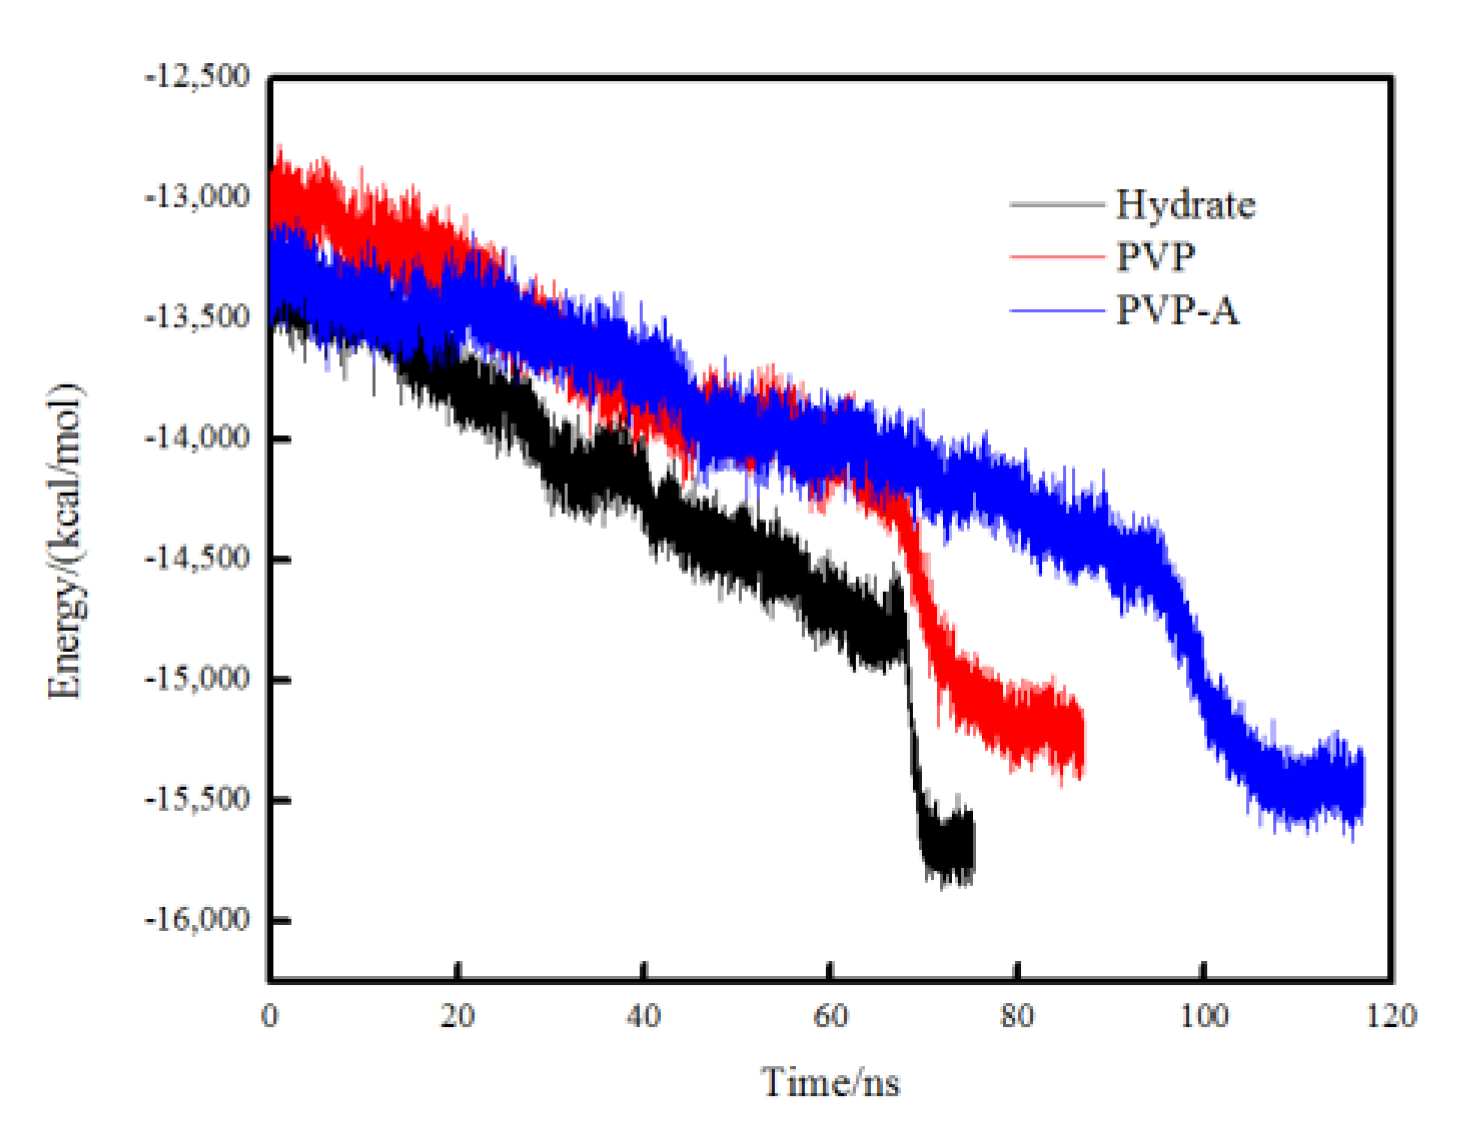
In order to compare the crystallization rate of each simulation system, the total potential energy was calculated for different systems. The faster the total potential energy decreases, the stronger the order degree of the system, indicating the faster the formation of the hydrate. When the simulation box is filled with crystal hydrates, the total potential energy tends to be constant and the system reaches equilibrium. In Figure 5, it can be seen that the total potential energy in the pure methane-water system drops fastest and the system reaches equilibrium at about 70 ns. The PVP and PVP-A molecules could obviously extend the equilibrium time by 10 ns and 35 ns, respectively. These results further verify that PVP and PVP-A can inhibit the growth of methane hydrate in the gas–liquid phase separation state, and that the inhibition performance of PVP-A is better than PVP.

Figure 5.
Variations of the total potential energy in no-inhibitor-containing and inhibitor-containing system.
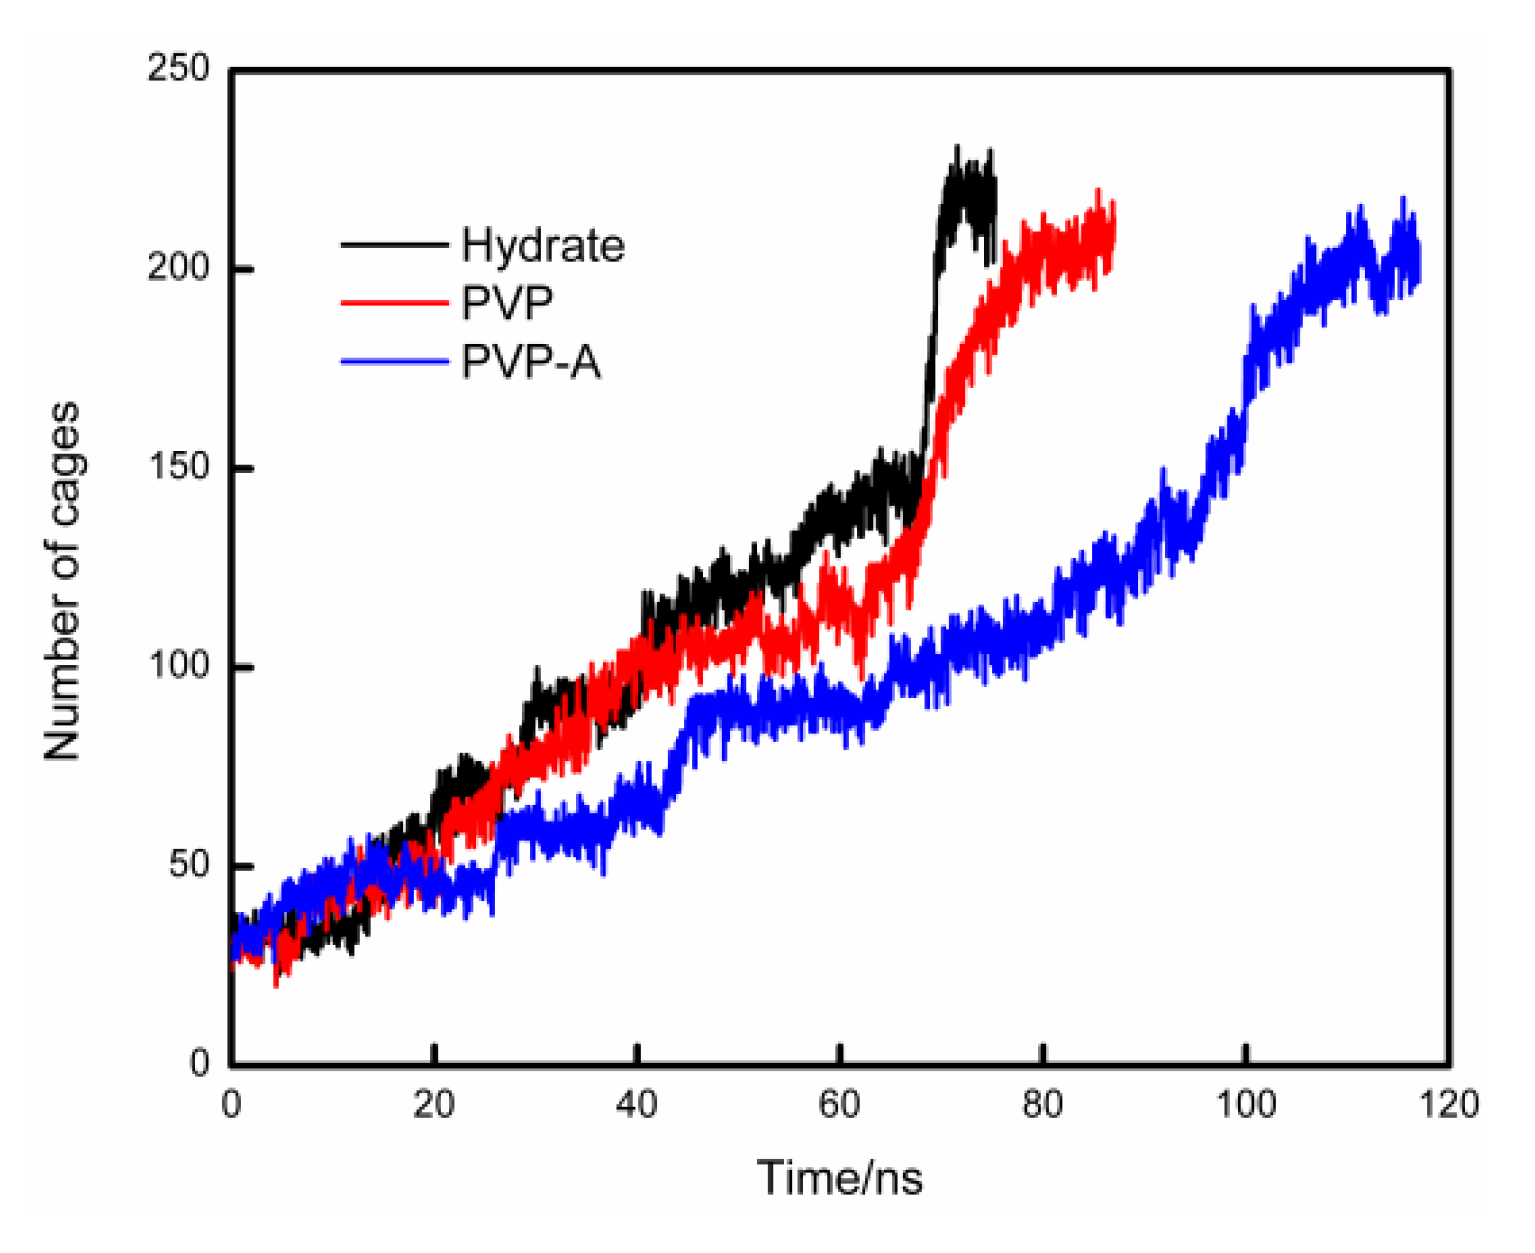
In order to compare the velocities of hydrate formation in different systems, we use the cage identification algorithm [28,29] to count the number of hydrate cages in different systems. The calculation results are shown in Figure 6. The hydrate growth rate of inhibitor-containing systems is significantly slower than that of the system without KHIs inside, and the PVP-A-containing system has the slowest growth rate. Our simulation results show that kinetic inhibitors can delay the formation of hydrate cages and PVP-A shows better inhibitory effect on methane hydrate growth. In addition, we also get that when the systems reach equilibrium, the number of hydrate cages for inhibitor-containing systems are slightly less than that for no-inhibitor-containing system. This difference is mainly due to the steric hindrance effect of the inhibitor molecule in the system, resulting in partial methane and water molecules close to the inhibitor molecule not forming the complete hydrate cage structures. When the number of hydrate cages increases to a certain value, the growth rate of hydrate would show a significant acceleration process. This is because the hydrate nucleus reaches critical nucleus size and the hydrate growth process enters into a rapid stage.

Figure 6.
Variations of the total number of hydrate cages in no-inhibitor-containing and inhibitor-containing system.
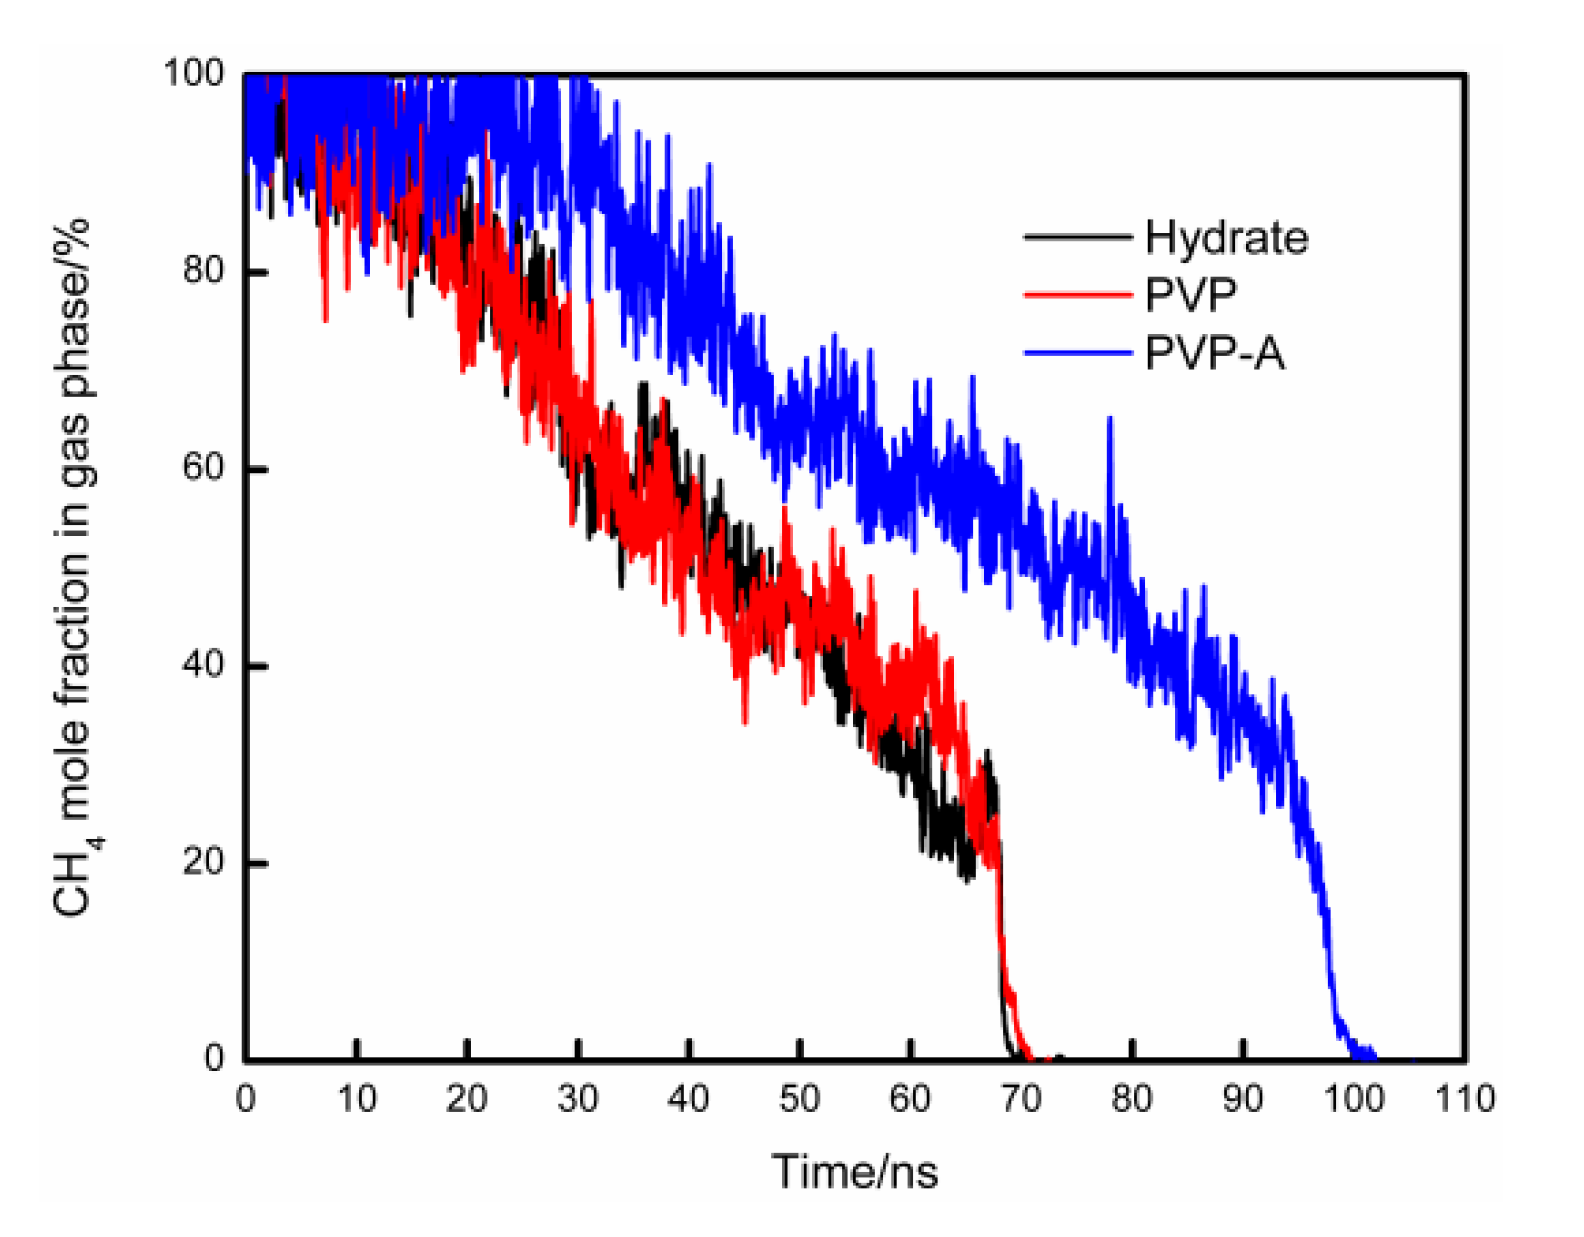
The mole fraction of CH4 in the gas phase versus simulation time for different systems is shown in Figure 7. During the simulation, the methane molecules in the gas phase continue to dissolve into the liquid phase and then move to the vicinity of the hydrate nucleus to form new hydrate cages. The mole fraction of methane molecules in the gas phase will continue to decrease. Thus, the rate at which methane dissolves into water could be reflected by the mole fraction of methane in the gas phase. For no-inhibitor-containing system, it took about 70 ns for the methane molecules to completely dissolve in the liquid phase. The methane dissolution curve for the PVP-containing system is not much different from the no-inhibitor-containing system. The dissolution rate of methane in the PVP-A-containing system was slower than no-inhibitor-containing system, and the time delay of the methane complete dissolution was about 30 ns. When KHIs are located at the gas–liquid phase interface, the hydrophobic groups of inhibitors extend to the methane gas phase and the hydrophilic groups are immersed in the aqueous solution. The strong attraction between the hydrophobic groups and methane molecules inhibits the mass transfer of methane molecules from gas phase to the upper aqueous solution. Thus, the hydrate growth rate is obviously decreased for the upper surface of the simulation system.
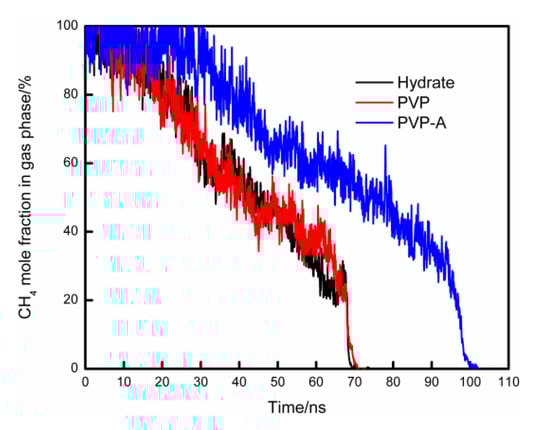
Figure 7.
The mole fraction of CH4 in gas phase changes with simulation time for different systems.
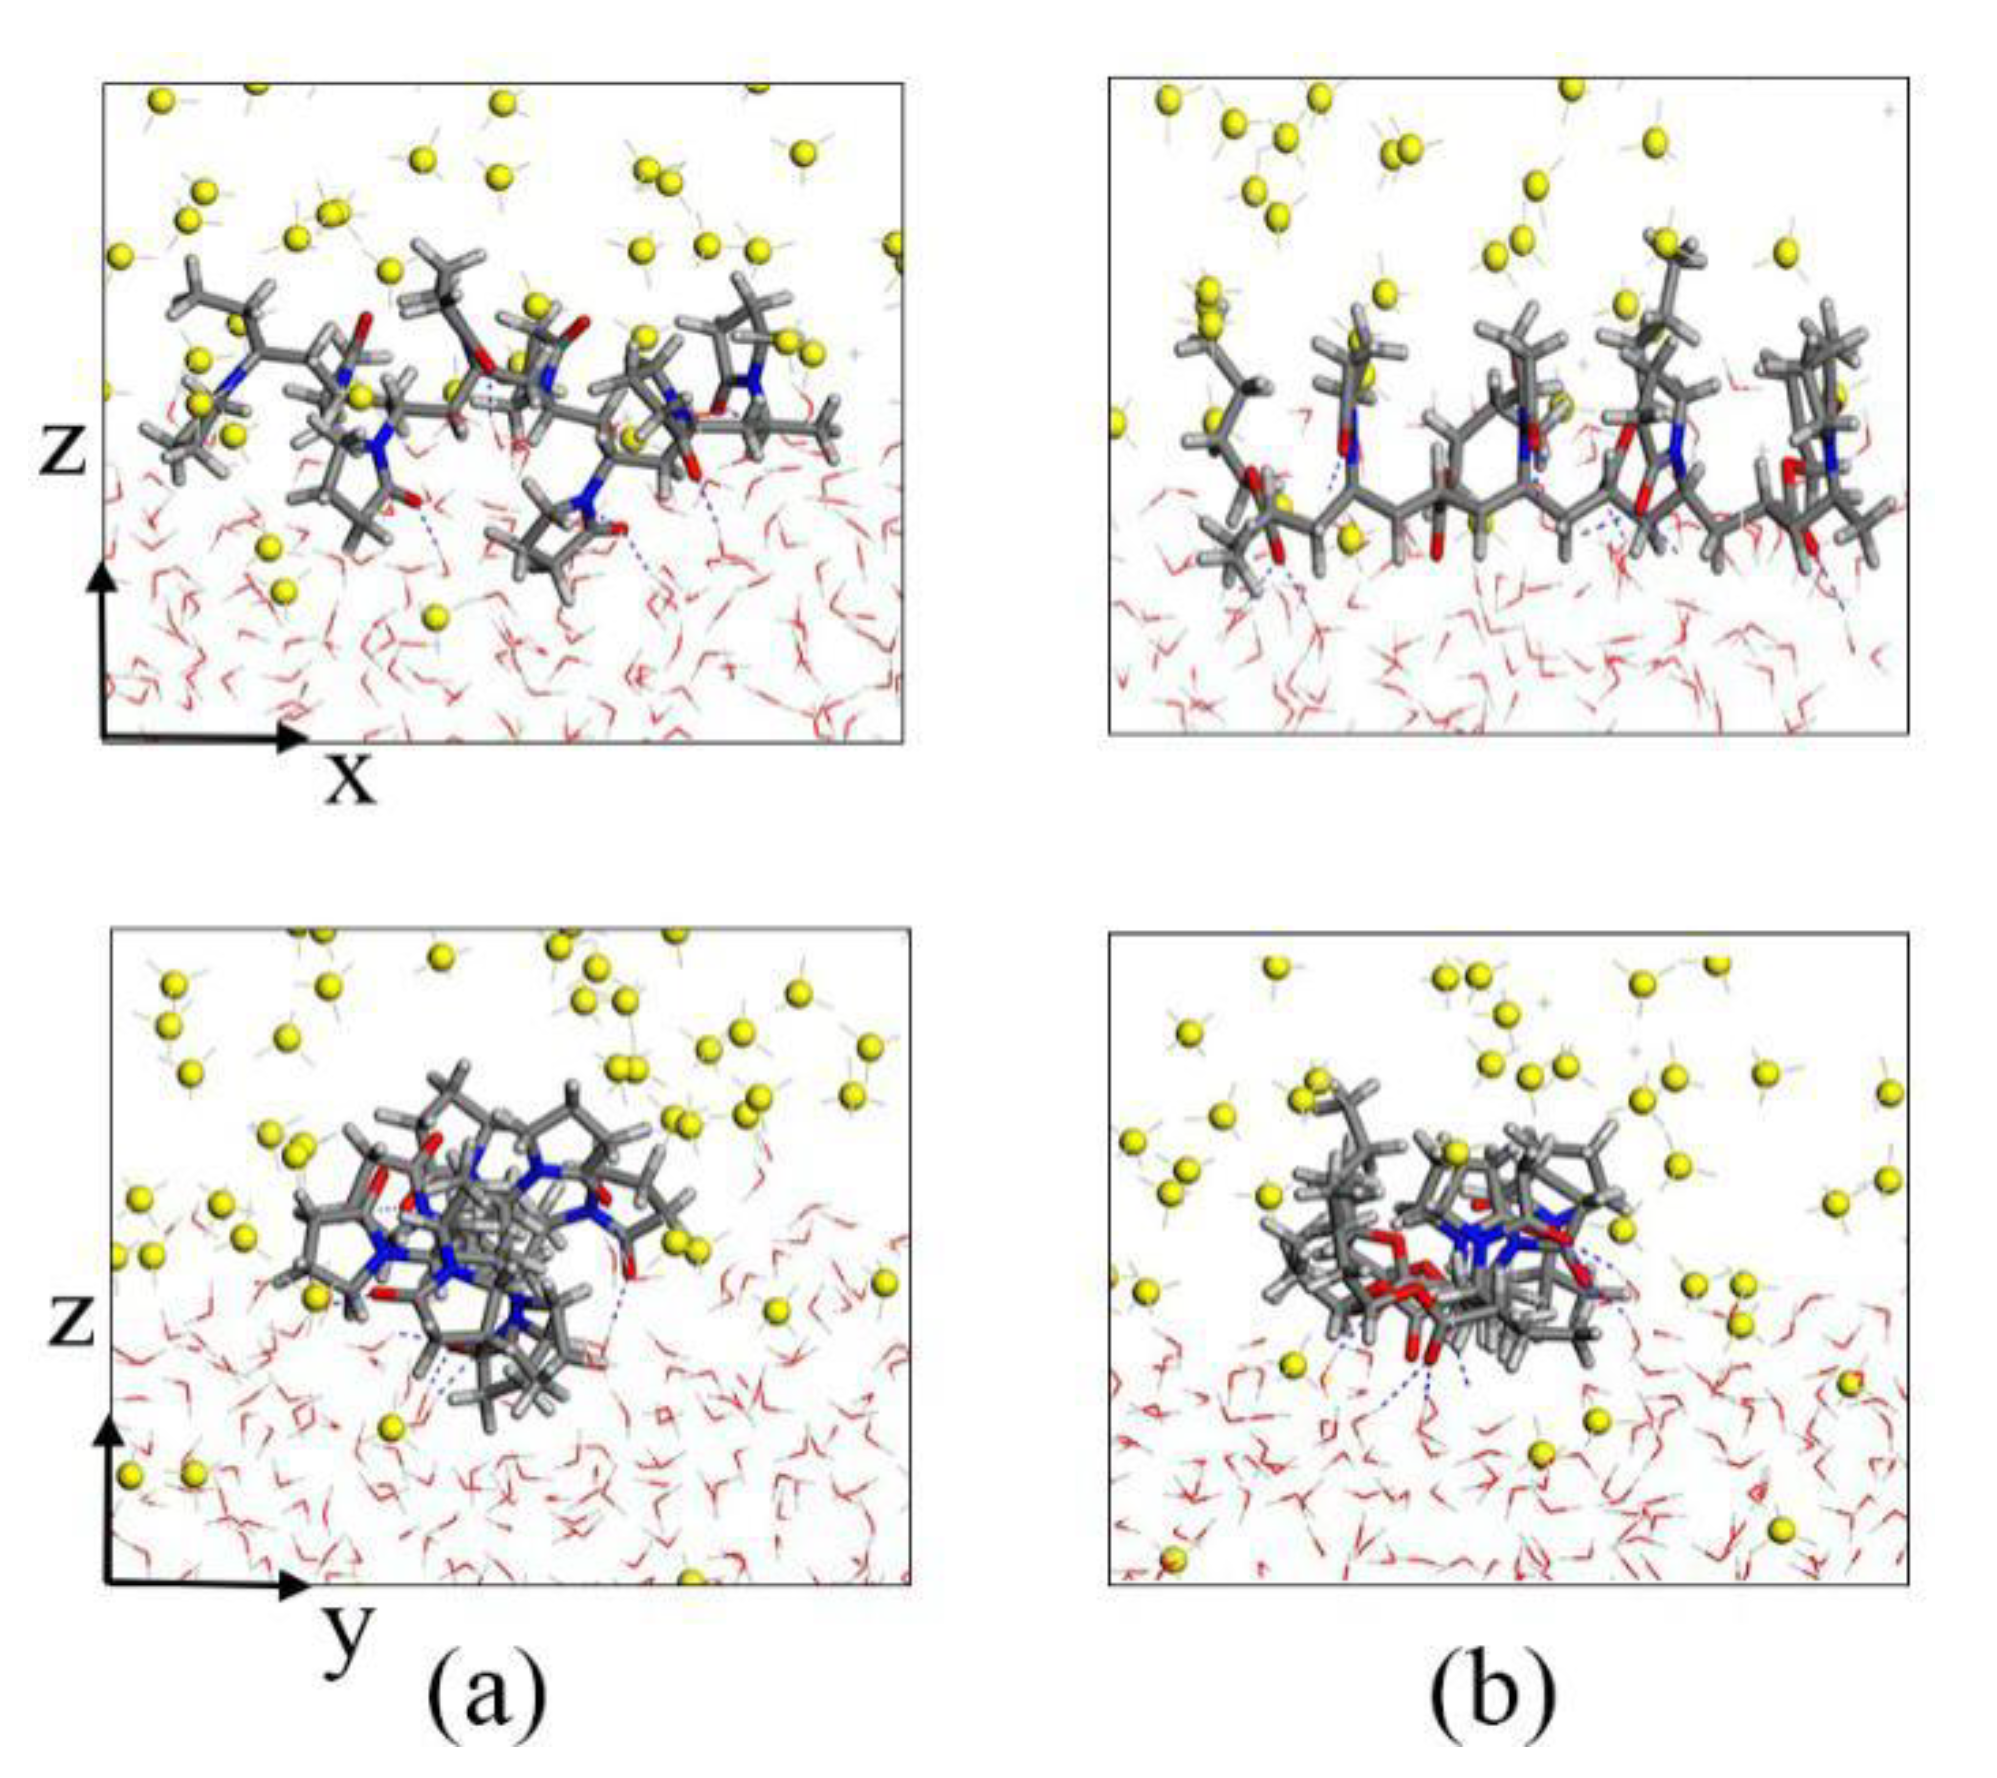
To further analyze the inhibition mechanism of KHIs, we intercepted KHIs located in the gas–liquid phase interface. The local amplification figures are shown in Figure 8. Both PVP and PVP-A molecules have hydrophilic and hydrophobic groups, they generally change their conformation to suit the surrounding chemical environment. From Figure 8, we found that the polymer molecule always remained at the gas–liquid phase interface, and the hydrophilic groups were in intimate contact with the water molecules, while the hydrophobic groups were in close contact with the methane molecules. For the PVP-A molecule, the double bond oxygen atoms on the PVP-A molecule with high charge density formed H-bonds with water molecules. The groups on PVP-A molecule were in contact with methane molecules, which can affect the migration of methane molecules and maximally exert its inhibition effect. For the PVP molecule, the double bond oxygen atoms on pyrrolidone rings of PVP polymer molecule formed H-bonds with water molecules and two pyrrolidone rings were completely immersed in the liquid phase. It is clearly seen that the groups on the PVP-A molecule could contact with methane molecules more thoroughly than that on the PVP molecule. The simulation results show that increasing the contact area between the groups of the inhibitor molecule and methane is beneficial to enhance the inhibitory effect of the inhibitors.
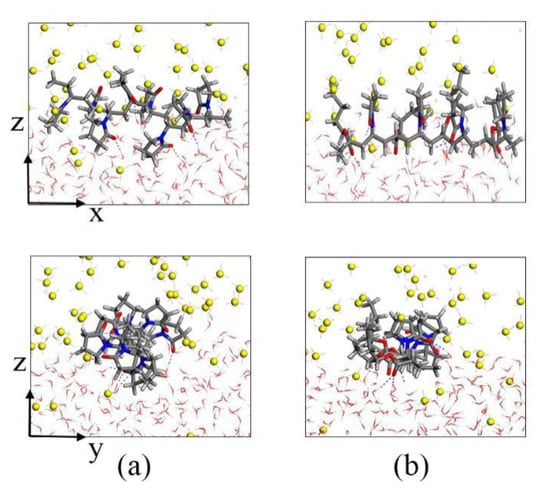
Figure 8.
Local amplification snapshots of (a) PVP and (b) PVP-A.
3.2. Effects of Kinetic Inhibitors Located at the Solid-Liquid Phase Interface
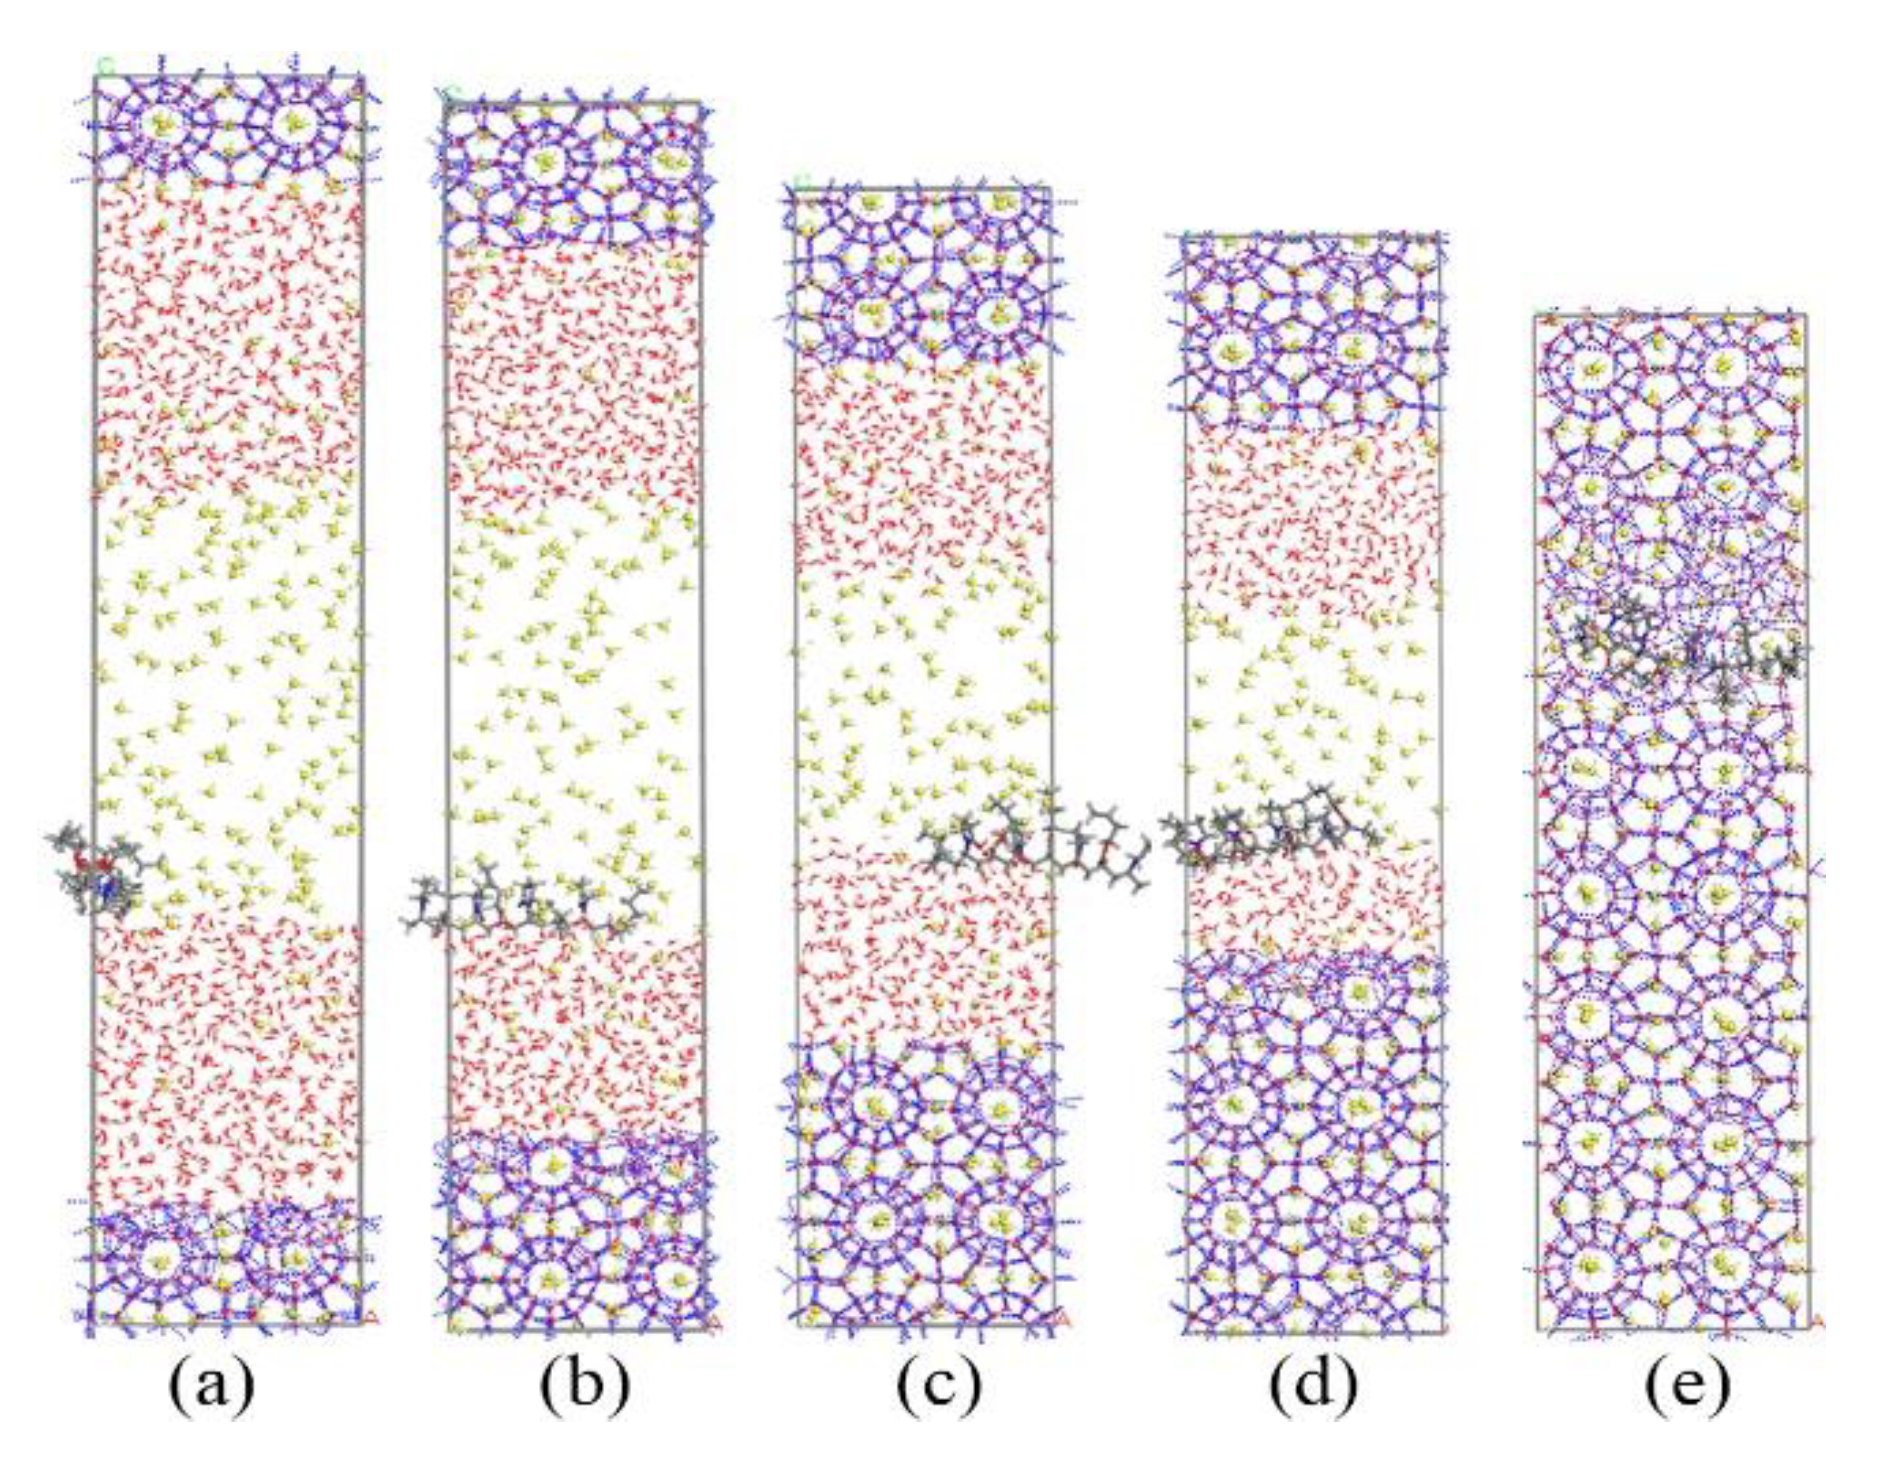
Figure 9 and Figure 10 show the growth process of the methane hydrate in presence of KHIs at the solid-liquid phase interface. Unlike the inhibitor molecules at the gas–liquid phase interface (see Figure 2), methane hydrate grows slowly on the inhibitor-containing side, while the methane hydrate grows quickly on the other side. It was clearly seen that the methane hydrate on the no inhibitor-containing side grew completely at about 80 ns, and the methane hydrate still did not fill the simulation box at t = 200 ns. At this time, the inhibition effects of PVP and PVP-A were not much different. This phenomenon indicates that the initial positions of the kinetic inhibitors had significant influence on the growth of the methane hydrate. When KHIs were located at the solid-liquid phase interface, they would significantly inhibit the growth of the surrounding methane hydrate.
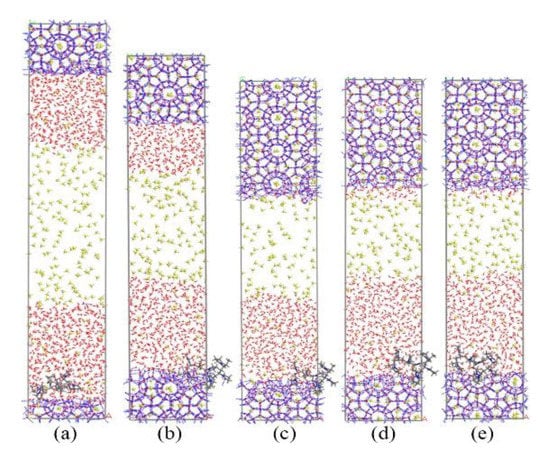
Figure 9.
Snapshots of PVP containing system: (a) 0 ns, (b) 40 ns, (c) 80 ns, (d) 130 ns, and (e) 200 ns.
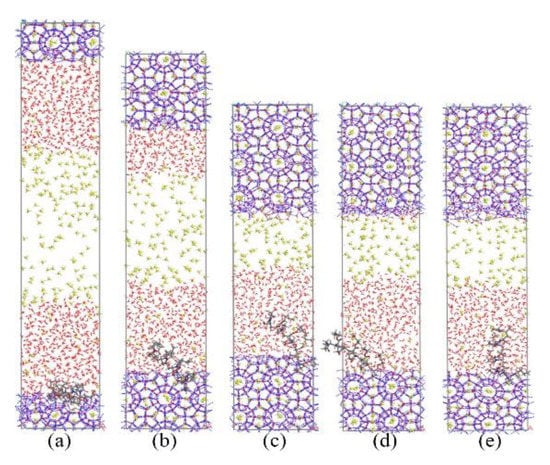
Figure 10.
Snapshots of PVP-A containing system: (a) 0 ns, (b) 40 ns, (c) 80 ns, (d) 130 ns, and (e) 200 ns.
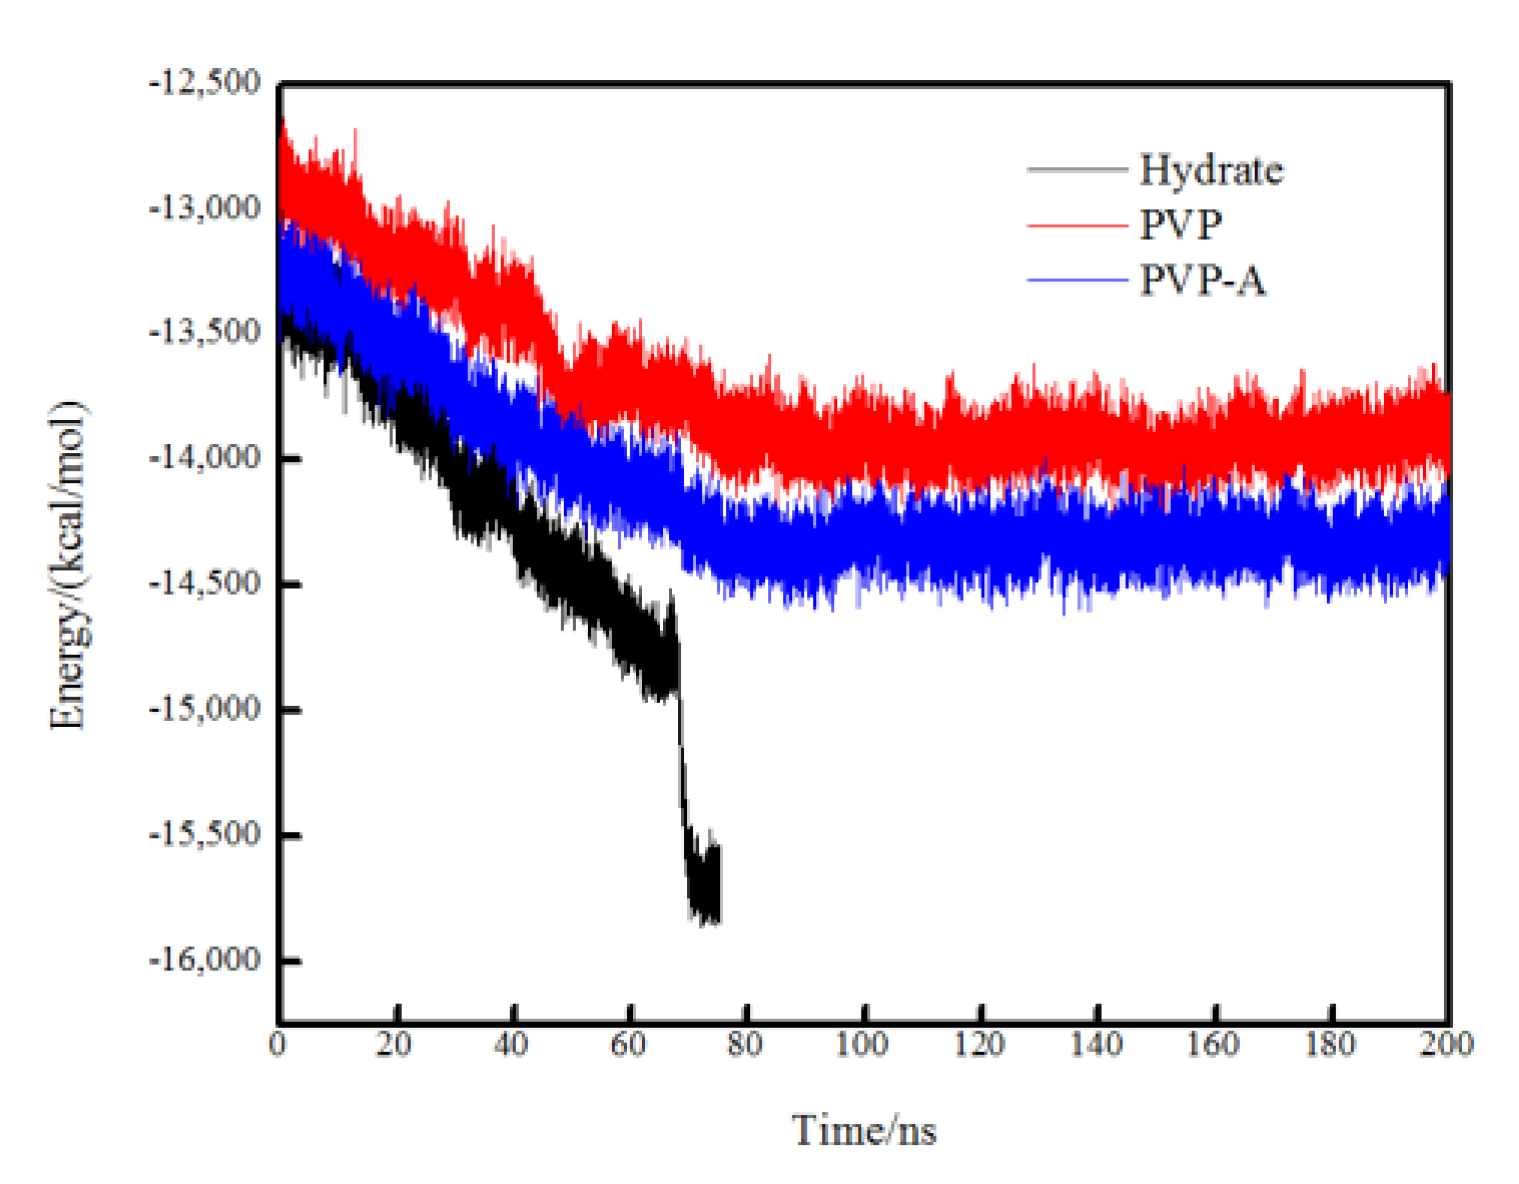
The variations of the total potential energy of different systems are shown in Figure 11. The potential energy of all systems shows a significant downward trend during 0–70 ns, indicating that the order degree of the system is increasing and the methane hydrate in the system is continuously growing. However, the total potential energy reduction of the pure methane-water system is more obvious than that of the inhibitor-containing systems. For the no-inhibitor-containing system, the total potential energy of the system reached equilibrium at about 70 ns and the system was filled with methane hydrate. For the inhibitors-containing systems, the total potential energy of the systems continued to decrease between 0 and 80 ns because of the successive growth of the hydrate nucleus on the no inhibitor-containing side of the simulation box. After 80 ns, the system reached equilibrium and the water molecules at the top of the box completely formed methane hydrates. Subsequently, the total potential energy no longer appeared obviously decreased during the simulation time. The simulation results show that the kinetic inhibitor molecules had great influence on the hydrate growth on the inhibitor-containing side but had almost no effect on the no inhibitor containing side.

Figure 11.
Variation of the total potential energy in no-inhibitor-containing and inhibitor-containing systems.
Figure 12 shows the variation of the number of hydrate cages. It is clearly seen that the hydrate growth rate of inhibitor-containing systems are significantly slower than no-inhibitor-containing system. After 80 ns, the number of hydrate cages in inhibitor-containing systems reached equilibrium, and the methane hydrate growth of inhibitor-containing systems were almost stopped. Our simulation results show that kinetic inhibitors can significantly delay the growth of the number of methane hydrate cages, and PVP have similar inhibitory effects with PVP-A when the inhibitor molecule is located at the solid-liquid phase interface. Our results show that the initial position of the inhibitors has great influence on the inhibitory effect of the inhibitors.
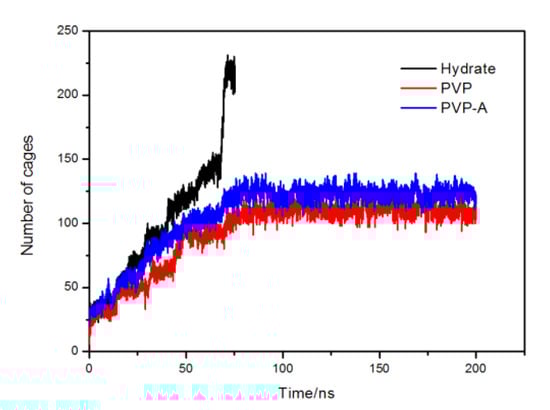
Figure 12.
Variation of the total number of methane hydrate cages in no-inhibitor-containing and inhibitor-containing systems.
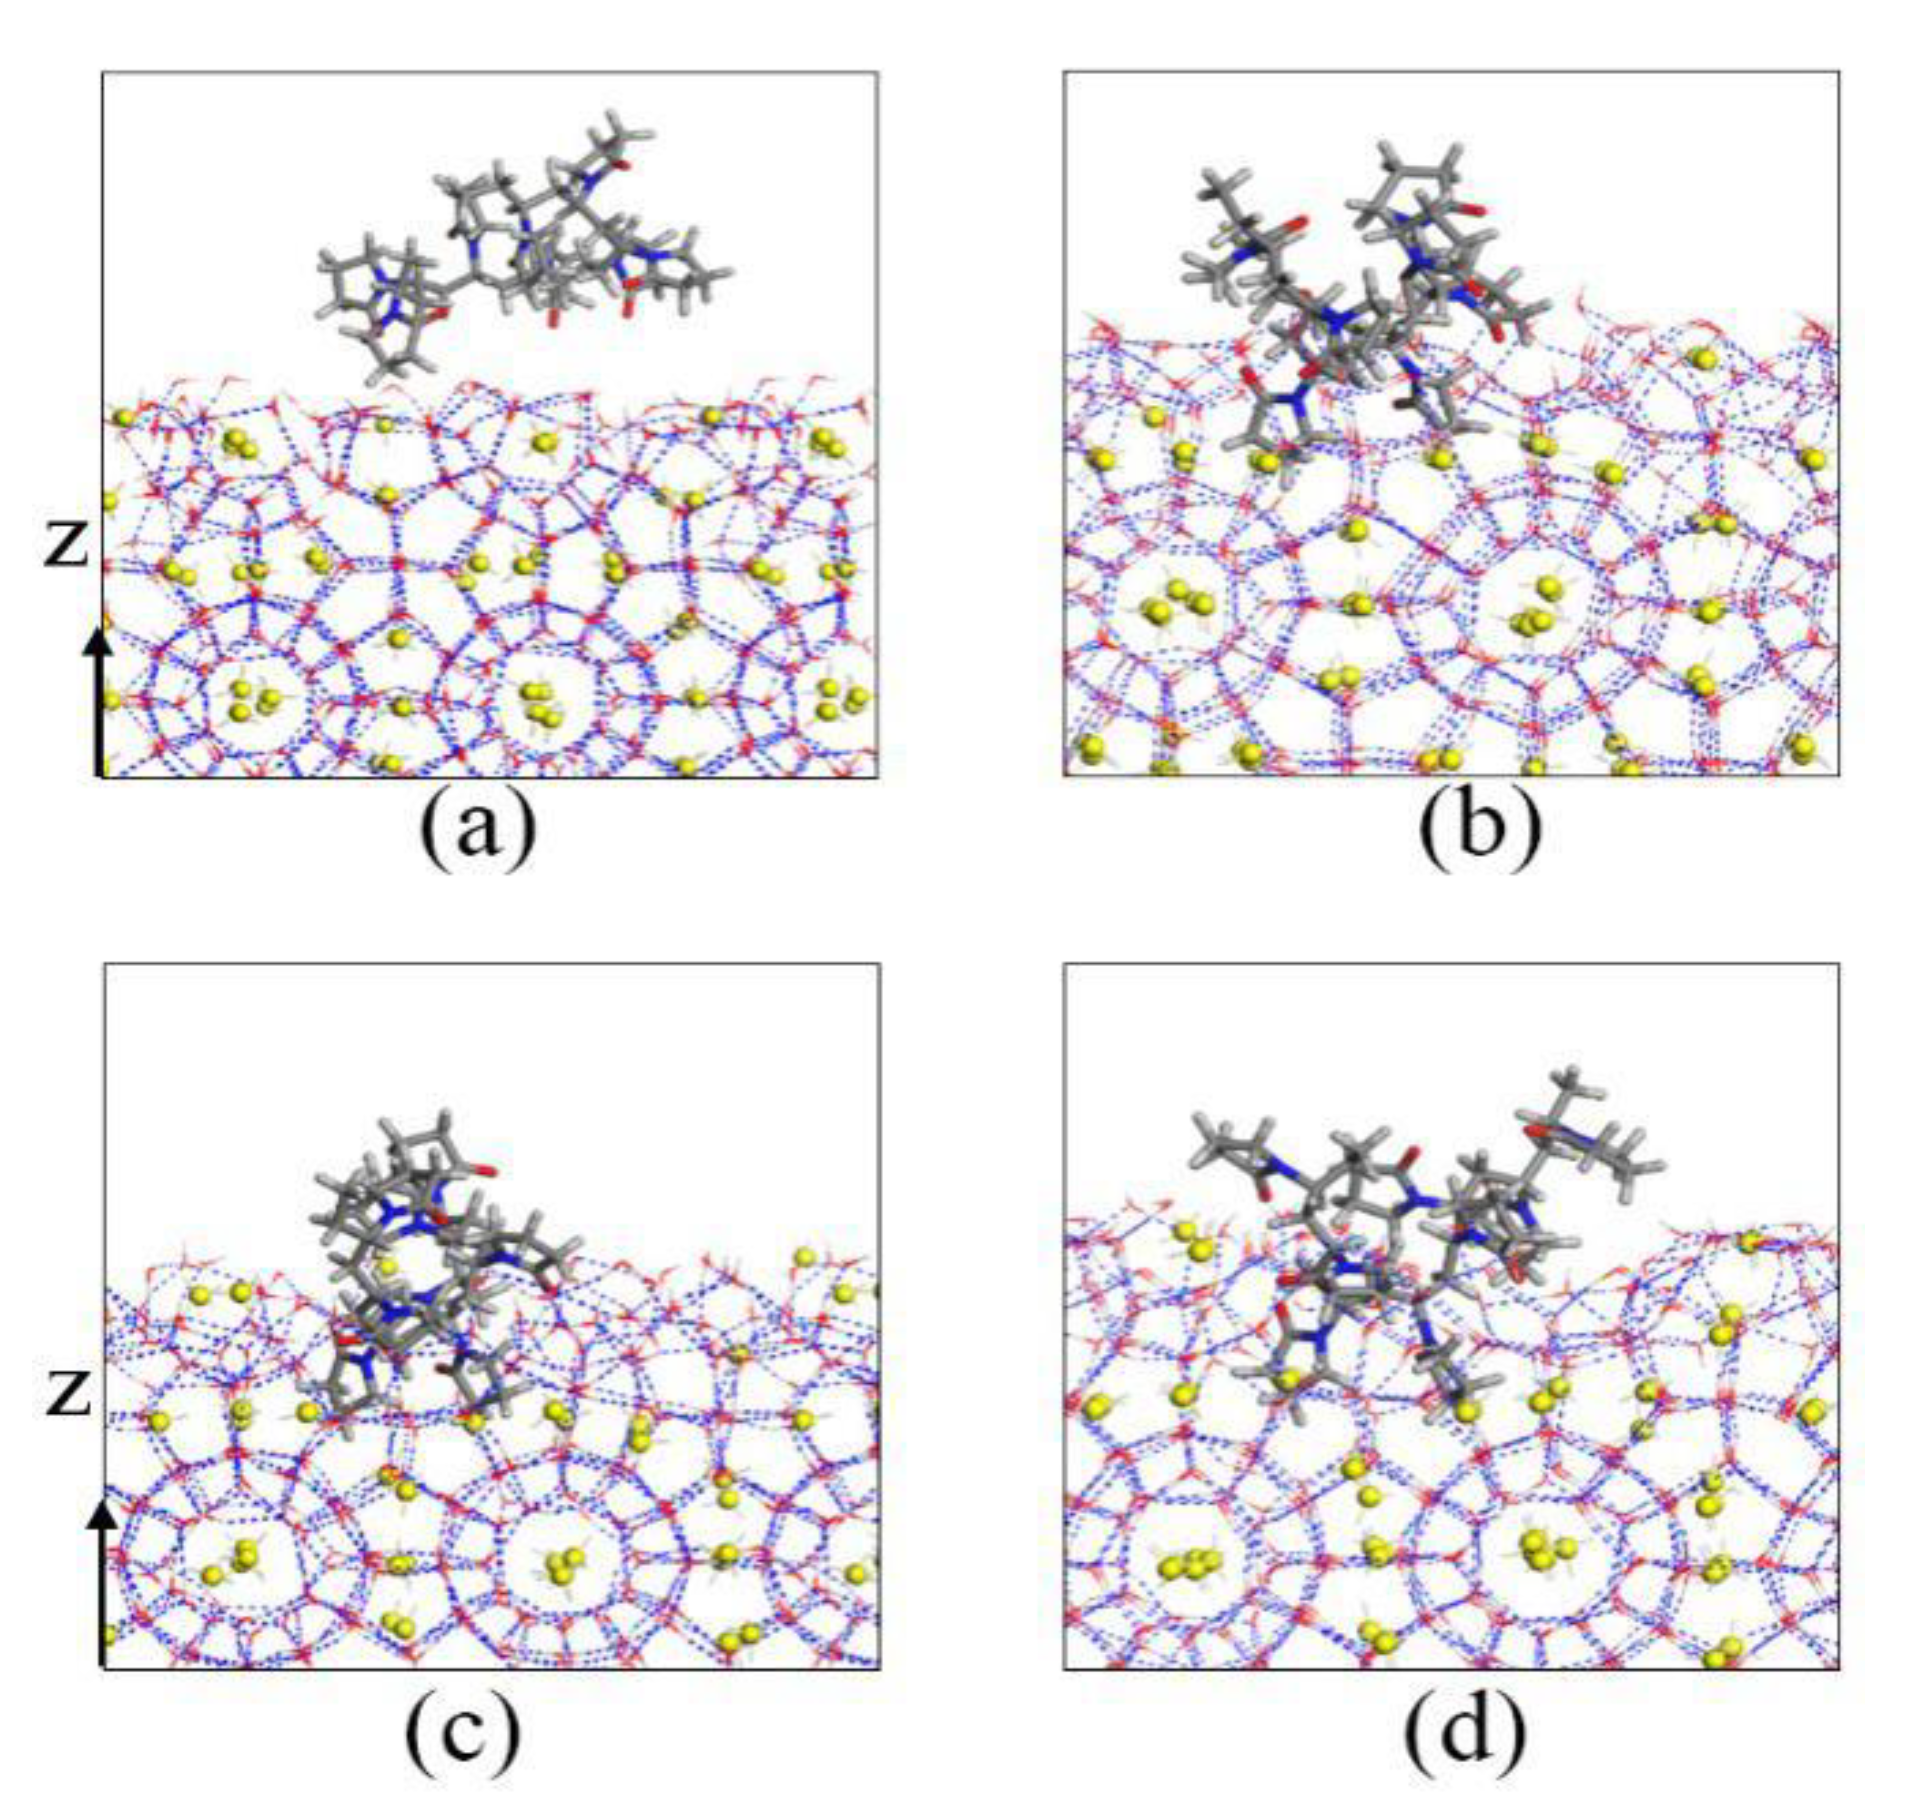
In order to clearly observe the action of the KHIs at the solid–liquid phase interface, the magnified the surfaces of the methane hydrate nucleus of inhibitor-containing systems are shown in Figure 13 and Figure 14. For the PVP-containing system, multiple functional groups of the inhibitor molecule were embedded in the semi-cage structure during the simulation. This phenomenon indicates that the methane hydrate nucleus had strong adsorption effect on PVP molecule. The PVP molecule was completely adsorbed on the surface of the hydrate nucleus, and some groups were embedded in the crystal nucleus, reduced the hydrate nucleus contact with water and methane molecules, and slowed down the growth of methane hydrate. In addition, PVP molecule would increase the surface curvature of methane hydrate. The hydrate growth would be affected by the Gibbs–Thomson effect [19,30,31,32], which also slows down the growth of hydrate.
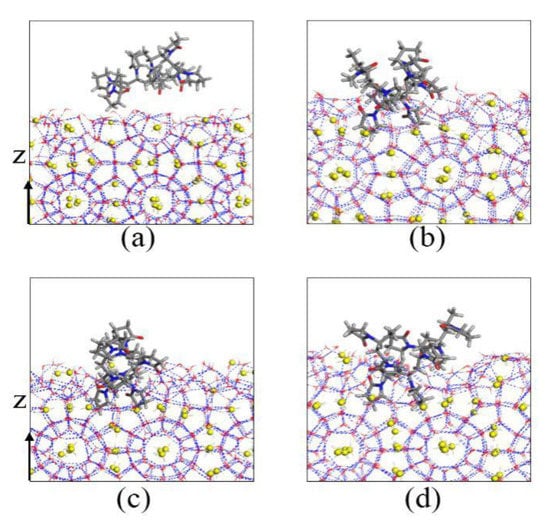
Figure 13.
Local amplification figures of PVP on the surface of hydrate nucleus: (a) 0 ns, (b) 10 ns, (c) 130 ns, and (d) 200 ns.
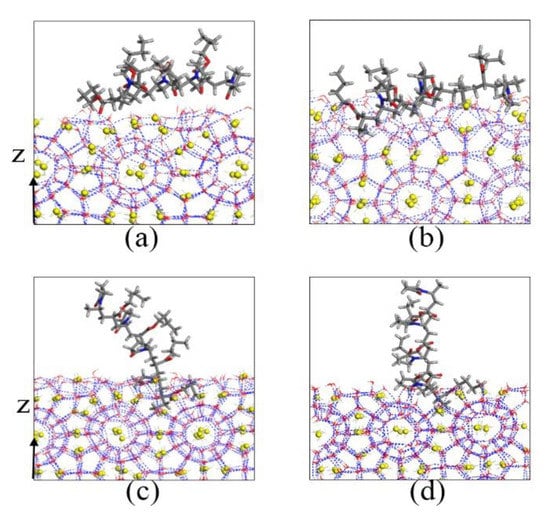
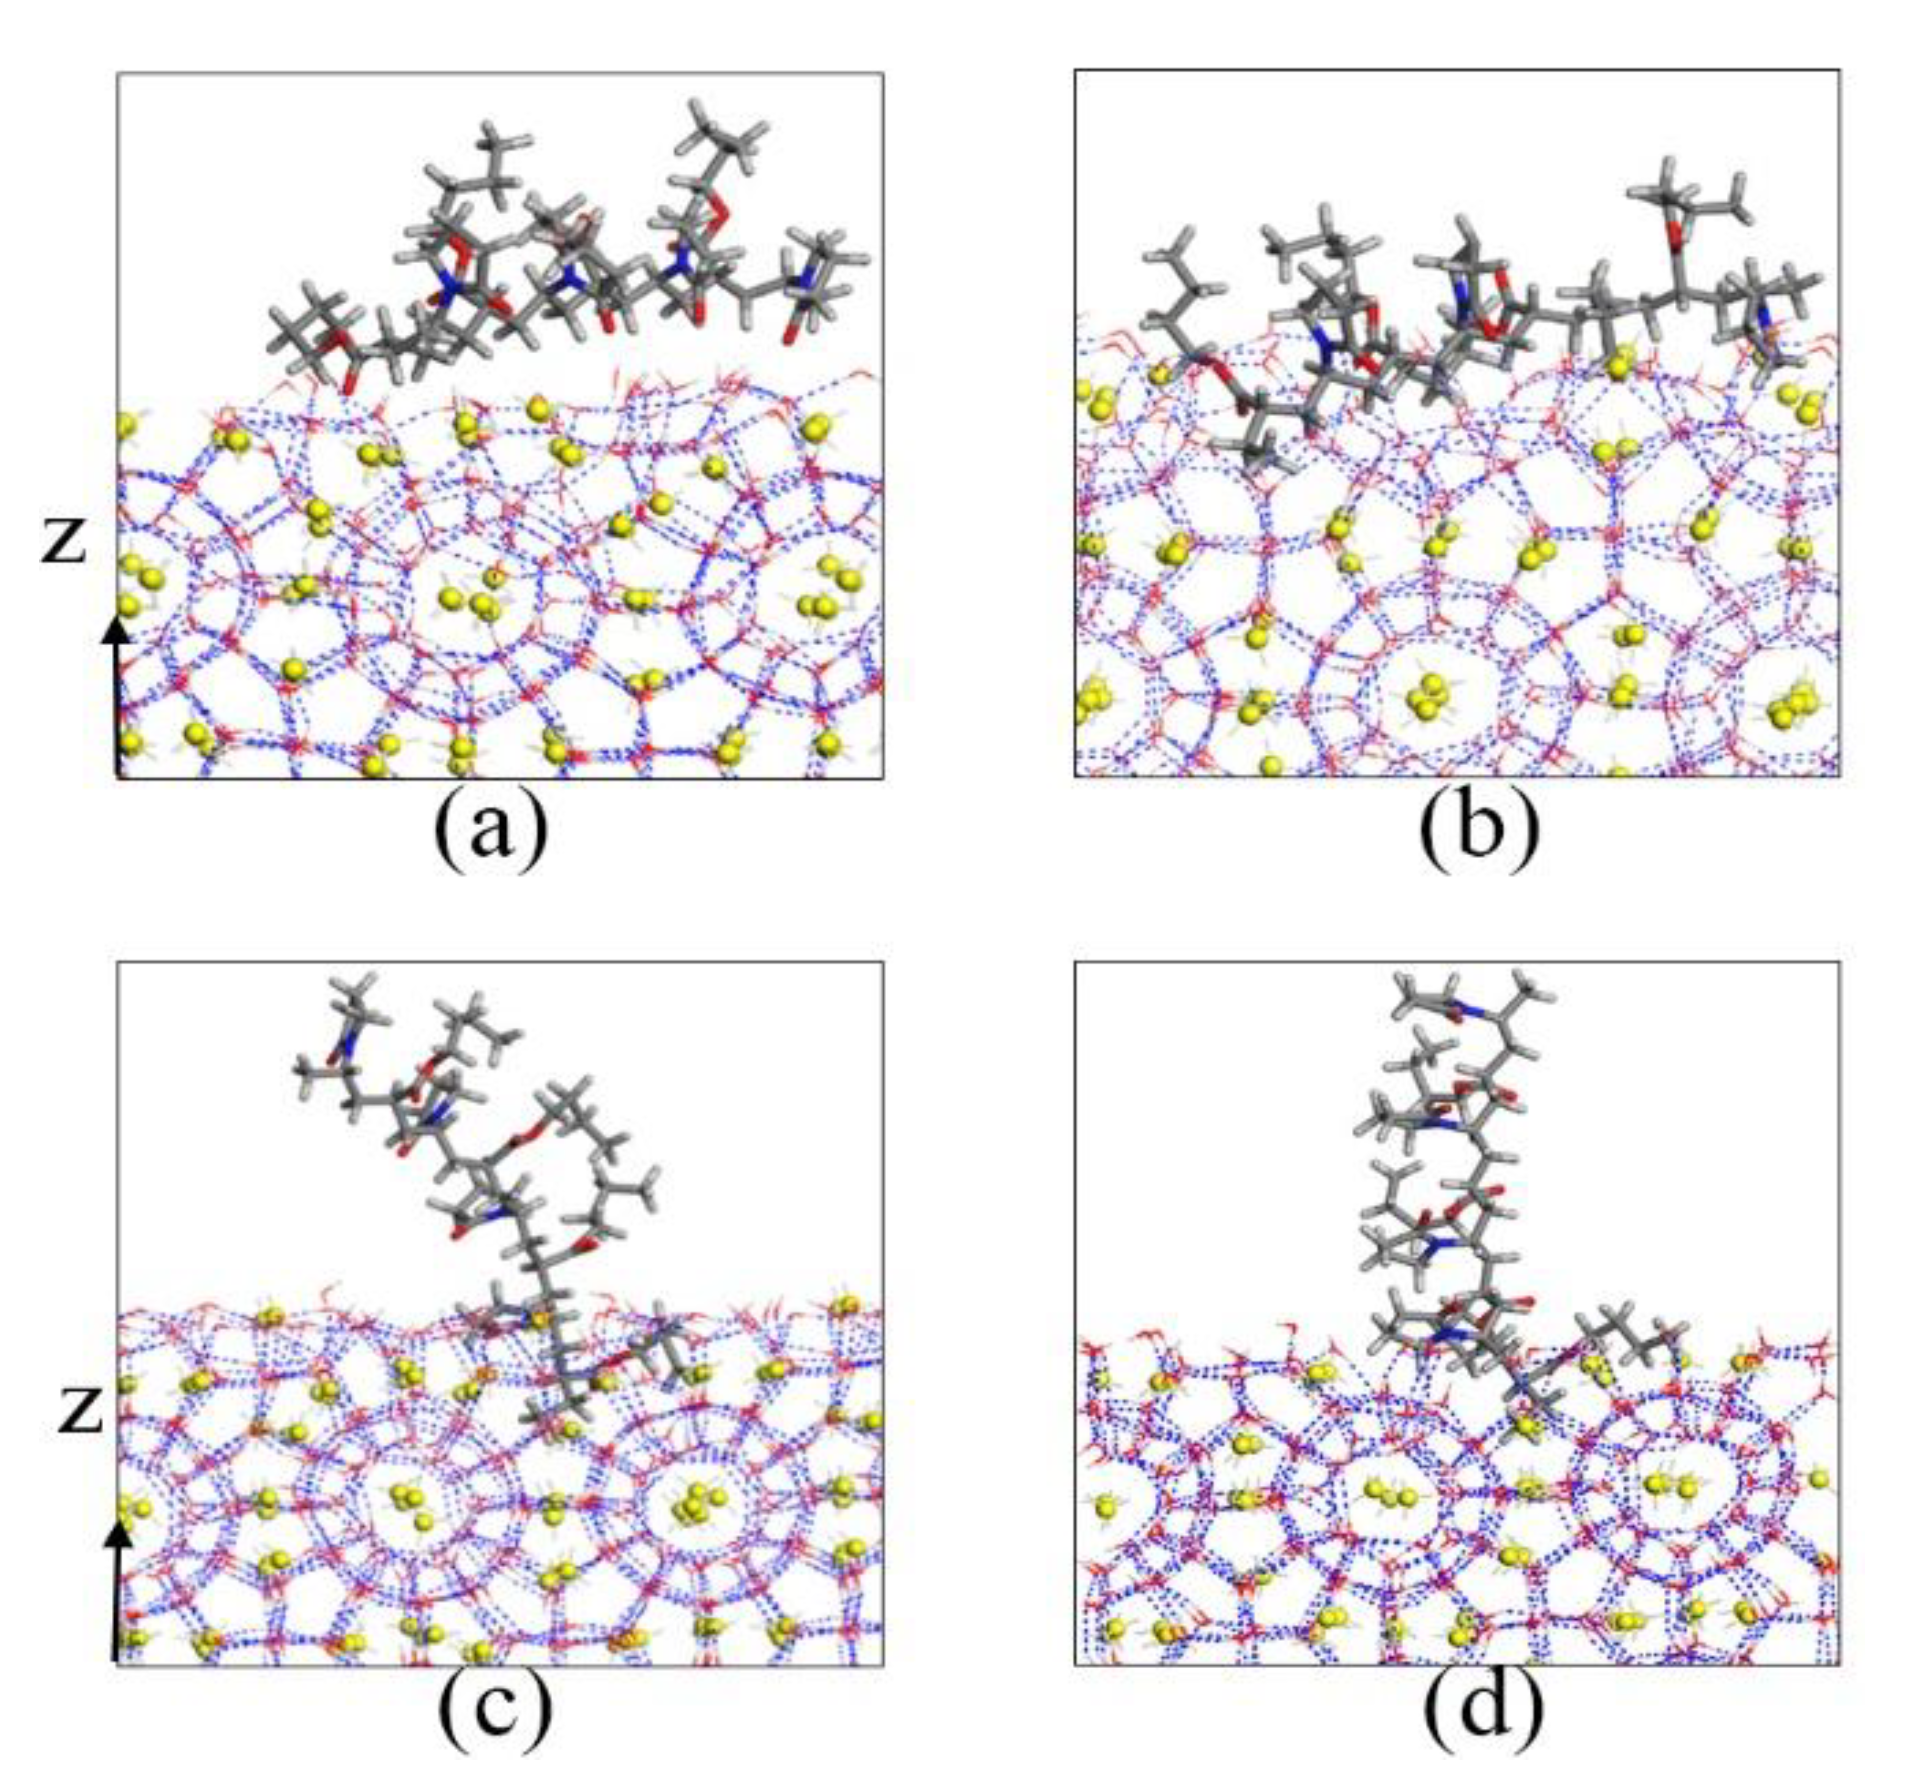
Figure 14.
Local amplification figures of PVP-A on the surface of hydrate nuclei: (a) 0 ns, (b) 10 ns, (c) 130 ns, and (d) 200 ns.
For the PVP-A-containing system, the PVP-A molecule was initially laid on the solid–liquid phase interface. The ester groups and pyrrolidone rings of the PVP-A molecule chain was adsorbed by the hydrate nuclei at 10 ns. The adsorbed ester groups and pyrrolidone rings were embedded in the hydrated semi-cage structure, while other groups of the PVP-A molecule were free in the liquid phase. Subsequently, the PVP-A molecule would adsorb vertically on the surface of hydrate, and only a small portion of groups of the PVP-A molecule adsorb on semi-cage hydrate structures. When PVP-A molecules are adsorbed on the surface of hydrate, the existence of PVP-A on the methane hydrate nucleus could obviously decrease the contact of hydrate nucleus with the surrounding water and methane molecules, and slowed down the growth of hydrate nucleus. Moreover, the increase of hydrate surface curvature and the Gibbs–Thomson effect caused by the PVP-A could also reduce the growth rate of methane hydrate. [19,30,31,32] Our simulation results show that the kinetic inhibitor molecules on the surface of the methane hydrate can inhibit the growth of methane hydrates better than the inhibitor molecule at the gas–liquid phase interface.
On the basis of above analysis, we found that PVP-A can inhibit the growth of methane hydrate better than PVP in gas–liquid phase separation state, and the initial position of the kinetic inhibitor molecule has great influence on the performance of the inhibitors. The inhibitory effect of KHIs at the solid-liquid phase interface is more obvious than that of the KHIs at the gas–liquid phase interface. In addition, when KHIs are located at the gas–liquid phase interface, increasing the contact area between the groups of the inhibitor molecule and methane is conducive to improving the inhibitory performance. When the KHIs are located at the solid–liquid phase interface, the inhibitor molecules could obviously reduce the hydrate nucleus contact with water and methane molecules and increase hydrate surface curvature. KHIs would then exhibit better inhibition performance.
4. Conclusions
In this paper, the effects of KHIs on the growth process of methane hydrate in gas–liquid phase separation state are studied by molecular dynamics simulation. Our result shows that PVP-A have a good inhibitory effect on methane hydrate growth under gas–liquid phase separation state. By comparing the inhibitory effect of inhibitor molecules on the growth of methane hydrate at gas–liquid phase interface and solid-liquid phase interface, we found the initial position of the inhibitors have great influence on the performance of the inhibitors. The inhibitory effect of KHIs at solid-liquid phase interface is better than that at the gas–liquid phase interface. When the KHIs are located at the gas–liquid phase interface, increasing the contact area between the groups of the inhibitor molecule and methane helps improve the inhibition performance. When the KHIs are located at solid-liquid phase interface, KHIs can inhibit the growth of the hydrate by decreasing the hydrate nucleus contact with water and methane molecules. The adsorption of KHI molecules on the surface of the nucleus also occupies the space, which leads to the increased surface curvature of methane hydrate and shows the Gibbs–Thomson effect. Due to the random distribution of the KHI molecules in the system, KHIs may act on multiple sites of the system to affect the growth of methane hydrate. Therefore, studying the effects of KHIs on the growth process of methane hydrate at different initial positions has certain practical significance for understanding the inhibition mechanism of KHIs.
Author Contributions
L.C. and L.W. contributed equally to this work; conceptualization, B.L. and Z.L.; methodology, L.C. and L.W.; software, L.C. and L.W.; validation, B.L., Z.L. and G.C.; formal analysis, L.C. and L.W.; investigation, L.C. and L.W.; resources, B.L. and G.C.; data curation, L.C. and L.W.; writing—original draft preparation, L.C. and L.W.; writing—review and editing, B.L. and Z.L.; visualization, Z.L.; supervision, B.L. and G.C; project administration, B.L.; funding acquisition, B.L.
Funding
This research was funded by the National Natural Science Foundation of China (21776301, 21908116) and the Science Foundation of China University of Petroleum, Beijing (NO. 2462018BJC004).
Acknowledgments
The financial supports received from the National Natural Science Foundation of China (21776301, 21908116) and the Science Foundation of China University of Petroleum, Beijing (NO. 2462018BJC004) are gratefully acknowledged.
Conflicts of Interest
The authors declare no conflict of interest.
References
- Kelland, M.A. A Review of kinetic hydrate inhibitors from an environmental perspective. Energy Fuels 2018, 32, 12001–12012. [Google Scholar] [CrossRef]
- JR, S.E. Fundamental principles and applications of natural gas hydrates. Nature 2003, 426, 353–359. [Google Scholar]
- Kelland, M.A. History of the development of low dosage hydrate inhibitors. Energy Fuels 2006, 20, 825–847. [Google Scholar] [CrossRef]
- Perrin, A.; Musa, O.M.; Steed, J.W. The chemistry of low dosage clathrate hydrate inhibitors. Chem. Soc. Rev. 2013, 42, 1996–2015. [Google Scholar] [CrossRef]
- Villano, L.D.; Kelland, M.A.; Miyake, G.M.; Chen, E.Y.X. Effect of polymer tacticity on the performance of poly (N,N-dialkylacrylamide) s as kinetic hydrate inhibitors. Energy Fuels 2010, 24, 2554–2562. [Google Scholar] [CrossRef]
- Ke, W.; Svartaas, T.M.; Kvaloy, J.T.; Kosberg, B.R. Inhibition-promotion: Dual effects of polyvinylpyrrolidone (PVP) on structure-II hydrate nucleation. Energy Fuels 2016, 30, 7646–7655. [Google Scholar] [CrossRef]
- Xiao, C.; Adidharma, H. Dual functionin hibitors for methane hydrate. Chem. Eng. Sci. 2009, 64, 1522–1527. [Google Scholar] [CrossRef]
- Ajiro, H.; Takemoto, Y.; Akashi, M.; Chua, P.C.; Kelland, M.A. Study of the kinetic hydrate inhibitor performance of a series of Poly (N-alkyl-N-vinylacetamide) s. Energy Fuels 2010, 24, 6400–6410. [Google Scholar] [CrossRef]
- Nakarit, C.; Kelland, M.A.; Liu, D.; Chen, E.Y.X. Cationic kinetic hydrate inhibitors and the effect on performance of incorporating cationic monomers into N-vinyl lactam copolymers. Chem. Eng. Sci. 2013, 102, 424–431. [Google Scholar] [CrossRef]
- Kelland, M.A.; Kvaestad, A.H.; Astad, E.L. Tetrahydrofuran hydrate crystal growth inhibition by trialkylamine oxides and synergism with the gas kinetic hydrate inhibitor poly (N-vinyl caprolactam). Energy Fuels 2012, 26, 4454–4464. [Google Scholar] [CrossRef]
- Pei, C.C.; Kelland, M.A. Tetra (iso-hexyl) ammonium bromide-the most powerful quaternary ammonium-based tetrahydrofuran crystal growth inhibitor and synergist with polyvinylcaprolactam kinetic gas hydrate inhibitor. Energy Fuels 2012, 26, 1160–1168. [Google Scholar]
- Reyes, F.T.; Kelland, M.A.; Kumar, N.; Jia, L. First investigation of the kinetic hydrate inhibition of a series of poly (β-peptoid) s on structure II gas hydrate, including the comparison of block and random copolymers. Energy Fuels 2015, 29, 695–701. [Google Scholar] [CrossRef]
- Kelland, M.A.; Abrahamsen, E.; Ajiro, H.; Akashi, M. Kinetic hydrate inhibition with N-alkyl-N-vinylformamide polymers: Comparison of polymers to n-propyl and isopropyl groups. Energy Fuels 2015, 29, 4941–4946. [Google Scholar] [CrossRef]
- Long, J.; Lederhos, J.; Sum, A.; Christiansen, R.L.; Sloan, E.D. Kinetic inhibitors of natural gas hydrates. In Proceedings of the 73rd Annual GPA Convention, New Orleans, LA, USA, 7–9 March 1994. [Google Scholar]
- Qin, H.B.; Sun, Z.F.; Wang, X.Q.; Yang, J.L.; Sun, C.Y.; Liu, B.; Yang, L.Y.; Chen, G.J. Synthesis and evaluation of two new kinetic hydrate inhibitors. Energy Fuels 2015, 29, 7135–7141. [Google Scholar] [CrossRef]
- Qin, H.B.; Sun, C.Y.; Sun, Z.F.; Liu, B.; Chen, G.J. Relationship between the interfacial tension and inhibition performance of hydrate inhibitors. Chem. Eng. Sci. 2016, 148, 182–189. [Google Scholar] [CrossRef]
- Oluwunmi, P.A.; Finney, A.R.; Rodger, P.M. Molecular dynamics screening for new kinetic inhibitors of methane hydrate. Can. J. Chem. 2015, 93, 1043–1049. [Google Scholar] [CrossRef]
- Yagasaki, T.; Matsumoto, M.; Tanaka, H. Adsorption mechanism of inhibitor and guest molecules on the surface of gas hydrates. J. Am. Chem. Soc. 2015, 137, 12079–12085. [Google Scholar] [CrossRef]
- Yagasaki, T.; Matsumoto, M.; Tanaka, H. Adsorption of kinetic hydrate inhibitors on growing surfaces: A molecular dynamics study. J. Phys. Chem. B. 2018, 122, 3396–3406. [Google Scholar] [CrossRef]
- Li, Z.; Jiang, F.; Qin, H.B.; Liu, B.; Sun, C.Y.; Chen, G.J. Molecular dynamics method to simulate the process of hydrate growth in the presence/absence of KHIs. Chem. Eng. Sci. 2017, 164, 307–312. [Google Scholar] [CrossRef]
- Li, Z.; Liao, K.; Qin, H.B.; Chen, J.L.; Ren, L.L.; Li, F.G.; Zhang, X.R.; Liu, B.; Chen, G.J. The gas-adsorption mechanism of kinetic hydrate inhibitors. AIChE J. 2019, 65, e16681. [Google Scholar] [CrossRef]
- Plimpton, S. Fast parallel algorithms for short-range molecular dynamics. J. Comput. Phys. 1995, 117, 1–19. [Google Scholar] [CrossRef]
- Dauber-Osguthorpe, P.; Roberts, V.A.; Osguthorpe, D.J.; Wolff, J.; Genest, M.; Hagler, A.T. Structure and energetics of ligand binding to proteins: Escherichia coli dihydrofolate reductase-trimethoprim, a drug-receptor system. Proteins: Struct. Funct. Bioinform. 2010, 4, 31–47. [Google Scholar] [CrossRef] [PubMed]
- Jorgensen, W.L.; Maxwell, D.S.; Tirado-Rives, J. Development and testing of the OPLS all-atom force field on conformational energetics and properties of organic liquids. J. Am. Chem. Soc. 1996, 118, 11225–11236. [Google Scholar] [CrossRef]
- Jorgensen, W.L.; Chandrasekhar, J.; Madura, J.D.; Impey, R.W.; Klein, M.L. Comparison of simple potential functions for simulating liquid water. J. Chem. Phys. 1983, 79, 926–936. [Google Scholar] [CrossRef]
- Cao, Z.T.; Tester, J.W.; Sparks, K.A.; Trout, B.L. Molecular computations using robust hydrocarbon-water potentials for predicting gas hydrate phase equilibria. J. Phys. Chem. B 2001, 105, 10950–10960. [Google Scholar] [CrossRef]
- Cao, Z.T.; Tester, J.W.; Trout, B.L. Computation of the methane-water potential energy hypersurface via ab initio methods. J. Chem. Phys. 2001, 115, 2550–2559. [Google Scholar] [CrossRef]
- Matsumoto, M.; Baba, A.; Ohmine, I. Topological building blocks of hydrogen bond network in water. J. Chem. Phys. 2007, 127, 134504. [Google Scholar] [CrossRef]
- Jacobson, L.C.; Hujo, W.; Molinero, V. Thermodynamic stability and growth of guest-free clathrate hydrates: A low-density crystal phase of water. J. Phys. Chem. B 2009, 113, 10298–10307. [Google Scholar] [CrossRef]
- Nada, H.; Furukawa, Y. Antifreeze proteins: Computer simulation studies on the mechanism of ice growth inhibition. Polym. J. 2012, 44, 690–698. [Google Scholar] [CrossRef]
- Raymond, J.A.; DeVries, A.L. Adsorption inhibition as a mechanism of freezing resistance in polar fishes. Proc. Natl. Acad. Sci. USA 1977, 74, 2589–2593. [Google Scholar] [CrossRef]
- Shtukenberg, A.G.; Ward, M.D.; Kahr, B. Crystal growth with macromolecular additives. Chem. Rev. 2017, 117, 14042–14090. [Google Scholar] [CrossRef] [PubMed]


© 2019 by the authors. Licensee MDPI, Basel, Switzerland. This article is an open access article distributed under the terms and conditions of the Creative Commons Attribution (CC BY) license (http://creativecommons.org/licenses/by/4.0/).