Article

Impact of Sustainable Financial and Economic Development on Greenhouse Gas Emission in the Developed and Converging Economies

1
Faculty of Economics and Management, University of Szczecin, 71-101 Szczecin, Poland
2
Collegium of Economic Analysis, SGH Warsaw School of Economics, 02-554 Warsaw, Poland
3
Institute of Economics and Finance, The John Paul II Catholic University of Lublin, 20-950 Lublin, Poland
*
Author to whom correspondence should be addressed.
Energies 2019, 12(23), 4514; https://doi.org/10.3390/en12234514
Submission received: 9 October 2019 / Revised: 6 November 2019 / Accepted: 24 November 2019 / Published: 27 November 2019
(This article belongs to the Special Issue Economic Development and Energy Policy)

Abstract

:
Several studies have examined the relationship between environmental performance and economic development. However, most of them did not take sustainable development and financial development into account. The study argues that sustainable financial and economic development contributes to reducing greenhouse gas emissions. We use the panel data regression model to capture the relationship between greenhouse gas emission and sustainable economic and financial development. The panel data refers to the period of 2007–2017. The EU 25 countries were analysed. The results show that the relationship between sustainable financial development and environmental degradation is more relevant for converging economies than developed countries. We found that the variable “energy productivity” has the strongest impact on greenhouse gas emissions for both country groups (converging and developed); however, it increases for developed countries and it decreases the greenhouse gas emissions for converging economies. We also found that environmental taxes are an efficient instrument that mitigates greenhouse gas emissions, especially in developed countries group.

Graphical Abstract

1. Introduction

Research regarding the consequences of economic growth in the context of its impact on the environment (Environmental Kuznets curve) has been conducted for many years [1]. The importance of these studies is increasing in the context of the growing impact of environmental risks and the impact of ESG factors (Environmental, Social, Governance) on financial performance [2]. The influence of ESG factors on finance and the relationships between financial and economic development, as supported by research results, has highlighted a previously unrecognized space for research. There are questions regarding the relationship between financial and economic development and environmental factors in the context of environmental degradation, in particular growing air pollution and smog. The results of studies on the dependencies between environmental degradation and development and economic growth are not conclusive. Some authors, like Beckerman [3], report a positive impact of economic growth on the environment and other authors argue that this impact is rather negative [4,5]. There is also a group of authors that points to the limitations in research methodologies or ignorance of the presence of asymmetries or nonlinearity in macroeconomic variables that may impact the general conclusions and provide biased empirical results [6]. Therefore, there is a research gap that requires in-depth analysis. This paper tries to fill this gap by including “sustainability” in the research regarding economic and financial development and their impact on greenhouse gas emissions. This study is one of the first to incorporate variables from Agenda 2030 into research on the relationships between economic and financial development and environmental degradation. Research that has been conducted so far [7,8,9] has not taken the aspect of sustainability into account.
This study aims to verify the hypothesis that sustainable financial and economic development contributes to reducing greenhouse gas emissions. We assume that existing research on the association between financial and economic development and greenhouse gas emissions predominantly ignores the crucial role of sustainable finance. This paper extends this research perspective and incorporates sustainability in regression models that analyze the relationship between sustainable financial and economic development and greenhouse gas emissions.
We also take into account the variable final energy consumption in households (as an additional parameter) while examining the relationship between greenhouse gas emissions and sustainable economic and financial development to verify that an analysis based only on greenhouse gas emissions is not flawed.
The objectives of the study are:
  • to identify disparities between European Union (EU) countries in the scope of financial and economic development and greenhouse gas emissions;
  • to determine the differences between developed and converging economies in the field of greenhouse gas emissions and sustainable financial and economic development and provide policy recommendations;
  • to diagnose if, when, and how sustainable finance matters for the amount of greenhouse gas emissions.
The results of the study may be useful to the governments of a particular group of countries (converging and developing countries in the process of selecting instruments for the execution of environmental regulations (e.g., environmental taxes).
The paper is organized, as follows: an introduction is been presented in Section 1. Section 2 contains a literature review, Section 3 discusses the materials and method, and Section 4 presents the research results. Section 5 presents discussion and Section 6 includes the conclusion and recommendations.

2. Review of Literature (Background)

The relationship between finance and economic growth has long been the subject of scientific discovery and research. When reviewing the literature, Levine [10] points to two important conclusions that stem from the literature, namely that countries with better functioning banks and financial markets tend to grow faster, while the types of financial market models that these countries adopt are irrelevant. Levine also points out that more efficient financial systems help enterprises to overcome barriers to accessing external financing and ensuring their market expansion [10]. Arestis [11] draws attention to the important role of banks and services in the financial sector in creating economic growth. Acemoğlu et al. [12] note the relationship between the activities that are undertaken by financial intermediaries in encouraging market participants to accumulate savings, their multiplication through appropriate asset management, and the use of surpluses obtained for finance development. Schumpeter [13] and Todaro and Smith [14] indicate the role of innovation (technological and financial) as an important factor in stimulating growth and development. Schumpeter [13] draws attention to the role of credit and its significance in the development of enterprises. Levine [15] emphasizes that the financial solutions that contribute to the reduction of transaction costs have a positive impact on technological innovation and the growth that they determine. In the context of the impact on innovation, it is also pointed out that more developed financial systems increase the likelihood of successful pro-innovation activities and thus stimulate their positive impact on growth. At the same time, it should be remembered that there is also reverse regularity—i.e., distress within the financial system determines the reduction of the level of growth as a result of a decrease in innovation’s growth rate. More developed financial systems also remain positively correlated with the improved productivity of production. In such systems, the selection of entrepreneurs and projects to be financed with the use of external resources is conditioned by the quality of their operation. At the same time, complex financial systems provide entrepreneurs with a wide range of instruments for reducing the risks that are associated with their operations and to finance highly innovative solutions [16].
The financing of innovation and the financial market also combines the aspects of their impact on the environment. In particular, the relationship between CO2 emissions and financial development is examined. The research results that are related to the impact of financial development on CO2 emissions are mixed. Some studies indicate that financial development positively affects (improves) environmental quality [17,18,19]. According to another group of researchers [7,20,21], financial development decreases environmental quality, and other studies [22] indicate the lack of statistical significance between the variables. Abbasi and Riaz [23], based on research carried out for Pakistan, argue that the CO2 emissions increase as per capita income increase and conclude that financial development does not aid in mitigating CO2 emissions; rather, financial development increases emissions. Tamazian et al. [7] explain the reasons why a developed financial market increases CO2 emissions and shrinks carbon dioxide emissions. Energy efficient technologies that positively impact the reduction of carbon dioxide emissions require regular financing that only a developed financial market can provide. On the other hand, a developed financial market reduces the costs of financing, which allows for easier access to financing for new projects that are energy-consuming, stimulates the demand for energy, and, finally, increases CO2 emissions [6]. This literature review points out the crucial role of the changes taking place in contemporary financial markets. The size and structure of the financial sector is an important change that accompanies growth, provides investments that are necessary for growth, and also relates to energy savings and the stimulation of green technology [23]. Environmental quality also positively influences these institutional factors. Lower CO2 emissions are noticeable in countries with strong and efficient institutions that are responsible for environmental protection [8]. The relationship between financial development and Foreign Direct Investment (FDI) is another research problem discussed in the literature. Frankel & Romer [24] state that financial development attracts FDI that are usually allocated in the countries with a developed financial market and affect the development of innovation, including those that positively impact on environmental quality. On the other hand, the financial market provides financing for increased household consumption through financial intermediaries, which results in the purchase of equipment increasing energy consumption and increased carbon dioxide emission [25].
The existing body of literature does not include the role of sustainable finance, especially sustainable financial systems in influencing financial and economic development and environmental quality. The Principles Responsible Investment Initiative [26] (PRI) defines a sustainable financial system as a resilient system that contributes to the needs of a society by supporting sustainable and equitable economies, while also protecting the natural environment [26]. Sustainable finance is a wider category that refers to all types of finance while considering financial, social, and environmental returns in combination [27]. In sum, sustainable finance is related to all types of finance that soften negative externalities. The increasing costs of environmental degradation as a consequence of negative externalities indicate the need for long term financing to revitalize degraded areas and change consumers’ behaviours towards green consumerism. From this point of view, there is a crucial role for sustainable finance and sustainable financial systems that may impact environmental quality (inter alia, green financial products, and environmental taxes).
Table A1 in Appendix A to this article provides a synthetic list of the considered literature by author(s), year, title, variables considered for the study, research methodology, results determined, and the implications of the study.

3. Materials and Methods

The article attempts to assess the impact of sustainable economic and financial development on greenhouse gas emissions. Greenhouse gas emissions (GGE) were used as an explanatory variable representing environmental degradation, based on the literature review [7,9]. Namely, we used the greenhouse gas (CO2, N2O in CO2 equivalent, CH4 in CO2 equivalent) emissions in kilograms per capita indicator from the Eurostat database. However, we also constructed models where the dependent variable is based on both GGE and the final energy consumption by households (FEC) due to the possible limitations of using greenhouse gases as the sole variable for describing environmental degradation (e.g., diesel gate as an example of data manipulation). The FEC measure is also widely used in the literature and it shows significant correlations with economic growth and financial development [28,29]. In our research, FEC is defined as the final energy consumption in households per capita in equivalent kg of oil and it is extracted from the Eurostat database.
The explanatory variables were divided into three groups, distinguishing the variables that represent economic development, financial development, and environmental data. This approach is used in the literature and related work. The original contribution of the study consists of including variables that represent sustainability in the analysis, which was found in both the economic development and financial development groups. We focused on the sustainable finance perspective. In our study, we tackle the role of sustainable public finance in reducing greenhouse gas emissions. We assume the relationship between sustainable public finance and social and environmental sustainability. Sustainable public finance is considered from the perspective of its mitigating effect on negative externalities and, in this context, it is represented by environmental taxes, public expenditures on R&D, and redistribution policies. Initially, 30 explanatory variables were considered for an analysis that was based on the Agenda 2030 framework, the climate and environmental Eurostat datasets, and financial and economic development indicators: 10 from the scope of financial development, 11 from the scope of economic development, and nine depicting countries’ environmental characteristics. The initial selection was based on the research that is presented in Section 1 of this article. All of the variables came from the Eurostat database for the period 2007–2017 to ensure the full integrity and comparability of the data. The data for EU 25 countries were collected from a group consisting of Austria, Belgium, Bulgaria, Croatia, the Czech Republic, Denmark, Estonia, Finland, France, Germany, Greece, Hungary, Ireland, Italy, Latvia, Lithuania, the Netherlands, Poland, Portugal, Romania, Slovenia, Slovakia, Spain, Sweden, and the United Kingdom. For the selected countries and years, not all data were available, and hence the test sample was unbalanced.
The analysis is based on the panel data regression functions. It is a prevailing econometric approach in this category of research. Firstly, it was adopted in the analyses of the relationship between financial sector development and real economy performance (see e.g., King & Levine [16], Rajan & Zingales [30], and a broad recent review of research in Allen et al. [31]). Subsequently, panel data analysis was used in the research that enhanced the earlier studies by the problem of interdependence between economic development and environmental as well as energy policy phenomena—see e.g., Tamazian et al. [7] and Talukdar & Meisner [32]. In our research, we follow this econometric approach. The regression function has a form, as follows:
GGEit = α + βkCit + βlEit + βmFit + vi + εit
where:
  • GGEit—the dependent variable (the greenhouse gases (CO2, N2O in CO2 equivalent, CH4 in CO2 equivalent) emissions in kilograms per capita);
  • Cit—set of explanatory variables (k variables) describing countries’ environmental characteristics;
  • Eit—set of explanatory variables (l variables) describing countries’ economic development indicators;
  • Fit—set of explanatory variables (m variables) describing countries’ sustainable financial development indicators;
  • i—the cross-sectional dimension, representing individual countries analysed (from 1 to the N-th country); i ∈ {1, N};
  • t—the time dimension—annual data from 2007 to 2017;
  • α—the intercept;
  • β—the structural parameters for respective sets of explanatory variables (1, …, k; 1, …, l; 1, …, m);
  • vi—error term representing time invariant unobserved characteristics;
  • εit—random error term.
Following Tamazian et al. [7] we also test the non-linear i.e., U-shaped effects. We extend this research by checking the non-linearity of all explanatory variables. However, it is important to notice that, in fact, we do not have unrestricted domain, as the analysed values are located within the specific ranges. Thus, the pure U-shaped effects cannot emerge and, in practice, we check the existence of non-linear effects in a shape of (monotonic) convexity or concavity.
We use fixed effects specification for individual i. The random effects specification was not feasible due to insufficient degrees of freedom in these models. However, the carried-out analysis for simplified models with random effects and subsequent Hausman tests indicated that specification with the fixed effects is more appropriate (the GLS estimators were not consistent).
The econometric modelling was carried out with a ‘from general to specific’ approach that was based on the achieving significance of individual variables, minimizing the information criteria (Akaike’s & Schwarz’s) as well as ensuring favourable results of joint tests on named regressors and no autocorrelation of error terms. The calculations were carried out with the Gretl software, ver. 1.9.90.
Finally, seven explanatory variables were implemented to the model (see Appendix B with references to related research supporting the choice of these variables for modelling environmental degradation): Employment in high- and medium-high technology manufacturing sectors and knowledge-intensive service sectors (E1); Purchasing power adjusted GDP per capita in EUR (E3); Investment share of GDP (E2); Inequality of income distribution (E4); Gross domestic expenditure on R&D as % of GDP (F1); Shares of environmental taxes in total tax revenues (F2); and, Energy productivity (C1).
The analysed function has a following form:
GGEit = α + βkCit + βkC2it + βlEit + βlE2it + βmFit + βmF2it + vi + εit
where:
  • GGEit—the greenhouse gases (CO2, N2O in CO2 equivalent, CH4 in CO2 equivalent) emissions in kilograms per capita;
  • Cit—energy productivity (measured as the amount of economic output produced per unit of gross available energy);
  • Eit—set of explanatory variables consisting of employment in high- and medium-high technology manufacturing sectors and knowledge-intensive service sectors; purchasing power adjusted GDP per capita; Investment share of GDP; inequality of income distribution (S80/S20 income quintile share ratio);
  • Fit—set of explanatory variables consisting of gross domestic expenditure on R&D as % of GDP, shares of environmental taxes in total tax revenues;
  • i—the cross-sectional dimension, representing individual countries analysed (from 1 to the N-th country); i ∈ {1, N};
  • t—the time dimension—annual data from 2007 to 2017;
  • α—the intercept;
  • β—the structural parameters for respective sets of explanatory variables (1, …, k; 1, …, l; 1, …, m);
  • vi—error term representing time invariant unobserved characteristics;
  • εit—random error term.
The function from Equation (2) was used in the estimation of Model 1 and Model 2. Section 3 presents the results.
Table A2, Appendix B presents a list of the variables implemented to the models with references to relevant research supporting their inclusion in the designed models.
We also designed the corresponding Models 3 and 4 with the dependent variable designed as a combination of GGE and FEC variables to control the modelling results against possible data discrepancy of GGE. For this, we normalized the GGE and FEC data and defined the new dependent variable GGE_FEC for each analysed country, as:
G G E _ F E C i t = 0.75 G G E i t G G E ¯ σ ( G G E i t ) + 0.25 F E C i t F E C ¯ σ ( F E C i t )
where:
  • GGEit—the greenhouse gases (CO2, N2O in CO2 equivalent, CH4 in CO2 equivalent) emissions in kilograms per capita;
  • G G E ¯ —average value of GGEit variable for each country;
  • σ(GGEit)—standard deviation of GGEit variable for each country
  • FECit—final energy consumption in households per capita in kg of oil equivalent;
  • F E C ¯ —average value of FECit variable for each country;
  • σ(FECit)—standard deviation of FECit variable for each country;
  • i—the cross-sectional dimension, representing individual countries analysed (from 1 to the N-th country); i ∈ {1, N};
  • t—the time dimension—annual data from 2007 to 2017.
The explanatory variables and a functional form of the Models 3 and 4 are the same as in the Equation (2).
The Models 1–4 that are presented in Section 3 and in Appendix C have very solid fitness characteristics, along with highly significant statistical estimations of structural parameters. In addition, the contribution of all the picked explanatory variables to the dependent variable theoretical values is non-negligible (verified for a synthetic country represented by the mean observations).

4. Results

A preliminary analysis of the data for the EU 25 countries confirmed the large heterogeneity among the EU countries regarding the investigated phenomena. For example, over the last decade, richer EU countries managed to significantly decrease their per capita greenhouse emissions, which was opposite the ambiguous trends in the EU’s converging economies (see Table 1). Remarkable differences between the EU countries may also be observed with the ‘Energy productivity’ variable (see Table 2), which is twice as high in Western European countries than in Central-Eastern European countries. Similar differences may be spotted for the R&D expenditure indicators. The general results of the study are as follows:
  • for both groups of countries, the impact of economic and financial development on greenhouse gas emissions is confirmed;
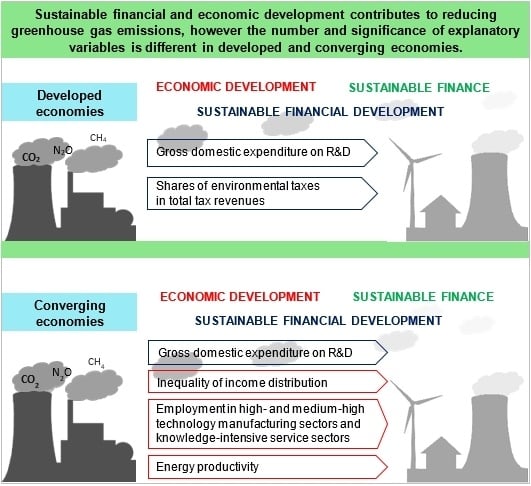
  • the patterns in the field of greenhouse gas emissions and explanatory variables vary between both groups of the countries in the scope of their impact directions (a drop or increase) and the number and significance of their explanatory variables (more variables explain the impact in converging economies case);
  • the dependencies between economic and financial development are much stronger for the group of converging economies than those of the developed one;
  • energy productivity has an impact on the greenhouse gas emissions in both groups of countries (a drop-in emission for converging economies, and for developed economies, an increase in emissions);
  • gross domestic expenditures on R&D and shares of environmental taxes in total tax revenues are two variables that have the strongest impact on reducing greenhouse gas emissions in developed countries;
  • employment in high- and medium-high technology manufacturing sectors and knowledge-intensive service sectors; inequality of income distribution (income quintile share ratio); gross domestic expenditure on R&D; and, energy productivity are four variables responsible for reducing greenhouse gas emissions in converging economies;
  • sustainable finance variables (Shares of environmental taxes in total tax revenues, gross domestic expenditure on R&D, inequality of income distribution) matter for both groups of countries, but the impact of the inequality of income distribution is confirmed only for converging economies.
Table 1, Table 2, Table 3, Table 4, Table 5 and Table 6 present examples of country differences for the dependent variables and key explanatory variables. Consequently, two groups of countries have been distinguished, for which regression models have been developed. The first group of countries consists of the EU converging economies from Central-Eastern Europe (CEE) i.e., the Visegrad Four (Poland, the Czech Republic, the Slovak Republic, and Hungary), the Baltic States (Estonia, Latvia, and Lithuania), and Bulgaria, Romania. The second analysed group are Western European (WE) developed countries that are represented by the largest emitters of greenhouse gases in nominal terms in the EU i.e., Germany, France, United Kingdom, Italy, Spain, and the Netherlands.
The analysis shows that different patterns were observed in both groups of countries in the field of greenhouse gas emissions and explanatory variables. It was important to check whether the variables representing the sustainable finance affect the volume of emissions and thus whether the financial system may affect the emissions from the point of view of the objective of the study. The purpose of the study was positively verified for the group of converging economies for which the dependencies between economic and financial development are much stronger than for the group of developed countries. Table 7 presents model 1 for converging economies (CEE). Table 8 presents model 2 for developed economies (WE). Contribution of individual variables to the explanation of dependent variable in both models is presented in Table 9 and Table 10.
Appendix C presents the supplementary models with a dependent variable that is composed of both GGE and FEC (Models 3 and 4). They confirmed the regression results from Model 1 and Model 2. We will discuss the findings of our research based on the Models 1 and 2 in the subsequent part of the paper since the dependent variable in Models 1 and 2 is straightforward in interpretation (GGE is a real measured data, widely used in research and not a subjective indicator as the dependent variable is in Models 3 and 4).
The results of the presented models indicate a number of differences in the profiles of developed and converging economies within the EU, which may imply a selection of different policies for these groups to tackle environmental degradation. Two of the analysed variables contribute to reducing greenhouse gas emissions (GGE) in the case of developed countries: Gross domestic expenditure on R&D (F1) and Shares of environmental taxes in total tax revenues (F2) (see Table 8). In the case of converging economies, the factors contributing to GGE reduction consist of four variables: Employment in high and medium-high technology manufacturing sectors and knowledge-intensive service sectors (E1), Inequality of income distribution (E4), Gross domestic expenditure on R&D (F1), and Energy productivity (C1) (see Table 7).
Gross domestic expenditures on R&D contributed to the GGE reduction in both groups of countries, starting with the similarities revealed by the models, which confirmed the findings of other research on EU countries (see Lapinskienė et al.) [33]. Expenditures on R&D in the field of environmental protection usually concern the financing of modern solutions and technologies and, thus, they help to reduce the negative impact of industry on the environment. Consequently, they indirectly reduce gas emissions to the atmosphere, as well as the amount of industrial pollution. As presented in Table 4, these expenditures are much larger in WE countries than in CEE countries. Models 1 and 2 (see Table 7 and Table 8) reflect this difference. Although the F1 variable is significant in both of the models, it contributes only 3% to the model depicting GGE behaviour for the converging economies (compare Table 9 and Table 10).
A similar situation occurs with the Investment share in GDP variables (E2). GDP is positively correlated with an increase in GGE for both groups of countries. However, in CEE countries, GDP’s contribution to the model amounts to only 4%, while it amounts to a remarkable 17% in WE countries. This can be partly explained by the fact that the E2 variable in WE countries acts as a proxy for ‘economic development’ variables (namely E3, purchasing power adjusted GDP per capita) which turned out to be insignificant. Correspondingly, in CEE countries, the E2 variable’s impact is relatively limited, as it is supplemented by the E3 variable, which contributes 24% to Model 1 and it has the same impact direction. These findings are in line with those of several other studies, which showed that there is a positive relationship between economic growth or output and energy consumption in converging economies, which indirectly reflects the GGE variable (see Kumar et al. [34], Kumar et al. [35], Rafindadi and Ozturk [29], and Malik & Masih [36]). Likewise, extensive research by Chang [28] on 53 countries showed that the negative effects of rising income (GDP per capita) on per capita energy consumption are not identifiable for the most affluent countries.
This study revealed that this problem can be tackled with some socio-economic policies, although economic growth does not solve the issue of environmental degradation in converging economies (confirming the proposition of the environmental Kuznets curve (see also for example Musolesi et al. [37], Piaggio and Padilla [38], and the broad review in Tiba and Omri [39]). Firstly, ‘Inequality of income distribution’ (calculated as the ratio of the total income received by the 20% of the population with the highest income to the income received by the 20% of the population with the lowest income) proved to be an explanatory variable with impact on the reduction of greenhouse gas emissions in converging economies. In these countries, the level of income inequality is higher than that in developed countries. Levelling income inequalities contributes to rising expectations regarding improved living standards and the availability of public goods (in line with the Wagner law), including the curbing of negative externalities (emissions, smog, etc.). It is also associated with a growing demand in industry for newer and cleaner technologies. Secondly, the growing share of employment in economic sectors related to knowledge and innovation is conducive to a low-carbon economy, which is largely initiated by advanced technologies that support the development of environmentally-friendly products and services, and it is an important variable for converging economies in the context of GGE reduction. It enables the transformation and modernization processes in the economy aiming at building industries that are based on innovative solutions and knowledge.
The models showed different behaviors in the converging and developed economies of two important variables: ‘Shares of environmental taxes in total tax revenues’ and ‘Energy Productivity’. Environmental taxes proved to be an effective policy instrument in developed economies in curbing GGE (e.g., Lin and Li [40]). The United Kingdom is a good example in this context, where a carbon tax has prompted electric utilities to switch away from coal. As a result, greenhouse gas emissions in the United Kingdom have fallen to their lowest level since 1890 [41]. However, this tendency occurs for well-established tax schemes, and the relationship between GGE and environmental taxation remains positive below some threshold levels (see Aydin and Esen [42]), which is also the case in this study on CEE countries. Regional country interdependencies in the marginal abatement costs of implemented policies also influences this asymmetric behaviour (see Morris et al.) [43].
‘Energy Productivity’ (measured as the amount of economic output produced per unit of gross available energy) is the key variable for countries that belong to both studied groups with an impact on the level of emissions, explaining over 30% of the model’s behaviour. This is because the largest source of greenhouse gas emissions from human activities is usually burning fossil fuels for electricity, heat, and transportation. This variable in developed countries causes an increase in greenhouse gas emissions, but it causes a decline in converging economies. This can be explained by the fact that, the volume of greenhouse gas emissions decreased in the analysed period 2007–2017 in developed countries and an opposite trend was observed in the converging economies. Carbon dioxide emissions account for approximately 80 percent of all greenhouse gas emissions in the European Union. Their level depends on climatic conditions, economic growth, population size, transport, and industrial activity, and, especially for CEE countries, available domestic energy sources are vastly dependent on mine fuels. Thus, in CEE countries, an increase in energy productivity is more likely to be associated with modernization activities, which include a shift away from fossil fuels that are characterized by high GGE values to renewable energy sources. It is worth noting that the shape of the nonlinear function for both groups of countries is similar to the shares of environmental taxes in total tax revenues and energy productivity (see Figure 1 and Figure 2).
Three variables were particularly important in converging economies when interpreting the results in terms of sustainable finance variables: shares of environmental taxes in total tax revenues, inequality of income distribution, and gross domestic expenditure on R&D. All of these variables are part of a sustainable public finance and sustainable public financial system. The models showed that the dependencies between the economic and financial development in CEE countries are much stronger than those for the group of developed countries.
On the basis of the obtained results, it can be concluded that incorporation of the sustainable finance instruments into the financial systems positively affects environmental sustainability, which has been verified in the form of environmental taxes (variable: Shares of environmental taxes in total tax revenues). At the same time, an effective redistribution system allows for overcoming income inequalities (variable: Inequality of income distribution). In developed countries, the redistribution systems are more effective, because these countries have a longer period of experience in remodelling and stabilizing their public finances, and they are also the countries with lower participation of the shadow economy and greater transparency of public finances. Therefore, the conclusion from the research conducted by Goldsmith [44], which argued that that economic policy should focus more on the legal system and legal regulations framework related to financial systems, rather than discussing which financial system is better (market oriented or bank oriented), still holds in the context of stimulating economic development, given the fact that the organization of the financial system and its design significantly affects the processes of growth and development, including sustainable development.

5. Discussion

Our study confirmed the link between financial development and sustainability. However, the patterns detected are different for the converging and developed country groups. The novelty of these research results refers to the role of sustainability. This study confirmed the shares of environmental taxes in total tax revenues, the gross domestic expenditure on R&D, and income inequality as statistically important variables for both group of countries. Environmental taxes are related to environmental sustainability, and income inequality refers to social sustainability. Gross domestic expenditure on R&D might be related to both sustainability pillars. All of the variables represent sustainable finance. Taxes and expenditures are parts of public budgets, and income inequality is the effect of income redistribution in a public finance system. Environmental taxes soften negative externalities, especially air pollution, and are an instrument of sustainable, green, public finance. Income inequality is a measure of the efficiency of sustainable public finance. Sustainable public finance softens the social exclusion problem by using mechanisms of income redistribution. Gross domestic expenditure on R&D is a sustainable public finance instrument in the context of reducing social exclusion and environmental degradation. The greater the sustainable public finance, the lower the income inequalities and the higher the share of environmental taxes and gross domestic expenditure on R&D.
We found a negative relationship between the shares of environmental taxes in the total tax revenues and greenhouse gas emissions for developed economies. Environmental sustainability benefits from environmental taxation, because environmental taxation reduces greenhouse gas emissions in developed countries and improves environmental performance. Income inequality matters for converging economies, as the public finance system in this country group is less sustainable when compared to that of developed economies, and social transfer allocation is not effective enough. In developed economies, the redistribution mechanism in the public finance system is more effective. The key point rests in understanding the link between income inequality and economic growth. Income inequalities are a crucial obstacle for economic growth, and economic growth causes negative externalities (greenhouse gases), which affect environmental degradation. This explains the different patterns for emerging and developed economies. Finally, Gross domestic expenditure on R&D is an effective instrument for sustainable public finance, especially sustainable fiscal policy. Gross domestic expenditure on R&D stimulates eco innovations that are responsible for the mitigation of environmental degradation and greenhouse gas emissions. Sustainable finance systems (public and market) are in progress in converging economies, and they are well developed in developed economies. This is the reason why environmental taxation matters more in developed economies. In converging economies, environmental taxation is at an early stage of development, and it has existed and operated for many years in developed economies.
The different patterns between the developed and converging country groups are due to the fact that the “old” EU country members group represents developed economies. For this country group, greenhouse gas emissions are higher, which is the aftermath of their higher economic and financial development. A more developed financial market is more sustainable. This is the reason why environmental taxation is significant for the developed country group and is not significant for converging economies. In the developed country group, the tax gap is lower when compared to converging economies, so the mechanism of collecting taxes is also more effective. Converging economies report lower levels of economic and financial development and lower greenhouse gas emissions. Income inequalities are specific to countries with lower economic growth. These inequalities are responsible for hampering economic growth, so this variable is only significant for converging economies. Income inequality measures how effective sustainable public finance is in defining the efficiency of redistribution mechanisms, so the public transfers allocation and efficiency. Another crucial factor that distinguishes the results for both country groups is the date of their membership in the European Union. The “old” EU countries that represent developed economies have been EU members longer and they have implemented “sustainable” practices and policies for a much longer time when compared to converging economies that became members more recently, so they are at different stages of development, especially in their transition to renewable energy sources.
Based on the research results in the literature, one can point to the similar results on the scope of environmental taxation that were obtained by Scrimgeour et al. [45], which argue, based on a New Zealand case study, that directing carbon dioxide can be an efficient way of ensuring environmental sustainability. However, it is also important to take into consideration that it is crucial to reduce the emissions of other harmful greenhouse gases, such as sulfur dioxide, nitrous oxide, and methane. The authors also declared that it is necessary to set up the rules, policies, and adjust tax systems, which can be achieved by systematically imposing environmental taxes.
The results of the research that was carried out by Lin and Li [40] on a group of five northern European countries (Denmark, Finland, Sweden, the Netherlands, and Norway) indicate that Finland’s carbon tax has a significant and negative impact on the increase of its CO2 emissions per capita. Meanwhile, the effects of tax on the carbon dioxide emissions in Denmark, Sweden, and the Netherlands are negative, but not significant. The effects of carbon tax mitigation are weakened due to tax exemption policies in some energy-intensive industries in these countries. In Norway, the high demand for energy products results in the rapid growth of these products, which impacts the increasing CO2 emissions in the oil and gas extraction sectors. The carbon dioxide tax in this case does not work as expected in reducing the emission effects. According to Fisher [46], intensive public support for innovation in environmentally friendly technologies (impacting the reduction of CO2 emissions) is only justified if at least a moderate emissions policy is implemented, and the spillover effects are significant.
Bosetti et al. [47] pointed out the role of international knowledge transfer as a driver to stimulate and speed up the development of energy friendly technologies. This approach is similar to the results that were achieved in our study for converging economies, for which employment in high- and medium-high technology manufacturing sectors and knowledge-intensive service sectors reduces greenhouse gas emissions. Based on a sensitivity analysis, Bosetti et al. [47] declared that high-income countries are more prone than low-income countries to responding to changes in their parameters and focused, in their research, on stabilizing global concentrations of CO2 in the atmosphere at 450 ppmv by the end of the 21st century (550 ppmv with all gases). This study showed that optimal R&D investments in energy are lower than previously estimated when spillovers of international knowledge are clearly modelled.
It is worth mentioning the research results presented by Lee and Min while searching for similar results on the relationship between gross domestic expenditures in R&D and greenhouse gas emissions [48]. The authors found a negative link between green R&D investment and carbon emissions based on a sample of Japanese manufacturing companies during the period of 2001–2010. This result was confirmed and it is coherent with the results we declare in our study.
Apergis et al. [49] analyzed the impact of R&D expenditures on carbon dioxide (CO2) emissions by companies within the manufacturing sectors of Germany, France, and the United Kingdom, before and after the introduction of a mandatory IFRS. The authors employed an autoregressive model, while using quarterly data from 1998 to 2011, and found that R&D expenditures after the adoption of IFRS reduced CO2 emissions for companies that were located in the countries selected for the study. This is likely a result of the presence of incentives provided by the new accounting disclosure regime offered by IFRS to produce more ‘green products’ and/or more renewable energy technologies. The results of this analysis have several policy implications for tax incentives. Investors involved in capital-intensive R&D activities aimed at emission reductions are interested in tax incentives to mitigate their risks. These incentives are expected to include research and development tax concessions and/or investment allowances.
Lapinskienė et al. also investigated the relationship between expenditures on R&D and greenhouse gas emissions [50], who found that the growth of R&D has a negative impact on greenhouse gas emissions, which is consistent with our findings. Lapinskienė et al. [50] conducted their research on economic growth, greenhouse gas emissions, and other factors while using the panel data of 22 countries from the EU for the period 1995–2014.
Finally, Shahbaz et al. [6] argued that financial development (based on banks) could help in the purchasing of advanced and energy-saving technologies allowing for stakeholders to obtain the financial resources at a lower cost. The authors also pointed out that bank-based financial development also impedes the environment, so the government should encourage lenders to ease the funding for the energy sector and allocate financial resources for environmentally friendly businesses.
The effective process of supporting energy-saving technology development and environmentally friendly investments requires the coordination of actions that are taken by the government, financial institutions, and enterprises, which is consistent with the assumptions of sustainable finance.
Referring to the group of studies that are related to financial and economic development, our findings are in line with the research results presented by Li et al. [51], who determined the positive impact of sustainable finance on carbon emissions in the Beijing-Tianjin-Hebei region (China). The empirical results of this study found that sustainable finance is a crucial factor that will inhibit the increase of carbon emissions. These research results inter alia showed that the total carbon emission reduction value that was caused by the green credit effect from 2010 to 2016 in the Beijing-Tianjin-Hebei region was 66,193.96 million tons [51].
Additionally, based on Chinas’ cased study, Lewis [52] provides a positive example of the impact of sustainable finance on environmental performance. Lewis discusses how sustainable finance (based on a carbon finance case) can be used to promote emissions mitigation in developing economies. Lewis focused on the Clean Development Mechanism and its role in stimulating the renewable energy market in China. The Author concludes that, besides the current reliance on carbon finance incentives, it is also important to include renewable energy project developers in China [52].
Shahbaz et al. [53], Sadorsky [54,55], Boutabba [56], and Islam et al. [57] present other research results that are worth discussing; all of these studies are congruent with our findings.
Based on the case of South Africa, Shahbaz et al. [53] showed that a rise in economic growth increases energy emissions, while financial development reduces them. They argued that the effect of financial development on CO2 emissions is negative and statistically significant at a conventional level of significance, and the detailed results of their analysis demonstrates that a 0.0273% reduction in CO2 emissions would result from a 1% increase in financial development. In sum, the empirical analysis that was provided by Shahbaz et al. pointed out that a rise in financial development is linked with environmental quality (financial development lowers energy pollutants) [53].
Based on a panel data set on 22 emerging countries that cover the period of 1990–2006, Sadorsky [54] showed a positive and statistically significant relationship between financial development and energy consumption. Sadorsky points out meeting greenhouse gas emission targets might be more difficult if policy makers do not include the financial development impacts of energy demands in emerging economies that continue to develop their financial markets [54].
In his second paper, Sadorsky discusses similar problems for Central and Eastern Europe [55]. His analysis examines the impact of financial development on energy consumption for nine Central and Eastern European economies. These findings (based on dynamic panel demand models) show a positive and statistically significant relationship between financial development and energy consumption [55].
Based on his research, Sadorsky concludes that meeting greenhouse gas emissions targets for such countries, such as Bulgaria, Estonia, Lithuania, Romania, and Slovenia, may be difficult without taking the impact of financial development on energy demand into account [55].
The analysis of the Indian economy that is provided by Boutabba is the next study that shows that financial development has a long-term positive impact on carbon emissions [56]. These results suggest that there is evidence for the long-term and causal relationships between per capita CO2 emissions, financial developments, per capita real GDP, the square of the per capita real GDP, per capita energy use, and trade openness. In his paper, Boutlabba argues that financial development improves environmental degradation and suggests that financial systems should consider their impact on environmental performance in their financial operations; banks, especially, should consider offering more “green” financial products for financing “green” energy sources [56].
There is a wide range of papers that are related to the relationship between economic and financial development and environmental performance and energy policy. These studies have been conducted for different groups of countries. The general trends and research results showed that there is a relationship between economic and financial development and environmental degradation (usually defined by greenhouse gas emissions). Our findings are in line with the group of studies that have determined the positive impact of economic and financial development on greenhouse gas emissions [53,54,55,56] and they are in line with the group of research that refers to the positive impact of sustainable finance on greenhouse gas emissions [40,45,46,47,48,49,51,52]. The positive role of environmental taxes is especially worth mentioning.
Our approach differentiates the research results according to their country groups (geographical factors). We report different results for the explanatory variables of developed and converging economies. These results are in line with Sadorsky’s research results. Sadorsky suggests that financial development will have a stronger (than in developed countries) impact on the energy market and greenhouse gas emissions for emerging economies, as financial development is a key driver in helping emerging economies to grow and prosper [54]. This agrees with our finding that the dependencies between economic and financial development are much stronger for the group of converging economies than for the developed one.
Sadorsky [55] also points out that states from Central and Eastern Europe may have trouble in meeting greenhouse gas emissions targets when compared to other European countries. Geographical differentiation matters because of the different energy conservation policies in these countries and the different positions of the European member countries from the “transition economies” country group, in limiting greenhouse emissions. Central and Eastern European countries are in a transitional period and they have tried to adjust their economies to renewable energy sources. However, there is still much to do, as the mining industry and coal heating are still very strong and popular, especially in the post transition country group. This is in line with our findings that refer to both groups of countries. Energy productivity also has an impact on greenhouse gas emissions; energy productivity causes a drop in emissions in the case of converging economies, and it causes an increase in emissions in the case of developed economies. Borghesi and Vercelli [58] tackle the same problem and state that many important countries (for example, India and China) have very limited reserves of oil and natural gas and huge reserves of coal, so the substitution of the latter with less polluting fossil fuels could contradict their economic and security targets.

6. Conclusions

This paper examines the relationship between financial and economic development and greenhouse gas emissions in developed (Germany, France, the United Kingdom, Italy, Spain, and the Netherlands) and converging economies (the Baltic States, the Visegrad countries, Romania, and Bulgaria). Panel data for the period of 2007–2017 were used to diagnose the relationship between sustainable financial and economic development and environmental quality. The original value of the study was based on incorporating “sustainability” (besides conventional variables) in the group of variables representing financial and economic development. As a result, the data set that was based on Eurostat was extended to consider the social and environmental variables that represent sustainable finance and matters for environmental sustainability inter alia environmental taxes and inequality in income distribution.
A panel data regression model was used to prove the hypothesis and research objectives. We found that there are crucial differences between developed countries that report high greenhouse gas emissions and converging economies. For the converging economies group, the identified statistical dependencies are stronger than for the developed countries. Some of the variables for converging economies are more counterproductive than those that are diagnosed for the developed countries. This applies to two variables: employment in high- and medium-high technology manufacturing sectors and knowledge-intensive service sectors and energy productivity, which indicates that, for the countries modernizing their economies and increasing innovation, their actions result in lower greenhouse gas emissions, whereas such an effect does not occur for developed countries.
In sum, the dynamic of expenditure on R&D (inter alia eco innovations) in converging economies is much higher when compared to developed countries. The most developed countries that already have a relatively high level of R&D expenditure have low growth dynamics for these kinds of expenditures. This is the reason why converging economies have a higher demand for employment in the high- and medium-high technology manufacturing sectors and knowledge-intensive service sectors; this also explains the significance of these variables for the group of converging economies. R&D expenditures finance eco innovations and they are mostly related to renewable energy sources that impact energy productivity.
Similarly, sustainable finance plays a greater role, and its impact is stronger in the case of converging economies. The variable that influenced greenhouse gas emissions for developed countries and converging economies was Gross domestic expenditure on R&D. An opposite effect on the level of emissions was noticeable for this variable: The higher the Gross domestic expenditure on R&D, the lower greenhouse gas emissions. Gross domestic expenditure on R&D requires long-term financing, and, with this in mind, the role of the financial sector is crucial in reducing greenhouse gas emissions. The financing of gross domestic expenditures on R&D might come from both the public and the market’s financial system.
This research has confirmed the existence of the dependence between economic and financial development and sustainable finance. In particular, this has been documented for countries with different levels of growth and development, for which differences in the number and direction of the observed variables have been observed. A greater number of variables explains the greater amount of greenhouse gas emissions for converging economies than for developed countries. We assume that sustainable finance is a key factor that is responsible for changing financial development and that sustainable finance positively impacts (decreases) greenhouse gas emissions. Importantly, these results are also valid if we include the final energy consumption in households as a dependent variable.
We argue that sustainable financial and economic development impact greenhouse gas emissions. As greenhouse gas emissions violate environmental sustainability, and many studies have reported the link between financial development and greenhouse gas emissions, in our opinion, it is necessary to discuss and analyse these terms together. Our study focused on the perspective of sustainable public finance. We have encountered many problems that are related to the variables and comprehensive data set, especially for a commercial (market) sustainable financial system. We found that there is a significant relationship between greenhouse gas emissions and environmental and social sustainability. Social sustainability matters for converging economies and environmental sustainability matters for both groups of countries. Sustainable finance is significant for both country groups; however, sustainable financial instruments (taxes, expenditures, and income distribution) have different impacts in converging and developed economies. This finding is important, especially for government energy policy recommendations. The role of environmental taxes will increase in the converging economies group, as these economies will be developed and the role of their gross domestic expenditure on R&D will decrease. Governments should take this argument into consideration while mitigating the negative effects of greenhouse gas emissions in converging economies.
In this context, it is necessary to design and implement a sustainable financial system that consists of two modules, the public and the market (commercial), while taking the country group to which this system refers into account. The public financial system should take the growing role of environmental taxes, in particular carbon tax, which has proven to be an effective instrument for decisions favoring low-carbon emissions, into account. This is especially desirable in converging economies, whose financial systems do not fully exploit the potential of environmental taxes. Sustainable commercial systems must develop from activities that offer sustainable financial products and services that will encourage entrepreneurs and households to engage in green consumerism practices. In addition, financial institutions, particularly banks, should change their approaches to risk assessment and incorporate non-financial factors into this process (environmental, social, and governance). This will make it possible to diversify the price of services and financial products by rewarding a socially responsible business. Modern solutions and technologies are very often a market for start-ups and private equity, so it is necessary to design a public support system for these kinds of initiatives by financing start-up accelerators. Our findings that are related to the significant impact of employment in the high and medium-high technology manufacturing sectors and knowledge-intensive service sectors regarding greenhouse gas emissions for converging economies offer an important argument in the discussion on the role of the public sector in financing eco innovation. In converging economies, public programs and public expenditures on R&D are especially important, as the capital market is developing. For developed economies, financing innovations supporting the development of pro-environmental technologies, capital markets play a key role, and their operation should be based on stable and predictable regulations; additionally, the taxation of capital gains and a system of concessions related to what remains in the sphere of state regulation played a key role. Regulations on the production and resale of energy from renewable sources by households are also important.

Author Contributions

Conceptualization: M.Z.; methodology: M.Z. and K.K.; software: K.K.; validation: K.K.; formal analysis M.Z., K.K. and A.S.; investigation: M.Z.; resources: K.K., A.S.; data curation: K.K.; writing—original draft preparation: M.Z. and K.K.; writing—review and editing: M.Z., K.K. and A.S.; visualization: M.Z., K.K. and A.S.; supervision: M.Z.; project administration: M.Z.; funding acquisition: M.Z.

Funding

Research results presented in this paper are an element of research project implemented by the National Science Center Poland under the grant OPUS13 no UMO-2017/25/B/HS4/02172 and OPUS16 no UMO-2018/31/B/HS4/00570.

Conflicts of Interest

The authors declare no conflict of interest.

Appendix A

Table A1. Review of literature (source: Compiled by the authors).
Author(s), YearTitleVariables Considered for the StudyResearch MethodologyResults DeterminedImplications of the Study
1Schumpeter J.A., (1961) [13]The theory of economic development: an inquiry into profits, capital, credit, interest, and the business cycleTheoretical study on economic development.Review of the basic economic concepts that describe the recurring economic processes of a commercially organized state in which private property, division of labor, and free competition prevail.Economic development is the key to explaining the features of a modern economyOverall implication on knowledge of economy.
2Georgescu-Roegen N. (1971) [4]The Entropy Law and the Economic ProcessEconomic processes are entropicReview of scientific theories and definitions.Economy is not a theoretical science and is connected to the environment.Reveals that the economic processes influence the environment.
3Georgescu-Roegen N. (1975) [5]Energy and Economic MythsThe book is a collection of materials that deal with various issues and concerns in economics.Review of scientific and economic theories and issues.Discussion of issues in natural resources and the economics of production, problems in institutional economics and epistemological and methodological concerns in economics.Overall implication on knowledge of economy.
4King R.G., Levine R., (1993) [16]Finance, entrepreneurship, and growth: Theory and evidenceIdentifying variables strongly correlated with provincial income growth in the Philippines by applying robustness procedures in determining which variables are strongly correlated with income growth.Empirical study.The tests show that among the fifteen variables, five variables stand out as being robust. The log of initial income, the ARMM indicator, the expenditure GINI and its square and the proportion of young dependents are all considered as strongly correlated to growth.Indication of key variables correlated with income growth in Philippines.
5Frankel J.A., Romer D., (1999) [24]Does trade cause growth?The impact of international trade on standards of living.Empirical studyThe results show that trade raises income. The relation between the geographic component of trade and income suggest that a rise of one percentage 6 point in the ratio of trade to GDP increases income per person by at least one-half percent.Trade has a significant impact on income.
6Rajan R.G., Zingales L., (2001) [30]Financial systems, industrial structure, and growthImpact of development of the financial sector on industrial growth. Relative importance of financial institutions and markets. Differences between financial systems in their vulnerability to crisis.Review of theories, empirical study.There seem to be a casual relationship between financial development and economic growth. Improvements to the accounting, legal, and supervisory infrastructure tend to diminish risk.From the policy perspective an economic development needs fixing of financial plumbing: accounting and disclosure system and legal and bankruptcy code.
7Talukdar D., Meisner C.M., (2001) [32]Does the private sector help or hurt the environment? Evidence from carbon dioxide pollution in developing countriesThe relationship between degree of private sector involvement in an economy and the CO2 emission levelEmpirical study using panel data across 44 developing countries in the period of 1987–1995.The study shows significantly negative relationship between degree of private sector involvement in an economy and the CO2 emission level.Allowing greater private sector involvement and foreign direct investment in its economic activities as well as possessing well-developed financial capital market help improving environmental quality of a country.
8Levine R., (2004) [10]Finance and growth: theory and evidenceReview of theoretical and empirical work on the relationship between financial development and economic growth.Review of theoretical papers about financial development and economic growth. Empirical studies: firm-level, industry-level, individual country-studies, time-series, panel-investigations, and broad cross-country comparisons.Theory and evidence imply that better developed financial systems ease external financing constraints facing firms, which illuminates one mechanism through which financial development influences economic growth.The paper highlights many areas needing additional research.
9Acemoğlu D., Johnson S., Robinson A.J., (2005) [12]Institutions as a fundamental cause of long-run growthDeveloping the empirical and theoretical case that differences in economic institutions are the fundamental cause of differences in economic development.Documenting the empirical importance of institutions and developing the basic outline of a framework for thinking about why economic institutions differ across countries.Illustration of the assumptions, the workings and the implications of the developed framework using a number of historical examples.Evidence of theory that differences in economic institutions are the fundamental cause of differences in economic development.
10Arestis P., (2006) [11]Financial liberalization and the relationship between finance and growthExploring the issues of the relationship between financial development and growth from the perspective of evaluation of the effects of financial liberalization.Literature study and empirical studies review.Theoretical propositions of the financial liberalization thesis are marred by serious difficulties. The available empirical evidence does not offer much support to the thesis.Relationship between financial development and growth is not clear so it needs more future studies.
11Tamazian A., Chousa J.P., Vadlamannati C., (2009) [7]Does higher economic and financial development lead to environmental degradation: evidence from the BRIC countriesThe linkage between economic and financial development and environmental quality.Empirical study based on CO2 emission data and economic growth factors over period 1992–2004.The economic development addressed by GDP growth rate, industry share and R&D expenditure has significant impact on per capita CO2 emissions. While emissions increase with the growth of economic development, the financial development decreases them.Government policies directed to financial openness and liberalization to attract higher levels of R&D-related foreign direct investment can decrease the environmental degradation.
12Tamazian A., Rao B.B., (2010) [8]Do economic, financial and institutional developments matter for environmental degradation? Evidence from transitional economiesThe linkage between economic and financial development and institutional quality and environmental quality.Empirical analysis using panel data methods and follow standard approaches in the existing EKC literature. The study considers 24 transition economies and panel data for 1993–2004.Economic development decreases environmental degradation when controlled for endogeneity of the explanatory variables and the effects of institutional quality are taken into account.Governments should support the development of new technologies that lead to a less carbon-intensive
Economy.
13Jalil A, Feridun M. (2011) [17]The Impact of Growth, Energy and Financial Development on the Environment in China. A Cointegration Analysis.The impact of financial development, economic growth and energy consumption on environmental pollution in China from 1953 to 2006. The the long run equilibrium relationship between financial development and environmental pollution.Literature review. Autoregressive Distributed Lag (ARDL) bounds testing procedureThe analysis reveals a negative sign for the coefficient of financial development, suggesting that financial development in China has not taken place at the expense of environmental pollution. Carbon emissions are mainly determined by income, energy consumption and trade openness in the long run.The findings confirm the existence of an Environmental Kuznets Curve in the case of China. These findings suggest some lessons regarding policies related to energy consumption and import policies.
14Zhang Y.J., (2011) [25]The impact of financial development on carbon emissions: An empirical analysis in ChinaThe influence of financial development on carbon emissions.Empirical analysis using econometric techniques, including cointegration theory, Granger causality test, and variance decomposition.The results indicate
that, China’s financial development acts as an important driver for carbon emissions increase, the influence of financial intermediation scale on carbon emissions outweighs that of other financial development indicators, China’s stock market scale has relatively larger influence on carbon emissions but the influence of its efficiency is very limited.
With the increase of China’s FDI in the future, many efforts should be made to adapt its utilizing directions and play its positive role in promoting low-carbon development.
15Todaro M.P., Smith S.C., (2012) [14]Economic developmentThe book provides a complete and balanced introduction to the requisite theory, driving policy issues, and latest research.A policy-oriented approach, presenting economic theory in the context of critical policy debates and country-specific case studies.The book shows how theory relates to the problems and prospects of developing countries.For courses on economic development. A complete, balanced introduction to the theory, issues, and latest research.
16Apergis N., Eleftheriou S., & Payne, J.E., (2013) [49]The relationship between international financial reporting standards, carbon emissions, and R&D expenditures: Evidence from European manufacturing firmsThe impact of research and development (R&D) expenditures on carbon dioxide (CO2) emissions prior to and under the mandatory adoption of International Financial Reporting Standards at the firm level within the manufacturing sectors of three European countries.Estimation of a threshold autoregressive model using quarterly data from 1998 to 2011.In the post-IFRS mandatory adoption year R&D expenditures show a reduction in CO2 emissions to firms, i.e., rising CO2 abatement.The results remain robust in terms of a sector analysis, firm size, and the introduction of the European Union Emission Trading Scheme (EU-ETS) across the three countries.
17Shahbaz M., Solarin S.A., Mahmood H., Arouri M., (2013) [9]Does financial development reduce CO2 emissions in Malaysian economy? A time series analysisEvaluation of the relationship of financial development, energy consumption and economic growth with CO2 emissions in case of Malaysia in the
period of 1971–2011.
Literature review. Analysis of the following data: CO2 emissions, financial development, real GDP per capita for economic growth, energy consumption, real foreign direct investment, real trade (exports + imports).Confirmation of long run relationship between the examined variables.
Economic growth, energy consumption and foreign direct investment are shown to retard environmental quality. Financial development reduces CO2 emissions for Malaysian Economy.
Financial development can play positive and significant role in combating environmental degradation in the country as greater financial sector development can facilitate more financing at lower costs.
18Friede G., Busch T., Bassen A., (2015) [2]ESG and financial performance: aggregated evidence from more than 2000 empirical studiesrelation between environmental, social, and governance (ESG) criteria and corporate financial performance (CFP)Second-level review of 60 review studies: analysis of findings from vote-count studies and aggregation the findings of econometric review studies –meta-analysesApproximately 90% of studies find a nonnegative ESG–CFP relation, of which 47.9% in vote-count studies and 62.6% in meta-analyses yield positive findings with a central average correlation level in studies of around 0.15.The review of studies shows the evidence for the business case for ESG investing. The orientation toward long term responsible investing should be important for all kinds of rational investors. Detailed and profound understanding of how to integrate ESG criteria into investment processes is required in order to harvest the full potential of value-enhancing ESG factors.
19Lee K.-H, & Min B., (2015)
[48]
Green R&D for eco-innovation and its impact on carbon emissions and firm performanceThe impact of green research and development investment for eco-innovation on environmental and financial performance.Empirical study using a sample of Japanese manufacturing firms during the period of 2001–2010.The results show the presence of a negative relationship between green research and development and carbon emissions, while green research and development is positively related to financial performance at the firm level.The findings of this study provide valuable insights and basis of scientific debate on how firms to engage unique organizational resources and capabilities for superior corporate environmental and financial performance.
20Lee J.M., Chen K.H., Cho C.H., (2015) [18]The relationship between CO2 emissions and financial development: evidence from OECD countriesThe relationships among CO2 emissions, energy use, GDP, and financial development for 25 OECD countries over the 1971–2007 period.Literature survey and empirical study based on the analysis of the data by means of a panel approach.The results don’t confirm an existence of the EKC for OECD countries. Moreover, the results present that the coefficient of financial development to CO2 emissions is negative and statistically significant for eight countries.The study shows that financial development can help EU countries to adjust their CO2 emissions.
21Omri A., Daly S., Rault Ch., Chaibi A., (2015) [20]Financial development, environmental quality, trade and economic growth: What causes what in MENA countriesThe relationship between financial development, CO2 emissions, trade and economic growth in MENA countries.Empirical study using simultaneous-equation panel data models for a panel of 12 MENA countries over the period 1990–2011.There is evidence of bidirectional causality between CO2 emissions and economic growth. The results also verified the existence of environmental Kuznets curve.The empirical insights are of particular interest to policymakers as they help build sound economic policies to sustain economic development and to improve the environmental quality
22Abbasi F., Riaz K., (2016) [23]CO2 emissions and financial development in an emerging economy: An augmented VAR approachThe influence of economic and financial development on carbon emissions in a small emerging economy.Empirical study using ARDL approach, an Error Correction Model (ECM), Granger causality in an augmented VAR framework, and variance decomposition based on an estimated Vector Error Correction Model (VECM).The financial variables played a role in emission mitigation only in the latter period where greater degree of liberalization and financial sector development occurred. Even then the relative magnitude of emissions mitigation attributable to financial variables was much smaller compared to the emissions raising impact of rising per capita incomes.Governments need to adopt other mitigation policies for reducing carbon footprints in those emerging economies where a sufficient degree of financial deepening and financial sector development has not yet taken place.
23Al-Mulali U., Ozturk I., Lean H.H., (2016) [21]The influence of economic growth, urbanization, trade openness, financial development, and renewable energy on pollution in EuropeThe influence of disaggregated renewable electricity production by source on CO2 emission in 23 selected European countries for the period of 1990–2013Empirical study using panel data techniques.The results indicated that CO2 emission, GDP growth, urbanization, financial development, and renewable electricity production by source were cointegrated. The fully modified ordinary least-square results revealed that GDP growth, urbanization, and financial development increase CO2 emission in the long run, while trade openness reduces itA number of policy recommendations were provided for the European countries.
24Dogan E., Turkekul B., (2016) [22]CO2 Emissions, Real Output, Energy Consumption, Trade, Urbanization and Financial Development: Testing the EKC Hypothesis for the USAThe relationship between carbon dioxide (CO2) emissions, energy consumption, real output (GDP), the square of real output (GDP2), trade openness, urbanization, and financial development in the USA for the period 1960–2010.Literature review and empirical study based on the time series data from 1960 to 2010 obtained from the World Development Indicators.The analysed variables are cointegrated. In the long run, energy consumption and urbanization increase environmental degradation while financial development has no effect on it, and trade leads to environmental improvements.The US government should take into account the importance of trade openness, urbanization, and financial development in controlling for the levels of GDP and pollution
25Shahbaz M., Shahzad, S. J. H., Ahmad, N., & Alam, S. (2016) [6] Financial development and environmental quality: the way forward.Bank-and Stock market-based financial development indicators, energy consumption, GDP per capita. Quarterly data from 1985 to 2014 for Pakistan.Wide literature review; non-linearity assessment with Fourier ADF function and the optimal lag length selected by using the Akaike Information Criterion. Inefficient use of energy adversely affects the environmental quality; bank-based financial development impedes environmental quality.Adoption of energy efficient technology at both production and consumption levels. Government should encourage lenders to ease the funding for energy sector and allocate financial resources for environment friendly ventures
26Schoenmaker D., (2017) [27]Investing for the Common Good: A Sustainable Finance FrameworkDiscussing the issue of sustainable development.Literature review and empirical study.The essay shows how sustainable finance has the potential to move from finance as a goal (profit maximization) to finance as a means. also examines obstacles to the adoption of sustainable finance.This essay provides a new framework for sustainable Finance.

Appendix B

Table A2. The variables implemented to the model (source: Compiled by the authors).
VariableAbbreviationUnit of MeasurementMeaning of the VariableAuthor(s), Year, Title
Greenhouse gases (CO2, N2O in CO2 equivalent, CH4 in CO2 equivalent)GGEkg per capitaAmount of gases emitted per capita. CO2 equivalent is calculated using Global Warming Potential (GWP) factor which compares components based on radiative forcing, integrated up to a chosen time horizon. According to IPCC Climate Change 2014: Synthesis Report, GWP for N2O is 265 over 100 years and 28 for CH4 (GWP for CO2 is 1). [59]Sterpu M., Soava G., Mehedintu A. (2018). Impact of Economic Growth and Energy Consumption on Greenhouse Gas Emissions: Testing Environmental Curves Hypotheses on EU Countries [19].
Tamazian A., Chousa J.P., Vadlamannati C. (2009). Does higher economic and financial development lead to environmental degradation: evidence from the BRIC countries [7]
Talukdar D., Meisner C.M. (2001). Does the private sector help or hurt the environment? Evidence from carbon dioxide pollution in developing countries [32].
Shahbaz M., Shahzad S. J. H., Ahmad N., & Alam, S. (2016). Financial development and environmental quality: the way forward [6].
Final energy consumption in households per capitaFECkg of oil equivalentThe indicator measures how much electricity and heat every citizen consumes at home excluding energy used for transportation. Since the indicator refers to final energy consumption, only energy used by end consumers is considered. The related consumption of the energy sector itself is excluded [60].Chang S.C., (2015),
Effects of financial developments and income on energy consumption [28]; Rafindadi A.A., Ozturk I. (2017). Dynamic effects of financial development, trade openness and economic growth on energy consumption: Evidence from South Africa [29].
Energy productivityC1economic output produced per unit of gross available energy, in EuroThe indicator results from the division of the gross domestic product (GDP) by the gross available energy for a given calendar year. It measures the productivity of energy consumption and provides a picture of the degree of decoupling of energy use from growth in GDP. [61]Atalla T., Bean P., (2017) Determinants of energy productivity in 39 countries: An empirical investigation [62].
Employment in high and medium-high technology manufacturing sectors and knowledge-intensive service sectorsE1% of total employmentThe definition of high- and medium-high technology manufacturing sectors and of knowledge-intensive services is based on a selection of relevant items of NACE Rev. 2 on 2-digit level and is oriented on the ratio of highly qualified working in these areas [63].Kabaklarli E., Duran M. S., Üçl Y. T. (2018). High-technology exports and economic growth: panel data analysis for selected OECD countries [64].
Desmarchelier B., Djellal F., Gallouj F., (2012) Knowledge intensive business services and long term growth. Structural Change and Economic Dynamics [65].
Investment as share in GDPE2% of GDPThis indicator shows the investment for the total economy, government, business as well as household sectors. The indicator gives the share of GDP that is used for gross investment (rather than being used for e.g., consumption or exports). It is defined as gross fixed capital formation (GFCF) expressed as a percentage of GDP for the government, business and household sectors [66].McQuinn K., Whelan K.,
(2016) The Prospects for Future Economic Growth in the Euro Area [67].
Purchasing power adjusted GDPE3per capita, in EURGross domestic product (GDP) is a measure for the economic activity. It refers to the value of the total output of goods and services produced by an economy, less intermediate consumption, plus net taxes on products and imports. GDP per capita is calculated as the ratio of GDP to the average population in a specific year. Purchasing power standards (PPS) represents a common currency that eliminates the differences in price levels between countries to allow meaningful volume comparisons of GDP [68].Magnien F. (2002) The measure of GDP per capita in Purchasing Power Standards: a statistical indicator tricky to interpret [69].
Inequality of income distribution (income quintile share ratio)E4ratioThe income quintile share ratio or the S80/S20 ratio is a measure of the inequality of income distribution. It is calculated as the ratio of total income received by the 20 % of the population with the highest income (the top quintile) to that received by the 20 % of the population with the lowest income (the bottom quintile) [70]Razvan B., Boldea B.I. (2012).
Sustainability of Economic Growth and Inequality In Incomes Distribution, Annals of Faculty of Economics, University of Oradea, Faculty of Economics, vol. 1(1), pages 249–254 [71].
Gross domestic expenditure on R&D as % of GDPF1% of GDPGross domestic spending on R&D is defined as the total expenditure (current and capital) on R&D carried out by all resident companies, research institutes, university and government laboratories, etc., in a country. It includes R&D funded from abroad but excludes domestic funds for R&D performed outside the domestic economy [72].Sokolov-Mladenović S., Cvetanović S., Mladenović I., (2015) R&D expenditure and economic growth: EU28 evidence for the period 2002–2012 [73].
Shares of environmental taxes in total tax revenuesF2%Environmental taxes are defined as taxes whose tax base is a physical unit (or proxy of it) of something that has a proven, specific negative impact on the environment [74].Morley B., Abdullah S., 2010, Environmental Taxes and Economic Growth: Evidence from Panel Causality Tests [75].

Appendix C

Table A3. Model 3—results of panel data regression with fixed effects for the Central-Eastern European countries (converging economies); 88 observations, included 9 cross-sectional units; Dependent variable (Y): Greenhouse_gases_emissions (GGE) and Final_energy_consumption (FEC) (source: own analysis based on Eurostat data).
CoefficientStd. Errort-Ratiop Value
const312.878131.5532.37830.02029**
E1_Employment_in_high_&_medium_sect.−36.714411.1462−3.29390.00159***
E2_Investment_share_in_GDP1.888340.5725493.29810.00157***
E3_Purchasing_power_adjusted_GDP0.02327160.005527494.21020.00008***
E4_Inequality_of_income_distribution−44.071218.7171−2.35460.02153**
sq_E1_ Employment_in_high_&_medium_sect.1.591730.6493122.45140.01688**
sq_E3_ Purchasing_power_adjusted_GDP−3.87894 × 10−71.41501 × 10−7−2.74130.00787***
sq_E4_ Inequality_of_income_distribution3.424171.464242.33850.02240**
F1_Gross_domestic_expendit._on_R&D−57.388425.5744−2.24400.02819**
F2_Share_of_environmental_taxes50.347415.30243.29020.00161***
sq_F1_ Gross_domestic_expendit._on_R&D17.4518.292942.10430.03916**
sq_F2_ Share_of_environmental_taxes−3.093560.868313−3.56270.00069***
C1_Energy_productivity−247.15140.931−6.0382<0.00001***
sq_C1_Energy_productivity25.88384.88835.2950<0.00001***
Note: the prefix ‘sq’ in the variable’s name indicates the quadratic form of the given variable, **, *** denote significance of coefficients at 5%, and 1% levels, respectively.
Table A4. Model 4—results of panel data regression with fixed effects for the Western European countries (developed economies); 60 observations, included six cross-sectional units; Dependent variable (Y): Greenhouse_gases_emissions (GGE) and Final_energy_consumption (FEC) (source: own analysis based on Eurostat data).
CoefficientStd. Errort-Ratiop Value
const75.196376.64590.98110.33157
E1_Employment_in_high_&_medium_sect.8.716664.044182.15540.03629**
E2_Investment_share_in_GDP2.697570.5814614.63930.00003***
F1_Gross_domestic_expendit_on_R&D−31.202612.3697−2.52250.01510**
F2_Share_of_environmental_taxes−26.480210.7626−2.46040.01761**
sq_F2_ Share_of_environmental_taxes1.637120.7653362.13910.03765**
C1_Energy_productivity15.830116.82440.94090.35157
sq_C1_Energy_productivity−2.330320.899868−2.58960.01275**
Statistics and Test Results
Mean-dependent var−17.32799S.D.-dependent var64.19933
Sum-squared resid1693.969S.E. of regression6.003490
LSDV R-squared0.993034Within R-squared0.923540
LSDV F(12, 47)558.3266p value (F)2.14 × 10−46
Log-likelihood−185.3509Akaike criterion396.7017
Schwarz criterion423.9282Hannan-Quinn407.3515
rho−0.119704Durbin-Watson2.164931
Joint test on named regressors: F(7, 47) = 81.0997 with p = 4.58951 × 10⁻²⁴
Test for differing group intercepts: F(5, 47) = 167.085 with p = 1.00783 × 10⁻²⁸
Note: The prefix ‘sq’ in the variable’s name indicates the quadratic form of the given variable, ** and *** denote significance of coefficients at 5%, and 1% levels, respectively.

References

  1. Grossman, G.M.; Krueger, A.B. Economic growth and the environment. Q. J. Econ. 1995, 110, 353–377. [Google Scholar] [CrossRef]
  2. Friede, G.; Busch, T.; Bassen, A. ESG and financial performance: Aggregated evidence from more than 2000 empirical studies. J. Sustain. Financ. Invest. 2015, 5, 210–233. [Google Scholar] [CrossRef]
  3. Beckerman, W. Economic Growth and the Environment: Whose Growth? Whose Environment? World Dev. 1992, 20, 481–496. [Google Scholar] [CrossRef]
  4. Georgescu-Roegen, N. The Entropy Law and the Economic Process; Harvard University Press: Cambridge MA, USA, 1971. [Google Scholar]
  5. Georgescu-Roegen, N. Energy and Economic Myths. South. Econ. J. 1975, 41, 347–381. [Google Scholar] [CrossRef]
  6. Shahbaz, M.; Shahzad, S.J.H.; Ahmad, N.; Alam, S. Financial development and environmental quality: The way forward. Energy Policy 2016, 98, 353–364. [Google Scholar] [CrossRef]
  7. Tamazian, A.; Chousa, J.P.; Vadlamannati, C. Does higher economic and financial development lead to environmental degradation: Evidence from the BRIC countries. Energy Policy 2009, 37, 246–253. [Google Scholar] [CrossRef]
  8. Tamazian, A.; Rao, B.B. Do economic, financial and institutional developments matter for environmental degradation? Evidence from transitional economies. Energy Econ. 2010, 32, 137–145. [Google Scholar] [CrossRef]
  9. Shahbaz, M.; Solarin, S.A.; Mahmood, H.; Arouri, M. Does financial development reduce CO2 emissions in Malaysian economy? A time series analysis. Econ. Model. 2014, 35, 145–152. [Google Scholar] [CrossRef]
  10. Levine, R. Finance and Growth: Theory and Evidence; Working Paper 10766; National Bureau of Economic Research: Cambridge, MA, USA, 2004; pp. 1–5. [Google Scholar]
  11. Arestis, P. Financial liberalization and the relationship between finance and growth. In A Handbook of Alternative Monetary Economics; Arestis, P., Sawyer, M., Eds.; Edward Elgar Publishing: Cheltenham/Northampton, UK, 2006; pp. 346–364. [Google Scholar]
  12. Acemoğlu, D.; Johnson, S.; Robinson, A.J. Institutions as a fundamental cause of long-run growth. In Handbook of Economic Growth; Aghion, P., Durlauf, S.N., Eds.; Elsevier Science Publishers: Amsterdam, The Netherlands, 2005; Volume 1A, pp. 385–472. [Google Scholar] [CrossRef]
  13. Schumpeter, J.A. The Theory of Economic Development: An Inquiry into Profits, Capital, Credit, Interest, and the Business Cycle; Oxford University Press: Oxford, UK, 1961. [Google Scholar]
  14. Todaro, M.P.; Smith, S.C. Economic Development; Pearson Education: Boston, MA, USA, 2012. [Google Scholar]
  15. Levine, R. Finance and growth: Theory and evidence. In Handbook of Economic Growth; Aghion, P., Durlauf, S.N., Eds.; Elsevier Science Publishers: Amsterdam, The Netherlands, 2005; Volume 1A, pp. 865–934. [Google Scholar] [CrossRef]
  16. King, R.G.; Levine, R. Finance, entrepreneurship, and growth: Theory and evidence. J. Monet. Econ. 1993, 32, 513–542. [Google Scholar] [CrossRef]
  17. Jalil, A.; Feridun, M. The Impact of Growth, Energy and Financial Development on the Environment in China: A Cointegration Analysis. Energy Econ. 2011, 33, 284–291. [Google Scholar] [CrossRef]
  18. Lee, J.M.; Chen, K.H.; Cho, C.H. The relationship between CO2 emissions and financial development: Evidence from OECD countries. Singap. Econ. Rev. 2015, 60, 1550117. [Google Scholar] [CrossRef]
  19. Sterpu, M.; Soava, G.; Mehedintu, A. Impact of Economic Growth and Energy Consumption on Greenhouse Gas Emissions: Testing Environmental Curves Hypotheses on EU Countries. Sustainability 2018, 10, 3327. [Google Scholar] [CrossRef]
  20. Omri, A.; Daly, S.; Rault, C.; Chaibi, A. Financial development, environmental quality, trade and economic growth: What causes what in MENA countries. Energy Econ. 2015, 48, 242–252. [Google Scholar] [CrossRef]
  21. Al-Mulali, U.; Ozturk, I.; Lean, H.H. The influence of economic growth, urbanization, trade openness, financial development, and renewable energy on pollution in Europe. Nat. Hazards 2016, 79, 621–644. [Google Scholar] [CrossRef]
  22. Dogan, E.; Turkekul, B. CO2 Emissions, Real Output, Energy Consumption, Trade, Urbanization and Financial Development: Testing the EKC Hypothesis for the USA. Environ. Sci. Pollut. Res. 2016, 23, 1203–1213. [Google Scholar] [CrossRef]
  23. Abbasi, F.; Riaz, K. CO2 emissions and financial development in an emerging economy: An augmented VAR approach. Energy Policy 2016, 90, 102–114. [Google Scholar] [CrossRef]
  24. Frankel, J.A.; Romer, D. Does trade cause growth? Am. Econ. Rev. 1999, 89, 379–399. [Google Scholar] [CrossRef]
  25. Zhang, Y.J. The impact of financial development on carbon emissions: An empirical analysis in China. Energy Policy 2011, 49, 488–498. [Google Scholar] [CrossRef]
  26. Sustainable Financial System: Nine Priority Conditions to Address (2017). Principles for Responsible Investment. Available online: https://www.unpri.org/download?ac=5510 (accessed on 1 October 2019).
  27. Schoenmaker, D. Investing for the Common Good: A Sustainable Finance Framework; Bruegel Essay and Lecture Series; Bruegel: Brussels, Belgium, 2017; ISBN 978-9-078910-43-5. [Google Scholar]
  28. Chang, S.C. Effects of financial developments and income on energy consumption. Int. Rev. Econ. Financ. 2015, 35, 28–44. [Google Scholar] [CrossRef]
  29. Rafindadi, A.A.; Ozturk, I. Dynamic effects of financial development, trade openness and economic growth on energy consumption: Evidence from South Africa. Int. J. Energy Econ. Policy 2017, 7, 74–85. [Google Scholar]
  30. Rajan, R.G.; Zingales, L. Financial systems, industrial structure, and growth. Oxf. Rev. Econ. Policy 2001, 17, 467–482. [Google Scholar] [CrossRef]
  31. Allen, F.; Gu, X.; Kowalewski, O. Financial structure, economic growth and development. In Handbook of Finance and Development; Beck, T., Levine, R., Eds.; Edward Elgar Publishing: Cheltenham, UK, 2018; pp. 31–62. [Google Scholar]
  32. Talukdar, D.; Meisner, C.M. Does the private sector help or hurt the environment? Evidence from carbon dioxide pollution in developing countries. World Dev. 2001, 29, 827–840. [Google Scholar] [CrossRef]
  33. Lapinskienė, G.; Peleckis, K.; Radavičius, M. Economic development and greenhouse gas emissions in the European Union countries. J. Bus. Econ. Manag. 2015, 16, 1109–1123. [Google Scholar] [CrossRef]
  34. Kumar, R.R.; Stauvermann, P.J.; Patel, A.; Kumar, R.D. Exploring the effects of energy consumption on output per worker: A study of Albania, Bulgaria, Hungary and Romania. Energy Policy 2014, 69, 575–585. [Google Scholar] [CrossRef]
  35. Kumar, R.R.; Stauvermann, P.J.; Patel, A.; Kumar, N. The effect of energy on output per worker in the Balkan Peninsula: A country-specific study of 12 nations in the energy community. Renew. Sustain. Energy Rev. 2017, 70, 1223–1239. [Google Scholar] [CrossRef]
  36. Malik, M.N.A.; Masih, M. The Relationship between Energy Consumption, Financial Development and Economic Growth: An Evidence from Malaysia Based on ARDL. 2017. Available online: https://www.researchgate.net/publication/324829394 (accessed on 13 August 2019).
  37. Musolesi, A.; Mazzanti, M.; Zoboli, R. A Bayesian Approach to the estimation of EKC for CO2. Appl. Econ. 2010, 42, 2275–2287. [Google Scholar] [CrossRef]
  38. Piaggio, M.; Padilla, E. CO2 emissions and economic activity: Heterogeneity across countries and non-stationary series. Energy Policy 2012, 46, 370–381. [Google Scholar] [CrossRef]
  39. Tiba, S.; Omri, A. Literature survey on the relationships between energy, environment and economic growth. Renew. Sustain. Energy Rev. 2017, 69, 1129–1146. [Google Scholar] [CrossRef]
  40. Lin, B.; Li, X. The effect of carbon tax on per capita CO2 emissions. Energy Policy 2011, 39, 5137–5146. [Google Scholar] [CrossRef]
  41. Plumer, B.; Popovic, N. These Countries Have Prices on Carbon. Are They Working? 2019. Available online: https://www.nytimes.com/interactive/2019/04/02/climate/pricing-carbon-emissions.html (accessed on 1 October 2019).
  42. Aydin, C.; Esen, Ö. Reducing CO2 emissions in the EU member states: Do environmental taxes work? J. Environ. Plan. Manag. 2018, 61, 2396–2420. [Google Scholar] [CrossRef]
  43. Morris, J.; Paltsev, S.; Reilly, J. Marginal abatement costs and marginal welfare costs for greenhouse gas emissions reductions: Results from the EPPA model. Environ. Modeling Assess. 2012, 17, 325–336. [Google Scholar] [CrossRef] [Green Version]
  44. Goldsmith, R.W. Financial Structure and Development; Yale University Press: New Haven, CT, USA, 1969; ISBN1 0300011806. ISBN2 978-0300011807. [Google Scholar]
  45. Scrimgeour, F.; Oxley, L.; Fatai, K. Reducing carbon emissions? The relative effectiveness of different types of environmental tax: The case of New Zealand. Environ. Model. Softw. 2005, 20, 1439–1448. [Google Scholar] [CrossRef] [Green Version]
  46. Fisher, C. Emissions pricing, spillovers, and public investment in environmentally friendly technologies. Energy Econ. 2008, 30, 487–502. [Google Scholar] [CrossRef] [Green Version]
  47. Bosetti, V.; Carraro, C.; Massettiand, E.; Tavoni, M. International energy. Energy Econ. 2008, 30, 2912–2929. [Google Scholar] [CrossRef]
  48. Lee, K.-H.; Min, B. Green R&D for eco-innovation and its impact on carbon emissions and firm performance. J. Clean. Prod. 2015, 108, 534–542. [Google Scholar] [CrossRef] [Green Version]
  49. Apergis, N.; Eleftheriou, S.; Payne, J.E. The relationship between international financial reporting standards, carbon emissions, and R&D expenditures: Evidence from European manufacturing firms. Ecol. Econ. 2013, 88, 57–66. [Google Scholar] [CrossRef]
  50. Lapinskienė, G.; Peleckis, K.; Slavinskaitė, N. Energy consumption, economic growth and greenhouse gas emissions in the European Union countries. J. Bus. Econ. Manag. 2017, 18, 1082–1097. [Google Scholar] [CrossRef] [Green Version]
  51. Li, L.; Liu, D.; Hou, J.; Xu, D.; Chao, W. The Study of the Impact of Carbon Finance Effect on Carbon Emissions in Beijing-Tianjin-Hebei Region—Based on Logarithmic Mean Divisia Index Decomposition Analysis. Sutstainability 2019, 11, 1465. [Google Scholar] [CrossRef] [Green Version]
  52. Lewis, I.J. The evolving role of carbon finance in promoting renewable energy development in China. Energy Policy 2010, 38, 2875–2886. [Google Scholar] [CrossRef]
  53. Shahbaz, M.; Tiwari, A.K.; Nasir, M. The effects of financial development, economic growth, coal consumption and trade openness on CO2 emissions in South Africa. Energy Policy 2013, 61, 452–1459. [Google Scholar] [CrossRef] [Green Version]
  54. Sadarosky, P. The impact of financial development on energy consumption in emerging economies. Energy Policy 2010, 38, 2528–2535. [Google Scholar] [CrossRef]
  55. Sadarosky, P. Financial development and energy consumption in Central and Eastern European frontier economies. Energy Policy 2011, 38, 999–1006. [Google Scholar] [CrossRef]
  56. Boutabba, M.A. The impact of financial development, income, energy and trade on carbon emissions: Evidence from the Indian economy. Econ. Model. 2014, 40, 33–41. [Google Scholar] [CrossRef] [Green Version]
  57. Islam, F.; Shahbaz, M.; Ahmed, A.U.; Alam, M.M. Financial development and energy consumption nexus in Malaysia: A multivariate time series analysis. Econ. Model. 2013, 30, 435–441. [Google Scholar] [CrossRef] [Green Version]
  58. Borghesi, S.; Vercelli, A. Greenhouse gas emissions and the energy system: Are current trends sustainable? Int. J. Glob. Energy Issues 2009, 32. [Google Scholar] [CrossRef] [Green Version]
  59. Pachauri, R.K.; Meyer, L.A. (Eds.) Climate Change 2014: Synthesis Report. In Contribution of Working Groups I, II and III to the Fifth Assessment; Report of the Intergovernmental Panel on Climate Change; IPCC: Geneva, Switzerland, 2014; p. 87. [Google Scholar]
  60. Available online: https://ec.europa.eu/eurostat/web/products-datasets/product?code=sdg_07_20 (accessed on 1 November 2019).
  61. Available online: https://ec.europa.eu/eurostat/web/products-datasets/-/t2020_rd310 (accessed on 1 November2019).
  62. Atalla, T.; Bean, P. Determinants of energy productivity in 39 countries: An empirical investigation. Energy Econ. 2017, 62, 217–229. [Google Scholar] [CrossRef]
  63. Available online: https://ec.europa.eu/eurostat/web/products-datasets/product?code=tsc00011 (accessed on 1 November 2019).
  64. Kabaklarli, E.; Duran, M.S.; Üçl, Y.T. High-technology exports and economic growth: panel data analysis for selected OECD countries. Forum Sci. Oeconomia 2018, 6, 47–60. [Google Scholar]
  65. Desmarchelier, B.; Djellal, F.; Gallouj, F. Knowledge intensive business services and long term growth. Struct. Chang. Econ. Dyn. 2013, 25, 188–205. [Google Scholar] [CrossRef] [Green Version]
  66. Available online: https://ec.europa.eu/eurostat/web/products-datasets/product?code=sdg_08_11 (accessed on 1 November 2019).
  67. McQuinn, K.; Whelan, K. The Prospects for Future Economic Growth in the Euro Area; ZBW—Leibniz Information Centre for Economics: Kiel, Germany, 2016; pp. 305–311. [Google Scholar]
  68. Available online: https://ec.europa.eu/eurostat/web/products-datasets/-/sdg_10_10 (accessed on 1 November 2019).
  69. Magnien, F. The Measure of GDP Per Capita in Purchasing Power Standards: A Statistical Indicator Tricky to Interpret; OECD Meeting of National Accounts Experts; OECD: Paris, France, 2002. [Google Scholar]
  70. Available online: https://ec.europa.eu/eurostat/statistics-explained/index.php/Glossary:Income_quintile_share_ratio (accessed on 1 November 2019).
  71. Razvan, B.; Boldea, B.I. Sustainability of Economic Growth and Inequality in Incomes Distribution. Ann. Fac. Econ. 2012, 1, 249–254. [Google Scholar]
  72. OECD Data. Available online: https://data.oecd.org/rd/gross-domestic-spending-on-r-d.htm (accessed on 1 November 2019).
  73. Sokolov-Mladenović, S.; Cvetanović, S.; Mladenović, I. R&D expenditure and economic growth: EU28 evidence for the period 2002–2012. J. Econ. Res. Ekon. Istraživanja 2015, 29, 1005–1020. [Google Scholar] [CrossRef] [Green Version]
  74. EU Open Data Portal. Available online: http://data.europa.eu/euodp/data/dataset/PmWRwlFr5uB3Fn1oD9Orw (accessed on 1 November 2019).
  75. Morley, B.; Abdullah, S. Environmental Taxes and Economic Growth: Evidence from Panel Causality Tests. Bath Econ. Res. Pap. 2010, 42, 27–33. [Google Scholar]
Figure 1. Shape of the function representing ‘Energy productivity’ variable in both models: (a) results for converging countries; (b) results for developed economies; (source: own analysis based on Eurostat data). Note: estimation based on the synthetic country represented by the mean observations.
Energies 12 04514 g001
Figure 2. Shape of the function representing ‘Shares of environmental taxes in total tax revenues’ variable in both models: (a) results for converging countries; (b) results for developed economies; (source: own analysis based on Eurostat data). Note: estimation based on the synthetic country represented by the mean observations.
Energies 12 04514 g002
Table 1. Greenhouse gases (CO2, N2O in CO2 equivalent, CH4 in CO2 equivalent)—kilograms per capita; selected European Union (EU) countries (source: Eurostat database).
EU 28Developed Economies (WE)Converging Economies (CEE)
AverageFranceGermanyItalyUKCzech Rep.HungaryLithuaniaPoland
20088424602510,1117399889711,461554974779387
20117622539796746330751210,448500969969325
2014698849359491520367479554463473658752
2017690348699126519757389528506782949290
Table 2. Final energy consumption in households per capita (kg of oil equivalent); selected EU countries (source: Eurostat database).
EU 28Developed Economies (WE)Converging Economies (CEE)
AverageFranceGermanyItalyUKCzech Rep.HungaryLithuaniaPoland
2008605688738571688627599485516
2011568595680545597654659506528
2014525562636486554622556478499
2017563608684543561678643515525
Table 3. Energy productivity (the amount of economic output produced per unit of gross available energy); selected EU countries (source: Eurostat database).
EU 28Developed Economies (WE)Converging Economies (CEE)
AverageFranceGermanyItalyUKCzech Rep.HungaryLithuaniaPoland
20087.17.37.78.98.53.53.93.43.4
20117.47.68.39.39.43.63.94.13.7
20148.08.18.710.210.53.84.44.94.3
20178.38.49.09.911.34.24.34.84.3
Table 4. Gross domestic expenditure on R&D as % of GDP; selected EU countries (source: Eurostat database).
EU 28Developed Economies (WE)Converging Economies (CEE)
AverageFranceGermanyItalyUKCzech Rep.HungaryLithuaniaPoland
20081.832.062.601.161.621.240.980.790.60
20111.972.192.801.211.661.561.190.900.75
20142.032.232.871.341.661.971.351.030.94
20172.062.193.021.351.661.791.350.891.03
Table 5. Shares of environmental taxes in total tax revenues (in %); selected EU countries (source: Eurostat database).
EU 28Developed Economies (WE)Converging Economies (CEE)
AverageFranceGermanyItalyUKCzech Rep.HungaryLithuaniaPoland
20086.034.325.686.226.546.816.765.347.74
20116.374.435.837.367.226.957.176.208.27
20146.334.455.218.327.476.186.526.318.08
20176.144.964.627.917.025.866.616.487.86
Table 6. Investment as % GDP; selected EU countries (source: Eurostat database).
EU 28Developed Economies (WE)Converging Economies (CEE)
AverageFranceGermanyItalyUKCzech Rep.HungaryLithuaniaPoland
200822.9123.6020.3321.2417.1528.9623.1526.0423.10
201120.6022.4220.2719.6515.5326.4519.6718.4820.68
201419.8821.8219.9916.7416.5825.1322.1718.8819.73
201720.7722.5120.3117.6217.1524.7722.2319.19n/a
Table 7. Model 1—results of panel data regression with fixed effects for the Central-Eastern European countries (converging economies); 88 observations, included nine cross-sectional units; Dependent variable (Y): Greenhouse_gases_emissions (GGE) (source: own analysis based on Eurostat data).
CoefficientStd. Errort-Ratiop Value
Const18,358.34780.273.84040.00028***
E1_Employment_in_high_&_medium_sect.−1345.83405.022−3.32290.00146***
E2_Investment_share_in_GDP88.958620.80484.27590.00006***
E3_Purchasing_power_adjusted_GDP0.9393440.2008544.67680.00001***
E4_Inequality_of_income_distribution−1286.72680.127−1.89190.06290*
sq_E1_ Employment_in_high_&_medium_sect.57.607123.59422.44160.01731**
sq_E3_ Purchasing_power_adjusted_GDP−1.63274 × 10−55.14176 × 10−6−3.17540.00227***
sq_E4_ Inequality_of_income_distribution103.60353.20651.94720.05577*
F1_Gross_domestic_expendit_on_R&D−2165.68929.304−2.33040.02285**
F2_Share_of_environmental_taxes1350.97556.0482.42960.01784**
sq_F1_ Gross_domestic_expendit_on_R&D640.327301.3422.12490.03734**
sq_F2_ Share_of_environmental_taxes−79.861131.5521−2.53110.01376**
C1_Energy_productivity−8689.061487.32−5.8421<0.00001***
sq_C1_Energy_productivity913.765177.6275.1443<0.00001***
Statistics and Test Results
Mean-dependent var.7823.511S.D.-dependent var3000.654
Sum-squared resid10,020,500S.E. of regression389.6483
LSDV R-squared0.987208Within R-squared0.660897
LSDV F(21, 66)242.5464p value (F)2.80 × 10−54
Log-likelihood−637.1501Akaike criterion1318.300
Schwarz criterion1372.802Hannan-Quinn1340.257
Rho−0.012608Durbin-Watson1.785745
Joint test on named regressors: F(13, 66) = 9.89471 with p = 4.60643 × 10⁻¹¹
Test for differing group intercepts: F(8, 66) = 53.0673 with p = 8.39721 × 10⁻²⁶
Note: the prefix ‘sq’ in the variable’s name indicates the quadratic form of the given variable, *, ** and *** denote significance of coefficients at 10%, 5%, and 1% levels, respectively.
Table 8. Model 2—results of panel data regression with fixed effects for the Western European countries (developed economies); 60 observations, included six cross-sectional units; Dependent variable (Y): Greenhouse_gases_emissions (GGE) (source: own analysis based on Eurostat data).
CoefficientStd. Errort-Ratiop Value
Const3449.592178.21.58370.11997
E1_Employment_in_high_&_medium_sect.350.195114.9323.04700.00379***
E2_Investment_share_in_GDP120.10916.52457.2685<0.00001***
F1_Gross_domestic_expendit._on_R&D−1032.17351.535−2.93620.00513***
F2_Share_of_environmental_taxes−873.614305.862−2.85620.00636***
sq_F2_ Share_of_environmental_taxes52.349421.75012.40690.02007**
C1_Energy_productivity1747.49478.1343.65480.00065***
sq_C1_Energy_productivity−134.51225.5734−5.2598<0.00001***
Statistics and Test Results
Mean-dependent var7405.777S.D.-dependent var2070.904
Sum-squared resid1,368,118S.E. of regression170.6133
LSDV R-squared0.994593Within R-squared0.929965
LSDV F(12, 47)720.4606p value (F)5.59 × 10−49
Log-likelihood−386.1744Akaike criterion798.3488
Schwarz criterion825.5752Hannan-Quinn808.9985
Rho−0.083384Durbin-Watson1.976225
Joint test on named regressors: F(7, 47) = 89.1566 with p = 5.93021 × 10⁻²⁵
Test for differing group intercepts: F(5, 47) = 287.814 with p = 4.98846 × 10⁻³⁴
Note: the prefix ‘sq’ in the variable’s name indicates the quadratic form of the given variable. **, *** denote significance of coefficients at 5%, and 1% levels, respectively.
Table 9. Contribution of the selected variables in Model 1 to dependent variable behaviour–converging countries (CEE); selected years (source: own analysis based on Eurostat data).
2008201120142017
E1_Employment_in_high_&_medium_sect.12%11%11%12%
E2_Investment_share_in_GDP5%4%4%4%
E3_Purchasing_power_adjusted_GDP22%23%23%24%
E4_Inequality_of_income_distribution8%8%8%8%
F1_Gross_domestic_expendit._on_R&D3%3%3%3%
F2_Share_of_environmental_taxes11%12%11%11%
C1_Energy_productivity39%39%39%39%
Note: estimation based on a ‘median country’ profile; in the case of non-linear relationship, the table presents a joint estimation for a given variable and its quadratic form.
Table 10. Contribution of the selected variables in Model 2 to dependent variable behaviour—developed countries (WE); selected years (source: own analysis based on Eurostat data).
2008201120142017
E1_Employment_in_high_&_medium_sect.13%12%12%13%
E2_Investment_share_in_GDP18%16%16%17%
F1_Gross_domestic_expendit_on_R&D12%13%14%14%
F2_Share_of_environmental_taxes22%23%24%24%
C1_Energy_productivity36%36%34%33%
Note: estimation based on a ‘median country’ profile; in the case of non-linear relationship, the table presents a joint estimation for a given variable and its quadratic form.

