Article

Study on Dust Deposition Mechanics on Solar Mirrors in a Solar Power Plant

1
School of Energy and Power Engineering, Huazhong University of Science and Technology, 1037 Luoyu Road, Wuhan 430074, China
2
Power Generation Branch, POWERCHINA Hubei Electric Engineering Corporation Limited, No.1 Xinqiaosi Road, Jinyinhu Street, Dongxihu District, Wuhan 430040, China
*
Author to whom correspondence should be addressed.
Energies 2019, 12(23), 4550; https://doi.org/10.3390/en12234550
Submission received: 18 October 2019 / Revised: 13 November 2019 / Accepted: 28 November 2019 / Published: 29 November 2019
(This article belongs to the Section B: Energy and Environment)

Abstract

:
Solar energy is considered to be one of most promising renewable energy sources because of its availability and cleanliness. The phenomenon of dust deposition on solar mirrors greatly reduces the power generation of solar power plants. In this work, the motion behaviors and deposition mechanics of dust particles are analyzed by the discrete element method (DEM). The effects of environmental and solar mirror conditions and particle self-factors on dust deposition weight are systematically studied here. The research results show that dust particles, after particle collision, immediately adhere to the mirror or rebound and finally flow away from the mirror, or they otherwise may remain stationary after making some relative motion. Alternatively, they may glide for some distance and finally come to rest on the mirror or leave from the system. Different motion behaviors after particle collision depend on different leading forces. Here, the leading forces are the liquid bridge force (Fc) and the contact force (Fb). When the leading forces are Fc, or Fc, and Fb, the dust particles will be deposited on the solar mirror. Besides, the force Fc cannot be negligible when studying the motion processes of dust particles. The dust deposition weight on solar mirrors can be controlled by altering the environmental and solar mirror conditions, and particle self-factors. In essence, dust deposition weight on solar mirrors decreases when decreasing the leading force Fc or increasing the leading force Fb. The research results give theoretical guidance for the prevention and removal of dust deposition on solar mirrors.

Highlights

  • The effects of the environmental conditions, solar mirror conditions, and particle self-factors on dust deposition weight have been systematic studied.
  • The leading forces during the motion process of dust particles are Fc or Fb based on Equations (14)–(16). When the leading forces are Fc, or Fc and Fb, the dust particles will be deposited on the solar mirror.

1. Introduction

Solar energy is considered to be one of most promising renewable energy sources for its availability (it is natural, abundant, and free) and cleanliness (it is free from emission and noise) [1]. The phenomenon of dust deposition on solar mirrors seriously affects reflectivity and transmittance, thus reducing the power generation of solar power plants [2,3,4,5]. Therefore, dust deposition on solar mirrors has attracted a great deal interest from many researchers. Many of these authors have stated that dust accumulation on solar cells reduces solar thermal efficiency [6,7,8]. Yadav et al. [9] have carried out many simulations and experiments that investigate the motion behaviors of dust particles on heliostats. In their work, they found that the dust deposition distribution on a single heliostat was uniform. Kaldellis et al. [10] have studied the effect of dust particle deposition on mirror surface output. In their work, they found that dust deposition caused a significant reduction in the conversion efficiency of solar energy. Imad et al. [11] have performed a number of experiments investigating the influence of regular cleaning on the output power of solar mirrors. In their work, they found that dust deposition caused a reduction in power generation at a solar power plant. Nikni et al. [12] have studied the thermal performances of a parabolic trough collector, including the thickness and weight of dust particles deposited on the mirrors. They found that dust deposition on the mirrors greatly influences the reflectivity of the mirror and sharply decreases the performance and overall efficiency of the collector. Kaldellis et al. [13] have studied dust particle deposition on photovoltaic-assisted water pumping systems. They found that the performance of the photovoltaic mirror decreased due to dust deposition. Thus, dust deposition on solar mirrors can significantly reduce the conversion performance of solar mirrors. In this regard, it is meaningful to investigate the motion processes and deposition mechanics of dust particles.
At present, most studies have numerically investigated the effects of wind speed, particle size, and inclination angle on the flow characteristics of air and dust deposition states. Sayyah et al. [14] have investigated the effects of the inclination angle and particle size on energy yield loss and the dust deposition state. Many researchers have studied the effect of the inclination angle of solar mirrors on the dust deposition state [15,16,17,18,19]. Lu and Zhang [20] have studied the dust deposition state for a building-integrated photovoltaic system at different roof inclinations and wind speeds using a computational fluid dynamics (CFD) model. Besides, they have simulated dust particle behaviors using a shear-stress transport (SST) k-ω turbulence model and a discrete particle model (DPM). The results showed that dust deposition rate increased with the decrease of wind speed. Lu and Hajimirza [21] have studied the effect of the inclination angle on the maximum optical efficiency for removing dust accumulation on solar cell surfaces. Lu et al. [22] have studied dust deposition characteristics on the solar mirrors using CFD method. Their result show that the peak deposition rates on solar mirrors reached a maximum value when the dust particles were medium in size. Boddupalli et al. [23] have investigated the air motion characteristics behind a heliostat via Reynolds-averaged Navier-Stokes (RANS) equations and large eddy simulation (LES). In their works, they found that an instantaneous stream-wise vorticity contour could cause non-uniform dust deposition on a heliostat, recommending a wake-based distance parameter as the minimum distance between any two consecutive heliostats.
In recent years, the discrete element method (DEM) has become a popular and reliable numerical tool to investigate the motion characteristics of fluids and particles, where the results are based on particle collisions [24,25,26,27]. In their work, based on the DEM, the simulated results, such as particle residence time, particle motion characteristics, and minimum fluidization velocity, were in good agreement with the experimental results and actual multiphase transport phenomena. The DEM was chosen in this paper to investigate the deposition mechanics of dust particles on solar mirrors.
However, up until now, little detailed information has been available on the deposition mechanics of dust particles on the solar mirror. Besides, few articles are available that systematically study the effects of the environmental and solar mirror conditions and particle self-factors on dust deposition weight. Given that the deposition mechanics of dust particles play an important role in investigating the prevention and removal of dust deposition on solar mirrors, investigation of the deposition mechanics of dust particles and a systematic study on the effects of the aforementioned factors on the dust deposition weight are of great theoretical significance and engineering value.
In view of the aforementioned considerations, the purpose of the present work is to study the deposition mechanics of dust particles and to investigate the effects of the environmental and solar mirror conditions and particle self-factors on dust deposition weight. The organization of the rest of the paper is as follows. Section 2 gives a brief introduction to the background and theoretical foundation of dust particle motions via the Engineering Discrete Element Method (EDEM) tool. Section 3 gives a detailed analysis and discussion of the deposition mechanics of dust particles, revealing the leading force during the motion process and studying the effects of the environmental and solar mirror conditions and particle self-factors on dust deposition weight. Section 4 summarizes the research work and conclusions of this paper and presents specific topics to approach in the future.

2. Model Description

2.1. Particle Motion Balance

Based on Newton’s second law, the discrete element model (DEM) was chosen to investigate the process of dust particle deposition. In the dust deposition process, dust particles are acted on by the force of gravity, Van Der Waals force, electrostatic force, contact force, buoyant force, liquid bridge force, and other forces. Therefore, the particle motion balance can be calculated as follows:
m d u d t = F g + F a + F b + F c + F e + F d + F x
where Fg is the force of gravity, Fa denotes the Van Der Waals force (shown in Figure 1), Fb is the contact force, including the dust particle-dust particle and dust particle-solar mirror forces, Fc represents the liquid bridge force of the dust particle, Fe is the electrostatic force, Fd is the buoyant force, Fx represents the other forces acting on the dust particle, such as, the thermal swimming force, the pressure gradient force, the Saffman force and the added mass force. Since the size of the dust particle is not within the microscopic molecular size range, the pressure gradient force, the added mass force, the thermal swimming force, the Saffman force, and the other forces can be neglected in this work [28].
The expressions of Fg and Fa are given in Equations (2) and (3) [29], respectively:
F g = m g
F a = ϖ 8 π [ r l 0 2 + r ( l 0 + 2 r ) 2 2 r l 0 ( l 0 + 2 r ) ]
where ϖ is the Lifshitz constant, r represents the dust particle radius, l0 is the average distance between molecules, m denotes the dust particle mass, and g represents acceleration due to gravity.
Based on the soft-sphere model, the software EDEM was used as a simulation tool to study the contact force Fb in this paper. The expression of Fb is shown in Equation (4). It can be seen from Equation (4) that Fb can be divided into two components, namely, the normal component force (Fbn) and the tangential component force (Fbt).
F b = F b n + F b t
Due to the dust particle deposition on the solar mirror, the Hertz-Mindlin and Johnson Kendall Roberts (JKR) models were chosen to investigate the aforementioned two components in this paper [30]. The expression of Fbnij and Fbtij between particles “i” and “j”, or between the dust particle and solar mirror are correspondingly shown in Equations (5)–(7):
F b n i j = ( k n α 1.5 c n v i j n ) n
F b t i j = k t δ c t v c t | F b t i j | μ s | F b n i j |
F b t = μ s | F b n i j | n t | F b t i j | > μ s | F b n i j |
where kt and kn represent the spring constant in the tangential and normal directions, respectively, δ and α denote the tangential displacement and normal displacement, respectively, ct and cn are the damping coefficients in the tangential and normal directions, respectively, µs denotes the friction coefficient, vij is the relative velocity between particles “i” and “j”, n is the unit vector from particle “i” to particle “j”, nt represents the tangential unit vector, and vct denotes the sliding velocity vector.
The Mikami model was used to calculate force Fc in this paper [31]. The expression of Fc is shown as follows:
F c = π r γ ( e A h * 2 r + B + C )
In the above equations, γ is the liquid surface tension, and symbols A, B, and C are the corresponding functions of the dimensionless liquid bridge volume (V*) and solid-liquid contact angle [31].
The expression of Fe is given in Equation (9):
F e = F e e + F e l + F e s
It can be known from Equation (9) that Fe is determined by three electrostatic component forces, namely, Fee, Fel, and Fes [32,33]. Fee is the electrostatic image force and the expression of Fee is shown in Equation (10). Fes is the electrostatic image force, and the expression of Fes is shown in Equation (11). Fel is the electrical double layer force, and the expression of Fel is shown in Equation (12).
F e e = σ Q ε 0
F e s = Q 2 4 ε ε 0 ( 2 r + l 0 ) 2
F e l = π ε ε 0 r U 2 r + l 0
In the above equations, ε denotes the dielectric constant between dielectrics, Q is the electric charge of dust particle, σ is the surface charge density of the solar mirror, U represents the contact potential difference, and ε0 is the absolute dielectric constant.
The expression of Fd is given in Equation (13).
F d = ρ a i r V g
where V is the dust particle volume and ρair is the air density.

2.2. Model Assumptions and Simulation Conditions

A three-dimensional computational domain was chosen to investigate and analyze the motion characteristics and deposition process of dust particles in this work. Figure 2 shows the geometric model and computational domain of the solar mirror. The solar mirror was flat and inclined, 60 mm in both length and width, and 3 mm in thickness, as shown in Figure 2. The left side of the computational domain could generate dust particles in this work. Meanwhile, all dust particles were uniformly spherical and did not have any change in shape during particle motion process.
It can be known from the previous study that numerous dust particles are deposited on the solar mirror [1,2,3,4,5,6,7,8,9,10,11,12,13]. As a result, the performance and overall efficiency of the solar power plants will sharply decrease. Few papers have investigated the motion characteristics and deposition process of dust particles. Although almost always solar power plants are located at a high altitude, high temperature, and intense radiation zone, the effect of the moisture content of dust particles on the deposition process cannot be neglected. It can be learned from the meteorological report of the solar power plant in Qinghai province, China, that the relative moisture content of dust particles is 0.01–0.26% [34]. This paper studies the effect of the relative moisture content of dust particles on the motion characteristics of said dust particles and assesses the effect of the liquid bridge force (Fc) on the deposition process of dust particles. The dimensionless liquid bridge volume (V*) parameter was chosen to study the effect of the relative moisture content of dust particles on the dust deposition process in this work. Under the role of each force, this paper tries to find the leading force affecting the deposition process. Meanwhile, this works systematically studies the effects of the environmental conditions (such as wind speed and air humidity), solar mirror conditions (such as geometric properties, clear or dusty mirror), and particle self-factors (such as diameter and moisture content of dust particles) on the deposition process. Optimizing the aforementioned factors, this paper attempts to find the conditions resulting in the least amount of dust deposition. Thus, the results will be meaningful for providing theoretical guidance and engineering values for the future removal of dust particles.
Table 1 shows the parameters of the properties of the dust particles and solar mirror, and all the simulation conditions of this work. Besides, the Hertz-Mindlin and JKR models were used to calculate the contact forces between interparticles and those between the dust particle and solar mirror in this work. Meanwhile, to verify the accuracy of the Mikami model, the EDEM results and theoretical data are compared in Figure 3. It can be learned from Figure 3 that the relative error of the liquid bridge force of dust particles between the EDEM results and theoretical data is less than 3.0%. Thus, the EDEM results based on the Mikami model can be adopted in this paper.

3. Results and Discussion

3.1. Motion Characteristics of Dust Particle

3.1.1. Motion Behaviors of Dust Particle

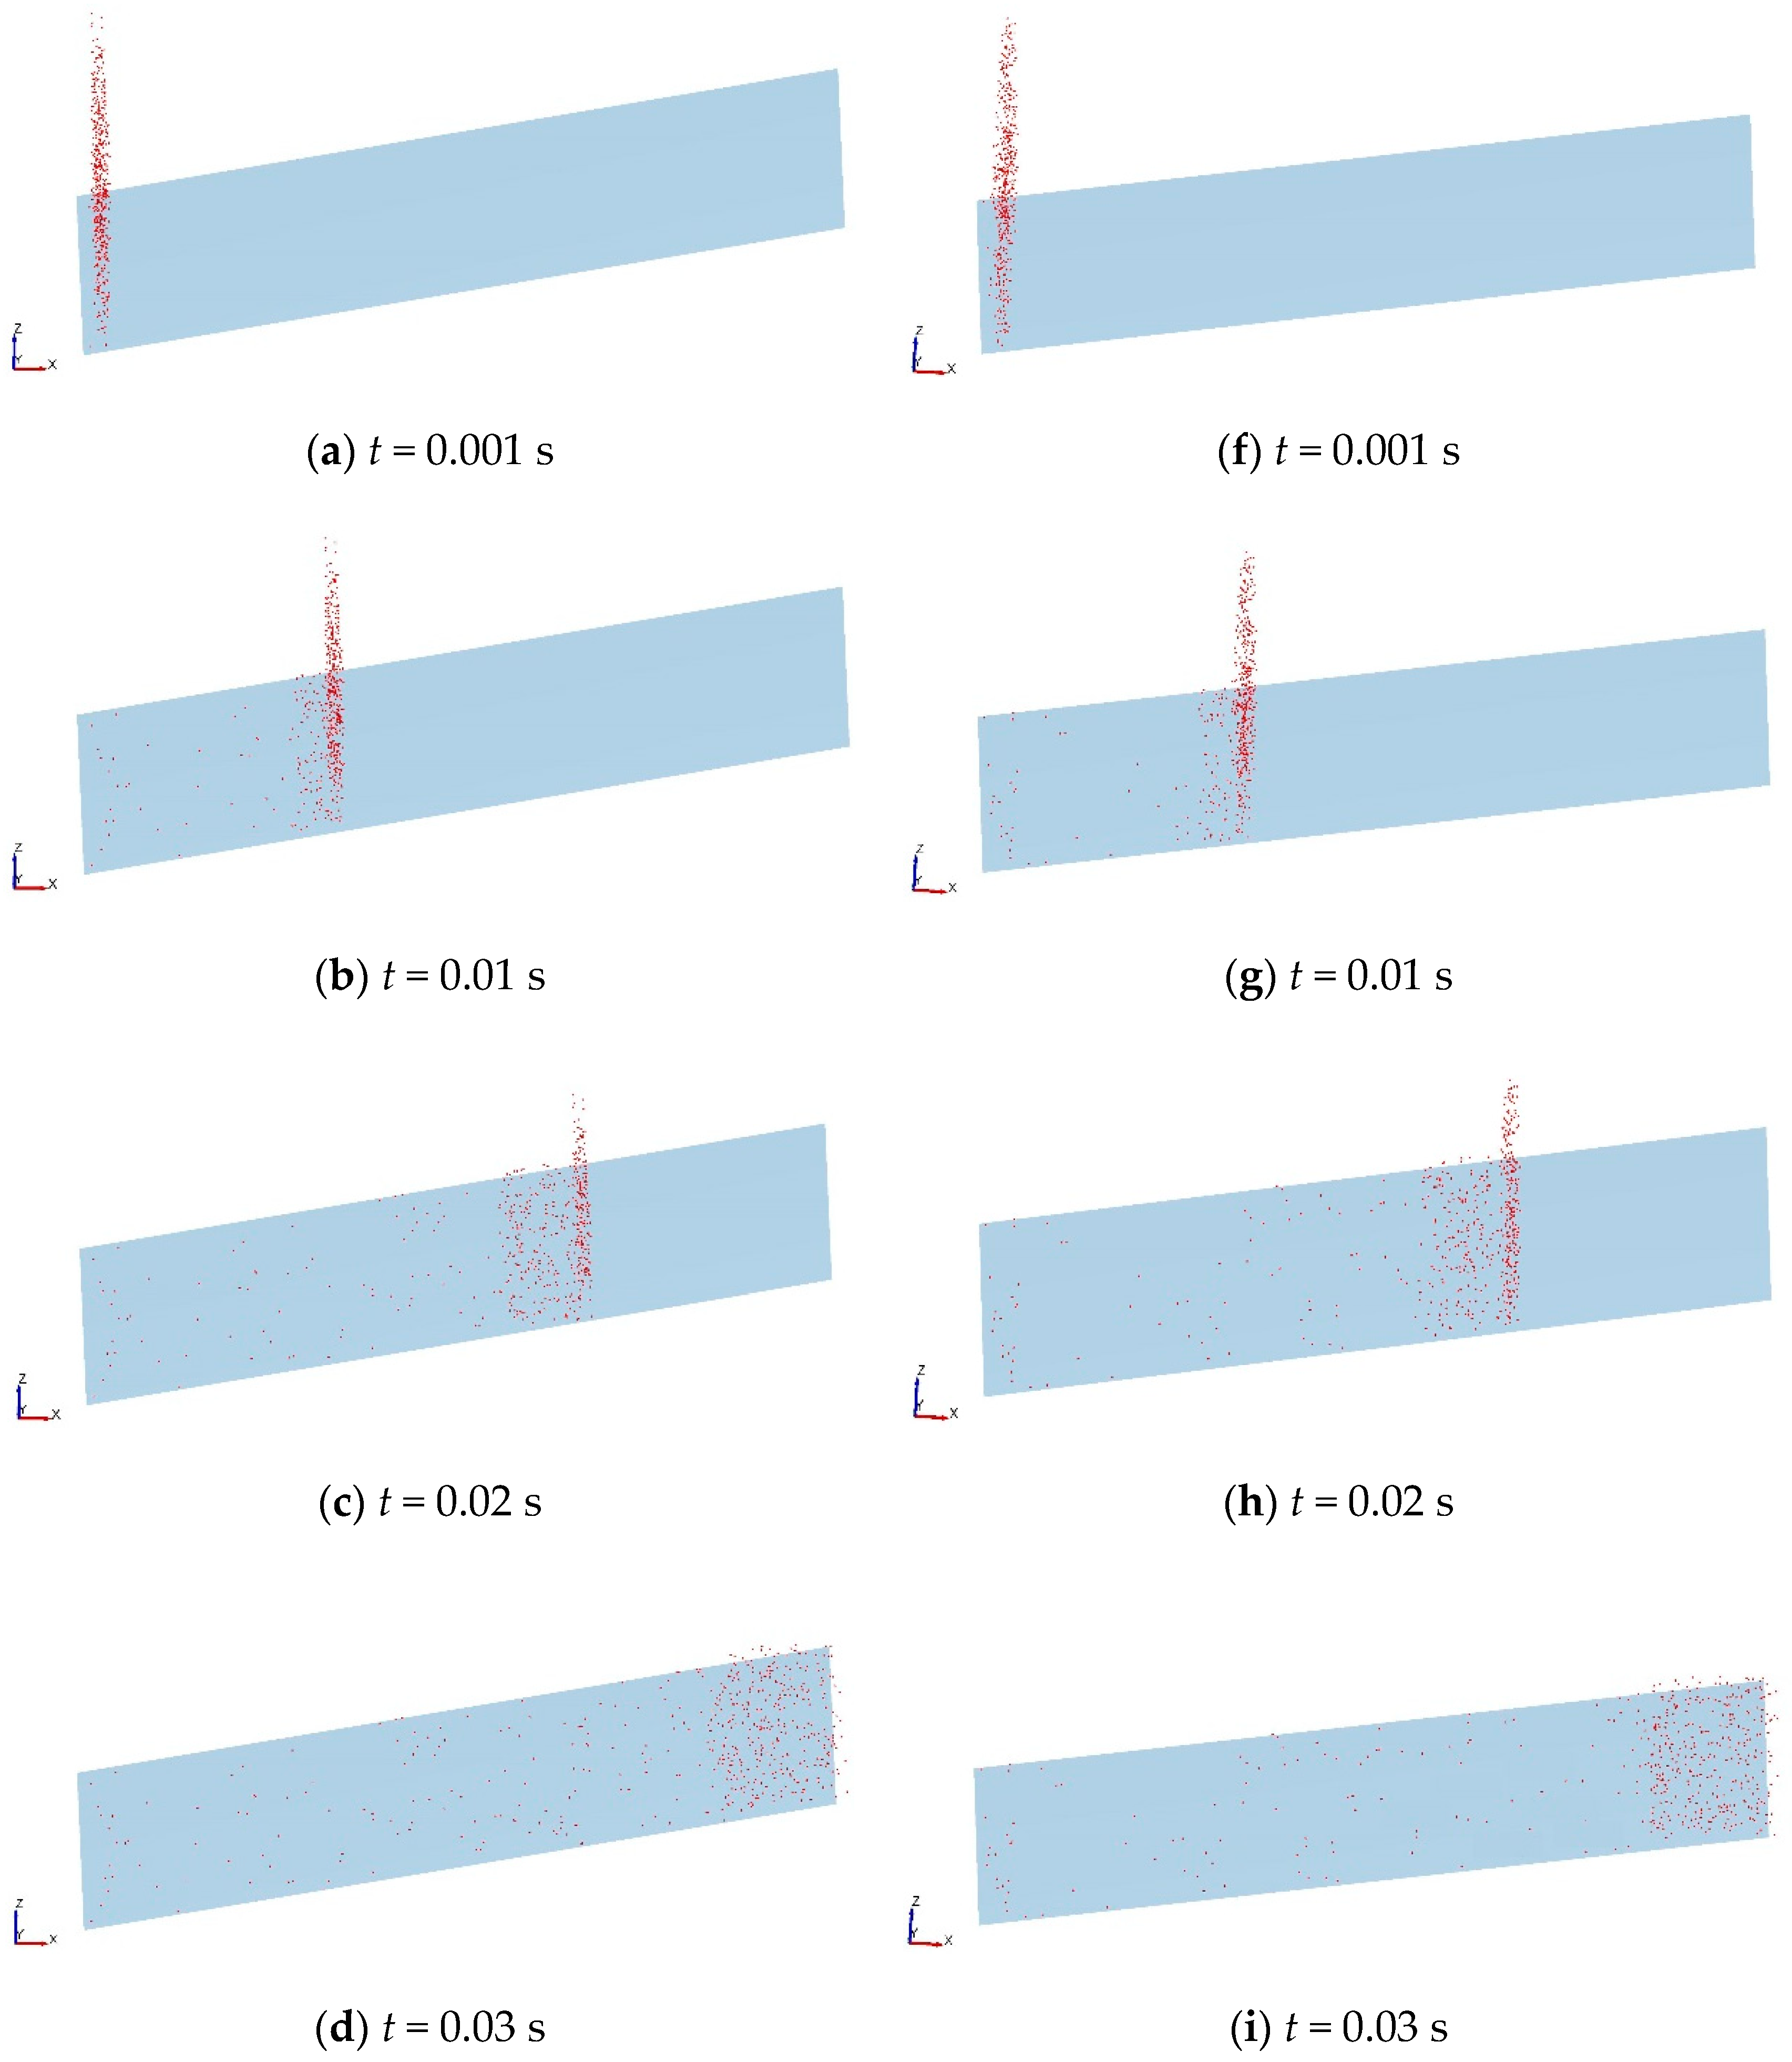
From the work of previous studies [1], it can be learned that studying the motion process of dust particles is helpful to reveal their deposition mechanism. Figure 4 shows the motion process of dust particles on a clear solar mirror, with or without the liquid bridge force (Fc). It can be seen from Figure 4 that dust particles are initially accelerated by the air that collides with the solar mirror or adjacent dust particles, then interacting with the mirror and adjacent dust particles, finally staying on the solar mirror or flowing away from the solar mirror. It can be observed from Figure 4 that although many dust particles after particle collisions leave the mirror, there are still a considerable number of dust particles that remain on the mirror. By comparison with the results of Figure 4f–j, the results of Figure 4a–e show that due to the force Fc, the particle concentration of Figure 4e is greater than that of Figure 4j. This is because some dust particles, after particle collision, adhere on the solar mirror or agglomerate with other dust particles deposited on solar mirror, due to the effect of the force Fc. Without consideration of the force Fc, the dust deposition weight of the solar mirror will be greatly underestimated. Thus, the phenomenon that a considerable number of dust particles are deposited on solar mirrors can be discovered in this work. Besides, the liquid bridge force should not be ignored during the motion process of dust particles.
Dusty solar mirrors are more common than clear solar mirrors in the studied solar power plant. Studying the motion process of dust particles on the solar mirror can give theoretical guidance to investigate the deposition mechanics of dust particles. Meanwhile, it is very important to study and assess the motion behaviors of dust particles during the motion process of dust on dusty solar mirrors. Figure 5 shows the motion behaviors of dust particles on dusty solar mirrors. It can be seen from the comparison of Figure 4e with Figure 5a that due to the dusty solar mirror having more dust particles deposited on the mirror, the particle concentration of Figure 5a is greater than that of Figure 4e. The motion process of dust particles on dusty solar mirrors is basically similar to that of clear solar mirrors. It can be seen from Figure 5 that because of the force Fc, the particle concentration of Figure 5a is larger than that of Figure 5b on the dusty solar mirror in question. This is because some dust particles after collision immediately adhere to the mirror due to the effect of the force Fc. Alternatively, they may remain stationary after making relative motion with the dust particles or the mirror, or glide for some distance and finally come to rest on the mirror. Without consideration of the force Fc, the dust deposition weight of the solar mirror will be found to be a smaller value than on the dusty solar mirror. Thus, the phenomenon of numerous dust particles deposited on the dusty solar mirror can be also found in this study. Meanwhile, the force Fc cannot be negligible when studying the motion process of dust particles on dusty solar mirrors.

3.1.2. Analysis of Forces Acting on Dust Particle

According to the results of Figure 4 and Figure 5, it can be known that the liquid bridge force (Fc) plays an important role in motion process of dust particles in the solar mirror field. In order to investigate and reveal the deposition mechanics on the solar mirror in question, it is very necessary to analyze the forces acting on a dust particle when the dust particles collide with the mirror or adjacent dust particles. Figure 6 shows an analysis of the forces acting on the dust particle on the solar mirror. It can be known from Figure 6 that the forces acting on the dust particle include the force of gravity (Fg), Van Der Waals force (Fa), contact force (Fb), liquid bridge force (Fc), electrostatic force (Fe), and buoyant force (Fd). Through theoretical analysis and the calculation of Equations (2)–(12), the magnitudes of Fg, Fa, Fe, and Fd are less than 2 × 10⁻⁹ N, but the magnitude of Fc and Fb are larger than 1 × 10⁻⁶ N. Therefore, based on Figure 6 and Equations (2)–(12), the forces Fc or Fb can be the leading forces when compared with forces Fg, Fa, and Fe during the particle motion process. When Fc > Fby, the leading force is Fc, and the dust particles, after collision, will adhere on the mirror or adhere to dust particles deposited on the mirror. When Fby is much greater than Fc, the leading force is Fb, and the dust particles, after collision, will rebound and then flow away from the solar mirror. When Fc < Fby, the leading force is Fb, or Fc and Fb, and the particle motion process will be complex, and the dust particles, after collision, will remain stationary after making some relative motion with the dust particles or the mirror, or else they will glide for some distance and finally come to rest on the mirror or else leave. Thus, the leading force of dust particles during the motion process is the contact force (Fb) or liquid bridge force (Fc). Whether dust particles are deposited on the solar mirror or not depends on the leading force. Different leading forces can make different motion behaviors after particle collision in the motion process of dust particles.

3.2. Dust Deposition Weight on Solar Mirror

The environmental and solar mirror conditions and particle self-factors have great impact on the motion characteristics and deposition weight of dust particles on the solar mirror. Besides, the dust deposition weight greatly influences the conversion performance of the solar mirror [12]. The conversion performance of the solar mirror gets better when the dust deposition weight decreases sharply. Thus, it is valuable to investigate the effects of the environmental condition, solar mirror conditions, and particle self-factors on the dust deposition weight on the solar mirror.

3.2.1. Environmental Condition (EC)

The wind speed parameter (u0) is used to be described the effect of environmental condition (EC) on the dust deposition weight on the solar mirror. Figure 7 shows effect of u0 on dust deposition weight on the solar mirror. It can be observed from Figure 7 that when 0.5 m/s < u0 < 1.2 m/s, the dust deposition weight has no change with an increase of u0. When 1.2 m/s < u0 < 3.0 m/s, dust deposition weight decreases with the increase of u0. When 3.0 m/s < u0 < 12 m/s, the dust deposition weight trends to zero with the increase of u0, which is similar to the fluid with high velocity scouring the mirror. This is because when 0.5 m/s < u0 < 1.2 m/s, the weak wind speed results in a weak contact force (Fb), making almost all dust particles stay on the solar mirror because of the effect of the leading force Fc. Meanwhile, when 3.0 m/s < u0 < 12 m/s, the kinetic energy of dust particles is a high value after particle collision, making almost all dust particles rebound and flow away due to the effect of leading force Fb. On the other hand, when 1.2 m/s < u0 < 3.0 m/s, the kinetic energy of dust particles increases with the increase of u0 after particle collision, making some particles finally adhere on the mirror with the great effect of forces Fb and Fc. Thus, the parameter u0 greatly influences the motion behaviors of dust particles during the motion process. Dust deposition weight on the solar mirror decreases with the increase of the parameter u0.

3.2.2. Solar Mirror Conditions (SMC)

The inclination angle of solar mirror (θ) and surface condition parameters were used to describe the effect of the solar mirror conditions (SMC) on the dust deposition weight on the solar mirror. Figure 8 shows the effect of θ on the dust deposition weight on the solar mirror. It can be seen from Figure 8 that the dust deposition weight on the solar mirror reaches a maximum value at approximately θ = 45°. This is because the motion energy of dust particles increases with an increase of θ after particle collision, making more particles leave the mirror. However, Fby decreases with the increase of θ after particle collision, resulting in more dust particles staying on the mirror. Therefore, dust deposition weight reaches a maximum value at approximately θ = 45° for both u0 = 2.0 m/s and u0 = 2.2 m/s. Meanwhile, it can be seen from Figure 8 that the dust deposition weight on the solar mirror decreases with the increase of u0 at same value of θ, which is in accordance with the result of Figure 7. Thus, the parameter θ greatly influences the motion characteristics of dust particle. Dust deposition weight on the solar mirror reaches a maximum value at approximately θ = 45°, and reasonably setting the parameter θ of the solar mirror can reduce dust deposition weight.
Figure 9 shows the effect of the surface conditions on the dust deposition weight on the solar mirror. The surface conditions of the solar mirror can be classed into two kinds of solar mirror, namely, a clear solar mirror and dusty solar mirror. It can be seen from Figure 9 that the dust deposition weight of the dusty solar mirror is larger than that of the clear solar mirror. This is because the dusty solar mirror shortens the magnitude of the force Fb compared with clear solar mirror, making more dust particles deposit on the solar mirror. As a result, the dust deposition weight on the solar mirror increases when the degree of dust on solar mirror increases. Meanwhile, whatever the solar mirror is clear or dusty, dust deposition weight rises with the increase of the diameter of dust particle (dp). This is because according to Equation (8), the liquid bridge (Fc) increases when the parameter dp rises. Thus, surface conditions play a great impact on dust deposition weight on the solar mirror. Dust deposition weight on the solar mirror decreases with a decrease in the degree of dust on the solar mirror.

3.2.3. Particle Self-Factors (PSF)

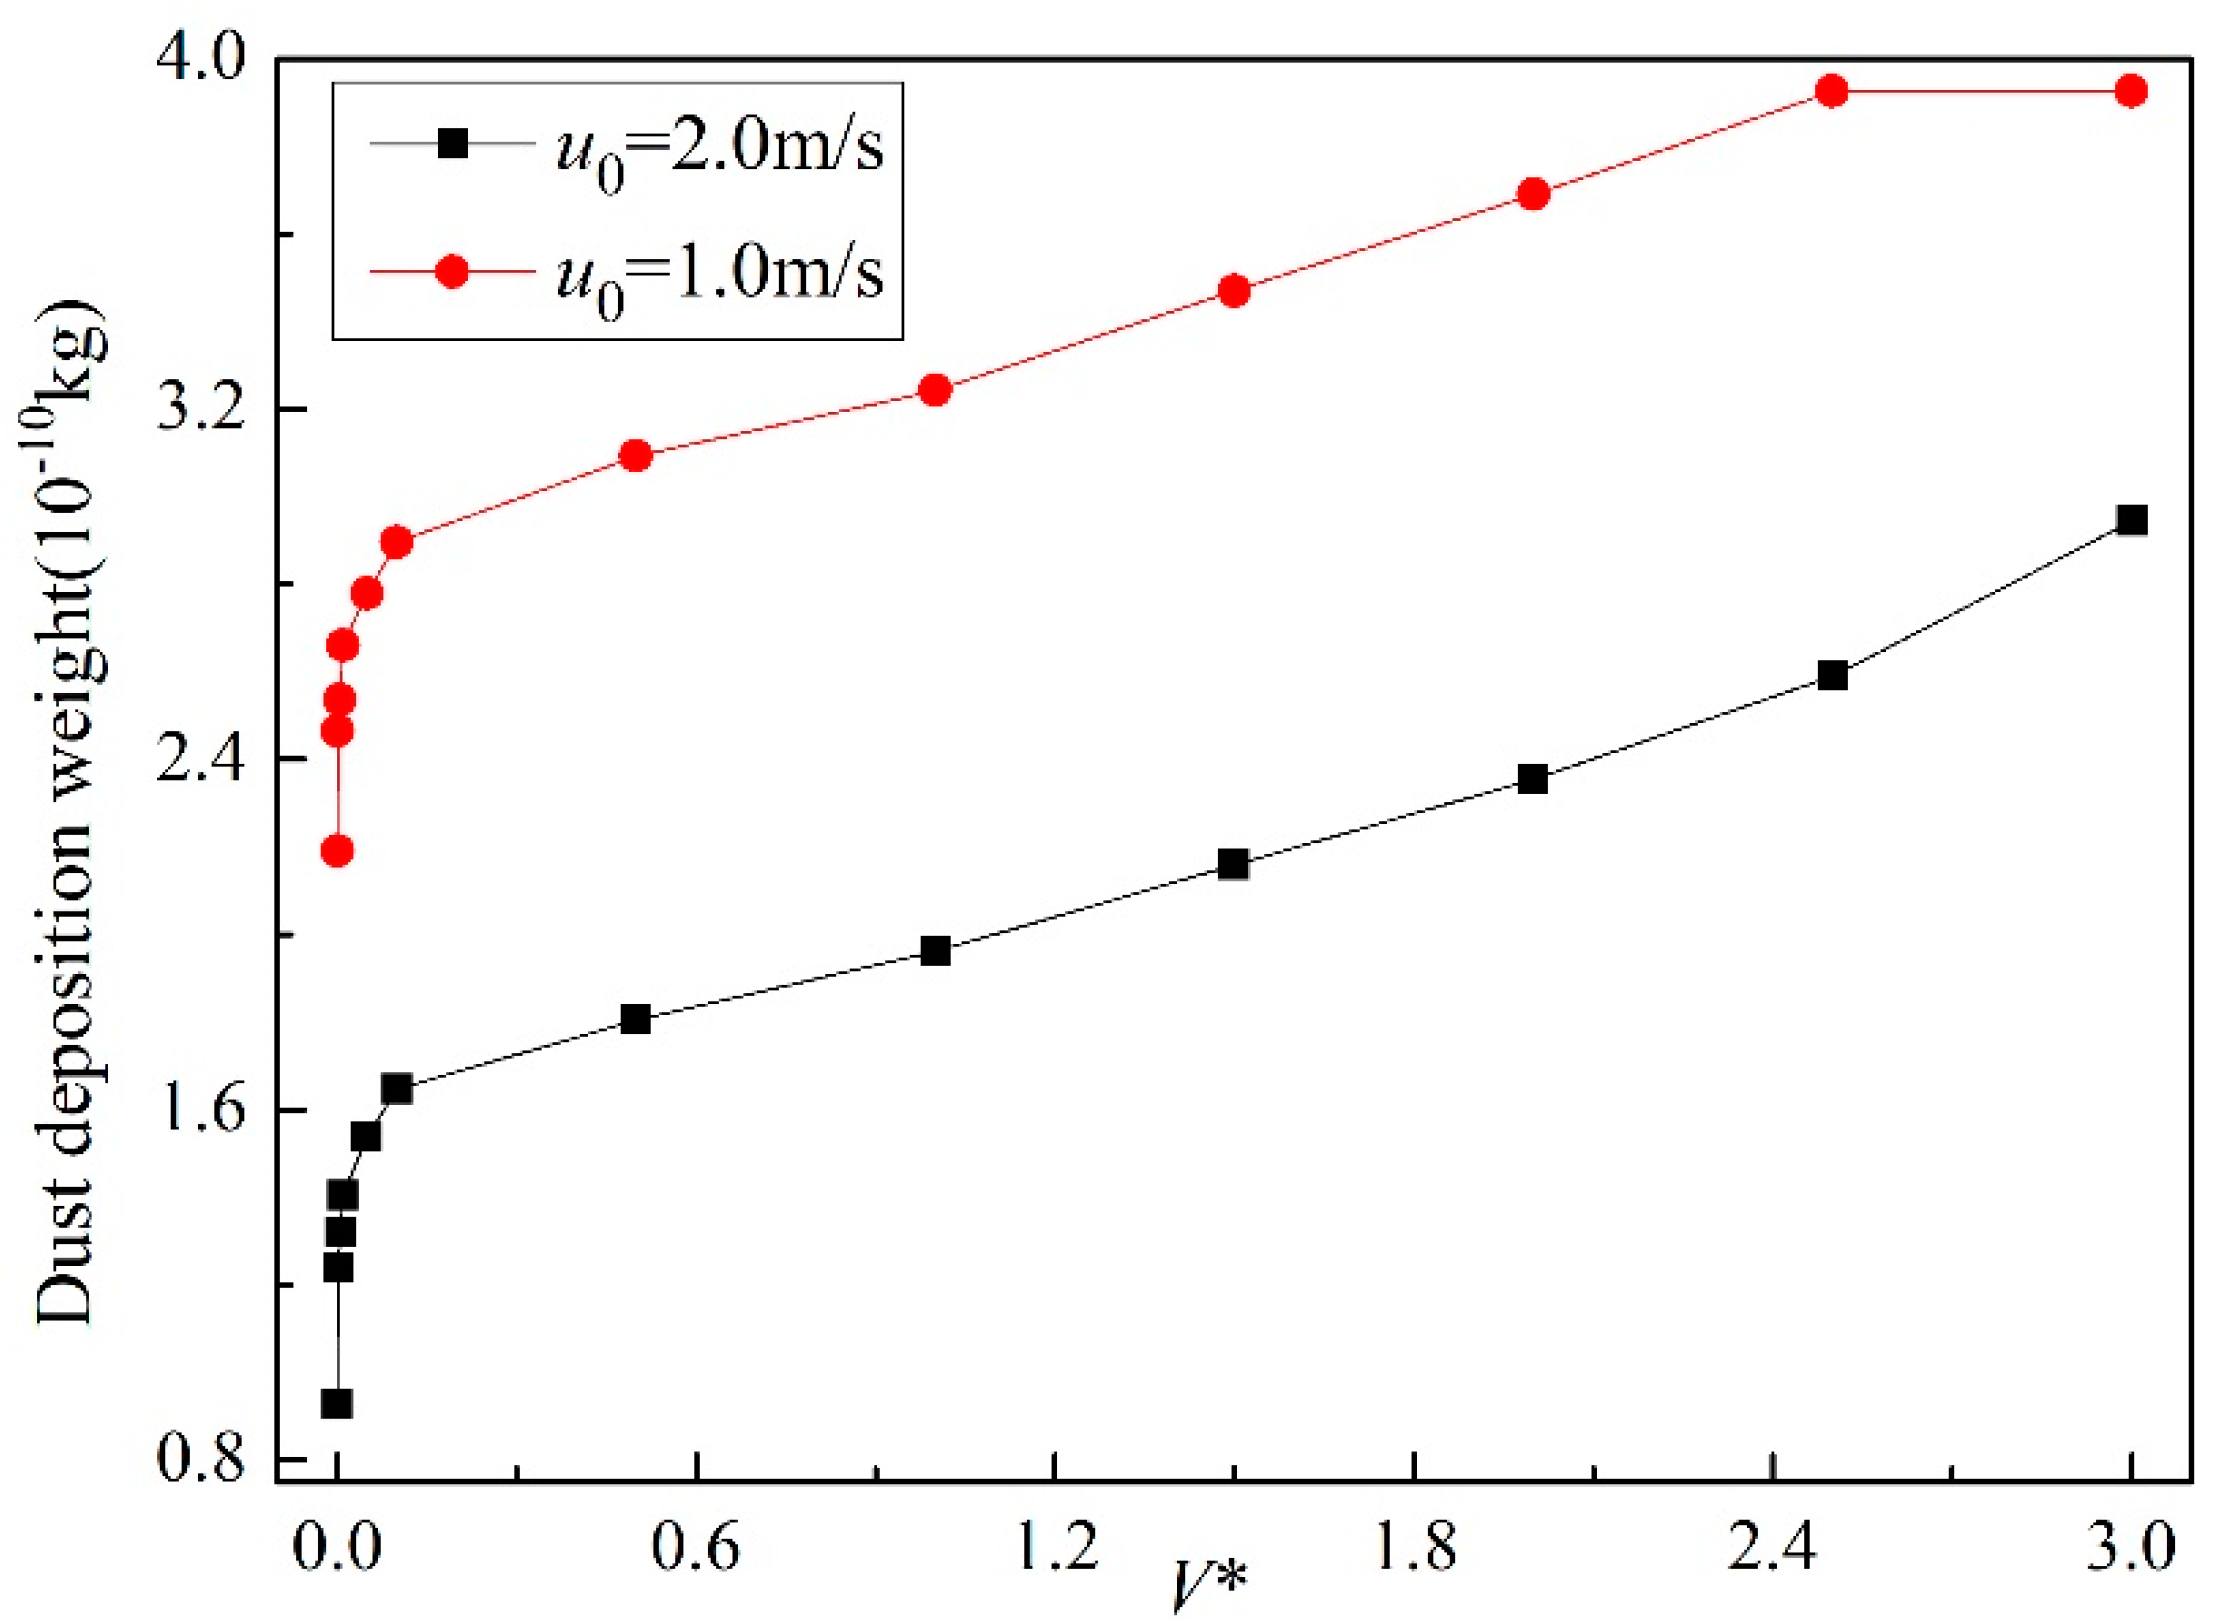
The dimensionless liquid bridge volume (V*), diameter of dust particle (dp) and initial concentration of dust particle (cp) parameters were chosen to be describe the effect of particle self-factors (PSF) on the dust deposition weight of dust particles on the solar mirror. Figure 10 shows the effect of the dimensionless liquid bridge volume (V*) on the dust deposition weight on the solar mirror. It can be observed from Figure 10 that the dust deposition weight on the solar mirror increases when V* goes up. This is because the liquid bridge (Fc) goes up when the parameter V* increases, based on Equation (8). Besides, it can be seen from Figure 10 that although at low V* and high u0 values, there are still many dust particles that are deposited on the solar mirror because of the great effect of the force Fc. When the parameter V* is high, the dust deposition weight on the solar mirror increases with the increase of V*, as the force Fc is the leading force during the motion process, making more dust particles stay on the mirror. On the other hand, it can also be seen from Figure 10 that the dust deposition weight on the solar mirror decreases when u0 increases to be the same value as V*. This is because increasing u0 can make the force Fb rise and cause more dust particles to flow away from the mirror. Thus, the force Fc cannot be neglected in studying the motion characteristics of dust particles, and even at some value of u0, many dust particles with a low V* still adhere on the mirror, as the leading force is the force Fc. Decreasing the parameter V* can make the dust deposition weight on the solar mirror go down.
Figure 11 shows the effect of the diameter of the dust particles (dp) on the dust deposition weight on the solar mirror. It can be observed from Figure 11 that the dust deposition weight on the solar mirror increases when dp goes up. This is because the liquid bridge (Fc) goes up when the parameter dp increases, based on Equation (8). Therefore, decreasing the diameter of incoming dust particles can make the dust deposition weight on the solar mirror go down.
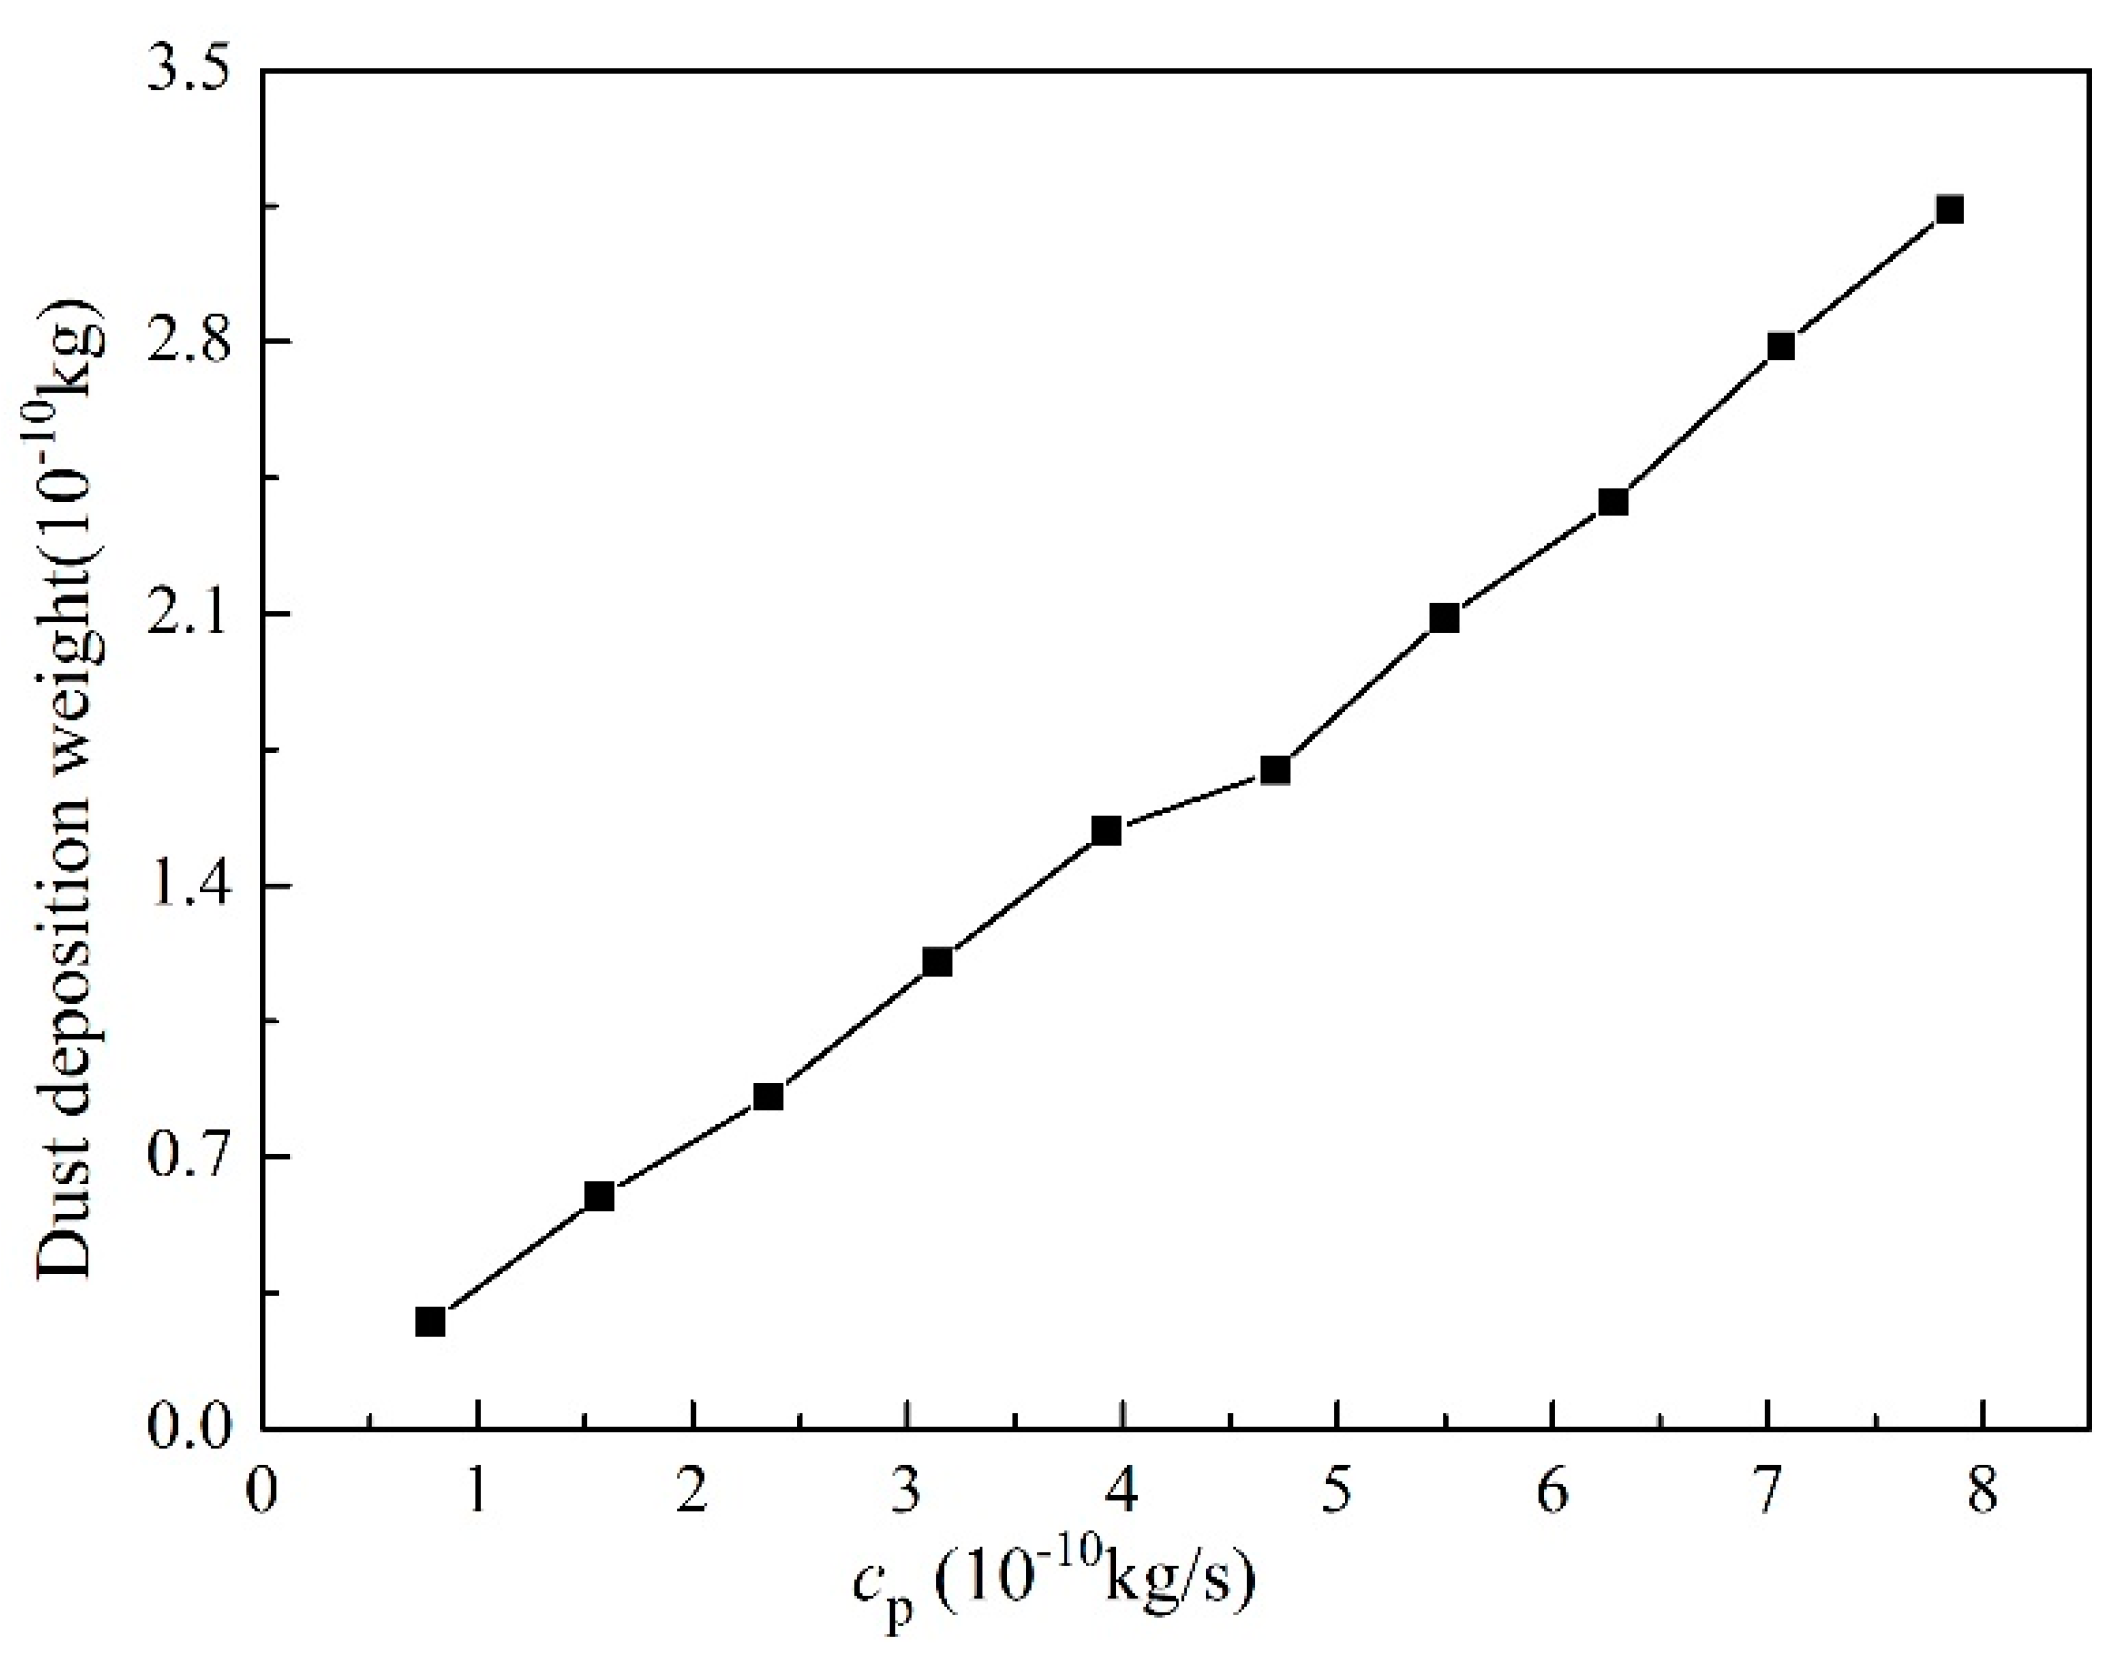
Figure 12 shows the effect of the initial concentration of dust particles (cp) on the dust deposition weight on the solar mirror. It can be observed from Figure 12 that the dust deposition weight on the solar mirror increases when cp goes up. This is because the increasing particle concentration makes the particle collisions occur more frequently. Therefore, the contact force (Fb) gradually decreases with every particle collision, causing more dust particles to stay on the solar mirror. Therefore, decreasing the parameter cp can make the dust deposition weight on the solar mirror go down.

3.3. Comparison of Dust Deposition Weight Among EC, SMC, and PSF

Based on the previous analysis and results, it can be known that the environmental condition (EC), solar mirror conditions (SMC), and particle self-factors (PSF) greatly influence the dust deposition weight on the solar mirror. Figure 13 shows an analysis chart of the factors affecting the dust deposition weight of dust particles. It can be learned from Figure 13 that the dust deposition weight is a function of u0, θ, degree of dust, V*, dp and cp, is a function of the EC, SMC and PSF, is also a function of Fb and Fc. Besides, the parameters u0, θ, the degree of dust, V* and cp alter the value of the contact force Fb, and the parameters V* and dp alter the value of the liquid bridge force Fc. The force Fc should not be ignored, and the forces Fb and Fc are the leading forces of dust particles during the motion process. Decreasing the dust deposition weight on the solar mirror can be helpful for the good performance of the solar power plant. Some measures can be taken to control the dust deposition weight on the solar mirror. Increasing the parameter u0 and decreasing the degree of dust, V*, dp, and cp can make more dust particles flow away from the solar mirror. Meanwhile, reasonable design of the geometric dimensions (the parameter θ) and surface conditions can greatly reduce the dust deposition weight on the solar mirror. Thus, the dust deposition weight on solar mirror can be reduced by altering the environmental condition, solar mirror conditions, and particle self-factors. In essence, decreasing dust deposition weight on solar mirror by decreasing the force Fc or increasing the force Fb.
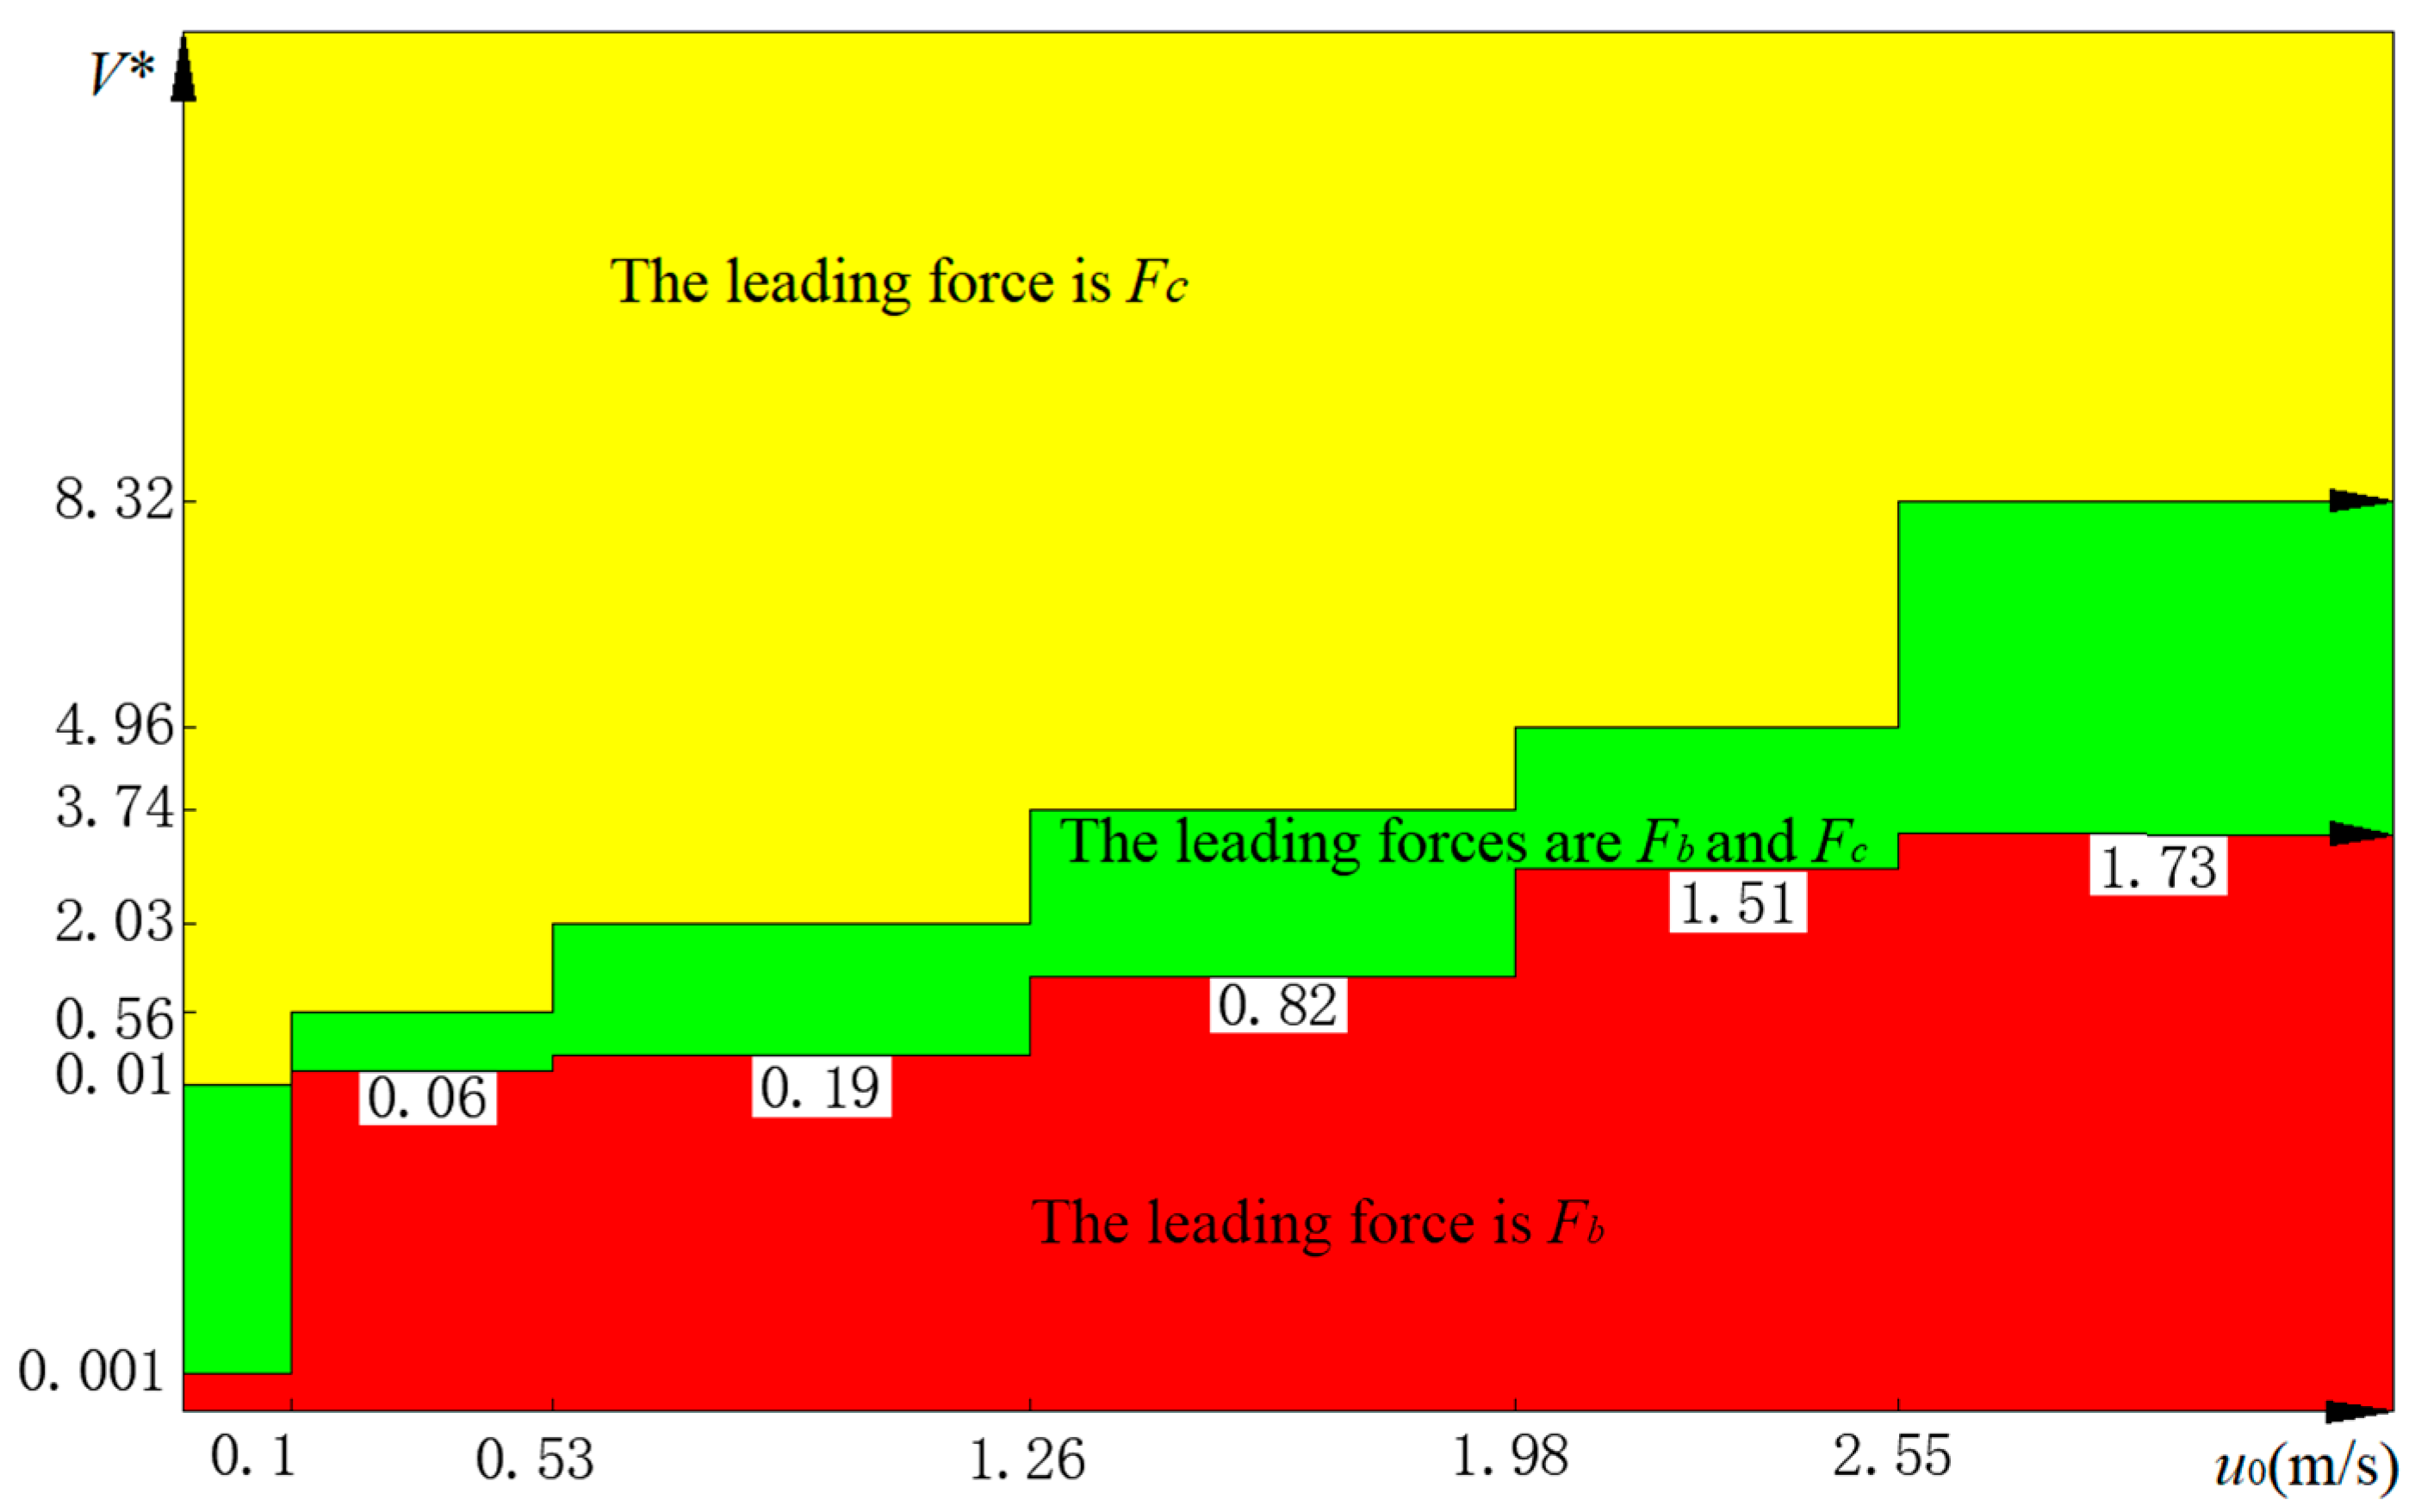
The leading forces (such as the forces Fb or Fc) play an important role in the motion behaviors of dust particles during the motion process. Whether dust particles are deposited on the solar mirror or not depends on the leading force. It is of great theoretical significance and engineering value to ensure the leading force when the environmental condition, solar mirror conditions, and particle self-factors vary. A large number of simulations were undertaken at θ = 30°, dp = 7 × 10⁻⁵ m, cp = 4.32 × 10⁻¹⁰ kg/s, and ρp = 1400 kg/m3 for the clear solar mirror. The simulated results are shown in Equations (14)–(16). It can be known from Equations (14)–(16) that for different ranges of wind speed (u0), the leading force is also different at different ranges of the dimensionless liquid bridge volume (V*). It can be seen from Equation (14) that the leading force is uniquely the liquid bridge force Fc, when 0 < u0 ≤ 0.1 m/s, V* ≥ 0.01, 0.1< u0 ≤0.53 m/s, and V* ≥ 0.56, etc. This is because Fc is greatly larger than Fb. The lower limit value of V* can be found at a different range of u0 with the force Fc as the leading force. Therefore, the liquid bridge force is of great importance, even with a very low value of V*. The liquid bridge force can uniquely be the leading force, based on Equation (14), for the motion process of dust particles.
F l e a d i n g f o r c e = F c { u 0 0.1   m / s V * 0.01 0.1   m / s < u 0 0.53   m / s V * 0.56 0.53   m / s < u 0 1.26   m / s V * 2.03 1.26   m / s < u 0 1.98   m / s V * 3.74 1.98   m / s < u 0 2.55   m / s V * 4.96 u 0 2.55   m / s V * 8.32
F l e a d i n g f o r c e = F b { u 0 0.1   m / s V * 0.001 0.1   m / s < u 0 0.53   m / s V * 0.06 0.53   m / s < u 0 1.26   m / s V * 0.19 1.26   m / s < u 0 1.98   m / s V * 0.82 1.98   m / s < u 0 2.55   m / s V * 1.51 u 0 2.55   m / s V * 1.73
On the other hand, it can be seen from Equation (15) that the leading force is uniquely the contact force Fb, when 0 < u0 ≤ 0.1 m/s and V* ≤ 0.001, or 0.1 < u0 ≤ 0.53 m/s and V* ≤ 0.06, etc. This is because Fb is greatly larger than Fc. The upper limit value of V* can be found at different ranges of u0 when the force Fb is the leading force. Therefore, the contact force can uniquely be the leading force based on Equation (15) during the motion process of dust particles. Besides, it can be seen from Equation (16) that the leading force is both the forces Fb and Fc when 0 < u0 ≤ 0.1 m/s and 0.001 < V* < 0.01, or 0.1 < u0 ≤ 0.53 m/s and 0.06 < V* < 0.56, etc. This is because both Fb and Fc can greatly influence the dust deposition mechanics. The range of V* can be found at a corresponding range of u0 when both Fb and Fc are the leading forces. Therefore, both the liquid bridge force and contact force can be the leading forces, based on Equation (16), concerning the motion process of dust particles. On the whole, the leading forces can be different at different range of u0 and V*. The lower and upper limit values of V* can be found at corresponding ranges of u0 when the unique leading force is Fc or Fb.
F l e a d i n g f o r c e = F c   and   F b { u 0 0.1 m / s 0.001 < V * < 0.01 0.1 m / s < u 0 0.53 m / s 0.06 < V * < 0.56 0.53 m / s < u 0 1.26 m / s 0.19 < V * < 2.03 1.26 m / s < u 0 1.98 m / s 0.82 < V * < 3.74 1.98 m / s < u 0 2.55 m / s 1.51 < V * < 4.96 u 0 2.55 m / s 1.73 < V * < 8.32
Table 2 shows the final motion state of dust particles at different leading force values. It can be seen from Table 2 that when the leading forces are Fc, or Fc and Fb, the final motion state of dust particles is adhering on the solar mirror. This is because dust particles after particle collision do not have enough kinetic energy to leave the mirror, and the force Fc greatly influences the motion behavior here. Even at low a V* value, the force Fc can be the leading force during the motion process of the dust particles. On the other hand, when the leading force is justly Fb, the final motion state of dust particles is off the solar mirror. This is because dust particles, after particle collision, still have a great enough kinetic energy to flow away from the mirror, and the force Fc is greatly smaller than the force Fb. Based on Equations (14)–(16), the leading force distribution at different ranges of u0 and V* can be obtained, shown in Figure 14. Thus, when the leading forces are Fc or Fc and Fb, the dust particles will be deposited on the solar mirror. Besides, the information of motion characteristics and deposition mechanics of dust particles will be more accurate and comprehensive with consideration of the liquid bridge force Fc.

4. Conclusions

Many simulations were carried out to investigate the motion behaviors of dust particles by DEM in this paper, studying the leading force and deposition mechanics of dust particles on the solar mirror in the studied solar power plant. Meanwhile, the effects of the environmental condition, solar mirror conditions, and particle self-factors on the dust deposition weight on the mirror were studied, and the following conclusions have been drawn:
  • No matter whether the mirror is clear or dusty, the phenomenon that a considerable number of dust particles are deposited on the solar mirror can be found. The dust deposition weight will be underestimated without the consideration of the liquid bridge force (Fc).
  • Dust particles after particle collision either immediately adhere to the mirror, rebound and finally flow away from the mirror, remain stationary after making some relative motion, or glide for some distance and finally stay on the mirror or leave from the system. Whether dust particles are deposited on the solar mirror or not depends on the leading force. The leading forces are the force Fc or the contact force (Fb).
  • Dust deposition weight on solar mirror can be controlled by altering the environmental condition, solar mirror conditions, and particle self-factors. The reasonable design of θ, increasing the parameter u0, and decreasing the degree of dust, V*, dp, and cp, can make more dust particles flow away from the solar mirror. Meanwhile, in essence, dust deposition weight on solar mirrors decreases when decreasing the leading force Fc or increasing the leading force Fb.
  • The leading forces can be different at different ranges of u0 and V*, based on Equations (14)–(16). The lower and upper limit value of V* can be found at a corresponding range of u0 when the unique leading force is Fc or Fb. When the leading forces are Fc, or Fc and Fb, the dust particles will be deposited on the solar mirror.
The study of the motion behaviors and deposition mechanics of dust particles on the solar mirror presented in this work is expected to be of theoretical significance and engineering value. Studying how to effectively remove dust particles from the solar mirror will be conducted in future work.

Author Contributions

X.L. and S.Y. write the original draft. X.L. and L.L. make numerical calculations and analyze data. X.L., L.L. and J.L. review and edit the original draft.

Funding

This research was funded by National Natural Science Foundation of China, grant number: 51975235.

Conflicts of Interest

The authors declare no conflict of interest.

Nomenclature

SymbolCommentUnit
FaVan Der Waals forceN
FgGravity forceN
FeElectrostatic forceN
FdBuoyant forceN
FcLiquid bridge forceN
FbContact forceN
rRadius of dust particlem
ϖLifshitz constant-
l0Average distance between moleculesm
mDust particle masskg
gGravitational accelerationm2/s
V*Dimensionless liquid bridge volume-
θInclination angle of solar mirror°
FchsElectrostatic image forceN
FchlElectrical double layer forceN
FcheElectrostatic image forceN
QElectric charge of dust particleC
εDielectric constant between dielectrics-
ε0Absolute dielectric constant-
FbnThe normal component of FbN
FbtThe tangential component of FbN
FbnijFbn between particles “i” and “jN
FbtijFbt between particles “i” and “jN
αNormal displacementm
δTangential displacementm
knSpring constant in normal direction-
ktSpring constant in tangential direction-
cnDamping coefficient in normal direction-
ctDamping coefficient in tangential direction-
μsFriction coefficient-
nVector from the particles “i” to the particles “j-
vctSliding velocity vectorm/s
FxOther forces acting on the dust particleN
u0Wind speedm/s
vijRelative velocity between particles “i” and “jm/s
UContact potential differenceV
σSurface charge density of the solar mirrorC
γLiquid surface tensionPa
tTimes
dpDiameter of dust particlem
ρpDensity of dust particlekg/m3
cpInitial concentration of dust particlekg/s
ECEnvironmental condition-
SMCSolar mirror conditions-
VDust particle volumem3
ρairAir densitykg/m3
PSFParticle self-factors-

References

  1. Mekhilef, S.; Saidur, R.; Safari, A. A review on solar energy use in industries. Renew. Sustain. Energy Rev. 2011, 15, 1777–1790. [Google Scholar] [CrossRef]
  2. Yaghoubi, M.; Niknia, I.; Kanaan, P.; Mahmoodpoor, A.R. Experimental study of dust deposition effect on the performances of parabolic trough collectors. In Proceedings of the Solar PACES 2011: 17th Solar Paces Conference, Granada, Spain, 20–23 September 2011. [Google Scholar]
  3. Şahin, A.D. A new formulation for solar irradiation and sunshine duration estimation. Int. J. Energy Res. 2007, 31, 109–118. [Google Scholar] [CrossRef]
  4. Sansoni, P.; Fontani, D.; Fransini, F.; Giannuzzi, A.; Sani, E.; Mercatelli, L.; Jafrancesco, D. Optical collection efficiency and orientation of a solar trough medium-power plant installed in Italy. Renew. Energy 2011, 36, 2341–2347. [Google Scholar] [CrossRef]
  5. Ahmed, O.K.; Mohammed, Z.A. Dust effect on the performance of the hybrid PV/Thermal collector. Therm. Sci. Eng. Prog. 2017, 3, 114–122. [Google Scholar] [CrossRef]
  6. Ajadi, D.A.; Fajinmi, G.R.; Sanusi, Y.K. Effect of dust on the Performance of a locally Designed Solar Dryer. Res. J. Appl. Sci. 2007, 2, 251–254. [Google Scholar]
  7. Jing, Z.; Zhiping, W.; Kezhen, W.; Jianbo, L. Dust effect on thermal performance of flat plate solar collectors. J. Sol. Energy Eng. 2015, 137, 14502. [Google Scholar] [CrossRef]
  8. Ahmed, O.K. Effect of dust on the performance of solar water collectors in Iraq. Int. J. Renew. Energy Dev. 2016, 5, 65–72. [Google Scholar] [CrossRef]
  9. Yadav, N.K.; Pala, D.; Chandra, L. On the understanding and analyses of dust deposition on heliostat. Energy Proced. 2014, 57, 3004–3013. [Google Scholar] [CrossRef]
  10. Kaldellis, J.K.; Kokala, A. Quantifying the decrease of the photovoltaic panels’ energy yield due to phenomena of natural air pollution disposal. Energy 2010, 35, 4862–4869. [Google Scholar] [CrossRef]
  11. Imad, J.K.; Imad, J.M.; Imad, M.M. Periodic Cleaning Effect on the Output Power of Solar Panels; 2nd Scientific Conference; Karbala university: Karbala, Iraq, 2014; pp. 116–122. [Google Scholar]
  12. Niknia, I.M.; Yaghoubi, M.; Hessami, R. A novel experimental method to find dust deposition effect on the performance of parabolic trough solar collectors. Int. J. Environ. Stud. 2012, 69, 233–252. [Google Scholar] [CrossRef]
  13. Kaldellis, J.K.; Fragos, P.; Kapsali, M.; Zafirakis, D.; Spyropoulos, G. Dust deposition impact on photovoltaic-assisted water pumping systems. In Proceedings of the WREC XI: 11th World Renewable Energy Congress, Abu Dhabi, UAE, 25–30 September 2010; pp. 1117–1122. [Google Scholar]
  14. Sayyah, A.; Horenstein, M.N.; Mazumder, M.K. Energy yield loss caused by dust deposition on photovoltaic panels. Sol. Energy 2014, 107, 576–604. [Google Scholar] [CrossRef]
  15. Elminir, H.K.; Ghitas, A.E.; Hamid, R.H.; El-Hussainy, F.; Beheary, M.M.; Abdel-Moneim, K.M. Effect of dust on the transparent cover of solar collectors. Energy Convers. Manag. 2006, 47, 3192–3203. [Google Scholar] [CrossRef]
  16. Garcı´a, M.; Marroyo, L.; Lorenzo, E.; Pe´rez, M. Soiling and otheroptical losses in solar-tracking PV plants in Navarra. Progr. Photovolt. Res. Appl. 2011, 19, 211–217. [Google Scholar] [CrossRef]
  17. Hanai, T.A.; Hashim, R.B.; Chaar, L.E.; Lamont, L.A. Environmental effects on a grid connected 900 W photovoltaic thin-film amorphous silicon system. Renew. Energy 2011, 36, 2615–2622. [Google Scholar] [CrossRef]
  18. Appels, R.; Muthirayan, B.; Beerten, A.; Paesen, R.; Driesen, J.; Poortmans, J. The effect of dust deposition on photovoltaic modules. In Proceedings of the 38th IEEE Photovoltaic Specialists Conference (PVSC), Austin, TX, USA, 3–8 June 2011; pp. 001886–001889. [Google Scholar]
  19. AlBusairi, H.A.; Mo¨ller, H.J. Performance evaluation of CdTe PV modules under natural outdoor conditions in Kuwait. In Proceedings of the 25th European Photovoltaic Solar Energy Conference and Exhibition/5th World Conference on Photovoltaic Energy Conversion, Valencia, Spain, 6–10 September 2010; pp. 3468–3470. [Google Scholar]
  20. Lu, H.; Zhang, L.Z. Numerical study of dry deposition of monodisperse and polydisperse dust on building-mounted solar photovoltaic panels with different roof inclinations. Sol. Energy 2018, 176, 535–544. [Google Scholar] [CrossRef]
  21. Lu, J.; Hajimirza, S. Optimizing sun-tracking angle for higher irradiance collection of PV panels using a particle-based dust accumulation model with gravity effect. Sol. Energy 2017, 158, 71–82. [Google Scholar] [CrossRef]
  22. Lu, H.; Lu, L.; Wang, Y. Numerical investigation of dust pollution on a solar photovoltaic (PV) system mounted on an isolated building. Appl. Energy 2016, 180, 27–36. [Google Scholar] [CrossRef]
  23. Boddupalli, N.; Goenka, V.; Chandra, L. Fluid Flow Analysis Behind Heliostat Using LES and RANS: A Step Towards Optimized Field Design in Desert Regions. In Proceedings of the 22nd International Conference on Concentrating Solar Power and Chemical Energy Systems (SOLARPACES), Abu Dhabi, UAE, 11–14 October 2016. [Google Scholar]
  24. Brosh, T.; Levy, A. Modeling of Heat Transfer in Pneumatic Conveyer Using a Combined DEM-CFD Numerical Code. Dry. Technol. 2010, 28, 155–164. [Google Scholar] [CrossRef]
  25. Sumol, S.H.; Thanit, S.; Mana, A. Investigation of Temperature Distribution and Heat Transfer in Fluidized Bed Using a Combined CFD-DEM Model. Dry. Technol. 2011, 29, 697–708. [Google Scholar]
  26. Xu, B.H.; Yu, A.B. Numerical simulation of the gas-solid flow in a fluidized bed by combining discrete particle method with computational fluid dynamics. Chem. Eng. Sci. 1997, 52, 2785–2809. [Google Scholar] [CrossRef]
  27. Liu, X.; Yue, S.; Lu, L.; Gao, W.; Li, J. Numerical simulations of gas-solid two-phase impinging streams with dynamic inlet flow. Energies 2018, 11, 1913. [Google Scholar] [CrossRef]
  28. Zhong, W.; Xiong, Y.; Yuan, Z.; Zhang, M. DEM simulation of gas-solid flow behaviors in spout-fluid bed. Chem. Eng. Sci. 2006, 61, 1571–1584. [Google Scholar] [CrossRef]
  29. Dzyaloshinskii, I.E.; Lifshitz, E.M.; Pitaevskii, L.P. The general theory of van der Waals forces. Adv. Phys. 1961, 10, 165–209. [Google Scholar] [CrossRef]
  30. Khomwachirakul, P.; Devahastin, S.; Swasdisevi, T.; Soponronnarit, S. Simulation of flow and drying characteristics of high-moisture particles in an impinging stream dryer via CFD-DEM. Dry. Technol. 2016, 34, 403–419. [Google Scholar] [CrossRef]
  31. Mikami, T.; Kamiya, H.; Horio, M. Numerical simulation of cohesive powder behavior in a fluidized bed. Chem. Eng. Sci. 1998, 53, 1927–1940. [Google Scholar] [CrossRef]
  32. Bowling, R.A. An analysis of particle adhesion on semiconductor surfaces. J. Electrochem. Soc. 1985, 132, 2208–2214. [Google Scholar] [CrossRef]
  33. Behrens, S.H.; Grier, D.G. The charge of glass and silica surfaces. J. Chem. Phys. 2001, 115, 6716–6721. [Google Scholar] [CrossRef] [Green Version]
  34. Meng, G. Research on Mechanism of Dust Particle Adhesion and Removal from Solar Panel Surface in Desert Area. Master’s Thesis, Qinghai University, Qinghai, China, 2015. [Google Scholar]
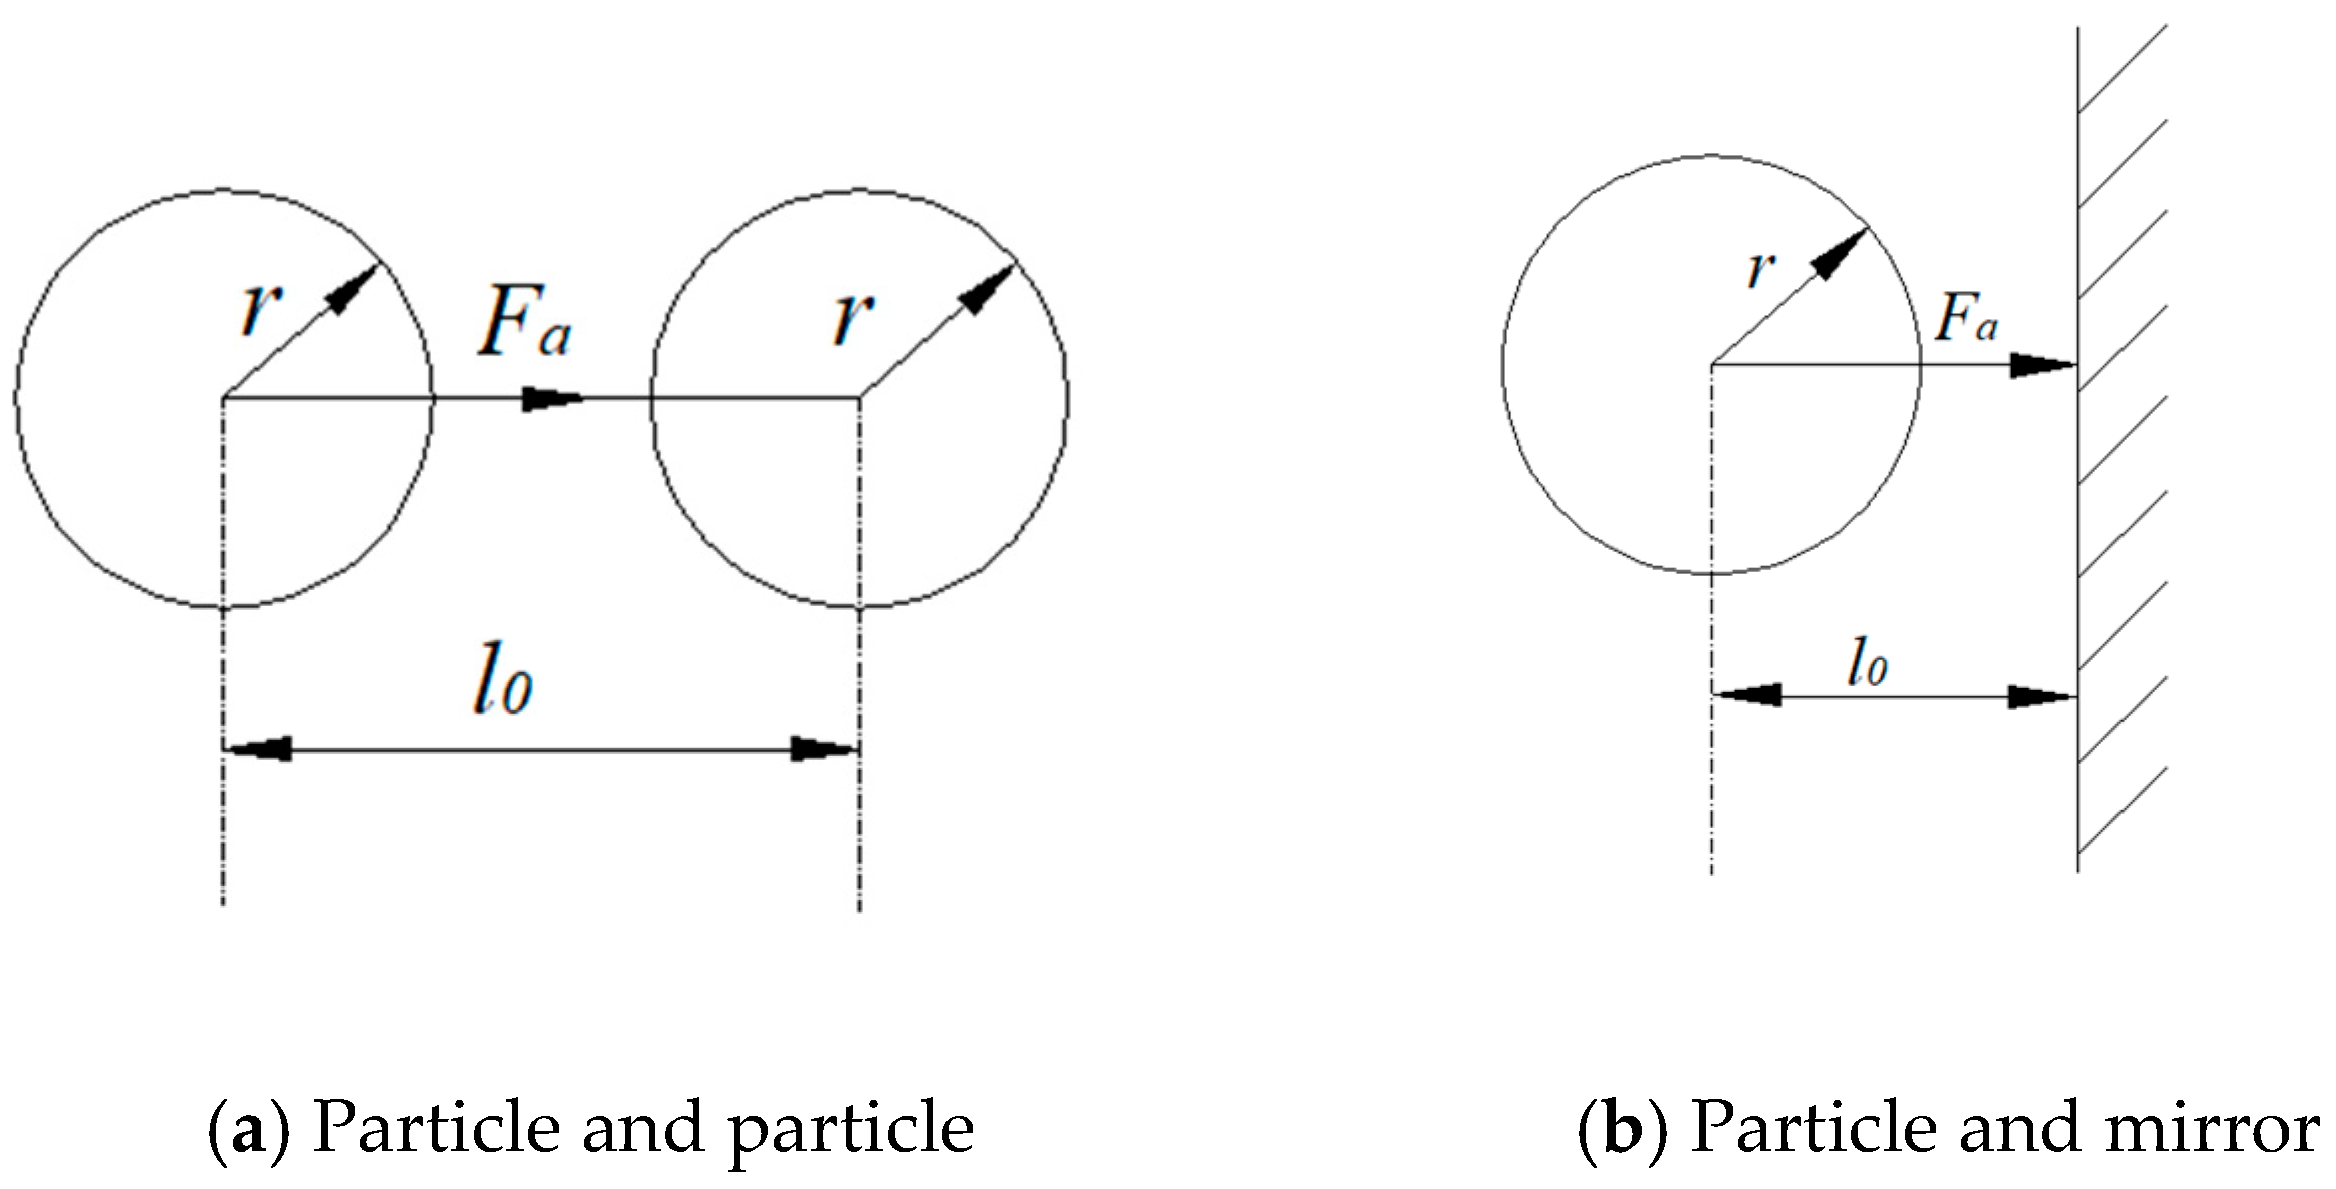
Figure 1. Schematic diagram of the Van Der Waals force on a given dust particle (Fa).
Energies 12 04550 g001
Figure 2. Geometric model and computational domain of the solar mirror.
Energies 12 04550 g002
Figure 3. Comparison of the theoretical value of the liquid bridge force with the EDEM value. The distance shown represents the distance between interparticles or between the dust particle and mirror.
Energies 12 04550 g003
Figure 4. Motion process of dust particles on a clear solar mirror, when considering Fc (ae) and without Fc (fj).
Energies 12 04550 g004aEnergies 12 04550 g004b
Figure 5. Motion behaviors of dust particles on a dusty solar mirror.
Energies 12 04550 g005
Figure 6. Analysis of the forces acting on the dust particle on the solar mirror.
Energies 12 04550 g006
Figure 7. Effect of u0 on dust deposition weight on solar mirror.
Energies 12 04550 g007
Figure 8. Effect of θ on dust deposition weight on solar mirror.
Energies 12 04550 g008
Figure 9. Effect of surface conditions on dust deposition weight on solar mirror.
Energies 12 04550 g009
Figure 10. Effect of V* on the dust deposition weight on the solar mirror.
Energies 12 04550 g010
Figure 11. Effect of dp on the dust deposition weight on the solar mirror.
Energies 12 04550 g011
Figure 12. Effect of cp on the dust deposition weight on the solar mirror.
Energies 12 04550 g012
Figure 13. Analysis chart of factors affecting the dust deposition weight of dust particle.
Energies 12 04550 g013
Figure 14. The leading force distribution at different ranges of u0 and V*.
Energies 12 04550 g014
Table 1. Simulation conditions.
ParametersDiscrete Element Method (DEM)
Poisson’s ratio (dust particle/solar mirror)0.4/0.23
Shear modulus (dust particle/solar mirror)2 × 10⁶/2 × 1010
Density of the dust particle (ρp)1400 kg/m3
Density of the solar mirror2458
Coefficient of recovery (dust particle/solar mirror)0.5/0.4
Rolling friction coefficient (dust particle/solar mirror)0.5/0.7
Static friction coefficient (dust particle/solar mirror)0.1/0.5
Liquid surface tension0.07275 N/m
Liquid viscosity0.03 Pa·s
Solid-liquid contact angle0
Surface conditions of solar mirrorClear or dusty solar mirror
Incline angle of solar mirror (θ)10°–60°
Wind speed (u0)2–10 m/s
Dimensionless liquid bridge volume (V*)0.001–2.64
Diameter of dust particle (dp)1.0 × 10⁻⁵−1 × 10⁻⁴ m
Initial concentration of dust particle (cp)7.85 × 10⁻¹¹−7.85 × 10⁻¹⁰ kg/s
Table 2. Final motion state of dust particles at different leading force.
ConditionsLeading ForceFinal Motion State
Equation (14)FcOn the solar mirror
Equation (16)Fc and FbOn the solar mirror
Equation (15)FbOff the solar mirror