Article

An Optimal Wavelet Packets Basis Method for Cascade Hydro-PV-Pumped Storage Generation Systems to Smooth Photovoltaic Power Fluctuations

1
School of Electrical Engineering and Electronic Information, Xihua University, Chengdu 610039, China
2
Key Laboratory of Fluid and Power Machinery, Ministry of Education, Xihua University, Chengdu 610039, China
3
State Grid Sichuan Electric Power Company, Chengdu 610041, China
*
Author to whom correspondence should be addressed.
Energies 2019, 12(24), 4642; https://doi.org/10.3390/en12244642
Submission received: 5 November 2019 / Revised: 4 December 2019 / Accepted: 4 December 2019 / Published: 6 December 2019

Abstract

:
Due to the volatility of natural resources, the power fluctuations of photovoltaic (PV) generation have serious negative impacts on the power quality. This paper reports a novel approach to resolve this problem in a combined cascade hydro-PV-pumped storage (CH-PV-PS) generation system through appropriate power distribution on a small time scale. According to the characteristics of power generation systems and multi-constraints, how to obtain the optimal smoothing effects with the small cost is a key challenge. For this purpose, wavelet packet decomposition is modified by constructing cost function and ideal power trajectory sequences to obtain a new adaptive power distribution method for the CH-PV-PS generation system considering the boundary conditions of the system in this paper. At the same time, to meet the real-time control requirements of actual systems, an additive function is presented to improve the optimization speed of the adaptive power distribution method. In the meantime, a fuzzy controller is designed to optimize the inevitable delay time of the power scheduling system, and the starting threshold is set to avoid the frequently mode conversion of pumped storage. Finally, the performance of the method is evaluated based on the PV station data in Xiaojin County, Sichuan Province, China. Simulation results based on Matlab-simulink indicate that the proposed method can effectively suppress PV power fluctuations and ensure normal operation of the CH-PV-PS generation system within the multiple constraints.

Graphical Abstract

1. Introduction

With global warming and the depletion of fossil energy, renewable energies, including solar energy, wind energy, and hydro energy, have attracted great attention globally [1]. The global annual growth of energy production by far surpasses the growth rate of the total primary energy supply [2]. However, due to the volatility of natural resources, the power fluctuation of PV generation is a great challenge for the stability and security of the entire power network with the continuous increased penetration of PV power stations in the utility grids. Therefore, the power system needs to be equipped with large-capacity controllable energy absorption and compensation devices, so that the power fluctuation of PV generation can be restrained within a certain range to promote the large-scale development of renewable energy [3,4,5,6]. In order to ensure the stability of power grids and reduce the negative impacts of power fluctuation, the Puerto Rico Electric Power Authority and State Grid Corporation of China require that the maximum power fluctuation range of a PV plant should be less than 10%/min of its installed capacity [7].
Many studies have shown that a hybrid energy storage system composed of an energy storage battery and supercapacitors can effectively suppress PV power fluctuation. However, the construction cost of this energy storage system is generally high, and chemical energy storage has potential security risks [8,9,10]. The use of a controllable load in the power system to compensate for PV power fluctuation has been proposed in recent years. In [11,12], the orderly charge and discharge of electric vehicles were used to smooth PV power fluctuation, but the difference in the individual charging demands of electric vehicles seriously affected the smoothing effects. The combination of a PV power station and hydropower station can not only smooth PV power fluctuations but also improve the utilization of renewable energy in regions where hydro resources and solar energy are abundant. In [13], a variable speed pump was utilized to quickly control the pump power to smooth PV power fluctuations. The pump cannot operate in power generation mode, so it reduces the power adjustment range. It is well known that pumped storage has many advantages compared with chemical energy storage. With the rapid development of control technology and power electronics, pumped storage with a full-size converter (FSC) and the characteristics of variable speed have become an important development trend. Pumped storage with these characteristics can quickly adjust the active power and reactive power to balance voltage and frequency fluctuations caused by renewable energy [14,15]. In [16,17], the application of a variable-speed pumped storage station (VSPSS) with FSC was studied in stabilizing renewable energy, and the results showed that VSPSS had better smoothing effects when its capacity was adequate. In [18], cascade hydropower stations (CHSs) were used to eliminate fluctuations with a large amplitude and low frequency in renewable energy, so that the grid-connected power of renewable energy was maintained at a "constant value" during the day. However, it could not suppress short-term rapid power fluctuations. The comparison of existing smoothing systems is shown in Table 1. The power regulation speed of VSPSS is fast but its capacity is small, which can be used to absorb PV power with a small amplitude and fast fluctuation. The CHSs’ power regulation speed is slow, but its capacity is large, which can be used to absorb PV power with a large amplitude and slow fluctuation. Therefore, combining the advantages of the two systems and considering the above points, this paper proposes that the CH-PV-PS generation system, which is composed of CHSs, PV power station, and VSPSS, in Xiaojin County, Sichuan Province, China, is used to smooth PV power fluctuations.
According to the characteristics of different energy absorption and compensation devices, how to reasonably distribute the output power of a system to minimize PV power fluctuation is a great challenge for the smoothing control algorithm. Some research achievements have been made in this field. The most common approach is the low-pass filtering algorithm, which is easy to implement and suitable for applications in real-time operation [19,20,21,22]. In [19], the low-pass filtering algorithm was used to obtain the smoothing reference power, and the filtering time constant was adjusted online according to the PV volatility, which achieved a good smoothing effect. However, it was sensitive to PV volatility characteristics and had poor self-adaptation, and the time constant was difficult to control accurately. In [23], the moving average filter based on model predictive control was adopted to smooth the PV power fluctuation, and the required capacity of the energy storage battery was smaller, but the charging and discharging frequency was not limited according to the characteristics of energy storage. In [24], the wavelet packet decomposition method was presented to obtain the charging-discharge power of energy storage, which effectively inhibited the wind farm output power fluctuation and extended the service life of the energy storage battery. In [25,26], a wavelet package-fuzzy control method was researched to make full use of the performance advantages of different types of energy storage, and effectively suppress the power fluctuation of renewable energy. The major disadvantages of the traditional wavelet packet decomposition method are its fixed decomposition layers and fixed orthogonal basis. In the meantime, the reference power obtained by decomposition is often unable to follow the change trend of the original signal, so it needs to be equipped with energy storage devices with a large capacity to meet the requirements of smoothing. Furthermore, for PV power with different fluctuation characteristics, the number of decomposition layers has a great impact on the smoothing effects.
The major disadvantage of the existing researches is that they failed to consider the system operation boundary conditions and the characteristic of PV power fluctuations. Therefore, an important conjecture is obtained that excellent smoothing effects and ideal control performances will be achieved in the cascade hydro-PV-pumped storage generation system by decomposing PV power into three categories. (1) The first category is the reference PV power whose fluctuation must meet the requirements of the utility grids. (2) The second category is the reference VSPSS power whose characteristics must meet the performance of VSPSS. (3) The third category is the reference CHSs power whose characteristics must meet the performance of CHSs. The main targets of this paper were to smooth the maximum power fluctuation range of a PV plant to less than 8%/min of its installed capacity and to meet the requirements of the CH-PV-PS generation system with multiple operation constraints. For this purpose, we modified the wavelet packet decomposition to obtain a satisfactory smoothing control strategy of PV power fluctuation by reasonably distributing system output power. Meanwhile, considering smoothing effects and operation characteristics of VSPSS and CHSs, ideal power trajectories were established as references, and then, a cost function by the ideal power trajectories was proposed to achieve the optimal power distribution method. Moreover, to avoid excessively fast conversion of the VSPSS mode, the starting threshold of the algorithm was set. In the meantime, in order to solve the time-delay problem of real-time control by the smoothing algorithm, a fuzzy controller was designed to optimize the delay time.
The main contributions of this work are summarized as follows:
(1)
This paper reports a new approach constructing a combined cascade hydro-PV-pumped storage (CH-PV-PS) generation system for the first time to smooth PV power fluctuations through appropriate power distribution on a small timescale. Combined with the existing pumped storage power station and cascade hydro power station, the CH-PV-PS generation system is helpful in reducing the cost of smoothing PV power fluctuations and improves the utilization of renewable energy.
(2)
The optimal wavelet packet method is modified, and a fuzzy controller is designed to achieve better smoothing effects. Compared with the existing technologies, this proposed method can adaptively search for the optimal decomposition layer and the optimal biases according to the PV fluctuation characteristics. At the same time, considering the operating boundary conditions of energy absorption and absorption devices, the characteristics of each device can be utilized and each device can be operated in a better operation state.
(3)
The efficiency of the proposed smoothing method is compared with three different algorithms. As a result, the proposed smoothing method is more effective in smoothing PV power fluctuations and ensuring normal operation of the CH-PV-PS generation system within the multi-constraints.
The rest of the paper is organized as follows. Section 2 introduces the CH-PV-PS generation system. The smoothing control strategy based on the improved optimal wavelet packets basis method proposed in Section 3. In Section 4, the reference power and ideal power trajectory sequence are discussed. Section 5 designs the fuzzy controller to optimize the delay time. Simulations are carried out in Section 6 and conclusions are given in Section 7.

2. System Structures and Definition of PV Power Fluctuations

2.1. System Description of the CH-PV-PS Generation System

The structures of the CH-PV-PS generation system studied in this paper are shown in Figure 1, including a centralized PV power station 100 MW, CHSs 150 MW, and a VSPSS 5 MW. The public link point of AC bus voltage is 220 KV, and the booster transformer boosts the voltage to 220 KV to send the electricity to the utility grids. The VSPSS is composed of an FSC, a synchronous motor, and a pump turbine. Energy is transmitted between the stator of the motor and the utility grids through FSC. In the power generation mode, the pump turbine operates in the variable-speed mode according to the operation conditions and power requirements. Besides, the FSC converts the electric energy with different voltage frequencies and phases into the same values as the utility grids through an AC/DC/AC converter. Conversely, in the electric mode, the power direction is the opposite, and the output voltage frequency is adjusted by the FSC, to accurately control the pump turbine to absorb power from the grid. Since the FSC completely isolates the motor from the utility grids, the power station can realize pole-less speed regulation, which improves the range and the speed of power regulation to better suppress the fluctuation of active power in the power system [27]. The energy management system, EMS, is the control center of the CH-PV-PS generation system, which is used to sample PV output power, PPV, run algorithms and send reference power commands to CHSs and VSPSS. PHSObj and PHSAct denote the reference power and actual power of CHSs, respectively. PFSC and PPSAct denote the reference power and actual power of VSPSS, respectively. PG denotes the grid output power, and PG = PPV + PHSAct + PPSAct.

2.2. Definition of the PV Power Fluctuations

In this study, PV fluctuation is discussed at the minute scale. Before smoothing, PV power fluctuation ∆Pbef is defined as the difference between the maximum and minimum of PPV. After smoothing, PV power fluctuation, ∆Paft, is defined as the difference between the maximum and minimum of PG. At time t0, ∆Pbef and ∆Paft are calculated as follows:
s . t { Δ P b e f ( t 0 ) = P P V , max ( i ) P P V , min ( j ) , i > j Δ P b e f ( t 0 ) = P P V , min ( j ) P P V , max ( i ) , i < j P P V , max = f max ( B ) P P V , min = f min ( B ) B = { P P V ( t 0 + Δ t 30 ) , P P V ( t 0 + 2 Δ t 30 ) , P P V ( t 0 + 30 ) } ,
s . t { Δ P a f t ( t 0 ) = P G , max ( i ) P G , min ( j ) , i > j Δ P a f t ( t 0 ) = P G , min ( j ) P G , max ( i ) , i < j P G , max = f max ( B ) P G , min = f min ( B ) B = { P G ( t 0 + Δ t 30 ) , P G ( t 0 + 2 Δ t 30 ) , P G ( t 0 + 30 ) } ,
where ∆t is the sampling interval and ∆t = 1 s. The predicted PV fluctuation is defined as:
Δ P p r e d ( t 0 ) = P P V ( t 0 ) P p r e d ( t 0 + Δ t p ) ,
where ∆t is the prediction interval, and Ppred denotes the predicted PV power. Referring to the “Puerto Rico Electric Power Authority” [28] and the “State Grid Corporation of China”, which stipulate that the maximum PV power fluctuation should be less than 10%/min of its installed capacity, the smoothing constraint and the percentage of failure to reach the requirements are defined as:
s . t { Δ P a f t ( t ) P l m t   , t T P l m t = 10 % C P V T = { 0 , Δ t , 2 Δ t , 3 Δ t , N Δ t } φ = { s u m ( t ) N | Δ P a f t ( t ) > P l m t } ,
where sum(t) denotes the number of t, which does not satisfy the smoothing constraint; CPV denotes the installed capacity of PV; and φ denotes the percentage of failure to meet the requirements. It is well known that the VSPSS power regulation speed is fast, but its capacity is small, which can be used to absorb PV power with a small amplitude and fast fluctuation. The CHSs power regulation speed is slow, but its capacity is large, which can be used to absorb PV power with a large amplitude and slow fluctuation. So, it is necessary to appropriately select the reference smoothing power, which not only meets the utility grid’s requirements of the fluctuation rate but also meets the characteristics of VSPSS and CHSs. Therefore, the most difficult factors of smoothing and coordination control are how to distribute system power and consider system boundary conditions. In view of the powerful data processing ability of the wavelet packet decomposition, which can obtain detailed characteristics of the signal, an improved algorithm is researched to solve the above problems.

3. Smoothing Control Strategy Based on the Optimal Wavelet Packets Basis Method

3.1. Smoothing Control Process

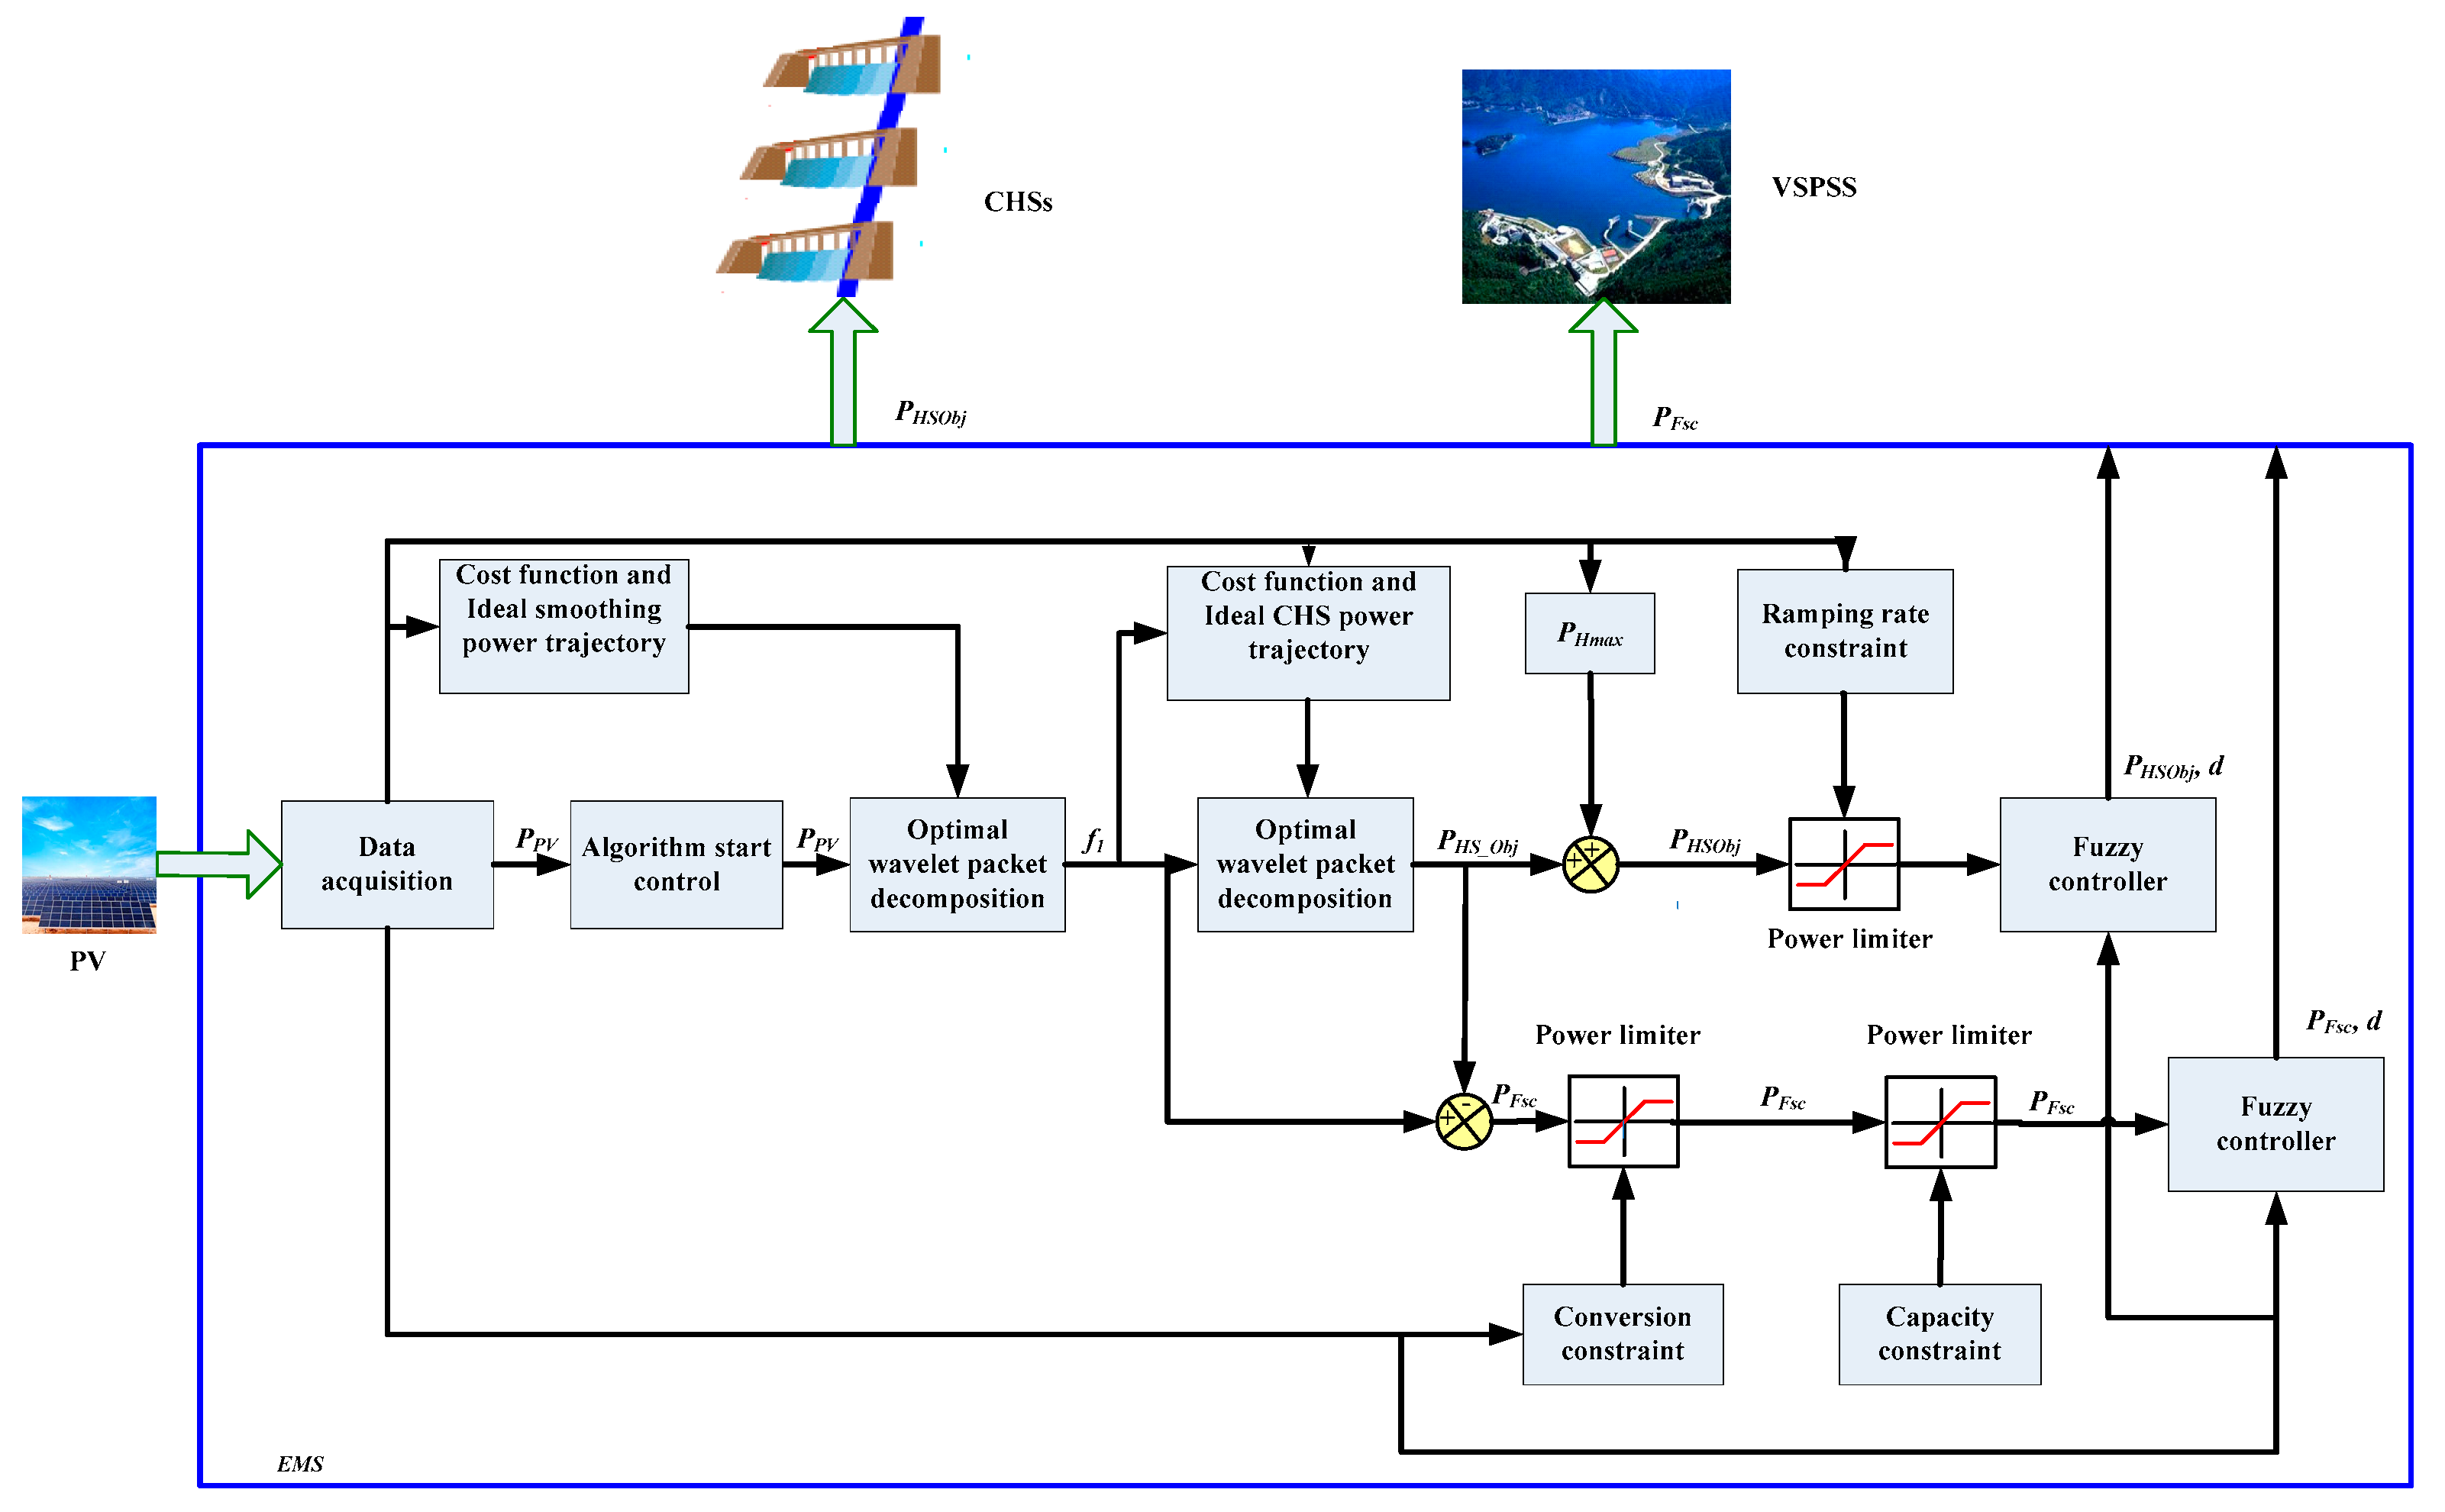
The flow chart of the smoothing method is shown in Figure 2. Firstly, PV power fluctuation is calculated. Whether the smoothing algorithm is started or not is decided by PV power fluctuation and the predicted PV power fluctuation. Then, the ideal PV power trajectory sequence is constructed. Referring to the ideal smoothing power trajectory sequence, the short-time PV power, f, is decomposed by the improved optimal wavelet packet basis to obtain the reference smoothing power, PPVObj(t). Then, the ideal power trajectory sequences of CHSs are constructed. Referring to the ideal power trajectory sequences, the difference between PPVObj and f is decomposed by the improved optimal wavelet packet basis to obtain the reference CHSs power, PHSObj(t). Then, the reference power of VSPSS PFSC(t) is calculated. Finally, the delay time is optimized through the fuzzy controller, and the optimized PFSC(t) and PHSObj(t) are sent to the control center as the scheduling instructions.

3.2. Improved Wavelet Packet Decomposition Algorithm

The decomposition signals with different characteristics can be obtained by selecting a different wavelet packet basis. Therefore, the desired decomposition signals can be obtained by searching for the optimal basis and the optimal layers. Its principle is shown as follows.
Wavelet packet decomposition has a good localization property and fine sampling step size to focus on the details of signals with different frequencies. For any signals, f(t)L2(R) (square integral function space), the wavelet series can be expressed as:
f ( t ) = j , k = C j , k ψ j , k ( t ) ,
where Cj,k is the dual wavelet integral transformation of f(t) with respect to the orthogonal wavelet function, namely:
C j , k = 2 j 2 f ( t ) ψ ( 2 j t k ) d t ,
where {Ψj,k(t)} is the Riesz basis of the orthogonal wavelet, Ψ(t), which can be expressed as:
ψ j , k ( t ) = 2 j 2 ψ ( 2 j t k ) j , k Z .
Wavelet decomposition can decompose signals at multiple levels to obtain a more precise decomposition method of signal features. In this paper, the orthogonal wavelet function is generated according to the Daubichies (DB) wavelet, which is expressed as:
s . t { u 2 l , k ( t ) = ϕ l , k ( t ) = 1 2 k h k ϕ ( 2 l t k ) u 2 l + 1 , k ( t ) = ψ l , k ( t ) = 1 2 k g k ϕ ( 2 l t k )
where un,k(t) is the wavelet packet of the orthogonal scale function, φ(t); n∈{2l, 2l + 1}; l = 0, 1,…; hk is the filter coefficient, and its Fourier transform satisfies the following conditions:
H k ( z ) = 1 2 k h k z k = ( 1 + z 2 ) N Q ( z ) ,
where N is the number of sampling points of signal f(t). Q(z) satisfies the following conditions:
| Q ( e i ω ) | = j N 1 ( N + j 1 j ) ( sin ω 2 ) 2 j .
The wavelet filter coefficient, gk = (−1)k−1hk+1, and the decomposed coefficients of the signal, f(t), is dj,n = {dpj,n, p < Z}, where dpj,n is determined by f and un,k. The discrete data of f(t) is {Fk}; k = 0, 1, 2, …, N, and its decomposition algorithm is expressed as:
s . t { d p j + 1 , 2 n = k h 2 k p d k j , n d p j + 1 , 2 n + 1 = k g 2 k p d k j , n .
Taking two-layer wavelet decomposition and N = 8 as an example, the sampling sequence is decomposed by the wavelet packet according to Equation (11), and its hierarchical structure is shown in Table 2.
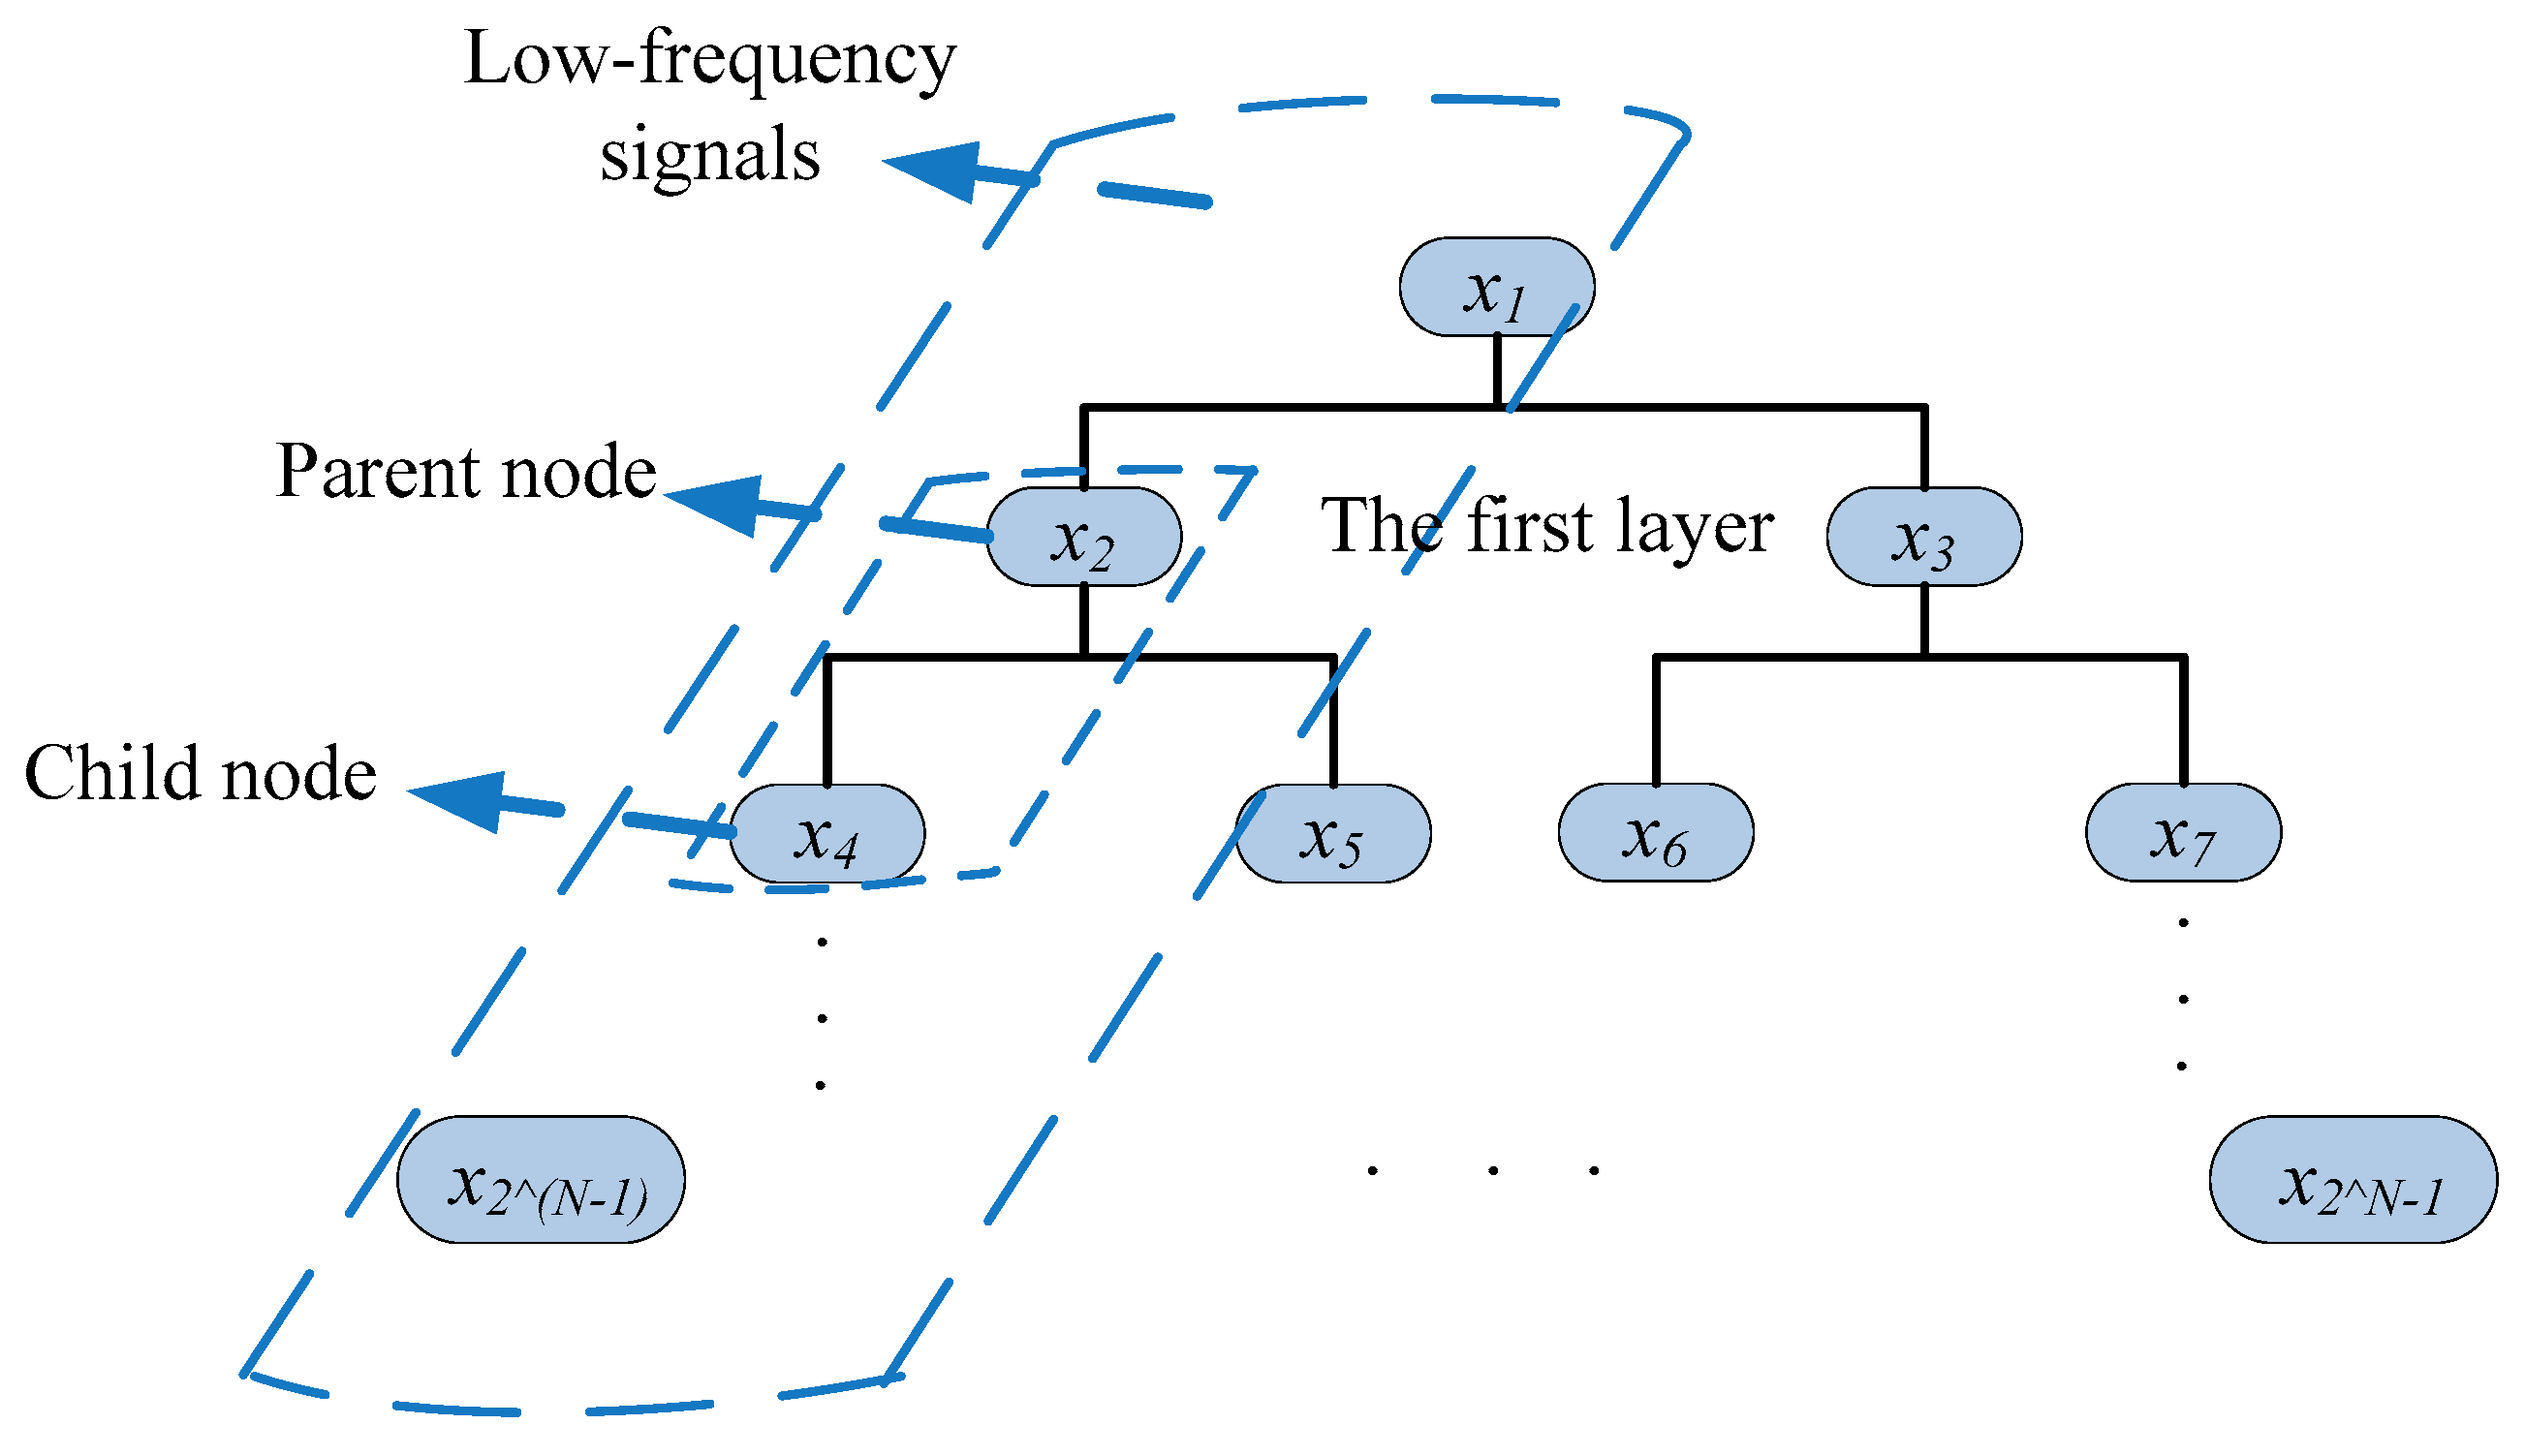
Under an orthogonal wavelet packet basis, the short-time PV output power, f(t), can be decomposed to n-layer wavelet packets, as shown in Figure 3. f(t) corresponds to a decomposition series, x = {x1, x2, ..., xk}. Here, xk represents the kth decomposition signal, and k = 2N − 1.
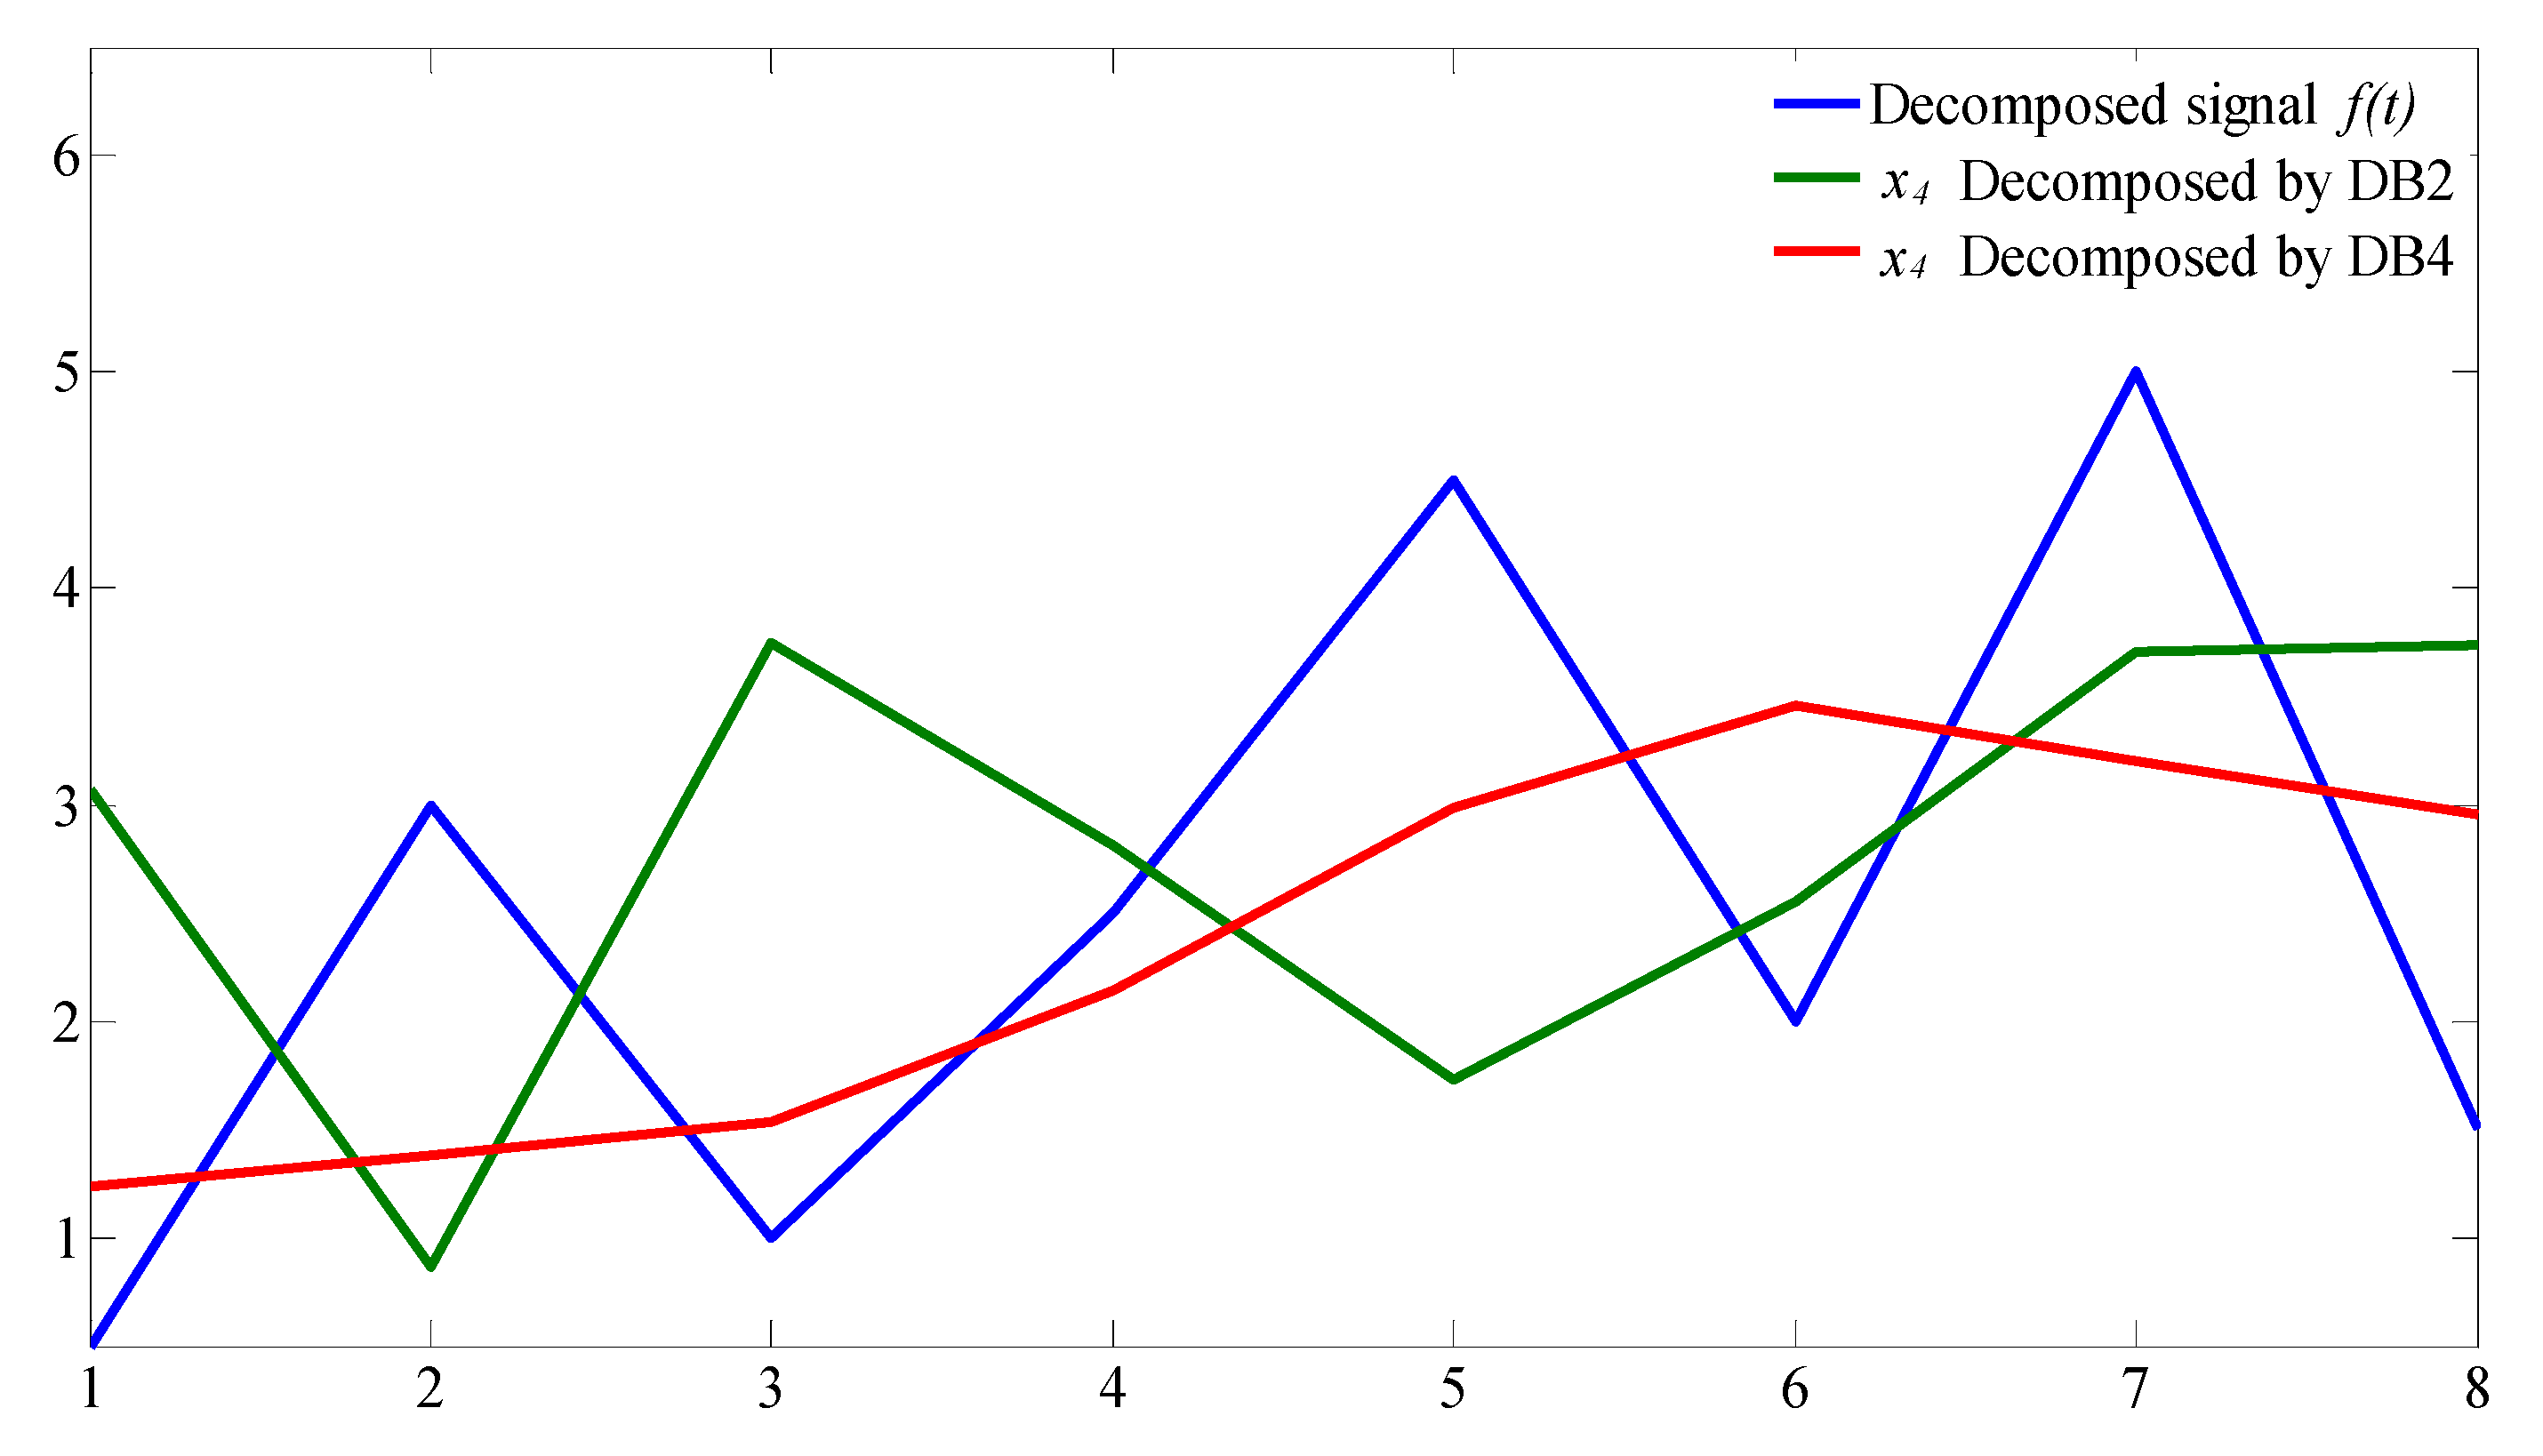
The wavelet library {un,k(t)} can form a set of orthogonal basis of L2(R) called a wavelet packet basis of L2(R), as {un,k(t)}c. It is assumed that there are h wavelet packet bases in the wavelet packet library, and different wavelet packet basis have different time-frequency localization capabilities, reflecting different signal characteristics. The decomposition effects of different wavelet packet basis are shown in Figure 4, which indicate that x4 sequences decomposed by wavelet packet basis DB2 are more suitable as the reference smoothing power than the sequences decomposed by wavelet packet basis DB4. Therefore, for a given signal, it is hoped that a better wavelet packet basis will be selected and the signal decomposed to get the best reference power value for smoothing PV power fluctuation. With the best reference power value, the CH-PV-PS generation system could obtain ideal operation states and smoothing effects. In order to select a better wavelet package basis and the optimal layers, the cost function of a decomposed sequence is firstly defined. Then, to minimize the cost function and obtain the optimal decomposition layer, the bases are searched from the wavelet packet library. For a given signal, the wavelet package basis with the minimum cost function value is the most effective decomposition method, which is called the optimal wavelet package basis.
An information cost function, M(x), is defined based on series x = {x1, x2, … xk}. In order to obtain the optimal wavelet packet basis and meet the requirements of real-time engineering control, the information cost function, M(x), should satisfy the following two conditions:
(1) Additive conditions as:
s . t { M c ( { x 1 } ) = M ( x 1 ) , M c ( { x 2 } ) = M ( x 2 ) , M c ( { x k } ) = M ( x k ) M c ( { x 1 , x 2 x k } ) = n = 1 k M ( x n ) ,
where Mc({x1,x2...xk}) is the information cost function value of signal decomposed by the wavelet packet basis {um,k(t)}c. The additive condition indicates that the information cost function value of the signal decomposed by the wavelet package basis {um,k(t)}c is equal to the superposition of the subsequence cost function value. The cost function with the additive conditions will reduce the computation amount and improve the computation speed of the algorithm.
(2) In order to search for the optimal basis and find the optimal decomposition layer number, the value of the information cost function, M(x), should reflect the degree of convergence between the wavelet packet decomposition signals and the desired decomposition signals. Therefore, it is necessary to define an ideal reference smoothing power trajectory sequence, xe, and an ideal CHSs power trajectory sequence as references, xe = {xe1, xe2, ..., xem} (whose calculation procedure is shown in Section 4.1.1). We take m discrete points from signal xn decomposed by the wavelet packet basis at equal distance to get a new decomposition sequence:
x n = { x n 1 , x n 2 x n m } ,
and the information cost function is defined as:
s . t { M ( x n ) = | Q n ln Q p | Q n = i = 1 m | x n i 2 x e i 2 | x e 2 2 Q p = x n 2 2 x 1 2 2
M ( x n ) = i = 1 m | x n i 2 x e i 2 | | ( ln i m x n i 2 ln i m x 1 i 2 ) | i m x e 2 ,
where Qn reflects the degree of convergence between the wavelet packet decomposition signals and the ideal power signals and Qp denotes the energy dissipation function, which reflects the energy loss degree of the decomposition signals. For a period of time, the smaller Qp represents the smaller total active output of VSPSS and CHSs. Let:
Q c = | 2 m ( ln i m x n i ln i m x 1 i ) | .
Obviously, | ( ln i m x n i 2 ln i m x 1 i 2 ) | is positively correlated with Qc, and it will be replaced by Qc in Equation (15). Therefore, M(xn) can be expressed as:
M ( x n ) = i = 1 m | x n i 2 x e i 2 | | ( ln x n i 2 ln x 1 i 2 ) | m i = 1 m x e 2 .
The additive function is defined as:
λ ( x n ) = i = 1 m | x n i 2 x e i 2 | | ( ln x n i 2 ln x 1 i 2 ) | .
Since the ideal power trajectory stays the same in a certain period of time, m i = 1 m x e 2 is a positive constant. When λ(xn) is the smallest, M(xn) is the smallest, and the cost function is converted from Equation (15), which is used to calculate the whole sequence, to Equation (18), which is used to calculate point by point. When a new signal is added, the new signal and the original signal form a new sequence. The cost function value of the new sequence is equal to the cost function value of the original signal plus the cost function value of the new signal, which avoids repeating the solving process and reduces the amount of computation. Therefore, the three categories of signals mentioned in the introduction can be obtained through the above cost function and decomposition algorithm. Furthermore, we can achieve satisfactory smoothing effects.

4. Reference Power and Ideal Power Trajectory Sequence

4.1. The Ideal Smoothing Power Trajectory Sequence and Its Reference Smoothing Power

4.1.1. The Ideal Smoothing Power Trajectory Sequence

According to the grid-connection requirements of PV power stations, the PV power fluctuation within one minute shall not exceed 10% of its rated capacity [29]. In this paper, PV power fluctuation within one minute shall not exceed 10% as the smoothing constraint condition. Taking a PV power station with a rated capacity, PN, as an example, the ideal smoothing power trajectory sequence is studied.
The short-time PV power, PPV, is sampled with TS as the period to get the sampling sequence, xs = {xs1, xs2, ..., xsn}. Here, the PV power fluctuation per minute must not exceed 10% of its rated capacity as the constraint condition, and the maximum change rate is expressed as rmax = 0.1PN/60. The constraint of the ramping rate is defined as: rPV < rmax. During the (i − 1)TsiTs, the ideal smoothing power trajectory sequence function is calculated as follows:
P i ( t ) = { x s i ( t ( i 1 ) T s ) r max L ( i 1 ) T s < t i T s a n d ( x s i x s i + 1 ) > r max T s x s i + ( t ( i 1 ) T s ) r max L ( i 1 ) T s < t i T s a n d ( x s i x s i + 1 ) < r max T s x s i + ( t ( i 1 ) T s ) x s i + 1 x s i T s L ( i 1 ) T s < t i T s a n d | x s i x s i + 1 | r max T s ,
where i = 1, 2, ... n, and L denotes the smoothing coefficient, which can be adjusted to change the smoothing effects, 0 < L < 1. Each time a Pi(t) is calculated, xsi+1 = Pi(iTs) is re-assigned, and the xs sequence is refreshed at the same time. During the 0–nTs, the ideal smoothing power trajectory sequence function is expressed as:
P ( t ) = i = 1 n 1 P i ( t ) ,
where M discrete points of P(t) are taken at equal distance to get the ideal smoothing power trajectory sequence as:
x e = { x e 1 , x e 2 x e m } .

4.1.2. The Reference PV Smoothing Power

Referring to the ideal smoothing power trajectory sequence, the reference smoothing power is decomposed by the improved optimal wavelet basis as follows:
Firstly, the c wavelet packet base {um,k(t)}c (c = 1, 2, ..., h) is selected to decompose the PV power signal, f(t), to the first layer, and the cost function value of the low-frequency wavelet packet decomposition in the first layer is calculated. Here, the upper nodes are called the parent node and the lower nodes are called the child node. Furthermore, the upper low-frequency signal is decomposed to the next layer, and the cost functions of the parent node and child node are calculated and compared. If the child node’s cost function value is less than the parent node’s cost function value, the decomposition continues. Otherwise, the cost function values of all low-frequency signals are summed up as λ(xn)c. The group of wavelet packet bases that makes λ(xn)c the smallest is called the optimal basis. Under the optimal wavelet basis decomposition, the parent node of the last layer is taken as the reference smoothing power, denoted as PPVObj(t). Then, the ramping rate constraint is introduced to revise the reference smoothing power, which is PPvobj(t) = {PPvobj(t), rPV < rmax}. During the whole decomposition process, only the low-frequency part of the signal is decomposed, so the operation speed of the algorithm is greatly improved.

4.2. Ideal Power Trajectory Sequence of CHSs and Reference Power of CHSs and VSPSS

4.2.1. Ideal Power Trajectory Sequence of CHSs

CHSs have an optimal operation efficiency according to the working conditions, and the power of CHSs under the optimal operating efficiency is defined as PHmax. When CHSs participate in PV power smoothing, the ideal power trajectory is defined by the quadratic function under the constraint of the ramping rate, {RCH < b, RCH1 < c}. The maximum climbing rate of its regulating power shall not exceed b. Here, b = 0.1PHmax/60. The magnitude of the second derivative should not exceed c. Here, c = b/60. Taking the output power of the CHSs with PHmax as an example under a certain working condition with the optimal operating efficiency, the ideal power trajectory sequence of CHSs is defined.
Firstly, we calculate the power trend of CHSs PHSObj = PPVObjPPV + PHmax. Then, PHSObj is sampled to obtain the sampling sequence, xsh = {xsh1, xsh2..., xshn}, whose sampling period is TS. Obviously, xsh represents the power variation trend of CHSs. Then, during (i−1)TsiTs the ideal power trajectory sequence function is defined as:
P h i ( t ) = { x s h i c ( t ( i 1 ) T s ) 2 ( i 1 ) T s < t i T s a n d ( x s h i x s h i + 1 ) > b T s x s h i + c ( t ( i 1 ) T s ) 2 ( i 1 ) T s < t i T s a n d ( x s h i x s h i + 1 ) < b T s x s h i + x s h i + 1 x s h i T s 2 ( t ( i 1 ) T s ) 2 ( ( i 1 ) T s < t i T s a n d | x s h i x s h i + 1 | < b T s ,
where i = 1, 2, ..., n. Each time Phi(t) is calculated, xshi+1 = Phi(iTs) is re-assigned, and the xsh sequence is refreshed. The ideal power trajectory sequence function of CHSs during 0–(n−1)TS is calculated as:
P h ( t ) = i = 1 n 1 P h i ( t ) ,
where M discrete points of Ph(t) are taken at equal distance to get the sequence as:
x e h = { x e h 1 , x e h 2 x e h m } .
Then, the ideal power trajectory sequence of CHSs is defined as:
x e _ h t = x e h P H max ( t ) .

4.2.2. The Reference Power of CHSs and VSPSS

In order to ensure that the VSPSS power does not exceed its rated capacity, it is necessary to re-define the information cost function and the additive function. So, we redefine the information cost function as:
s . t { M ( x n ) = | Q n ln Q p | + k N p s c Q n = i = 1 m | x e _ h t i 2 x e i 2 | x e 2 2 Q p = x e _ h t 2 2 x e 2 2 .
The additive function is redefined as:
λ ( x e _ h t ) = i = 1 m | x e _ h t i 2 x e i 2 | | ( ln x e _ h t i 2 ln x 1 i 2 ) | + k N P S C ,
where NPSC is the time proportion when the actual operation power of VSPSS exceeds its rated capacity, and k is the penalty coefficient. Then, let:
f 1 ( t ) = P P V O b j ( t ) P P V ( t ) .
Referring to the ideal power trajectory sequence and the new cost function, f1 is decomposed by the improved optimal wavelet basis. The reference CHSs power under the optimal wavelet packet basis decomposition is obtained, which is the parent node of the last layer defined as PHS_Obj(t). In the actual operation, in order to ensure the qualified operation efficiency of CHSs, its output reference power is defined as:
P H S O b j ( t ) = P H max ( t ) + P H S _ O b j ( t ) ,
where PHmax(t) is the current optimal operation power of CHSs. Then, the ramping rate constraint is introduced to revise the CHSs reference power, PHSObj(t) = {PHSObj(t), rPV(t) < rmax(t)}. The reference output power of VSPSS is obtained as:
P F S C ( t ) = P P V O b j ( t ) P H S _ O b j ( t ) f ( t ) .
In order to avoid an excessively fast conversion of the VSPSS mode between pump and power generation, conversion constraints are introduced as follows:
P F s c ( t ) = { ( P F s c ( t ) , 0 ) | ( P F s c ( t ) P C L m t ( t ) , P F s c ( t ) < P C L m t ( t ) ) } .
PFSC(t) under PCLmt is set to 0 MW; the conversion threshold, PCLmt, is defined as:
P C L m t ( t ) = σ P C b a s e + δ N c ( t 0 ~ t ) ,
where σ is the inertia factor; PCbase is the conversion base power; δ is the penalty coefficient; and Nc(t0–t) denotes the number of conversions during t0–t. Considering the capacity constraint of VSPSS, its final reference power instruction is:
P F s c ( t ) = { ( P F s c ( t ) , C P S ) | ( P F s c ( t ) < C P S , P F s c ( t ) C P S ) } .
We set PFSC(t) above CPS to CPS MW, where CPS is the rated capacity of VSPSS. The reference power distribution principle of CHSs and VSPSS is shown as Figure 5.
Due to part of the PV power fluctuations with high frequency being absorbed by the VSPSS and part of PV power fluctuation with low frequency being absorbed by CHSs, the output power of the CH-PV-PS generation is smoothed. Then, various constraints ensure the normal operation of the system and improve the service life of the system.

5. Fuzzy Control to Optimize the Delay Time

In practical engineering applications, because the dates of PV output power are obtained point by point through real-time sampling, the smooth algorithm can only deal with the current period dates and previous dates. For example, the wavelet packet is used to decompose and reconstruct the data within the current 5 min. By setting a certain delay time, d, the smoothing target power in the future d period can be obtained, which is the wavelet packet decomposition signal of the last d period. In the other words, it will be used as the target power value during the future d time. In this way, the smoothing target power values of each period are obtained, as shown in Figure 6. It is assumed that the energy absorption and compensation devices can fully follow the target instruction, and the smoothing effects under different delay times are shown in Figure 7.
It can be seen from Figure 6 and Figure 7 that the smoothing algorithm has obvious delay effects. Moreover, the value of the delay time has a great influence on the smoothing effects. Within a certain range, the smoothing effects increase with the decrease of the delay time. However, if the delay time is too short, it will increase the difficulty of calculation and make the operation of VSPSS and CHSs more difficult. According to the current fluctuations, a certain starting threshold can be set to reduce the delay effects on the smoothing algorithm. In addition, a fuzzy controller is designed to optimize the delay time in this paper. Fuzzy control is an effective tool to solve the effects of time delay through language control rules under conditions without an accurate mathematical model of the controlled object [28]. Moreover, according to the original fluctuation and fluctuation after smoothing, a better delay time is set to improve the smoothing effects.
The inputs of the fuzzy controller are the maximum PV original power fluctuation, ep, in 2 min, and the maximum power fluctuation, epc, 2 min after smoothing. The output of the fuzzy controller is the delay time, d. The fuzzy sets of ep, epc, and d are {VVS, VS, S, M, B, VB}, and the domain of ep is {0, 3, 6, 9, 12, 15, 18, 21} MW, the domain of epc is {0, 3, 4.5, 6, 7.5, 9, 10.5, 12} MW, and the domain of d is {0.1, 0.3, 0.5, 0.7, 0.9, 1.1, 1.3, 1.5} minutes. The membership functions of the input and output are shown in Figure 8, and the fuzzy control rules are shown in Table 3. The designs of the membership function and fuzzy rules are as follows: When the original fluctuation and the fluctuation after smoothing are both large, we take the smaller delay time. When the original fluctuation and the fluctuation after smoothing are both small, we take the larger delay time. The priority level of the fluctuation after smoothing is larger than the original fluctuation, and the weighted average method is designed to remove fuzziness.

6. Simulation and Discussion

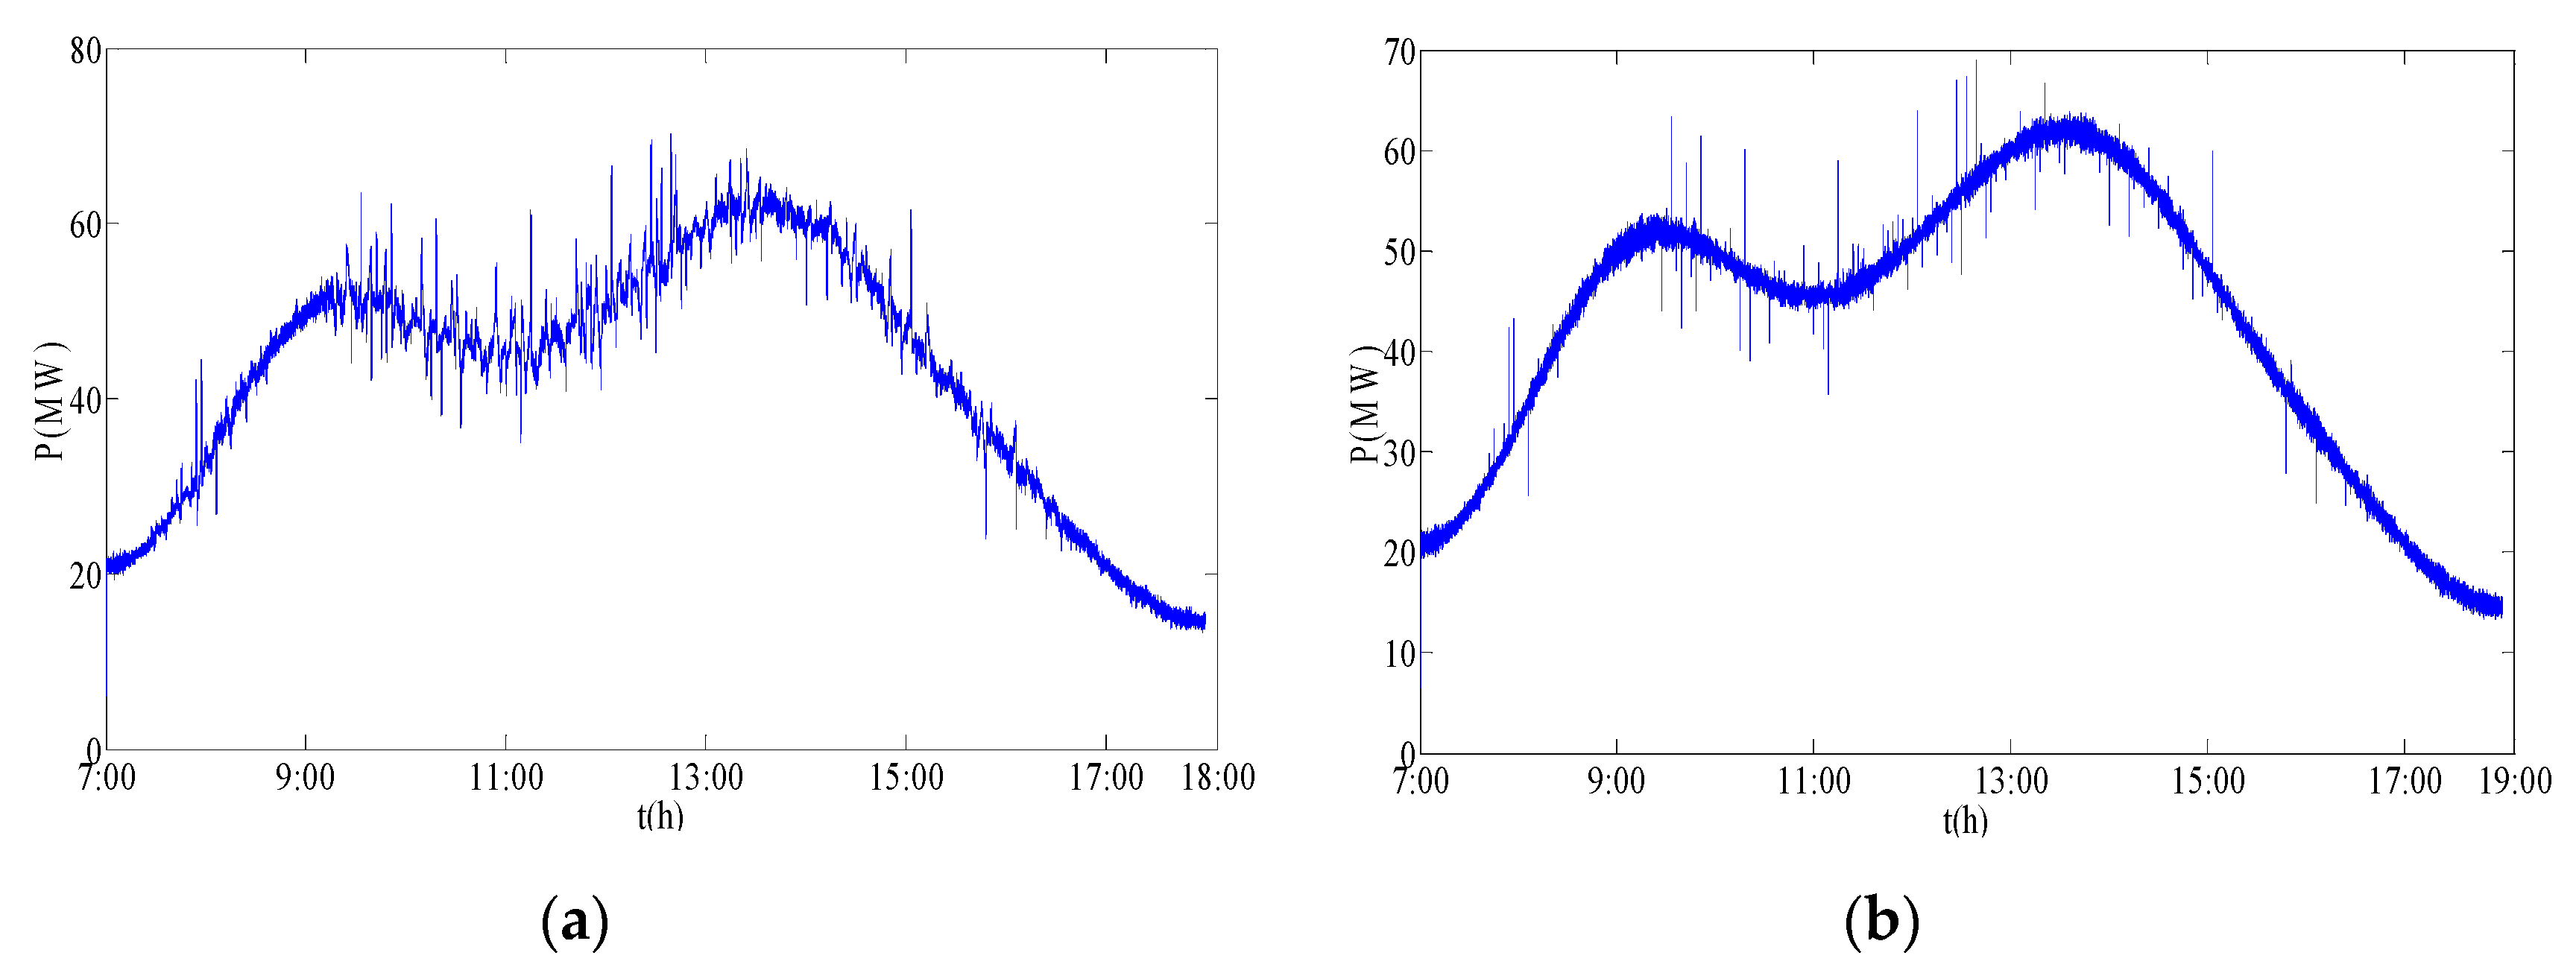
Experimental studies were carried out to verify the comprehensive effects of the proposed method on the CH-PV-PS generation system, which was composed of a 100 MW PV power station, the 150 MW CHSs, and a 5 MW VSPSS. The output powers of the CH-PV-PS generation system measured in extreme typical weather were used to build a generation system simulation platform.
The optimal wavelet packet decomposition algorithm (OWPDA) proposed in this paper was compared with the filtering algorithm (FA) [30] and the wavelet packet decomposition algorithm (WPDA) [26] to verify its superiority and feasibility. The influence of CHSs on the smoothing effects was assessed by four comparison experiments, which were respectively implemented on the system with CHSs and without CHSs. The fuzzy controller was designed to optimize the delay time of all the algorithms. The smoothing targets refers to the standard “Puerto Rico Electric Power Authority” [29] and “technical regulations on PV access to utility grids”, which stipulates that the active power change of large-scale PV power stations should not exceed 10% of the installed capacity per minute and should not exceed 1/3 of the installed capacity within 10 min. Maximum fluctuation, average fluctuation per minute, and the percentage of failure to reach the requirements were calculated to verify the smoothing effects. Average cumulative errors were calculated to verify the rationality of the system power distribution.

6.1. Filtering Algorithm

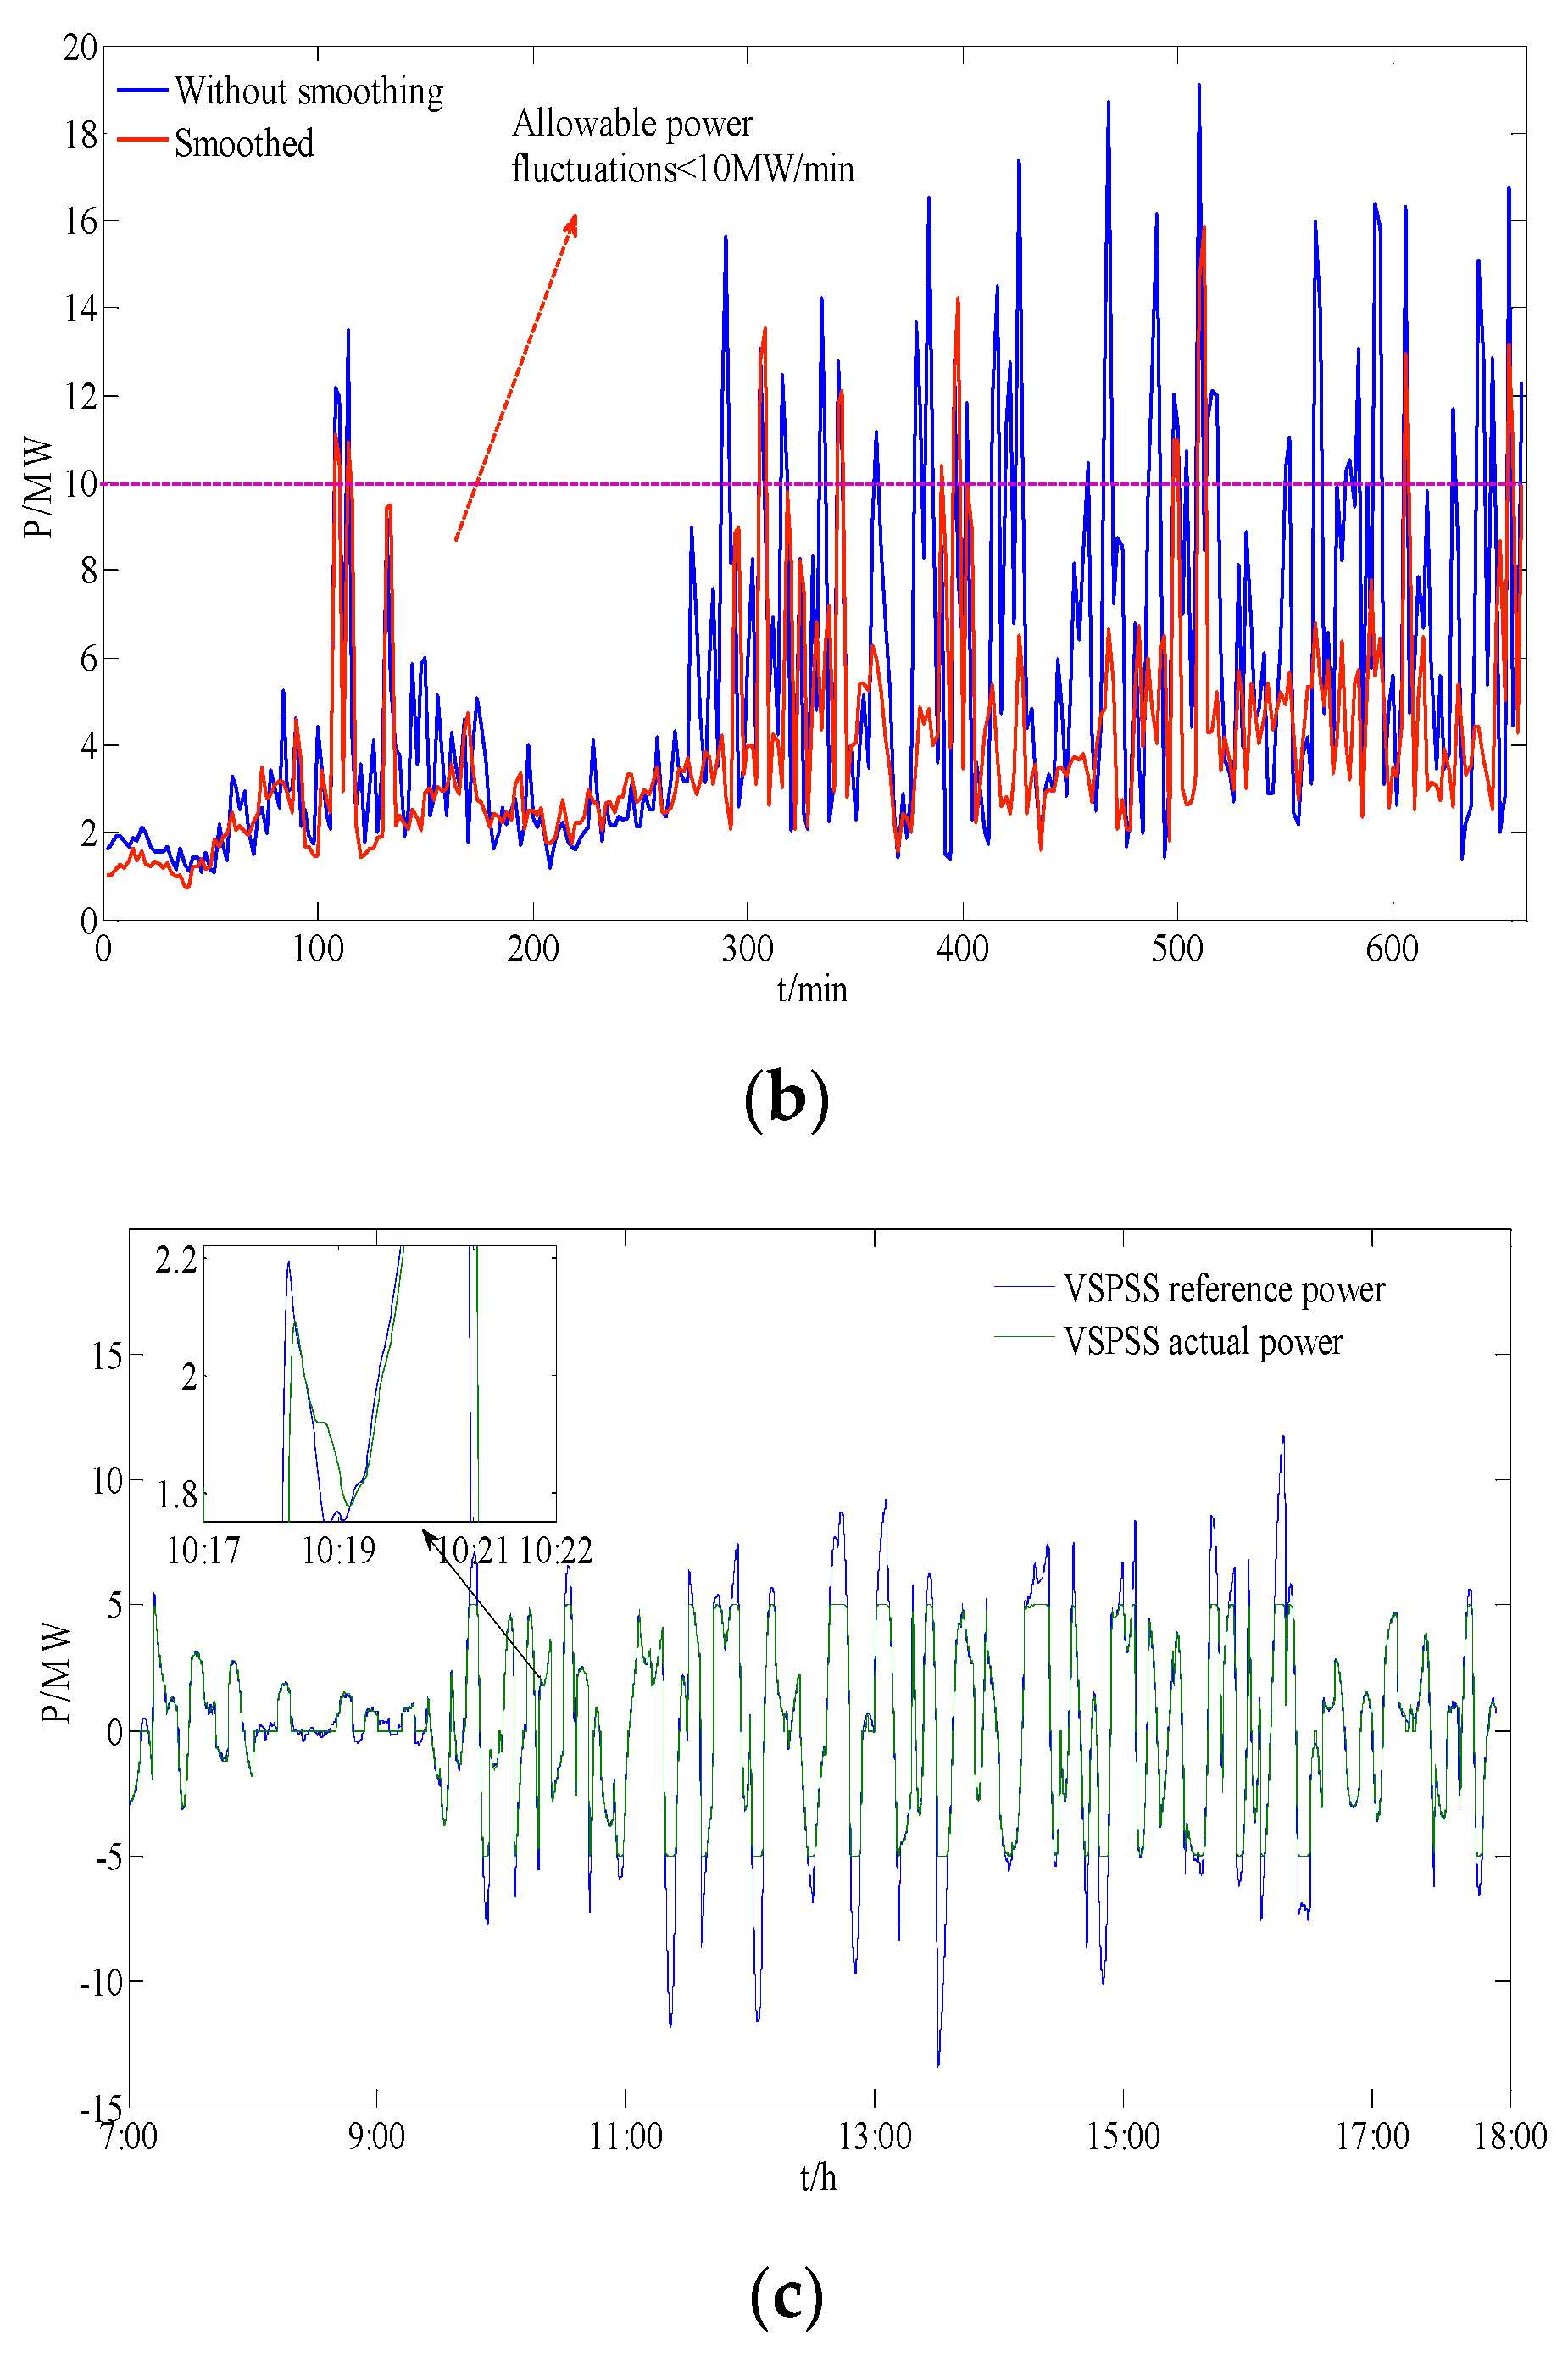
Figure 9 shows the smoothing effects of FA without CHSs. The maximum fluctuation before smoothing was 19.08 MW, the average fluctuation before smoothing was 10.34 MW, and the percentage of failure to reach the requirements before smoothing was 24.84%. The maximum fluctuation after smoothing was 15.41 MW, and the average fluctuation after smoothing was 5.34 MW, and the percentage of failure to reach the requirements after smoothing was 12.12%. The average cumulative error per minute between the reference power and the actual power of VSPSS was 35.75 MW.
By analyzing the above dates in combination with Figure 9, some reasons why the smoothing effects of FA is poor in the system as shown in Figure 9b can be concluded as follows:
Due to the influence of climate, PV power fluctuation has different characteristics, and the uncertainty in the filtering time constant means that the fluctuation of the reference smoothing power is unqualified as shown in Figure 9a.
In the process of system power distribution, the dynamic response of the speed and maximum power (5 MW) of VSPSS are not considered, which increases the average cumulative error per minute between the reference power and the actual power of VSPSS as shown in Figure 9c, and has negative effects on the service life of the generation system.
When the PV power fluctuates greatly, the capacity of VSPSS is insufficient as shown in Figure 9c. In order to improve the smoothing effects, the installed capacity of VSPSS should be increased or additional energy absorption and compensation devices should be introduced.
Figure 10 shows the smoothing effects of FA after the introduction of CHSs. According to the operation conditions, the optimal power value of CHSs is assumed to be 60 MW. The maximum fluctuation before smoothing is 19.08 MW, the average fluctuation before smoothing is 10.34 MW, and the percentage of failure to reach the requirements before smoothing is 24.84%. The maximum fluctuation after smoothing is 15.87 MW, and the average fluctuation after smoothing is 4.02 MW, and the percentage of failure to reach the requirements after smoothing is 9.39%. After the introduction of CHSs, due to the fluctuations with large amplitude and slow frequency being absorbed by CHSs, as shown in Figure 10c, the smoothing effects are improved, as shown in Figure 10b. However, the system power distribution based on FA does not consider the characteristics and operation boundary conditions of the system as shown in Figure 10c,d, which leads to poor following characteristics of the actual power and reference power value of CHSs and VSPSS. The average cumulative error of CHSs and VSPSS per minute are both large, which are 24.09 and 8.21 MW, respectively. Therefore, the smoothing effects are poor.

6.2. Wavelet Packet Decomposition Algorithm

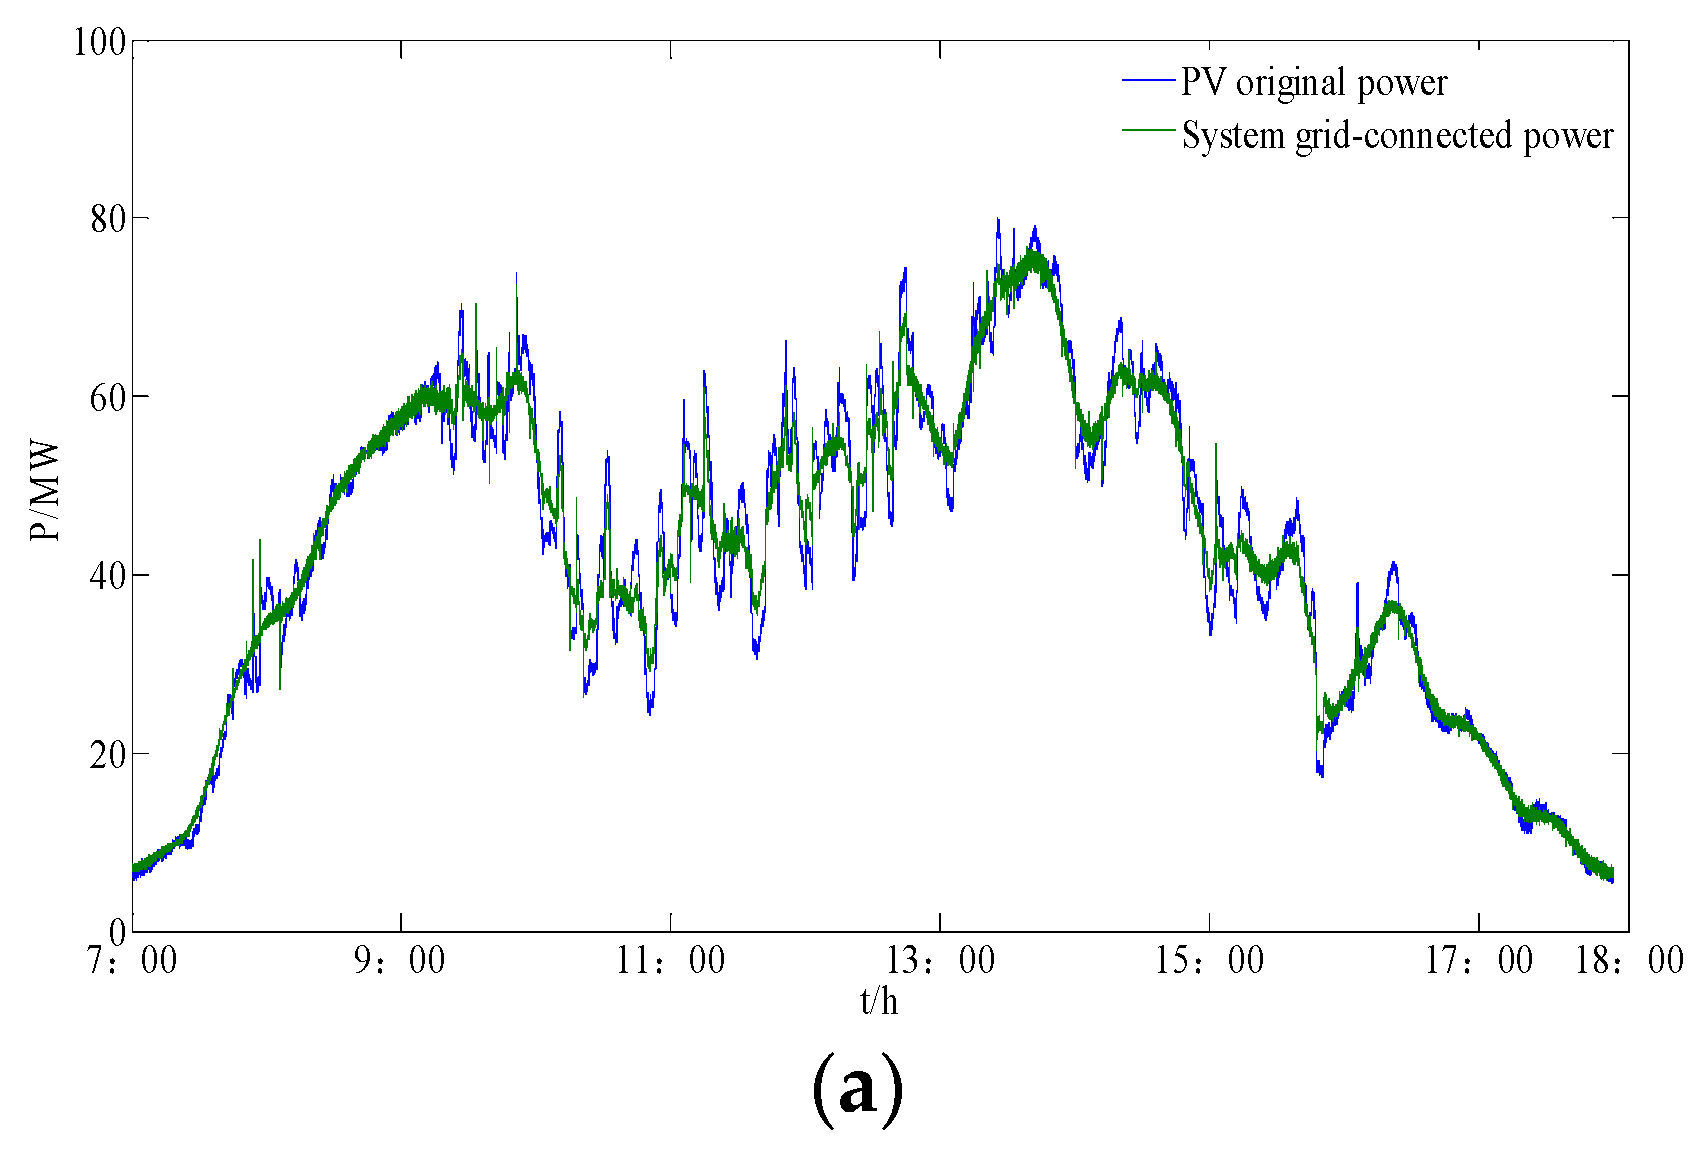
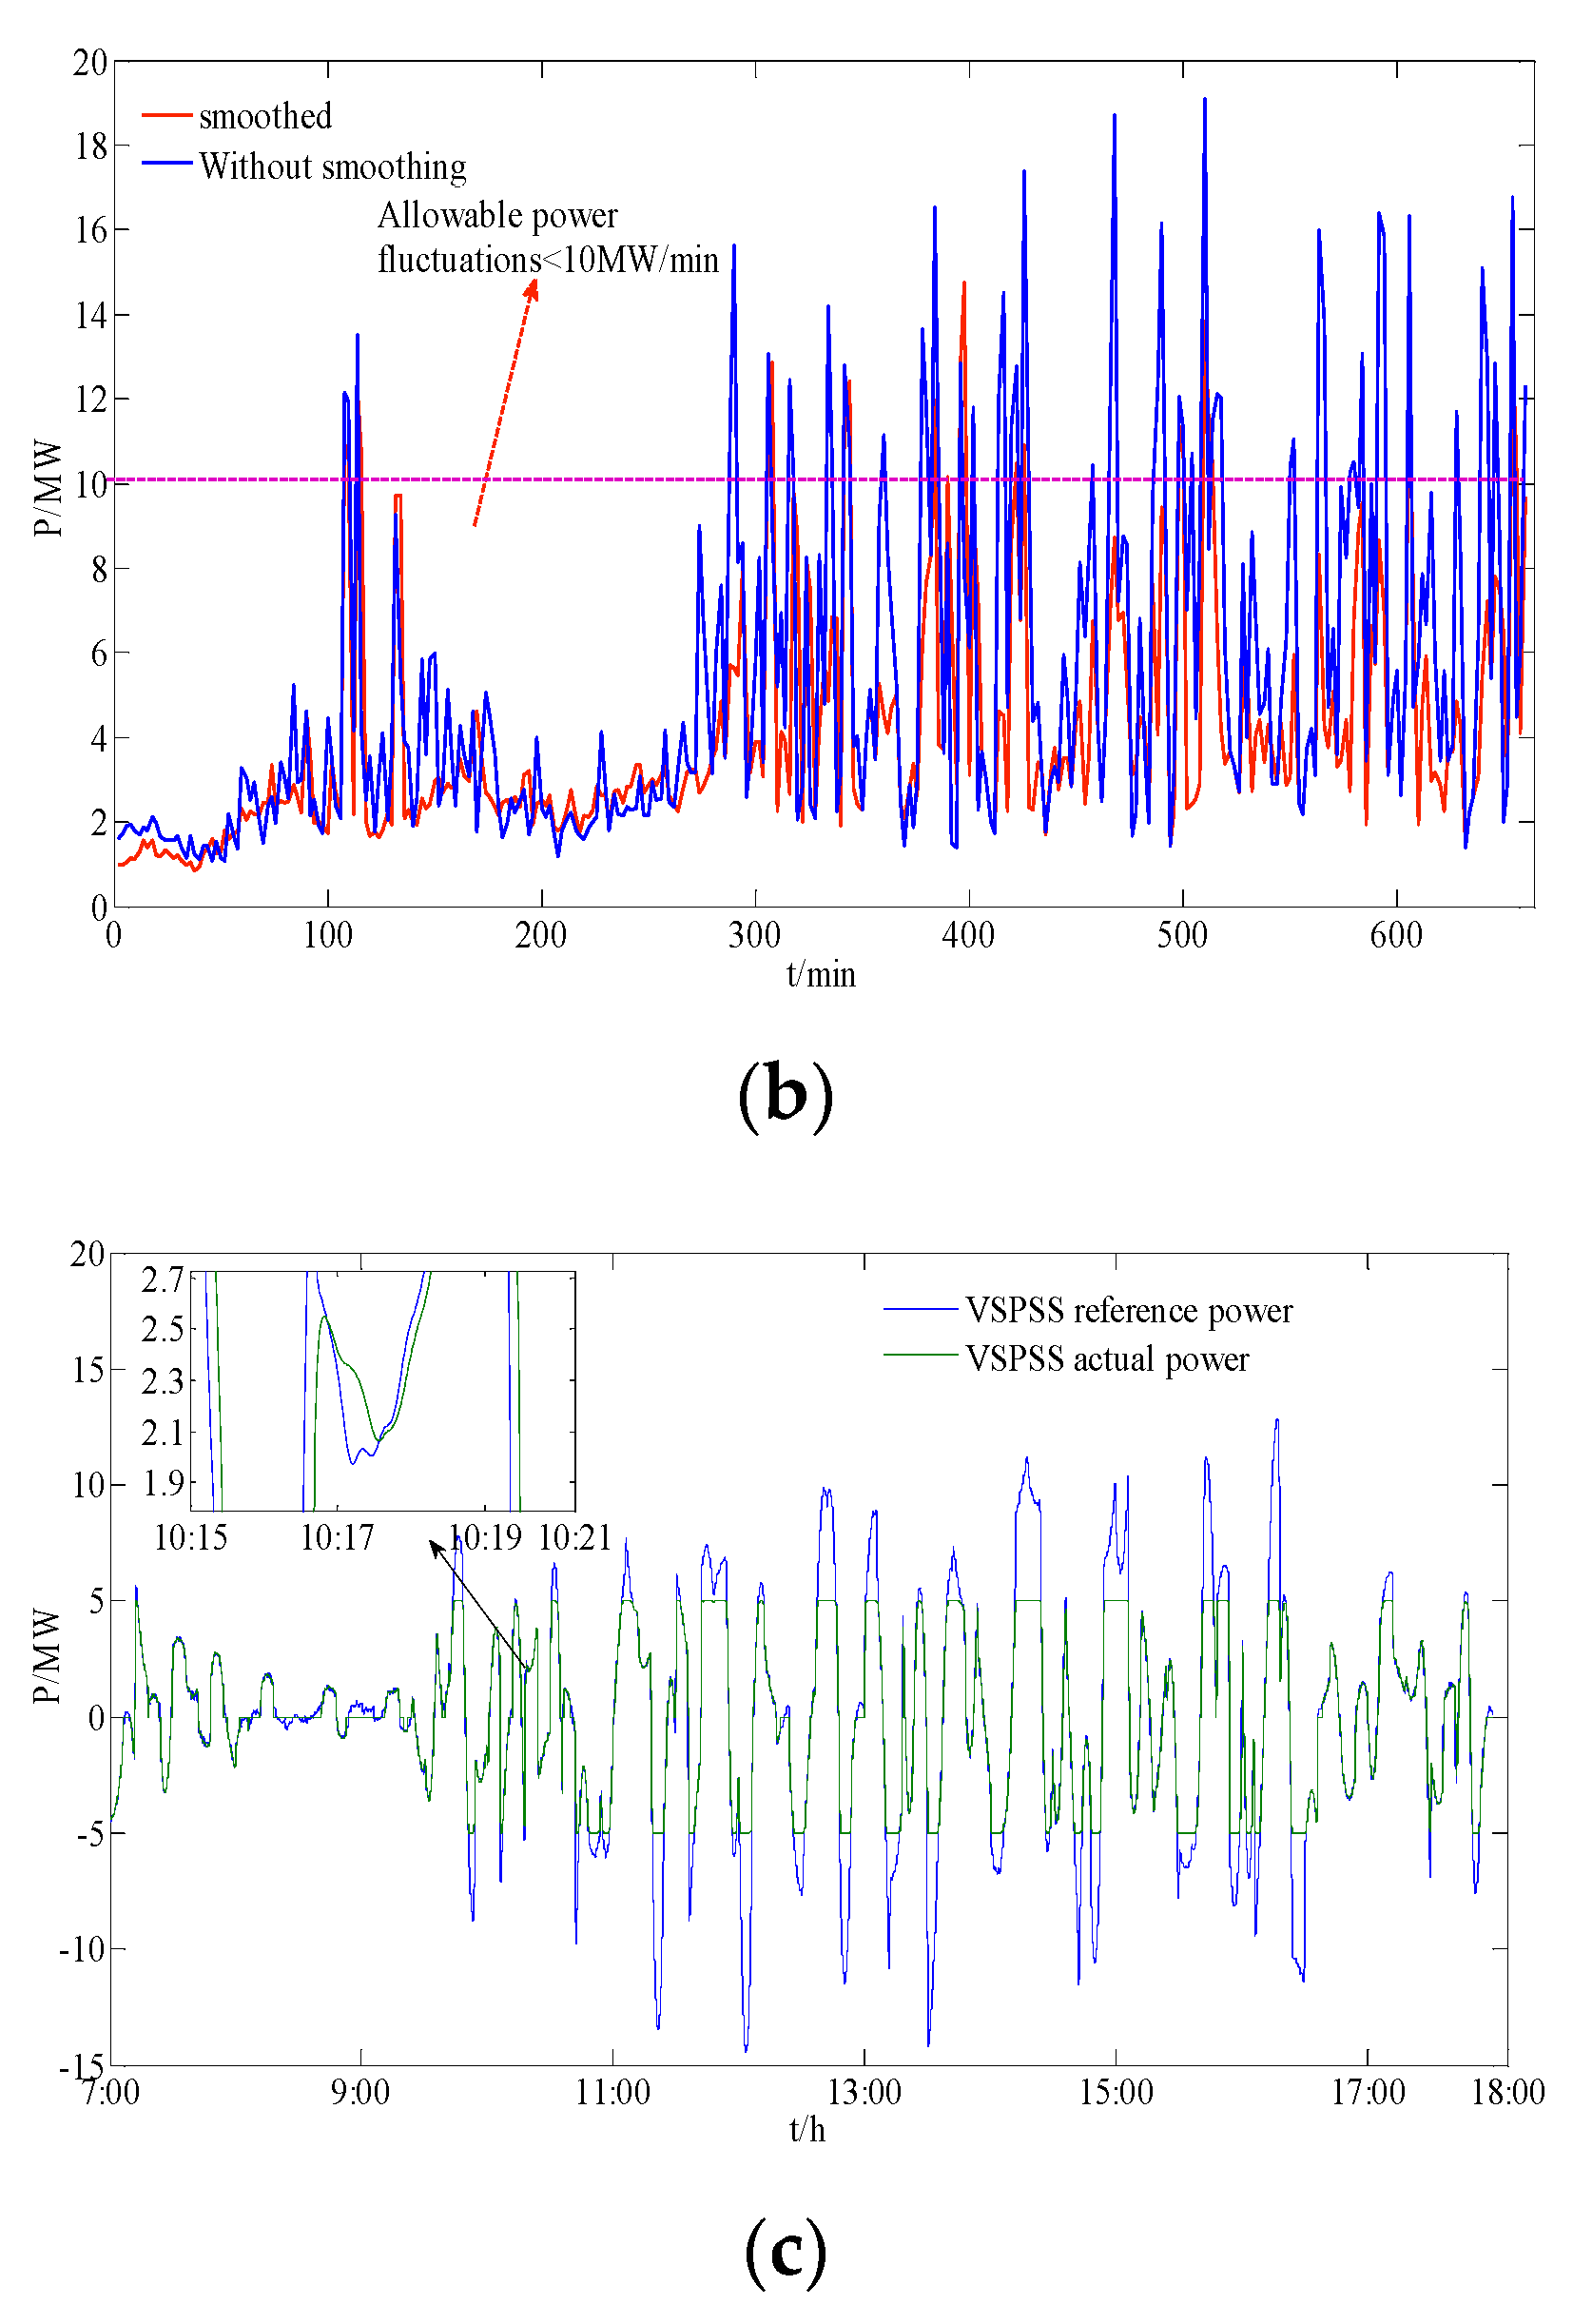
Figure 11 shows the smoothing effects of WPDA without CHSs. The maximum fluctuation before smoothing was 19.08 MW, and the average fluctuation before smoothing was 10.34 MW, and the percentage of failure to reach the requirements before smoothing was 24.84%. The maximum fluctuation after smoothing was 14.73 MW, and the average fluctuation after smoothing was 4.10 MW, and the percentage of failure to reach the requirements after smoothing was 11.8%. The average cumulative error per minute between the reference power and the actual power of VSPSS was 47.93 MW. Compared with the FA, WPDA can obtain more signal features, and the reference smoothing power is more reasonable. However, due to the limited capacity (5 MW) of VSPSS, the PV power fluctuations with large amplitudes were not absorbed as shown in Figure 11c, which leads to poor smoothing effects as shown in Figure 11b.
Figure 12 shows the smoothing effects of WPDA after introducing CHSs. The maximum fluctuation before smoothing was 19.08 MW, and the average fluctuation before smoothing was 10.34 MW, and the percentage of failure to reach the requirements before smoothing was 24.84%. The maximum fluctuation after smoothing was 12.79 MW, and the average fluctuation after was 3.64 MW, and the percentage of failure to reach the requirements after smoothing was 7.27%. The average cumulative error per minute between the actual power value and the reference power value of VSPSS was 0.98 MW, which has a good following performance, and that of CHSs was 10.64 MW. As shown in Figure 12d, the fluctuation speed of CHSs reference power is too fast, which leads to a poor following performance. Compared with FA, WPDA distributes system power according to the response bandwidth of the CH-PV-PS generation system, so the reference smoothing power is more reasonable, as shown in Figure 12a, and the smoothing effects are improved, as shown in Figure 12b. However, due to the system response bandwidth varying with the external operation conditions, the fixed orthogonal basis of decomposition, fixed decomposition layers, and fixed frequency band are not reasonable, and WPDA fails to consider the system boundary condition, as shown in Figure 12c,d, which not only affects the smoothing effects but also reduces the efficiency and service life of the system, so this smoothing method applied to the system is unsatisfactory.

6.3. The Improved Optimal Wavelet Packet Basis Decomposition Algorithm

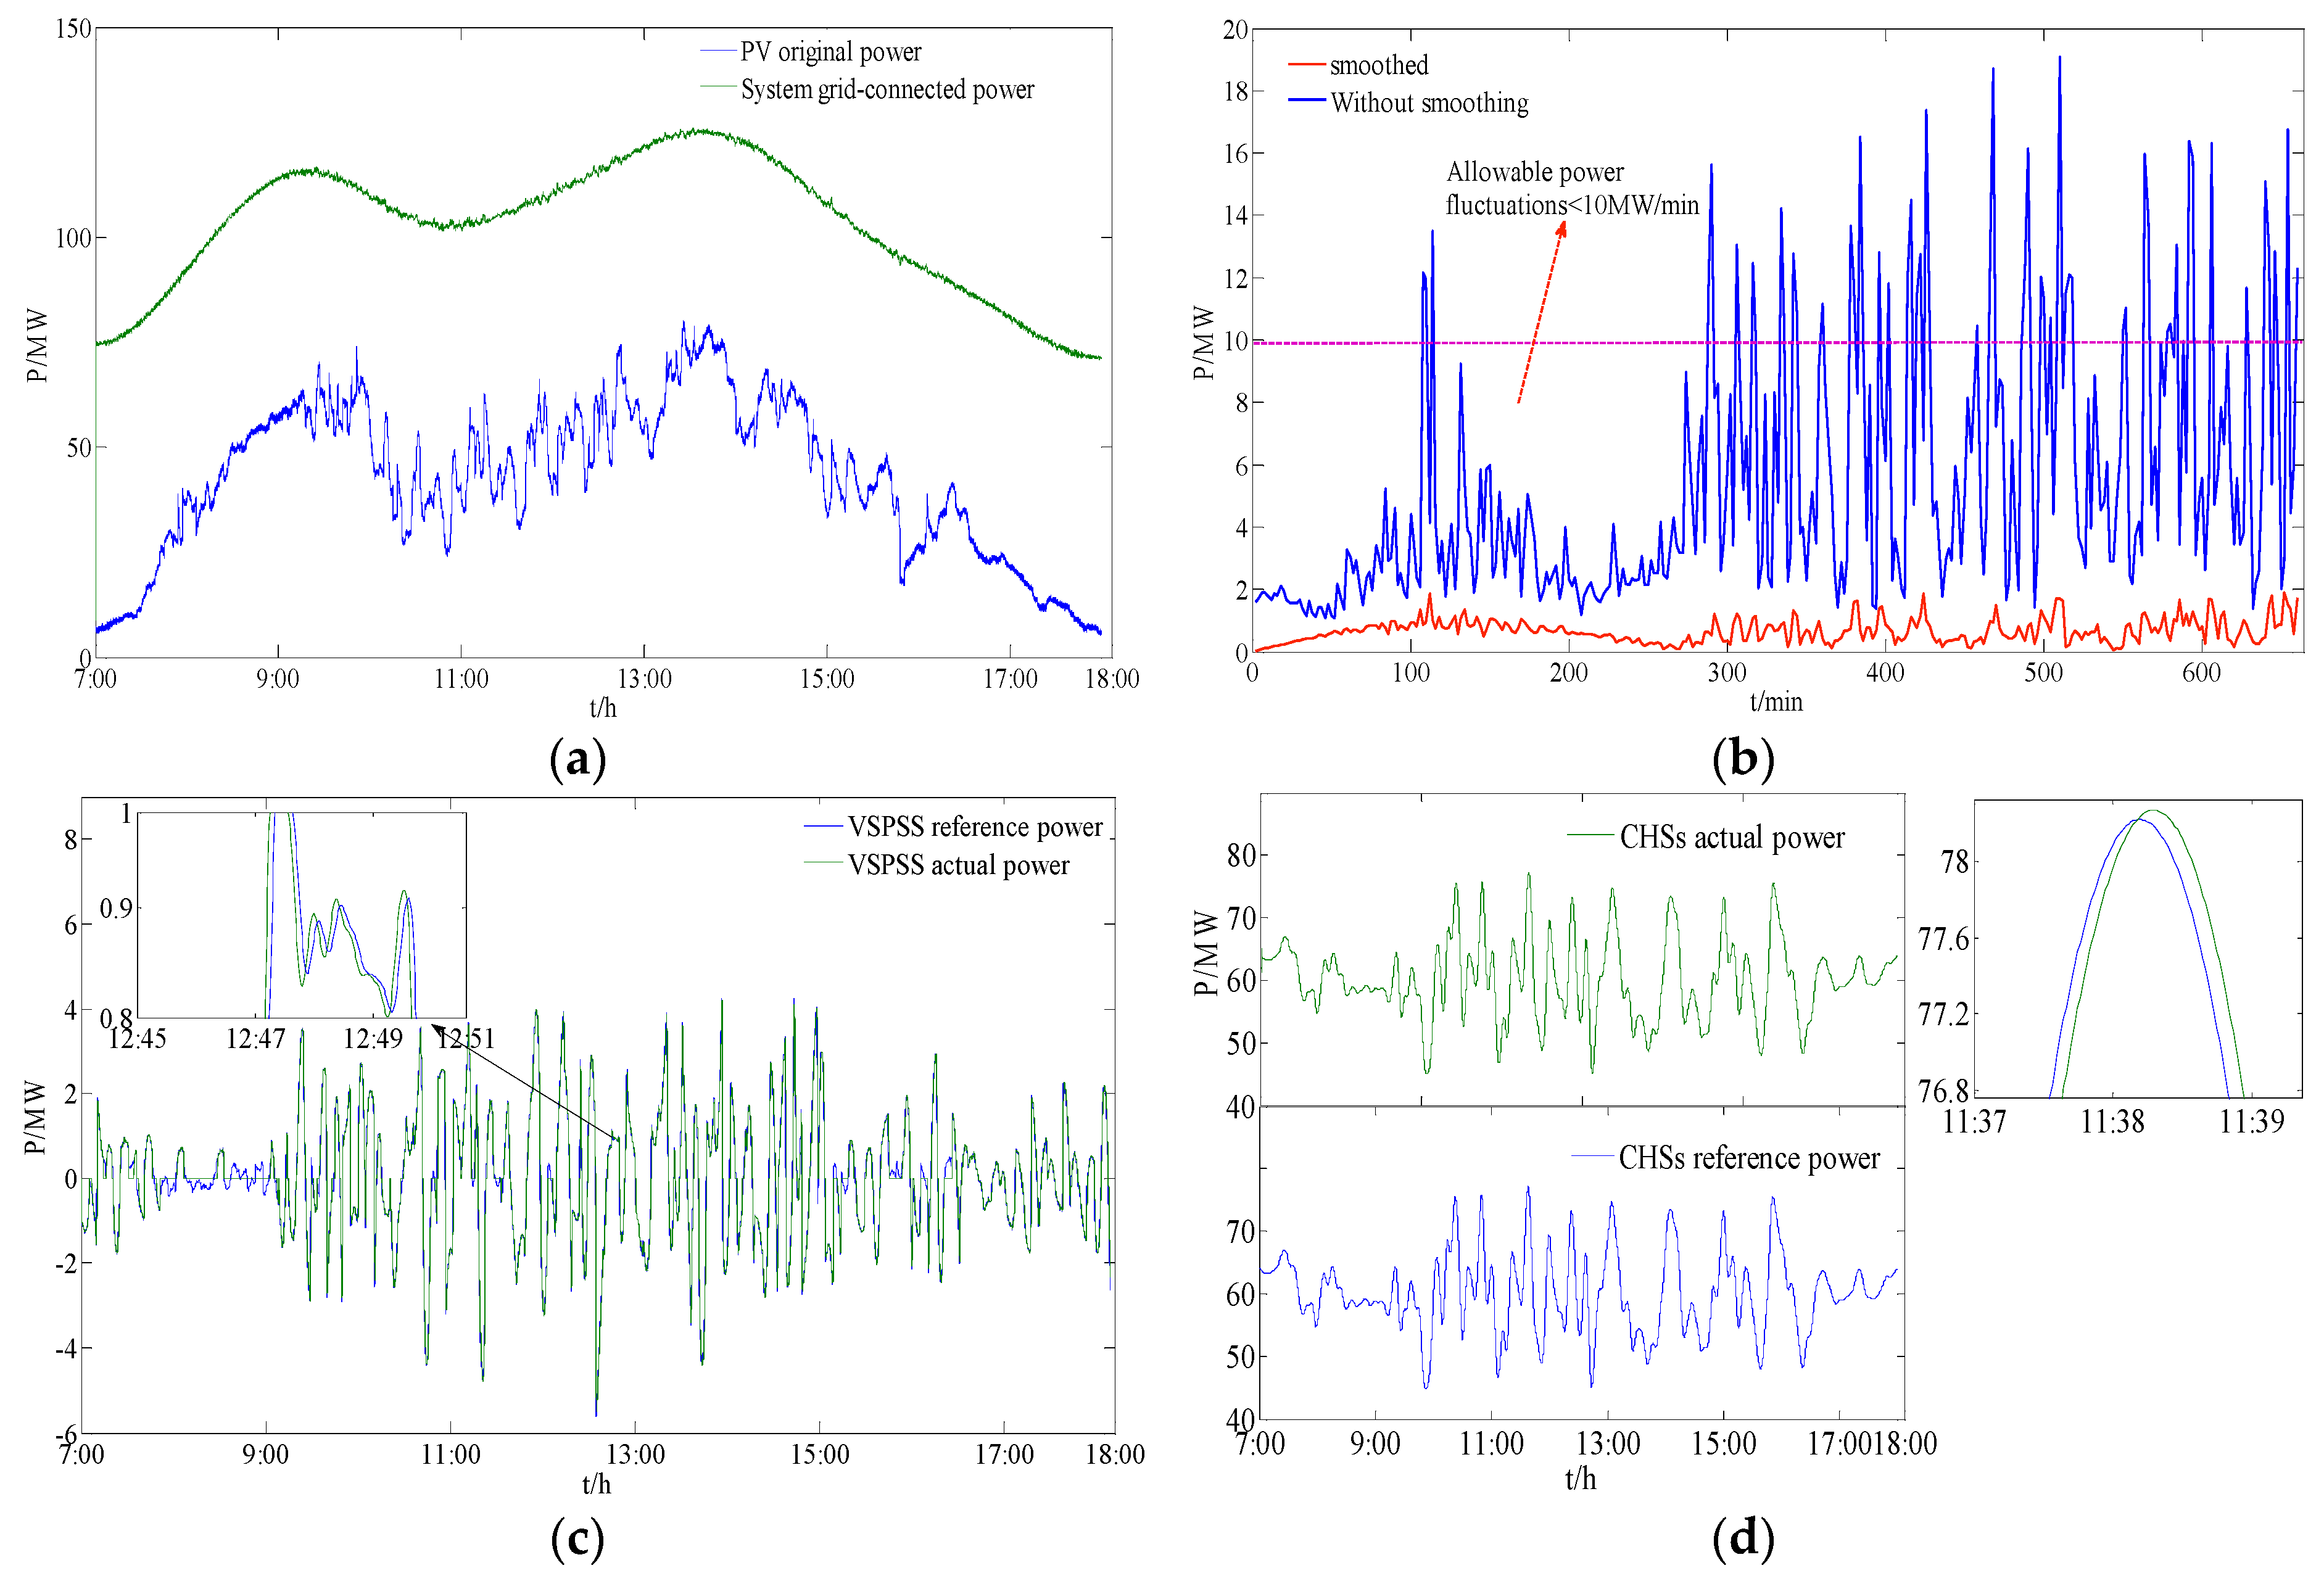
Figure 13 shows the smoothing effects of the improved OWPDA after introducing CHSs. Similarly, the optimal power of CHSs was assumed to be 60 MW according to the operation conditions. Because the optimal operating efficiency was considered, the CHSs always work near the optimal efficiency point as shown in Figure 13d. The maximum fluctuation before smoothing was 19.08 MW, the average fluctuation before smoothing was 10.34 MW, and the percentage of failure to reach the requirements before smoothing was 24.84%. The maximum fluctuation after smoothing was 1.90 MW, and the average fluctuation after smoothing was 0.67 MW, and the percentage of failure to reach the requirements after smoothing was 0.3%. The actual power value and reference power value of VSPSS, and the actual power value and reference power value of CHSs both have excellent following characteristics as shown in Figure 13c,d, and the average cumulative errors per minute are 1.17 and 2.38 MW, respectively.
The comparisons of the performance indexes are shown in Table 4. Compared with the performance indexes of FA and WPDA, the improved OWPDA gives full play to the characteristics of CHSs and VSPSS. As shown in Figure 13c,d, PV power with large amplitude and slow fluctuation is absorbed by CHSs and PV power with small amplitude and fast fluctuation is absorbed by VSPSS, therefore, the system power distribution is more reasonable. Due to the improved method selecting the decomposition layer number and decomposition basis adaptively by referring to the ideal smoothing power trajectories, the reference smoothing power is more reasonable as shown in Figure 13a. Moreover, this method also takes into account the operation boundary conditions of the generation system. Therefore, it not only significantly improves the smoothing effects, as shown in Figure 13b, but also improves the operation efficiency and service life, and ensures normal operation of the CH-PV-PS system.

7. Conclusions

In this paper, a new power fluctuation smoothing method for the CH-PV-PS generation system was presented to smooth PV power fluctuation, which not only increased the utilization of clean and renewable energy but also had good smoothing effects. PV power fluctuations were completely absorbed and compensated, which resulted in complementary energy advantages. To solve the problem of how to allocate the system power more reasonably according to the characteristics of the generation system and PV power fluctuations, an improved OWPDA was proposed. Considering the PV power fluctuation characteristics, system operation boundary, and response speed, the cost function was introduced in the algorithm and the ideal power trajectory sequence was constructed to achieve a more reasonable power distribution. Moreover, considering the real-time control requirements for engineering applications, the starting threshold of the algorithm was set, and a function with an additive characteristic was introduced to improve the optimization speed of the adaptive power distribution method, and a fuzzy controller was designed to optimize the inevitable delay time of the control system. The analysis results indicate that the proposed control algorithm in this paper is better than FA and WPDA, which not only significantly improves the smoothing effects but also improves the operation efficiency and service life of the system. This power fluctuation smoothing method has important engineering application prospects, but the capacity optimization configuration of the CH-PV-PS generation system needs further study.

Author Contributions

F.W. and J.W. mainly carried out, completed this work, simulated and analyzed; Z.S. provided and analyzed the field data; T.W. and others supplemented and perfected this work in the later stage; L.C. and X.H. wrote and reviewed the text; all authors revised and approved the final manuscript.

Funding

This work was supported by a grant from National key research and development program support (2018YFB0905200) and the innovation fund of postgraduate, Xihua University (No. ycjj2019048 and No. ycjj2019049).

Conflicts of Interest

The authors declare no conflict of interest.

References

  1. Siddiqui, O.; Dincer, I.; Yilbas, B.S. Development of a novel renewable energy system integrated with biomass gasification combined cycle for cleaner production purposes. J. Clean. Prod. 2019, 241, 118345. [Google Scholar] [CrossRef]
  2. Matthew, D.L.; Efstathios, E.M.; Dimitrios, N.M. Energy storage needs for the substitution of fossil fuel power plants with renewables. Renew. Energy 2019, 145, 951–962. [Google Scholar]
  3. Alam, M.J.E.; Muttaqi, K.M.; Sutanto, D. A novel approach for ramp-rate control of solar PV using energy storage to mitigate output fluctuations caused by cloud passing. IEEE Trans. Energy Convers. 2014, 29, 507–518. [Google Scholar]
  4. Elvira-Ortiz, D.A.; Morinigo-Sotelo, D.; Duque-Perez, O.; Jaen-Cuellar, A.Y.; Osornio-Rios, R.A.; Romero-Troncoso, R.D.J. Methodology for flicker estimation and its correlation to environmental factors in photovoltaic generation. IEEE Access 2018, 6, 24035–24047. [Google Scholar] [CrossRef]
  5. Li, X.; Hui, D.; Lai, X. Battery energy storage station (BESS)-based smoothing control of photovoltaic (PV) and wind power generation fluctuations. IEEE Trans. Sustain. Energy 2013, 4, 464–473. [Google Scholar] [CrossRef]
  6. Lei, M.; Yang, Z.; Wang, Y. An MPC-based ESS control method for PV power smoothing applications. IEEE Trans. Power Electron. 2018, 33, 2136–2144. [Google Scholar] [CrossRef] [Green Version]
  7. Anvari, M.B.; Werther, G.; Lohmann, M.; Wächter, J.; Beck, H.P. Suppressing power output fluctuations of photovoltaic power plants. Solar Energy 2017, 57, 735–743. [Google Scholar] [CrossRef]
  8. Han, X.; Chen, F.; Cui, X.; Li, Y.; Li, X. A power smoothing control strategy and optimized allocation of battery capacity based on hybrid storage energy technology. Energies 2012, 5, 1593–1612. [Google Scholar] [CrossRef] [Green Version]
  9. Marcos, J.; De la Parra, I.; García, M.; Marroyo, L. Control strategies to smooth short-term power fluctuations in large photovoltaic plants using battery storage systems. Energies 2014, 7, 6593–6619. [Google Scholar] [CrossRef]
  10. Ma, W.; Wang, W.; Wu, X.; Hu, R.; Tang, F.; Zhang, W. Control strategy of a hybrid energy storage system to smooth photovoltaic power fluctuations considering photovoltaic output power curtailment. Sustainability 2019, 11, 1324. [Google Scholar] [CrossRef] [Green Version]
  11. Junjie, H.; Huayanran, Z.; Yang, L. Real-time dispatching strategy for aggregated electric vehicles to smooth power fluctuation of photovoltaic. Power Syst. Technol. 2019, 43, 2552–2560. [Google Scholar]
  12. Li, Z.; Guo, Q.; Sun, H. Storage-like devices in load leveling: Complementarity constraints and a new and exact relaxation method. Appl. Energy 2015, 151, 13–22. [Google Scholar] [CrossRef]
  13. Imanaka, M.; Sasamoto, H.; Baba, J.; Higa, N.; Shimabuku, M. Compensation for PV generation fluctuations by use of pump system with consideration for water demand. Electr. Eng. Technol. 2015, 10, 1304–1310. [Google Scholar] [CrossRef] [Green Version]
  14. Seyed, M.H.H.; Mohammad, R.S. A novel technology for control of variable speed pumped storage power plant. J. Cent. South Univ. 2016, 23, 2008–2023. [Google Scholar]
  15. Xu, B.; Chen, D.; Venkateshkumar, M.; Xiao, Y. Modeling a pumped storage hydropower integrated to a hybrid power system with solar-wind power and its stability analysis. Appl. Energy 2019, 248, 446–462. [Google Scholar] [CrossRef]
  16. Yang, W.; Yang, J. Advantage of variable-speed pumped storage plants for mitigating wind power variations: Integrated modelling and performance assessment. Appl. Energy 2019, 237, 720–732. [Google Scholar] [CrossRef]
  17. Zhang, N.; Kang, C.; Kirschen, D.S.; Xia, Q.; Xi, W.; Huang, J.; Zhang, Q. Planning pumped storage capacity for wind power integration. IEEE Trans. Sustain. Energy 2013, 4, 393–401. [Google Scholar] [CrossRef]
  18. Yuan, A.; Wei, F.; Bo, M.; Qiang, H. Theories and methodology of complementary hydro/photovoltaic operation: Applications to short-term scheduling. J. Renew. Sustain. Energy 2015, 7, 063133. [Google Scholar]
  19. Traube, J.; Fenglong, L.; Maksimovic, D.; Mossoba, J.; Kromer, M.; Faill, S.K.P.; Borowy, B.; Nichols, S.; Casey, L. Mitigation of solar irradiance intermittency in photovoltaic power systems with integrated electric vehicle charging functionality. IEEE Trans. Power Electron. 2013, 28, 3058–3067. [Google Scholar] [CrossRef]
  20. Wei, L.; Joos, G.; Belanger, J. Real-time simulation of a wind turbine generator coupled with a battery supercapacitor energy storage system. IEEE Trans. Ind. Electron. 2010, 57, 1137–1145. [Google Scholar] [CrossRef]
  21. Abbey, C.; Strunz, K.; Joos, G. A knowledge-based approach for control of two-level energy storage for wind energy systems. IEEE Trans. Energy Convers. 2009, 24, 539–547. [Google Scholar] [CrossRef]
  22. Jiang, Q.; Wang, H. Two-time-scale coordination control for a battery energy storage system to mitigate wind power fluctuations. IEEE Trans. Energy Convers. 2013, 28, 52–61. [Google Scholar] [CrossRef]
  23. Dwi, R.A.; Jung-Su, K.; Hwachang, S. Suppression of PV output fluctuation using a battery energy storage system with model predictive control. Int. J. Fuzzy Syst. 2017, 17, 202–209. [Google Scholar]
  24. Han, X.; Chen, Y.; Zhang, H.; Chen, F. Application of hybrid energy storage technology based on wavelet packet decomposition in smoothing the fluctuations of wind power. Proc. CSEE 2013, 33, 8–13. [Google Scholar]
  25. Wu, Z.; Jiang, X.; Ma, H.; Ma, S. Wavelet packet-fuzzy control of hybrid energy storage systems for PV power smoothing. Proc. CSEE 2014, 34, 317–324. [Google Scholar]
  26. Li, X.; Li, Y.; Han, X.; Hui, D. Application of fuzzy wavelet transform to smooth wind/PV hybrid power system output with battery energy storage system. Energy Procedia 2011, 12, 994–1001. [Google Scholar] [CrossRef] [Green Version]
  27. Sivakumar, N.; Das, D.; Padhy, N.P. Variable speed operation of reversible pump-turbines at Kadamparai pumped storage plant—A case study. Energy Convers. Manag. 2014, 78, 96–104. [Google Scholar] [CrossRef]
  28. Naik, K.A.; Gupta, C.P.; Fernandez, E. Design and implementation of interval type-2 fuzzy logic-PI based adaptive controller for DFIG based wind energy system. Int. J. Electr. Power Energy Syst. 2017, 115, 105468. [Google Scholar] [CrossRef]
  29. Lei, C.; Jun, W.; Zhang, S.; Tao, H. Smoothing photovoltaic power fluctuations for cascade hydro-PV-pumped storage generation system based on a fuzzy CEEMDAN. IEEE Access 2019. [Google Scholar] [CrossRef]
  30. Victor, M.M.; Miguel, A.G.; Fermin, B.; Maria, I.M. A grid connected photovoltaic inverter with battery-super capacitor hybrid energy storage. Sensors 2017, 17, 507–518. [Google Scholar]
Figure 1. The topological structure of the CH-PV-PS generation system in Xiao Jing County.
Energies 12 04642 g001
Figure 2. Flow chart of the PV power smoothing method.
Energies 12 04642 g002
Figure 3. Schematic diagram of n-layer wavelet packet decomposition.
Energies 12 04642 g003
Figure 4. Decomposition effects of different wavelet packet bases.
Energies 12 04642 g004
Figure 5. Reference power distribution principle of CHSs and VSPSS.
Energies 12 04642 g005
Figure 6. Reference power value obtained by the optimal wavelet packet decomposition when the delay time is 2 min.
Energies 12 04642 g006
Figure 7. Comparison of the smoothing effects under different delay times. (a) The delay time is 1 min. (b) The delay time is 0.5 min.
Energies 12 04642 g007
Figure 8. Input and output membership functions of the fuzzy controller. (a) ep membership function; (b) epc membership function; (c) d membership function.
Energies 12 04642 g008
Figure 9. Analysis of FA without CHSs. (a) Comparison of output power before smoothing and after smoothing; (b) Comparison of power fluctuation per minute before smoothing and after smoothing; (c) Comparison of reference power and actual power of VSPSS.
Energies 12 04642 g009aEnergies 12 04642 g009b
Figure 10. Analysis of FA after introducing CHSs. (a) Comparison of output power before smoothing and after smoothing; (b) Comparison of power fluctuation per minute before smoothing and after smoothing; (c) Comparison of reference power and actual power of VSPSS; (d) Comparison of reference power and actual power of CHSs.
Energies 12 04642 g010
Figure 11. Analysis of WPDA without CHSs. (a) Comparison of output power before smoothing and after smoothing; (b) Comparison of power fluctuation per minute before smoothing and after smoothing; (c) Comparison of reference power and actual power of VSPSS.
Energies 12 04642 g011aEnergies 12 04642 g011b
Figure 12. Analysis of WPDA after introducing CHSs. (a) Comparison of output power before smoothing and after smoothing; (b) Comparison of power fluctuation per minute before smoothing and after smoothing; (c) Comparison of reference power and actual power of VSPSS; (d) Comparison of reference power and actual power of CHSs.
Energies 12 04642 g012
Figure 13. Analysis of OWPDA. (a) Comparison of output power before smoothing and after smoothing; (b) Comparison of power fluctuation per minute before smoothing and after smoothing; (c) Comparison of reference power and actual power of VSPSS; (d) Comparison of reference power and actual power of CHSs.
Energies 12 04642 g013
Table 1. Advantages and disadvantages of existing smoothing systems.
Smoothing SystemAdvantagesDisadvantages
Hybrid energy storage batteryExcellent smoothing effectsShort service life,
high maintenance cost,
not friendly to the environment
Controllable loadsFlexible operation,
high economic effect
The smoothing effect is heavily influenced by load requirements
Variable speed pumped storage stationClean energy,
high control accuracy,
quick response
Small capacity, expensive, inefficient
Cascade hydropower stationsClean energy,
large capacity,
high economic effect
Poor smoothing effect,
slow response,
low control accuracy
Table 2. Hierarchical structure of wavelet packet decomposition.
{F0F1F2F3F4F5F6F7}x1
{S0S1S2S3}x2{D0D1D2D3}x3
{SS0SS1}x4{DS0DS1}x5{SD0SD1}x6{DD0DD1}x7
Table 3. Fuzzy control rules.
depc
ep VVSVSSMBVB
VVSVBBMSVSVS
VSVBBMSVSVVS
SVBBMVSVSVVS
MVBMMSVSVVS
BVBMSSVSVVS
VBBMSSVVSVVS
Table 4. Smoothing performance indexes.
MethodFailure to Reach Requirements (%)Maximum
Fluctuation (MW)
Average Fluctuation (MW)Accumulative Error of VSPS (MW)Accumulative
Error of CHSs (MW)
BS 124.819.0810.34--
FA
WO 2 CHSs
12.1215.415.3435.75-
WPDA WO CHSs11.814.734.1047.93-
FA9.3915.874.0224.098.21
WPDA7.2712.793.640.9810.64
OWPDA0.31.90.671.172.38
1 BS = before smoothing; 2 WO = without.