Effects of Intercooling and Inter-Stage Heat Recovery on the Performance of Two-Stage Transcritical CO2 Cycles for Residential Heating Applications


Abstract
:
1. Introduction
2. Cycles and Sub-Cycles under Analysis
3. Mathematical Modelling
3.1. Thermodynamic Analysis
3.2. Optimization Conditions
4. Results and Discussion
4.1. Optimization Results
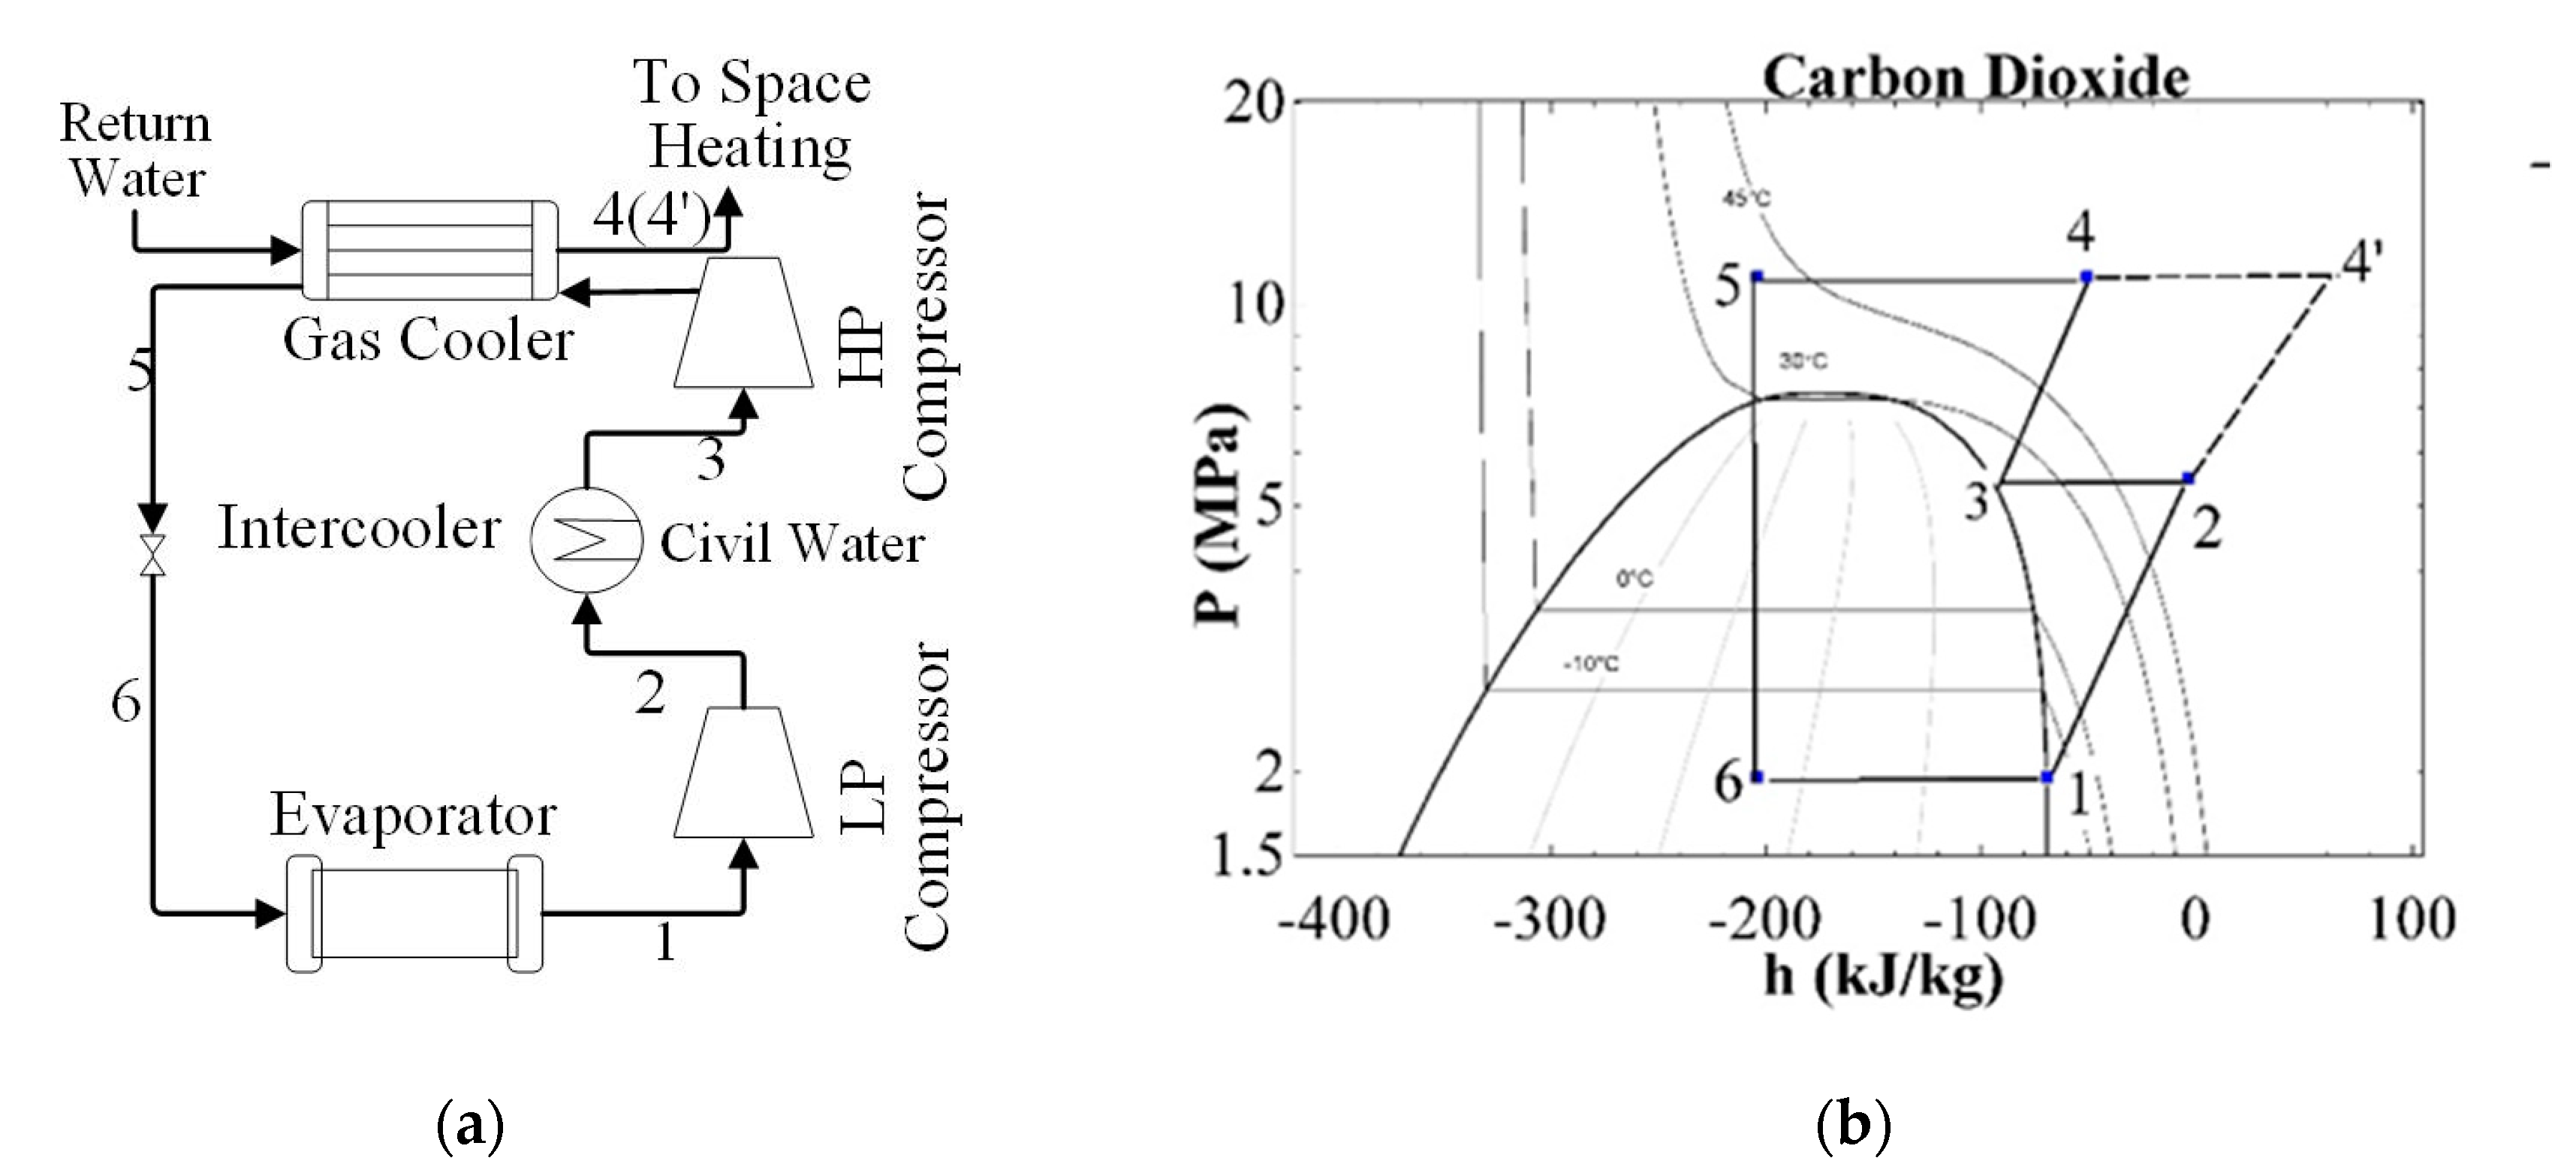
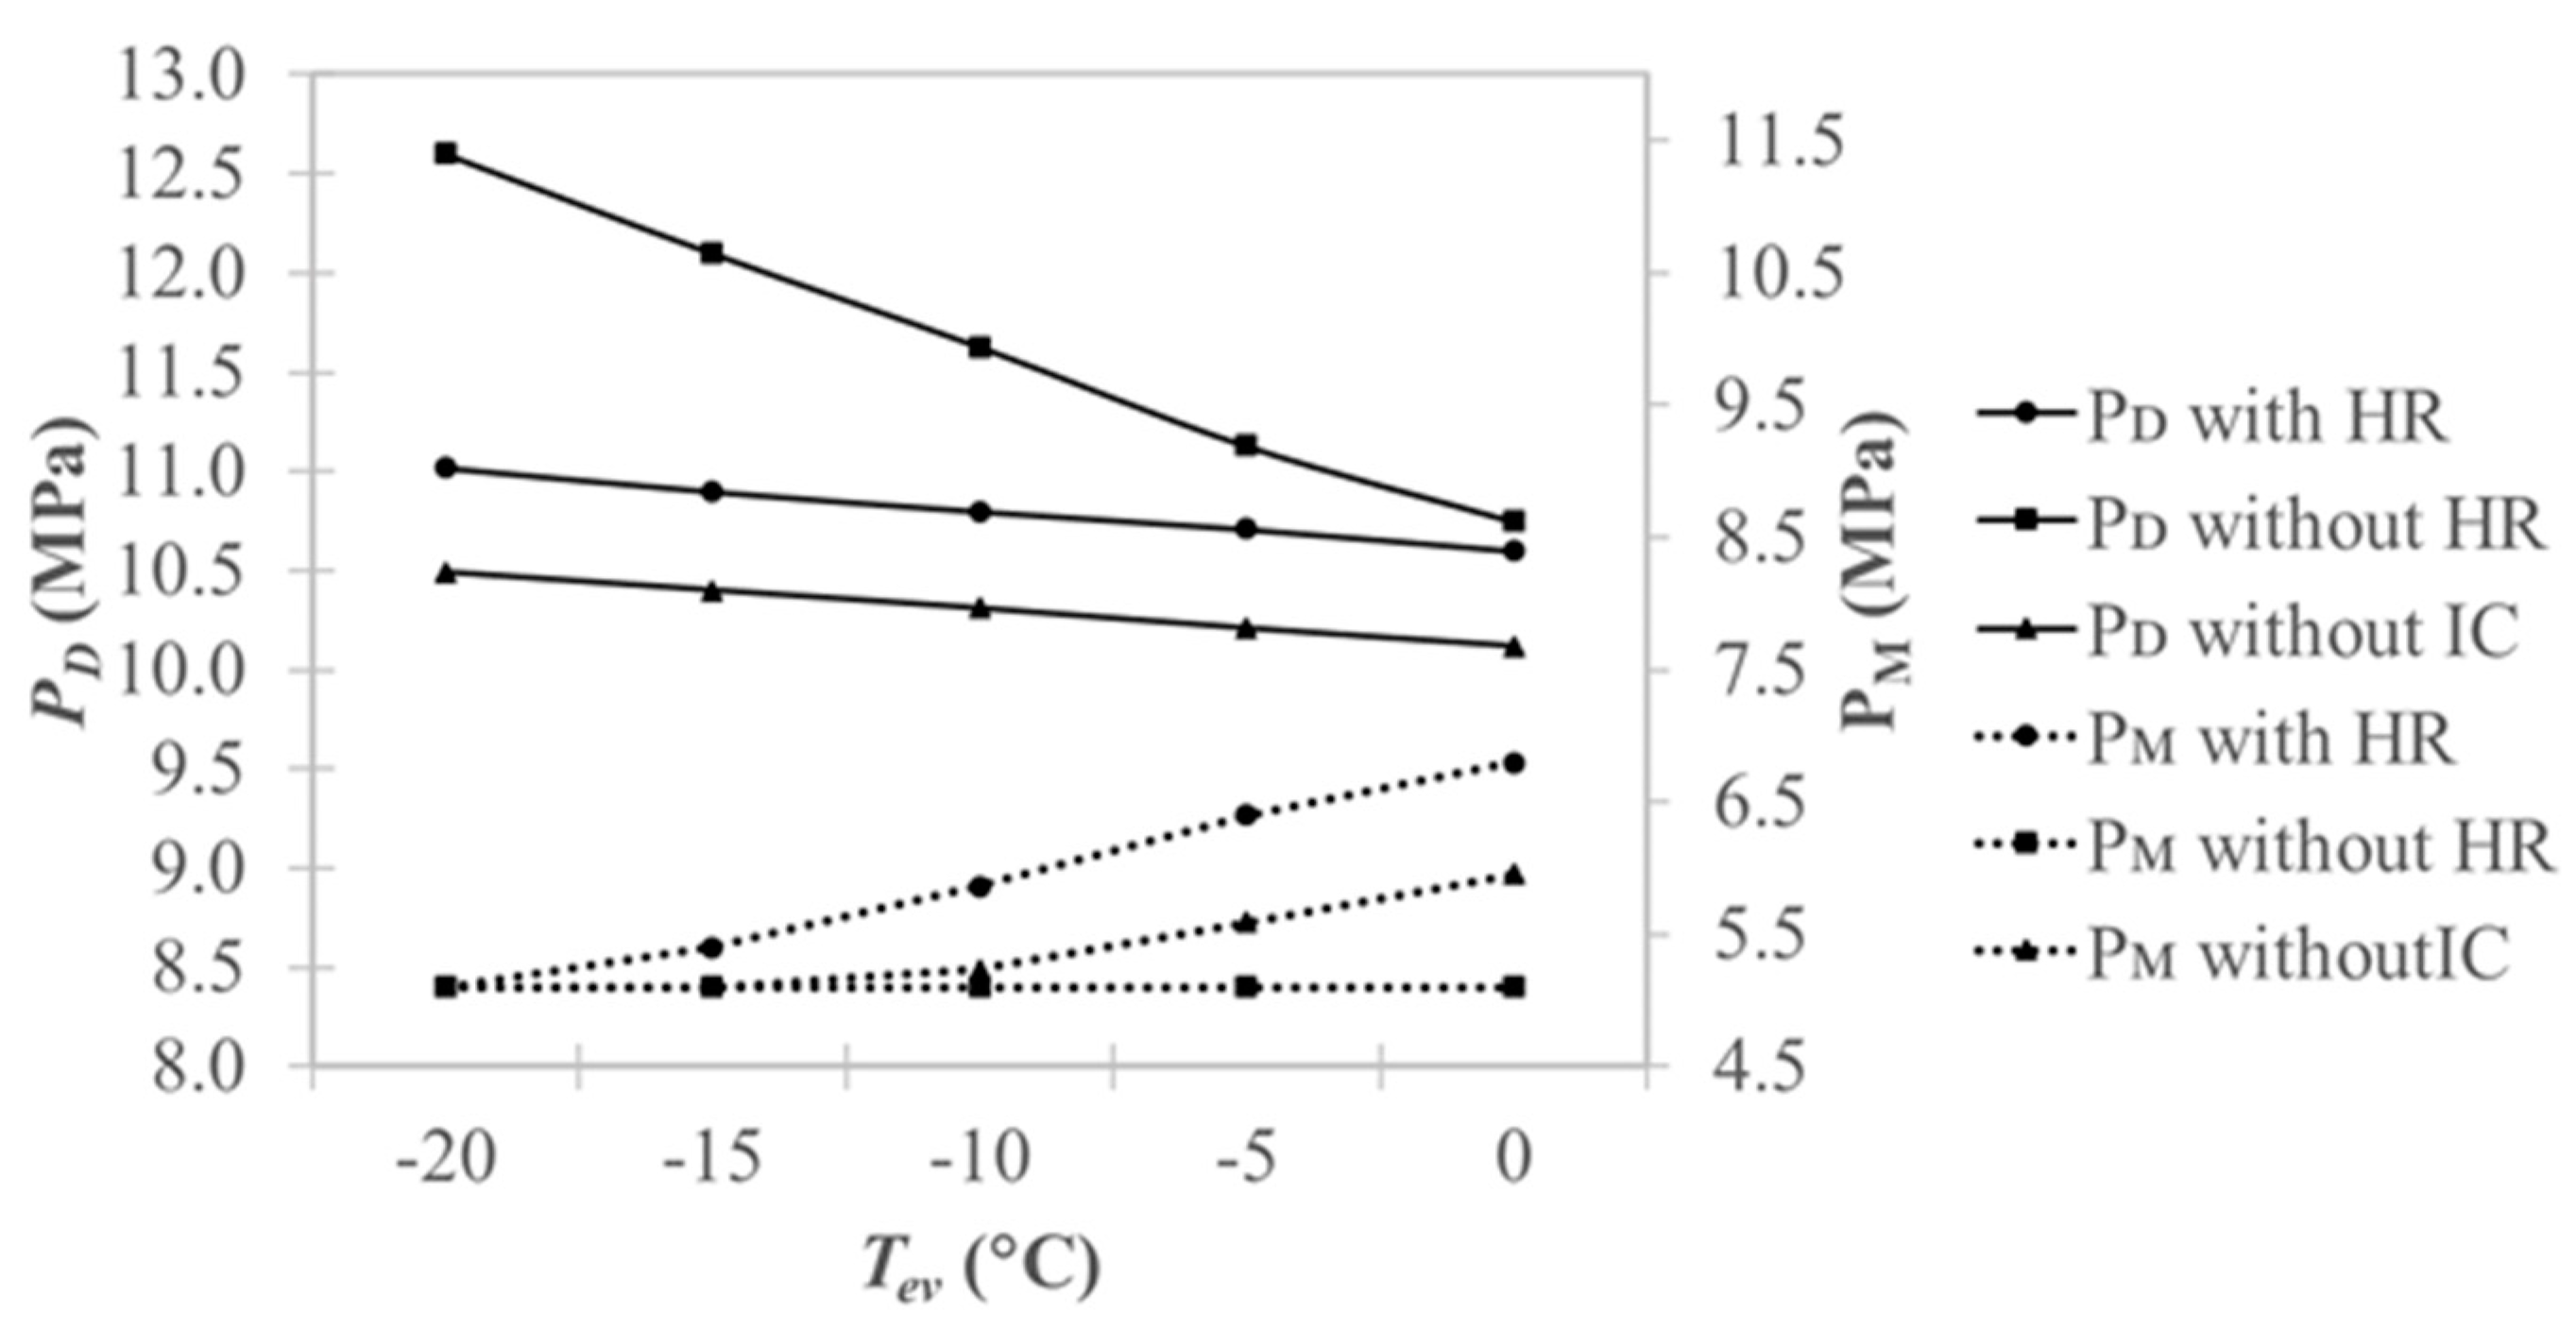
4.1.1. Intercooler Cycle
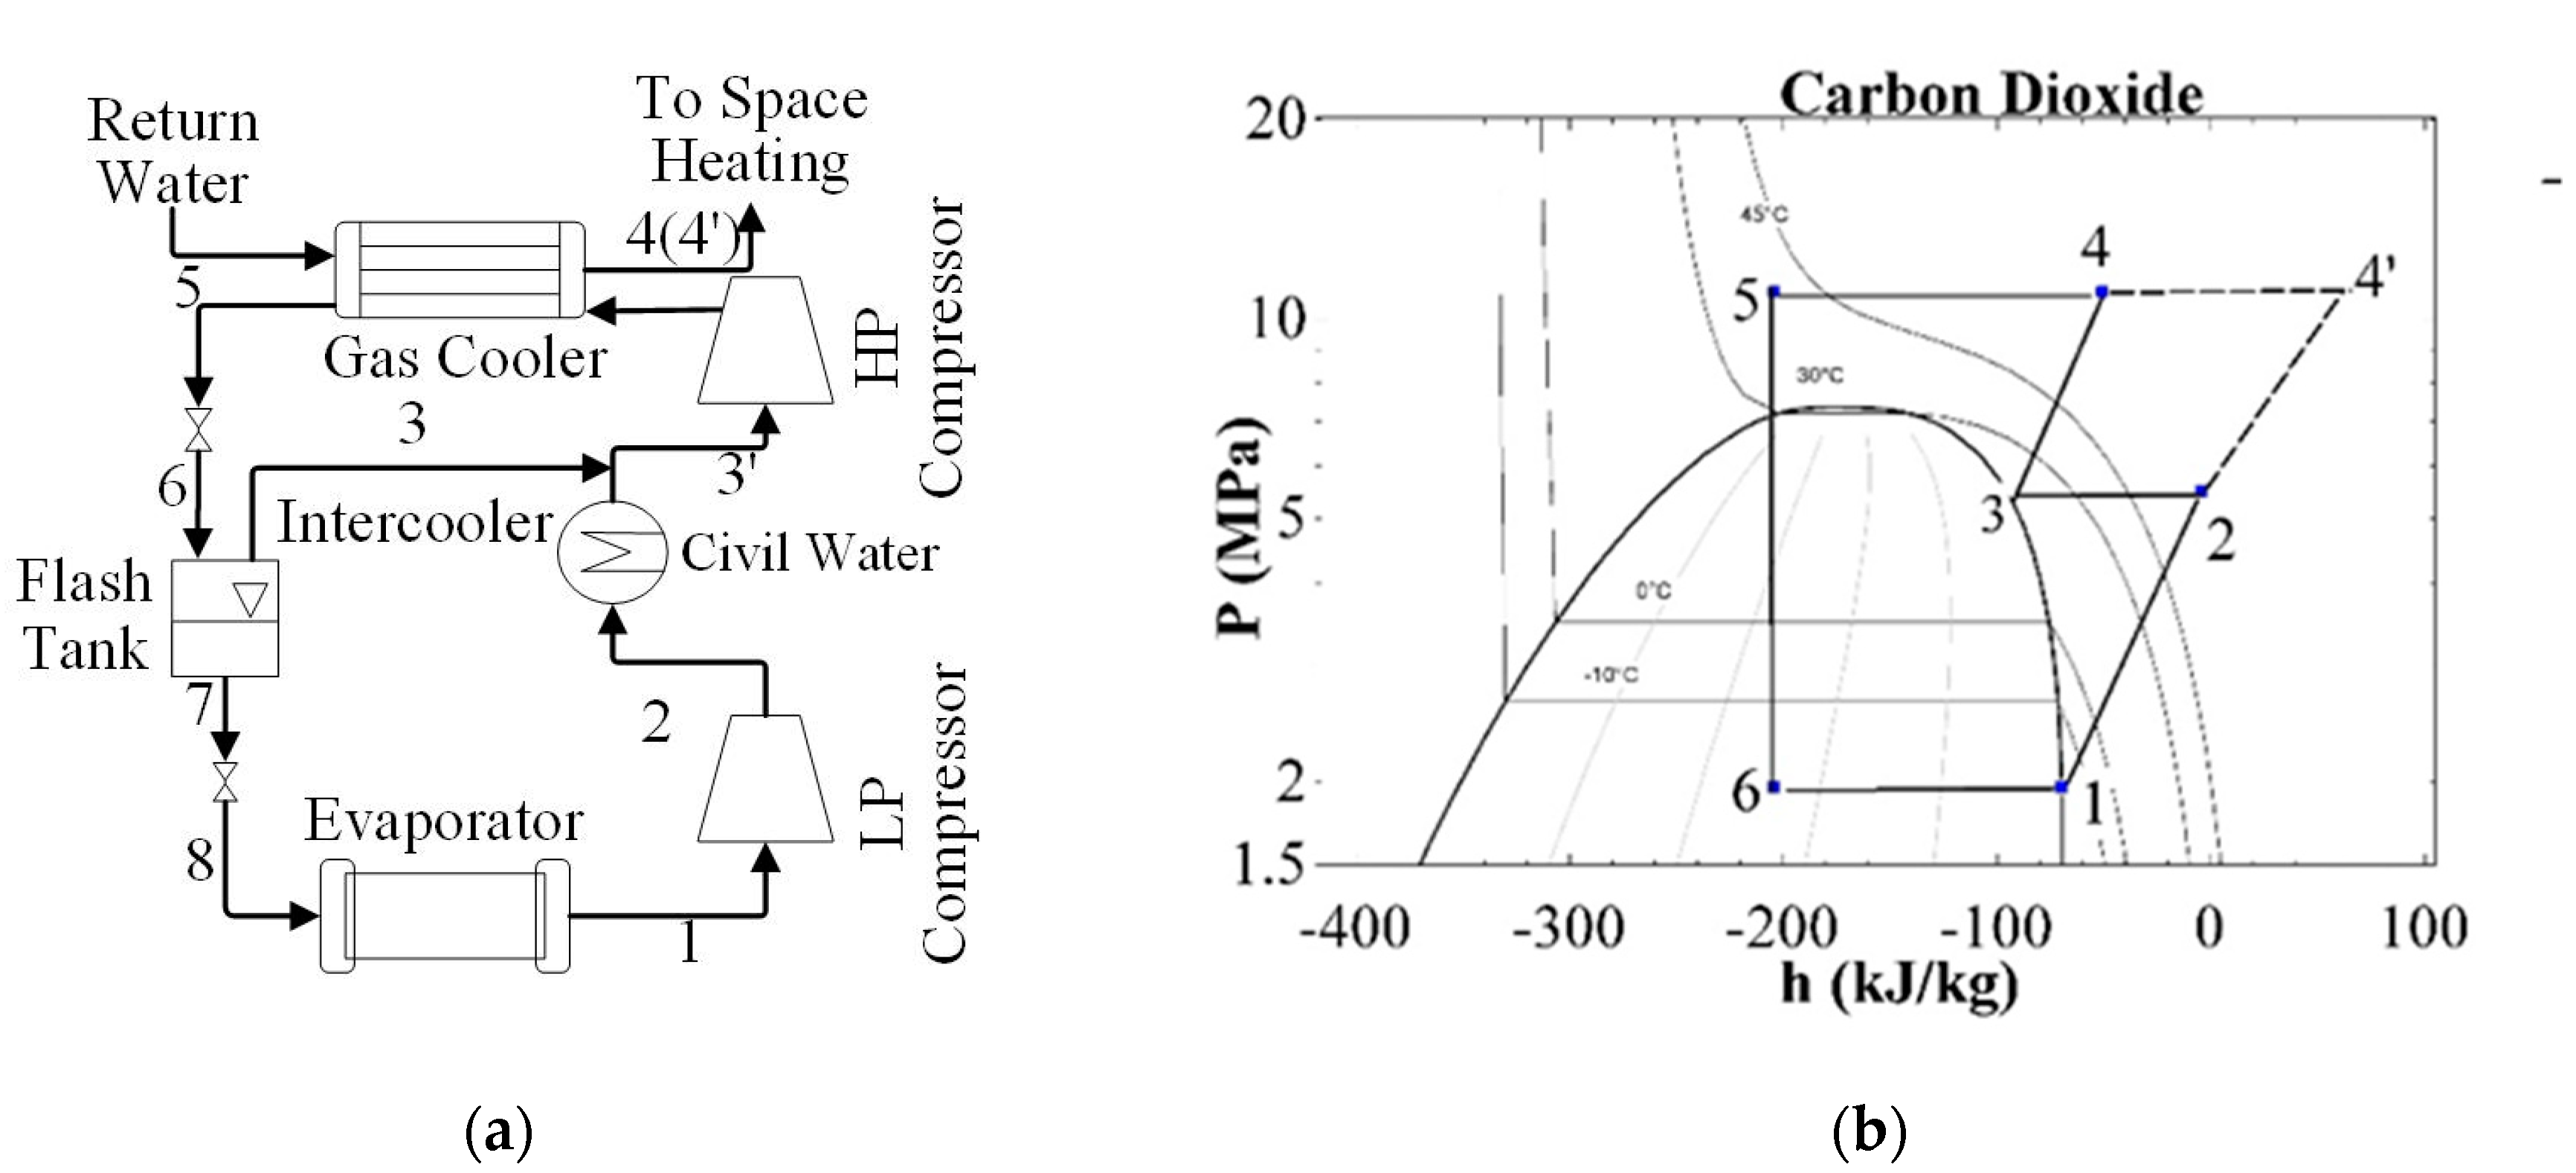
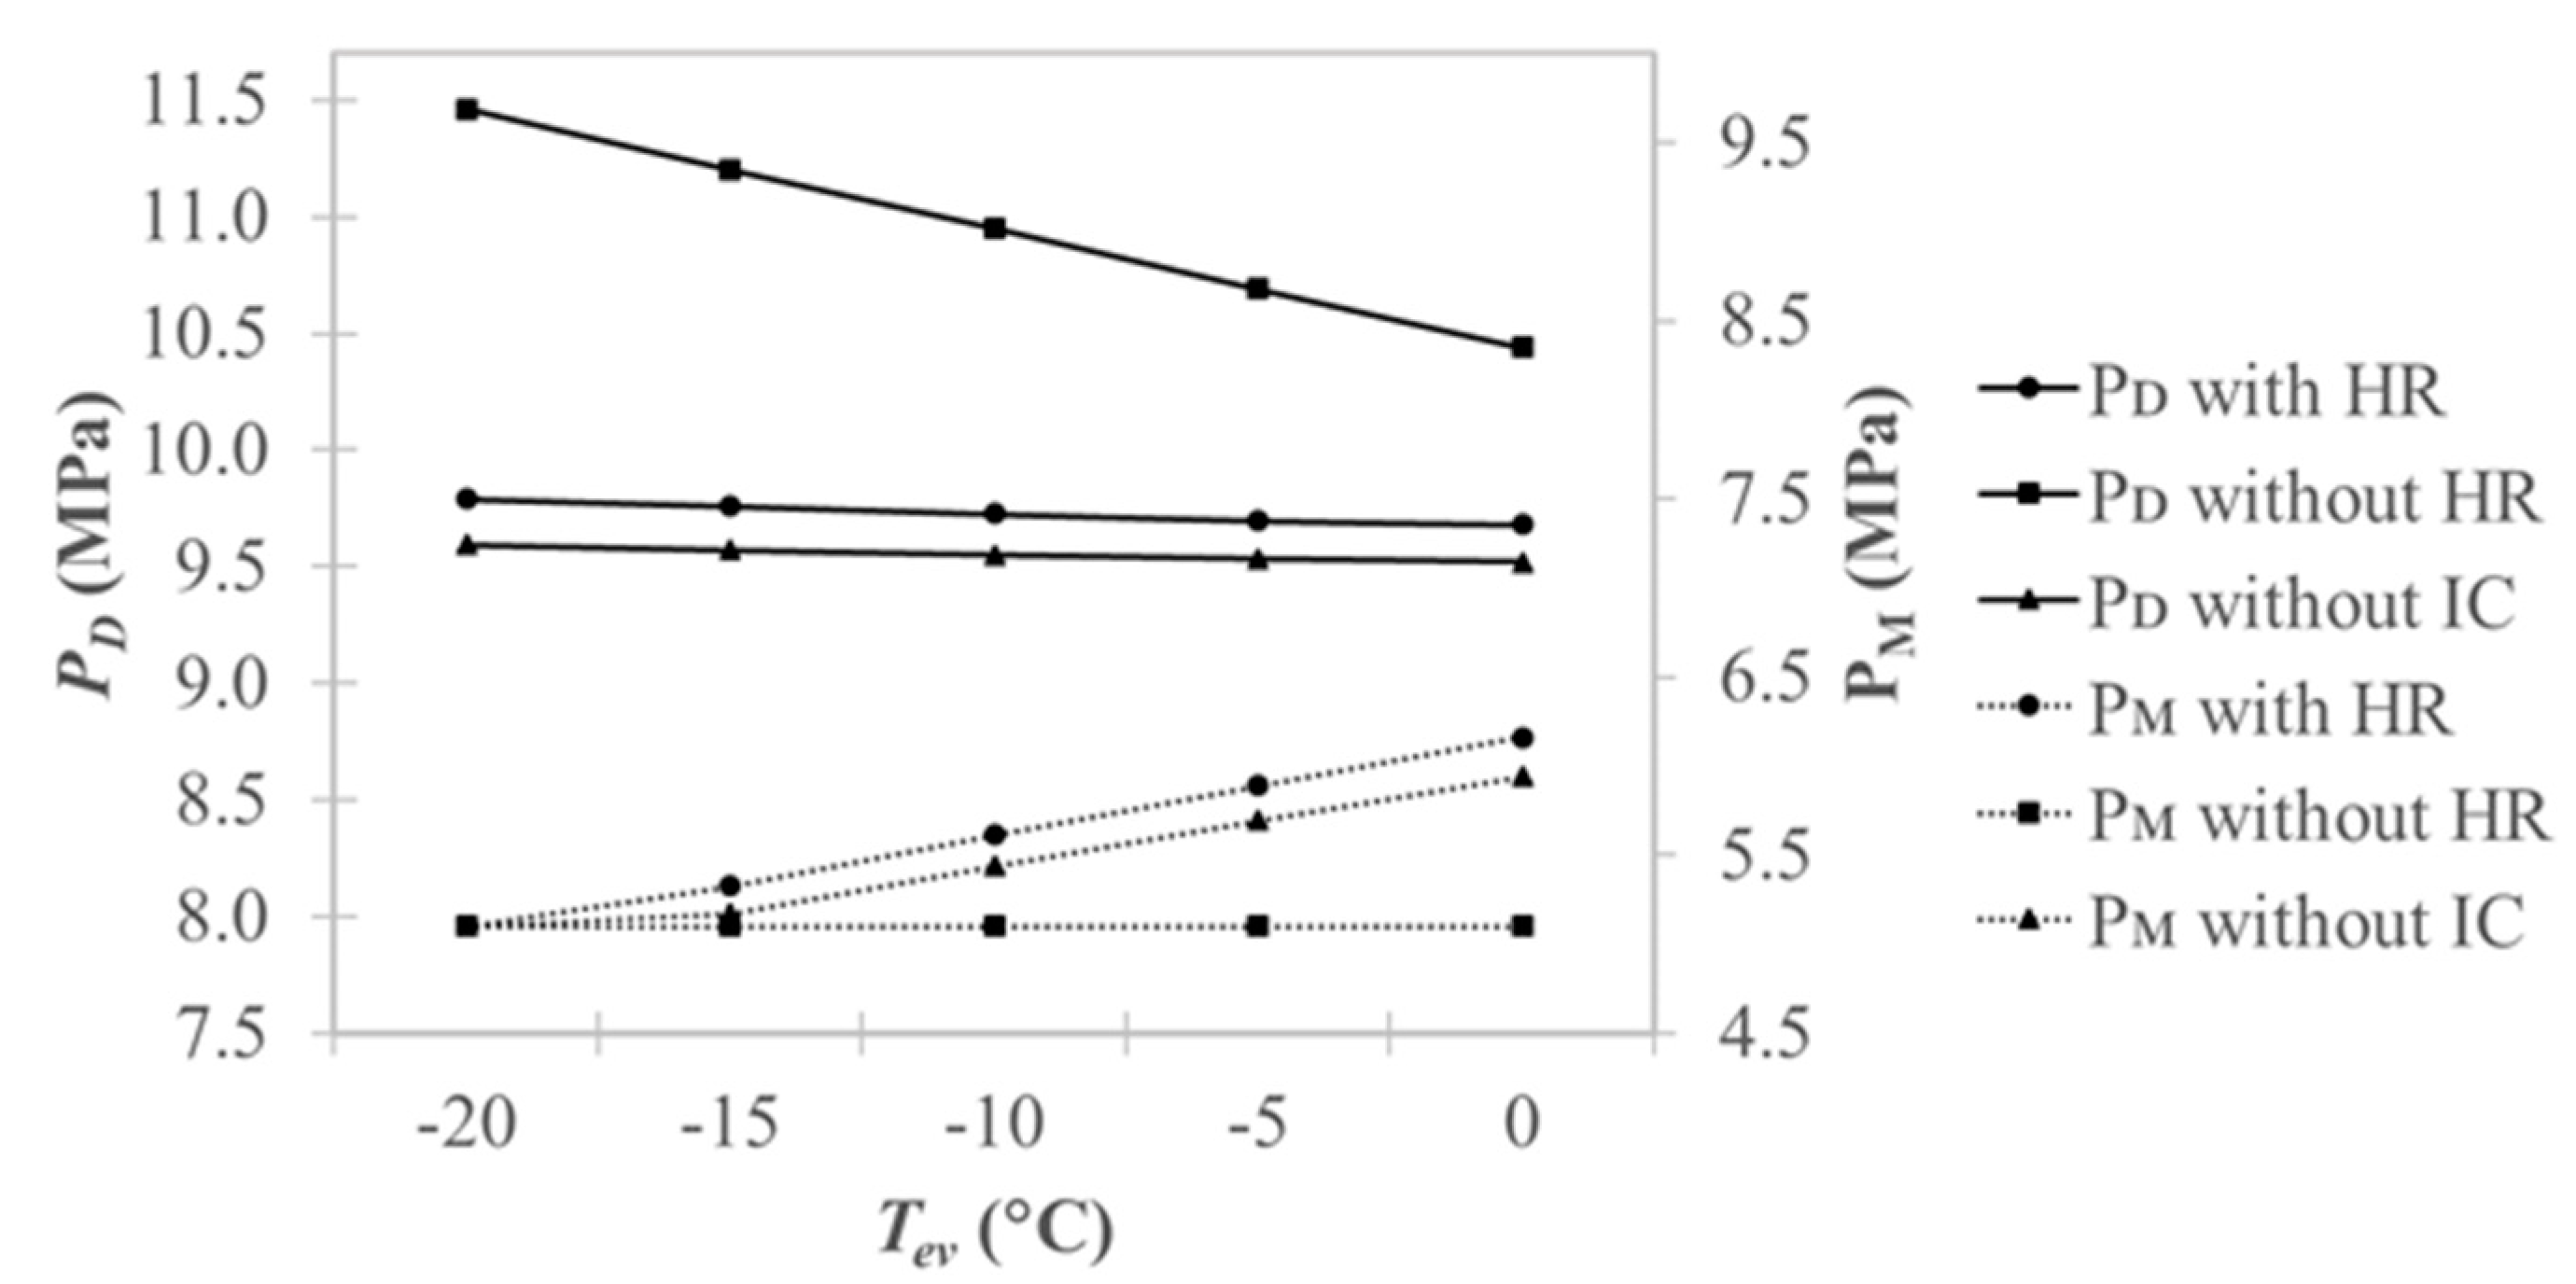
4.1.2. Flash Cycle
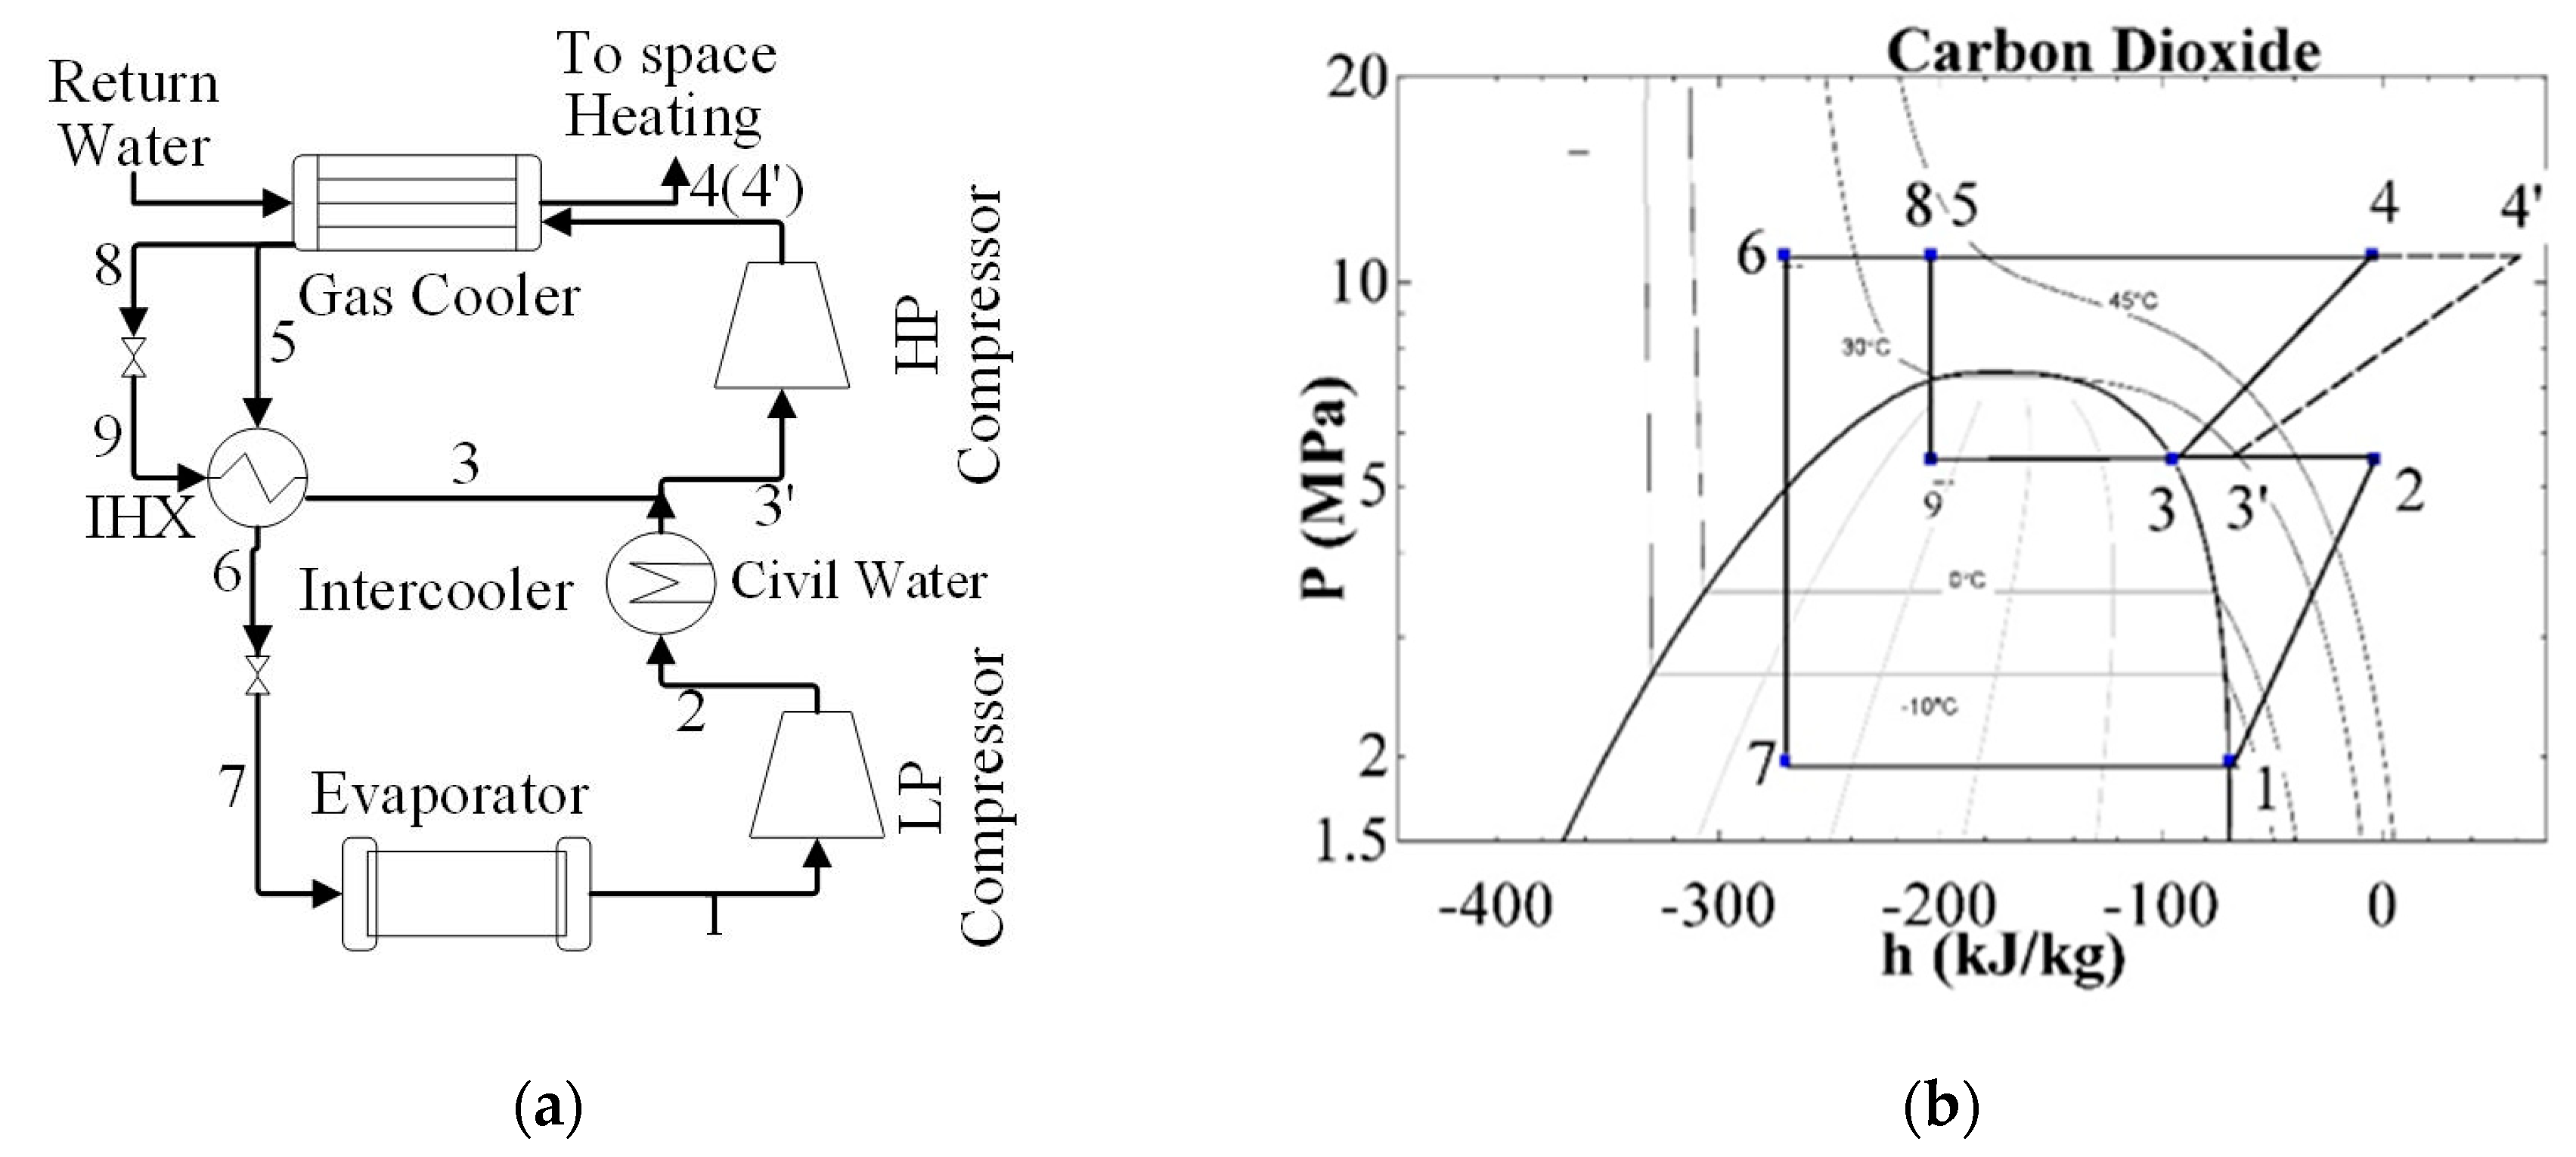
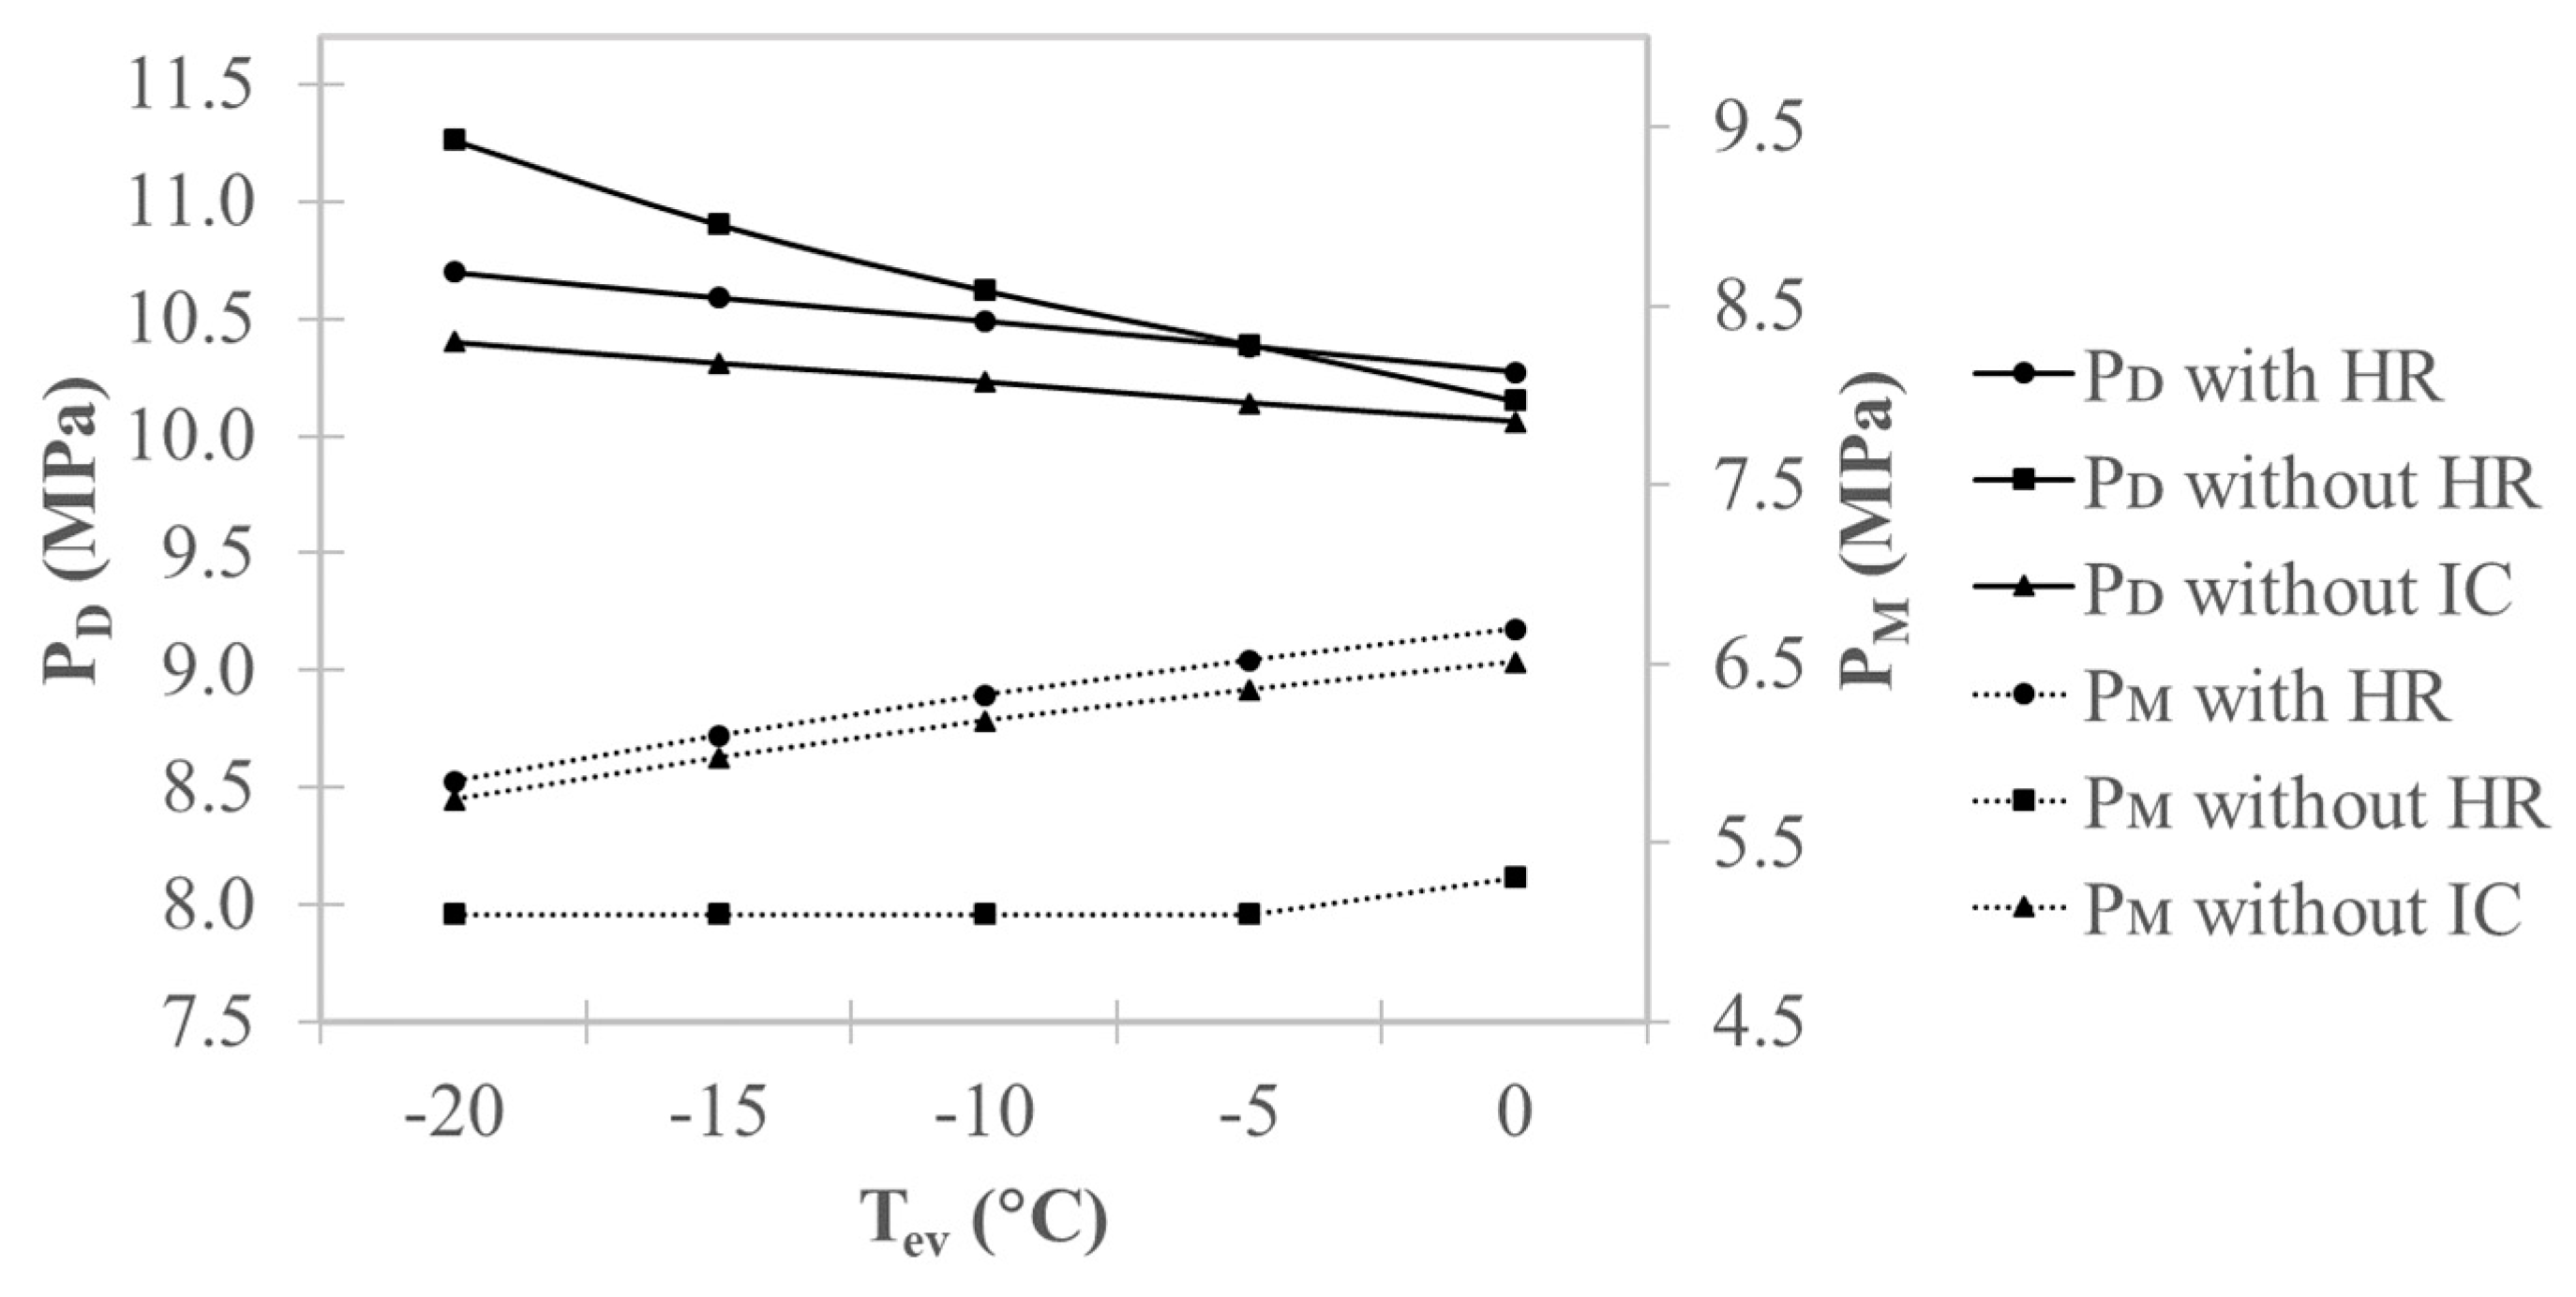
4.1.3. Split Cycle
4.2. Effects on Performance
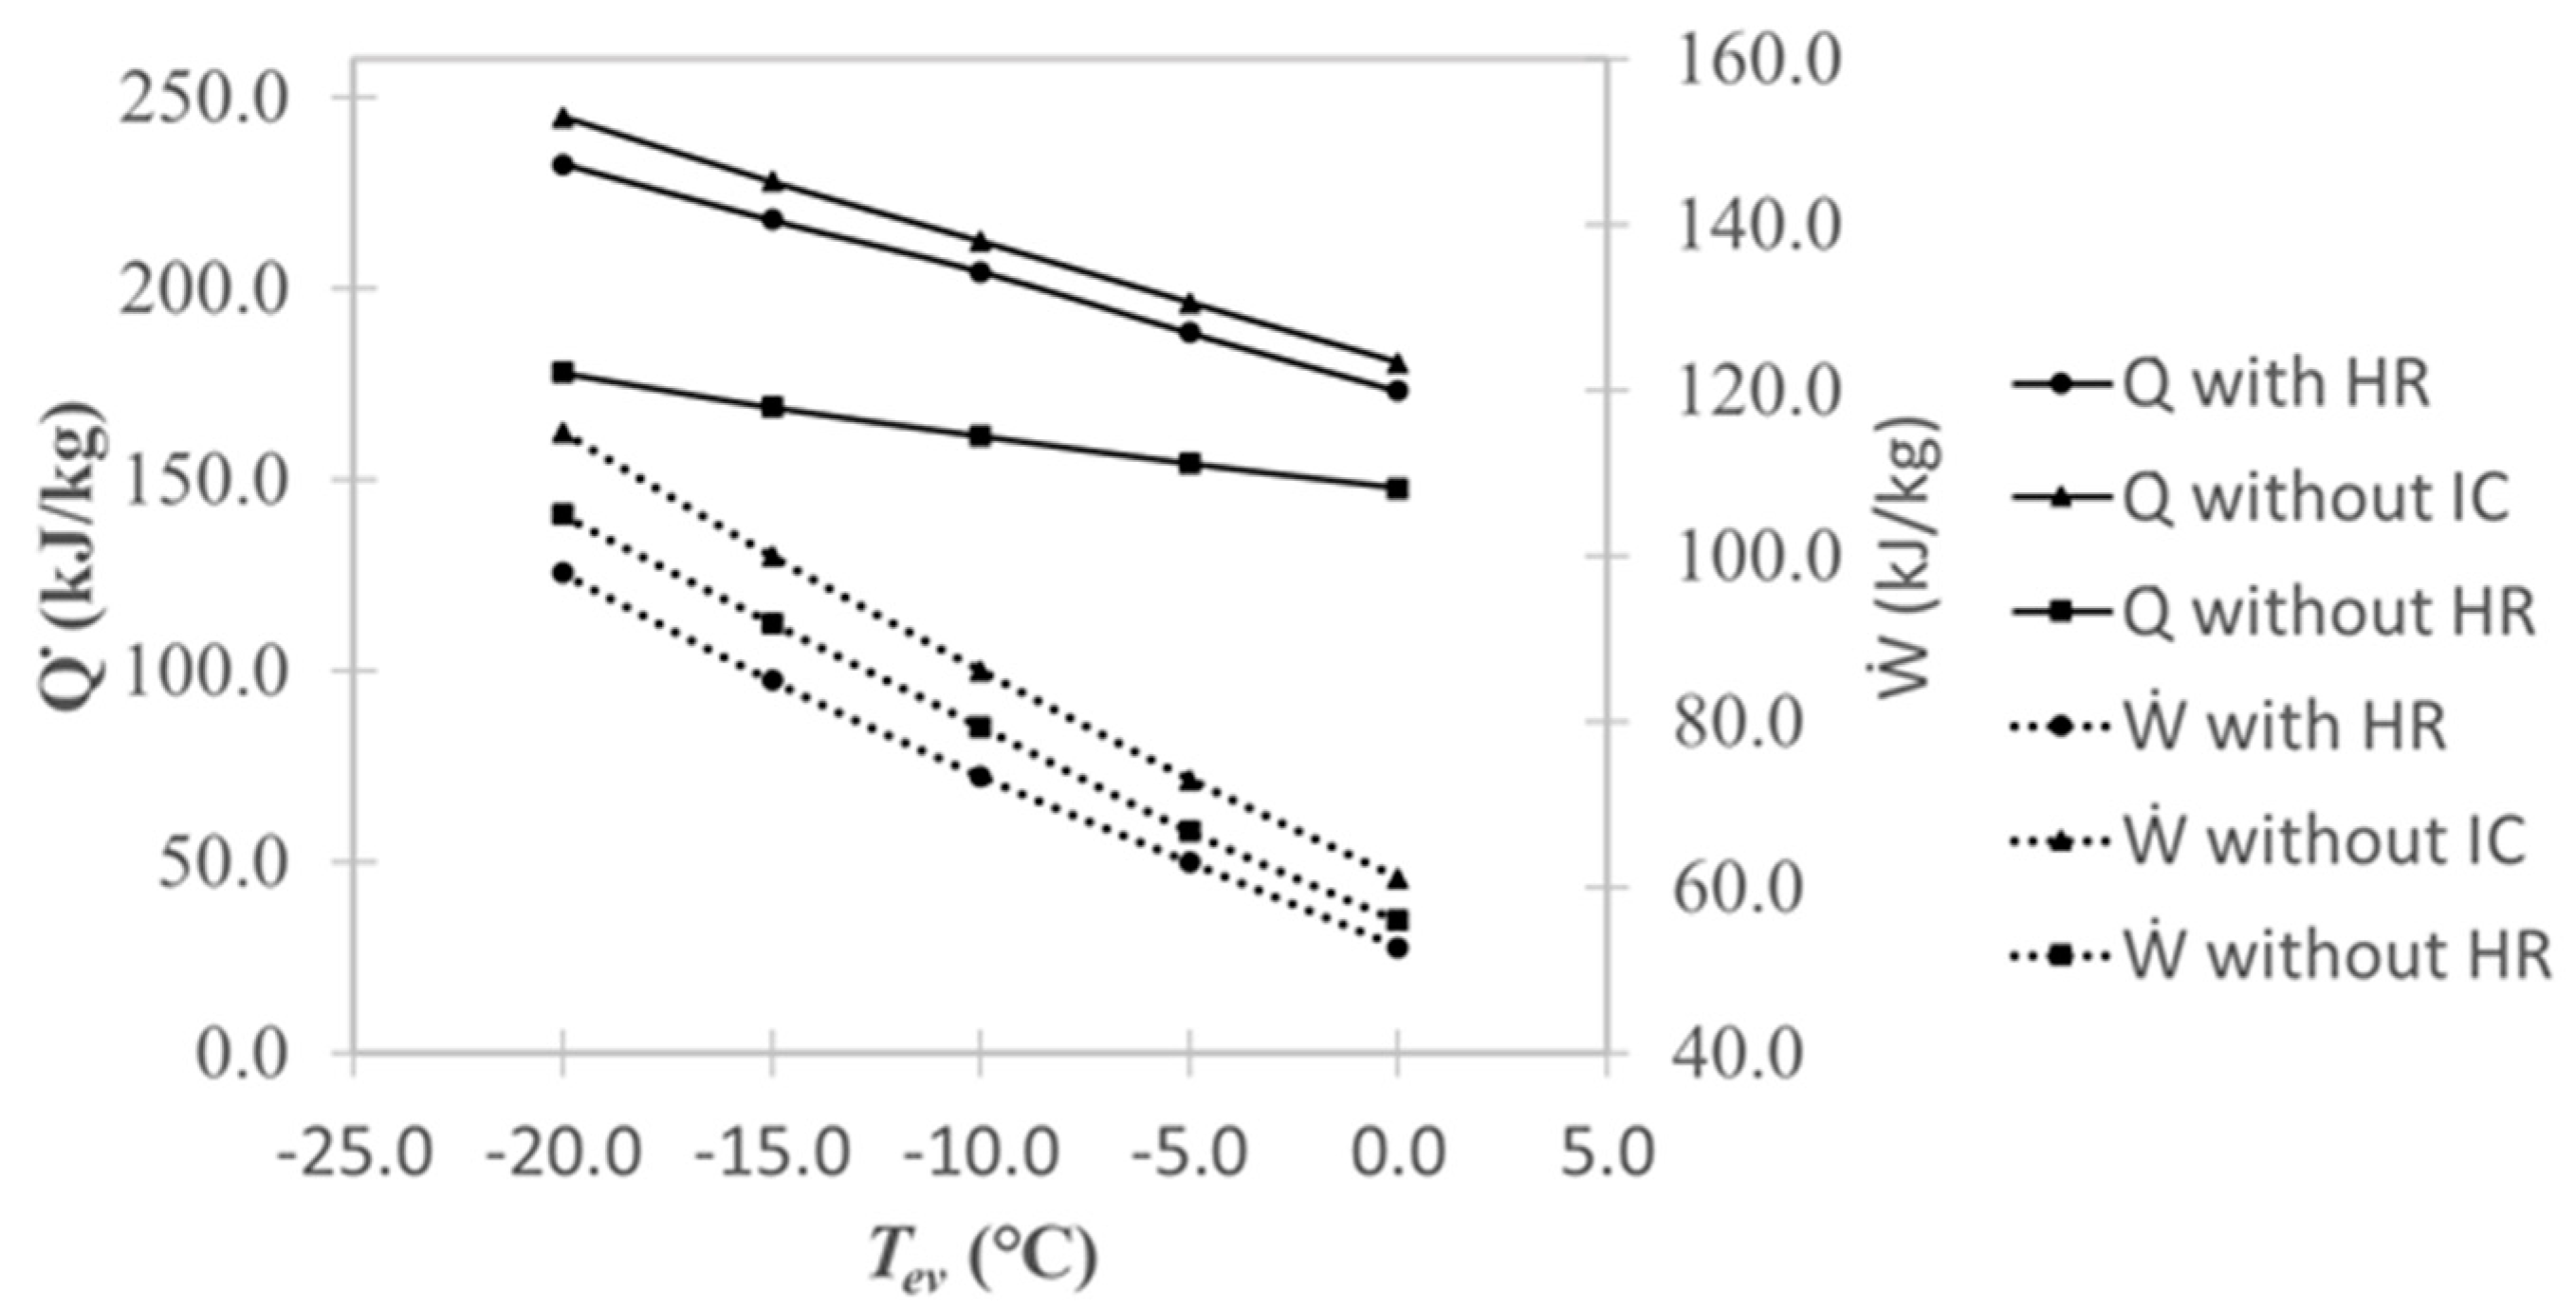
4.2.1. Intercooler Cycle
4.2.2. Flash Cycle
4.2.3. Split Cycle
5. Conclusions
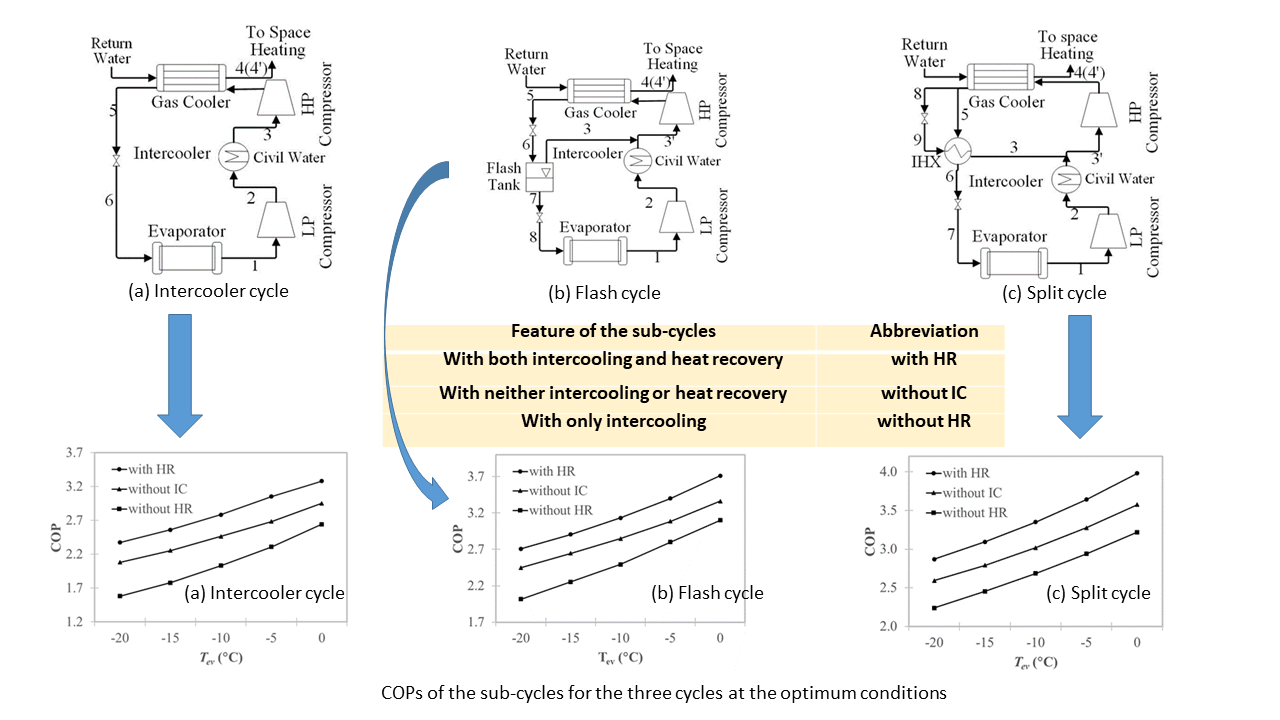
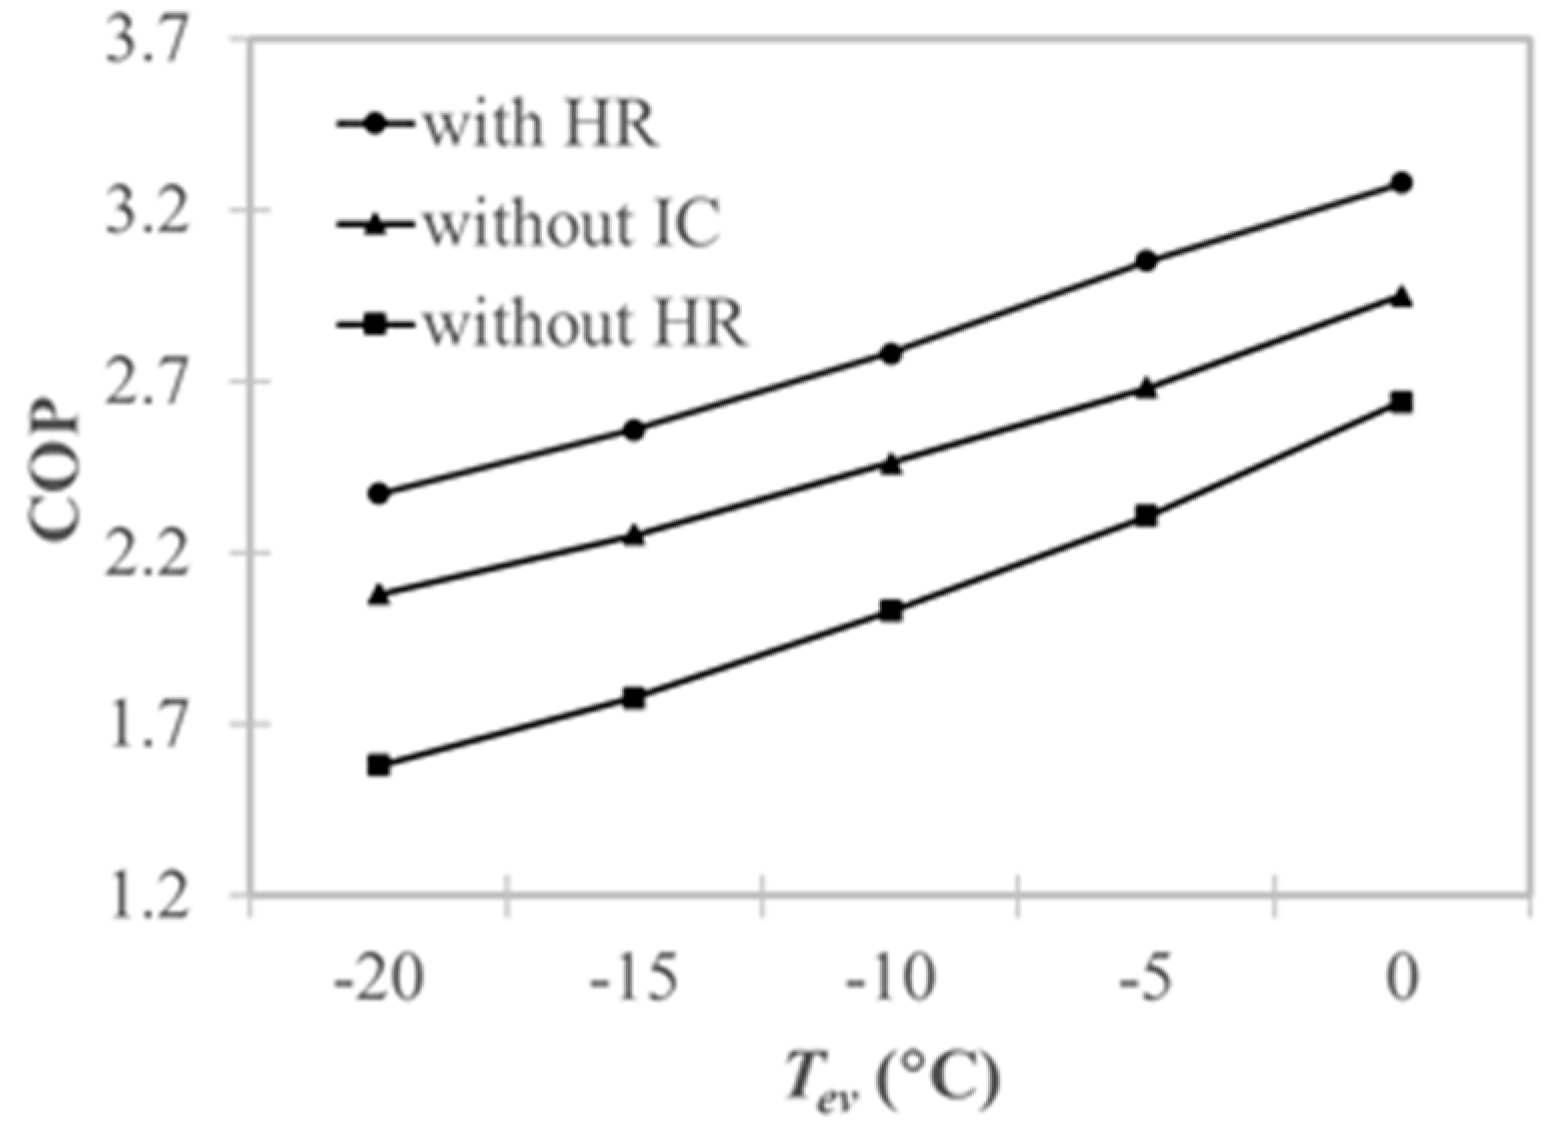
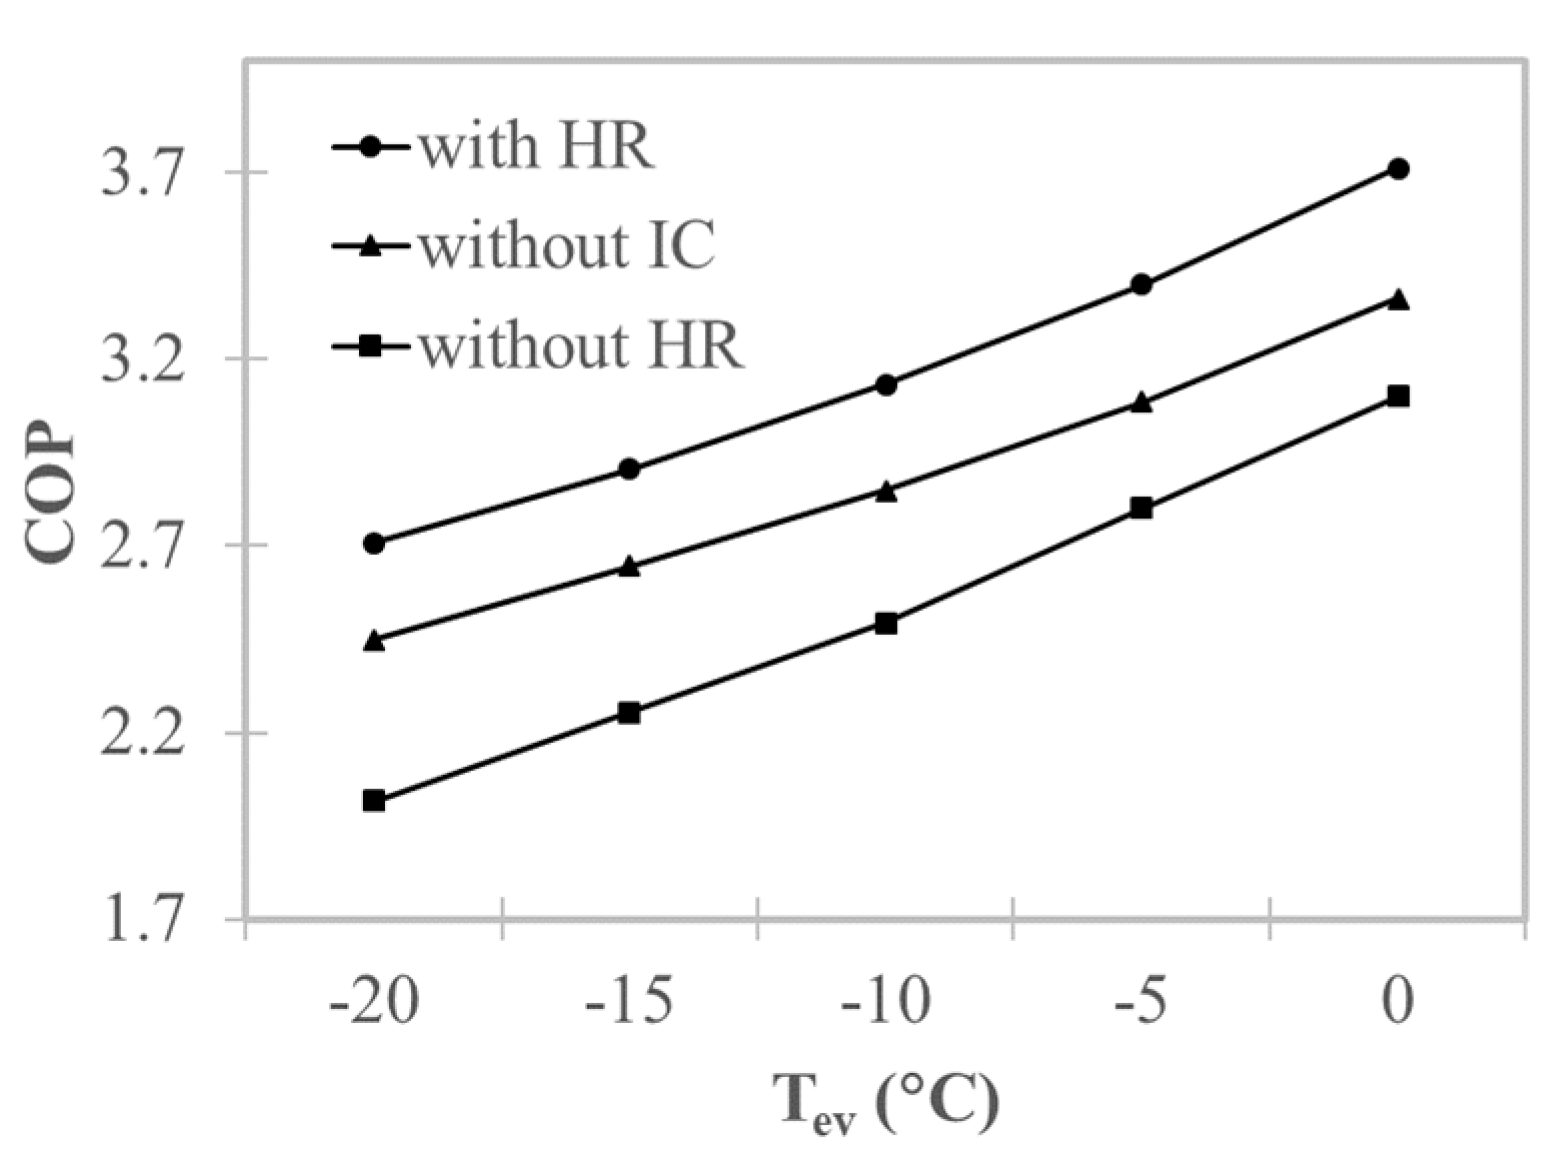
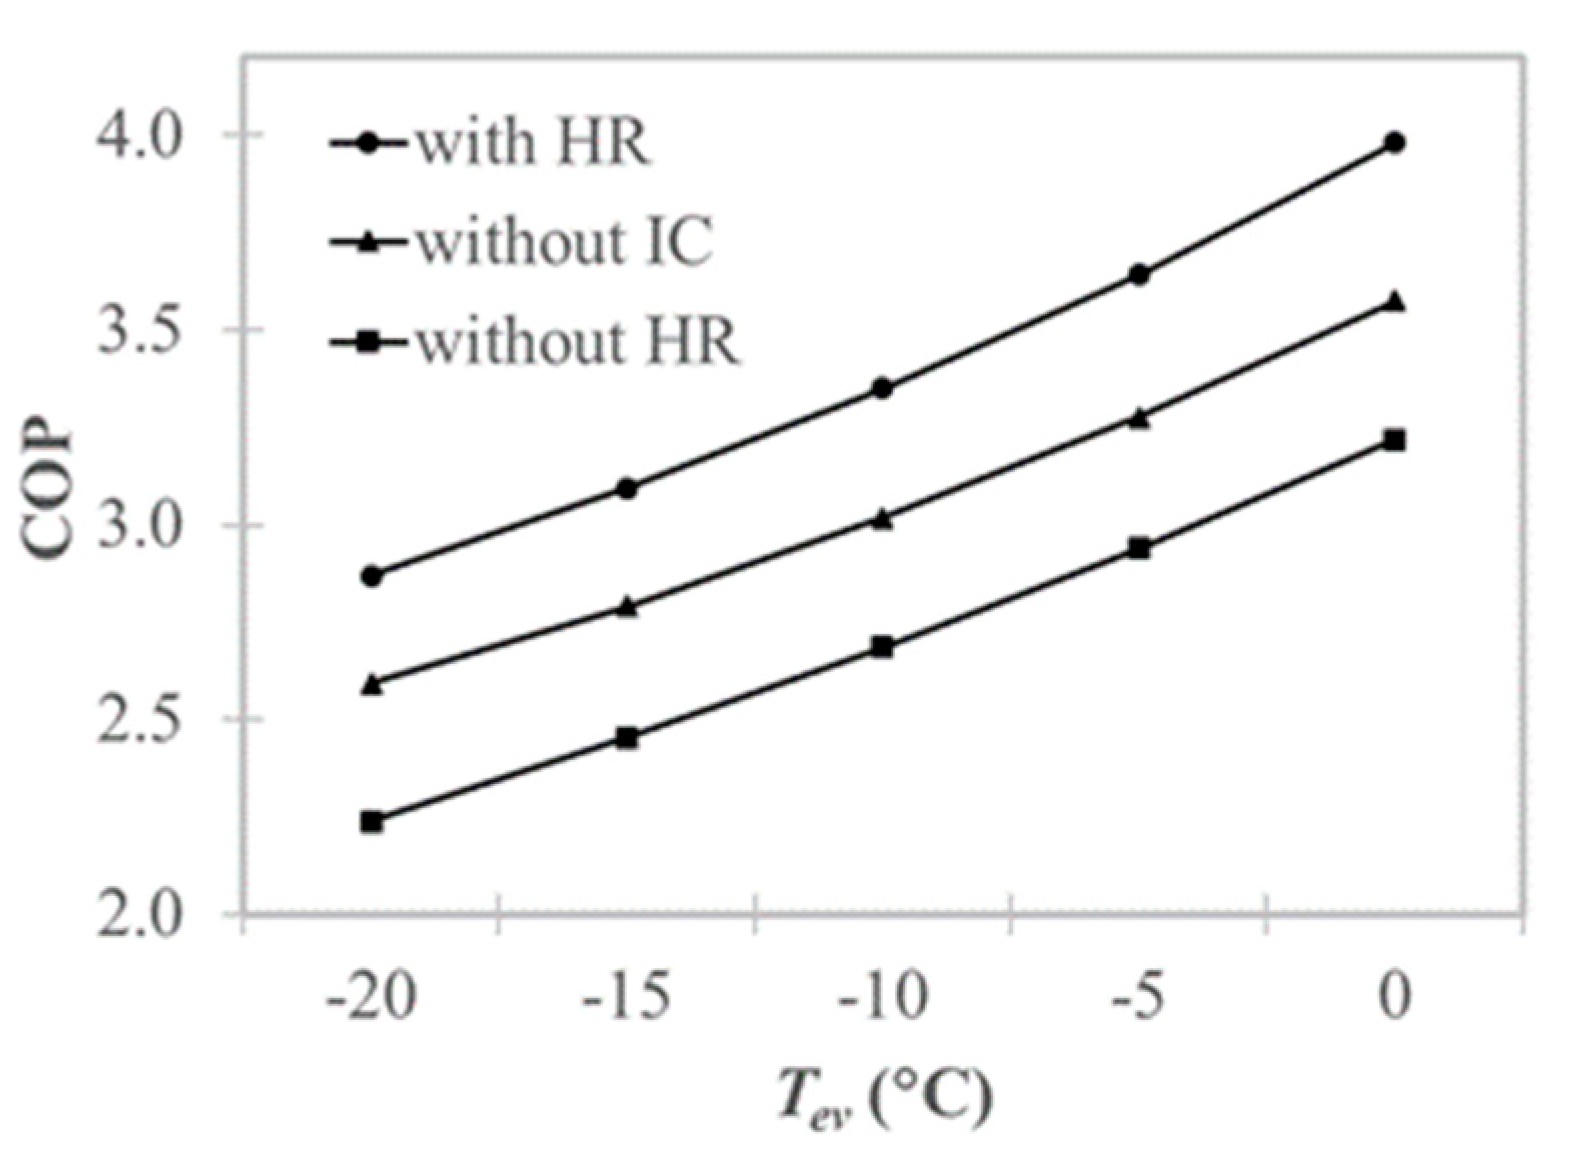
- There was a great potential for performance improvement via the recovery of heat from the intercooler. The COP of the sub-cycle with heat recovery was greater than that of the sub-cycle without intercooling by around 13.1% for the basic intercooler cycle, 10.2% for the flash cycle, and 10.9% for the split cycle; furthermore, it was greater than that of the sub-cycle without heat recovery by around 37.5% for the basic intercooler cycle, 26.0% for the flash cycle, and 25.4% for the split cycle.
- Incorporating an intercooler without heat recovery reduced the COP compared to the sub-cycle without intercooling for all cycle types. The COP of the sub-cycle without heat recovery was less than that of the sub-cycle without intercooling by around 17.4% for the basic intercooler cycle, 12.4% for the flash cycle, and 11.4% for the split cycle.
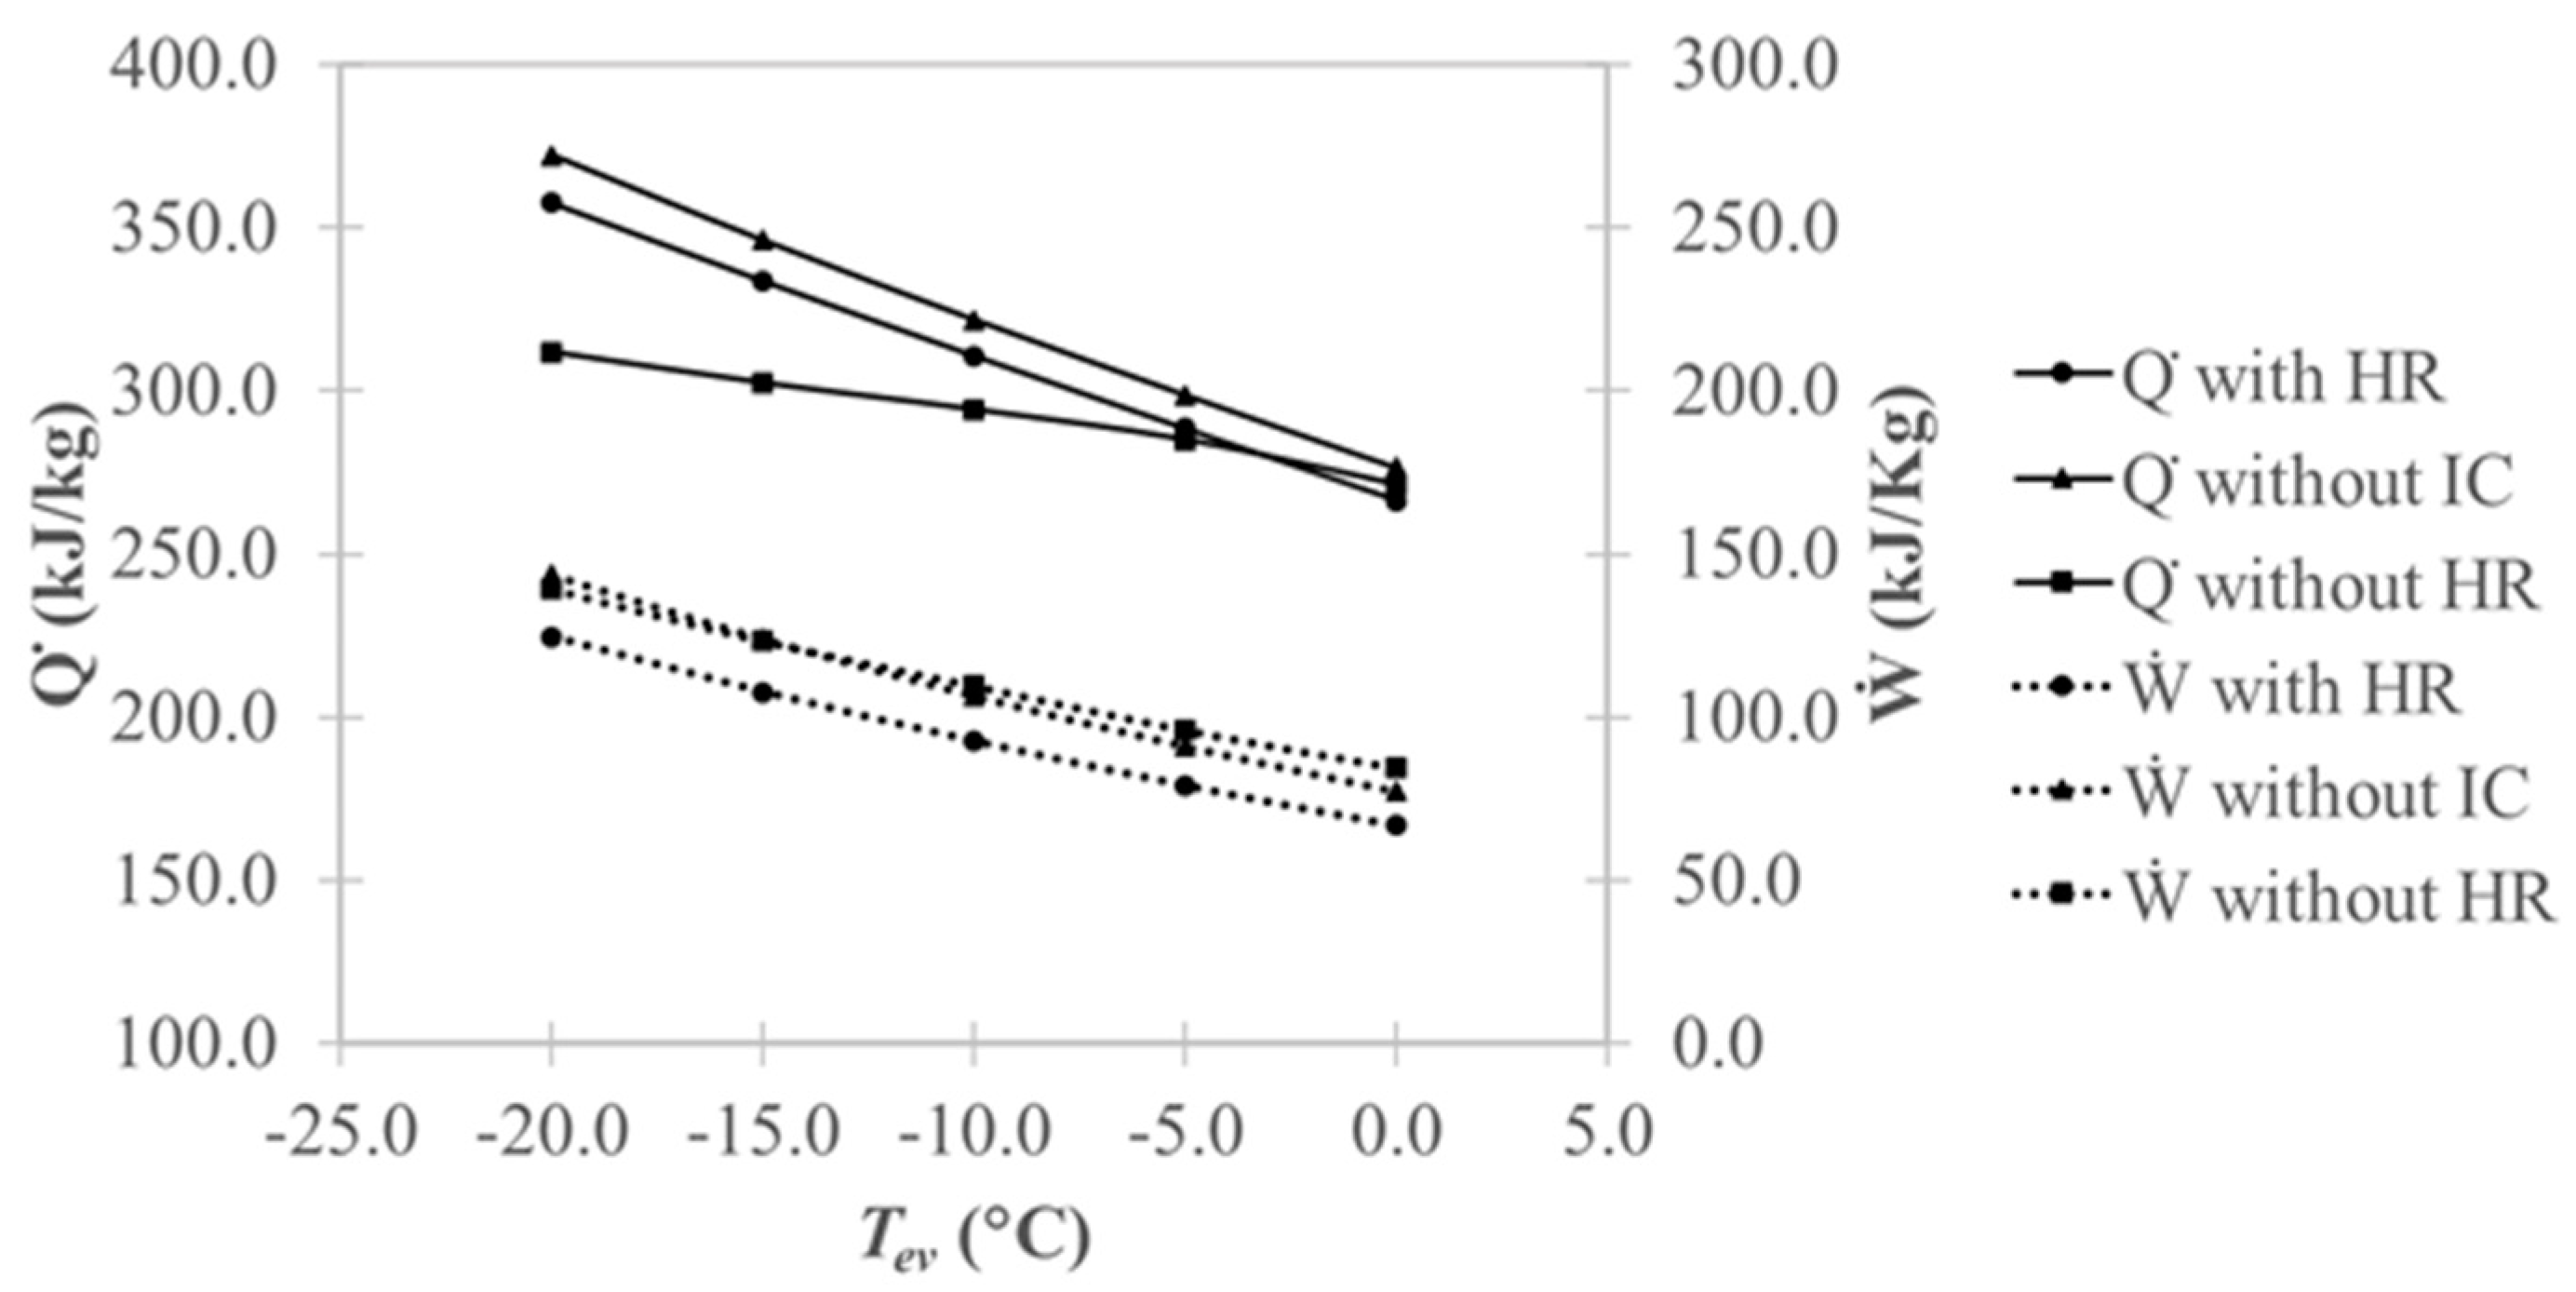
- The sub-cycle with heat recovery had a better COP than the sub-cycle without intercooling for all three cycle types examined; this was because the sub-cycle with heat recovery had lower compression work and lower heating capacity. However, the lowered compression work was a more significant factor, which led to a better performance. Similarly, the lower COP of the sub-cycle without heat recovery compared to the sub-cycle without intercooling was attributed to the fact that the decrease in heating capacity was more significant than the difference in compression work.
- It was found that the optimum discharge pressure, PD, decreased with the evaporating temperature, Tev, and the optimum intermediate pressure, PM, increased with Tev. This result was consistent with the results for cooling operations in the literature.
Author Contributions
Funding
Conflicts of Interest
Nomenclature
| Pressure at the outlet of the compressor (MPa) | |
| Pressure at the inlet of the compressor (MPa) | |
| Discharge pressure of the second-stage compressor (MPa) | |
| Inter-stage pressure (MPa) | |
| Compression work (kJ/s) | |
| Heating capacity (kJ/s) | |
| Compressor efficiency (-) | |
| Mass flowrate (kg/s) | |
| Specific enthalpy (kJ/kg) |
References
- Kim, M.H.; Pettersen, J.; Bullard, C.W. Fundamental process and system design issues in CO2 vapor compression systems. Prog. Energy Combust. Sci. 2004, 30, 119–174. [Google Scholar] [CrossRef]
- Sarkar, J. Review on Cycle Modifications of Transcritical CO2 Refrigeration and Heat Pump Systems. J. Adv. Res. Mech. Eng. 2010, 1, 22–29. [Google Scholar]
- Bush, J.; Beshr, M.; Aute, V.; Radermacher, R. Experimental evaluation of transcritical CO2 refrigeration with mechanical subcooling. Sci. Technol. Built Environ. 2017, 23, 1013–1025. [Google Scholar] [CrossRef]
- Mohammadi, S.M.H. Theoretical investigation on performance improvement of a low-temperature transcritical carbon dioxide compression refrigeration system by means of an absorption chiller after-cooler. Appl. Therm. Eng. 2018, 138, 264–279. [Google Scholar] [CrossRef]
- Dincer, I.; Kanoglu, M. Refrigeration Systems and Applications, 2nd ed.; John Wiley & Son: Hoboken, NJ, USA, 2010; p. 119. [Google Scholar]
- Groll, E.A.; Kim, J.H. Review of recent advances toward transcritical CO2 cycle technology. HVAC R Res. 2007, 13, 499–520. [Google Scholar] [CrossRef]
- Hwang, Y.H.; Celik, A.; Radermacher, R. Performance of CO2 cycles with a two stage compressor. In Proceedings of the International Refrigeration and Air Conditioning Conference, West Lafayette, IN, USA, 12–15 July 2004. [Google Scholar]
- Cavallini, A.; Cecchinato, L.; Corradi, M.; Fornasieri, E.; Zilio, C. Two-stage transcritical carbon dioxide cycle optimisation: A theoretical and experimental analysis. Int. J. Refrig. 2005, 28, 1274–1283. [Google Scholar] [CrossRef]
- Manole, D. On the optimum inter-stage pressure parameters for CO2 trans-critical systems. In Proceedings of the 7th Gustav Lorentzen Conference on Natural Working Fluids, Trondheim, Norway, 29–31 May 2006. [Google Scholar]
- Agrawal, N.; Bhattacharyya, S.; Sarkar, J. Optimization of two-stage transcritical carbon dioxide heat pump cycles. Int. J. Therm. Sci. 2007, 46, 180–187. [Google Scholar] [CrossRef]
- Ozgur, A.E. The performance analysis of a two-stage transcritical CO2 cooling cycle with various gas cooler pressures. Int. J. Energy Res. 2008, 32, 1309–1315. [Google Scholar] [CrossRef]
- Ozgur, A.E.; Bayrakci, H.C. Second law analysis of two-stage compression transcritical CO2 heat pump cycle. Int. J. Energy Res. 2008, 32, 1202–1209. [Google Scholar] [CrossRef]
- Cecchinato, L.; Chiarello, M.; Corradi, M.; Fornasieri, E.; Minetto, S.; Stringari, P.; Zilio, C. Thermodynamic analysis of different two-stage transcritical carbon dioxide cycles. Int. J. Refrig. 2009, 32, 1058–1067. [Google Scholar] [CrossRef]
- Srinivasan, K. Identification of optimum inter-stage pressure for two-stage transcritical carbon dioxide refrigeration cycles. J. Supercrit. Fluids 2011, 58, 26–30. [Google Scholar] [CrossRef]
- Almeida, I.M.G.; Barbosa, C.R.F.; Int Inst, R. Influence factors in performance of the two-stage compression transcritical R744 cycle. In Iir International Congress of Refrigeration, 23rd ed.; Int Inst Refrigeration: Paris, France, 2011; Volume 23, p. 782. [Google Scholar]
- Ozgur, A.E.; Tosun, C. Thermodynamic analysis of two-stage transcritical CO2 cycle using flash gas by-pass. Int. J. Exergy 2015, 16, 127–138. [Google Scholar] [CrossRef]
- Zhang, Z.Y.; Wang, H.L.; Tian, L.L.; Huang, C.S. Thermodynamic analysis of double-compression flash intercooling transcritical CO2 refrigeration cycle. J. Supercrit. Fluids 2016, 109, 100–108. [Google Scholar] [CrossRef]
- Manjili, F.E.; Yavari, M.A. Performance of a new two-stage multi-intercooling transcritical CO2 ejector refrigeration cycle. Appl. Therm. Eng. 2012, 40, 202–209. [Google Scholar] [CrossRef]
- Sun, Z.L.; Li, M.X.; Han, G.M.; Ma, Y.T. Performance study of a transcritical carbon dioxide cycle with an expressor. Energy 2013, 60, 77–86. [Google Scholar]
- Bayrakci, H.C.; Ozgur, A.E.; Alan, A. Thermodynamic analysis of expander usage in two stage transctitical R744 cooling systems. ISI Bilim. Tek. Derg. 2014, 34, 91–97. [Google Scholar]
- Xing, M.B.; Yu, J.L.; Liu, X.Q. Thermodynamic analysis on a two-stage transcritical CO2 heat pump cycle with double ejectors. Energy Conv. Manag. 2014, 88, 677–683. [Google Scholar] [CrossRef]
- Nemati, A.; Mohseni, R.; Yari, M. A comprehensive comparison between CO2 and Ethane as a refrigerant in a two-stage ejector-expansion transcritical refrigeration cycle integrated with an organic Rankine cycle (ORC). J. Supercrit. Fluids 2018, 133, 494–502. [Google Scholar] [CrossRef]
- Zhang, B.; Chen, L.; Liu, L.; Zhang, X.Y.; Wang, M.; Ji, C.F.; Song, K.I. Parameter Sensitivity Study for Typical Expander-Based Transcritical CO2 Refrigeration Cycles. Energies 2018, 11, 1279. [Google Scholar] [CrossRef] [Green Version]
- Wang, H.L.; Ma, Y.T.; Tian, J.R.; Li, M.X. Theoretical analysis and experimental research on transcritical CO2 two stage compression cycle with two gas coolers (TSCC plus TG) and the cycle with intercooler (TSCC plus IC). Energy Conv. Manag. 2011, 52, 2819–2828. [Google Scholar] [CrossRef]
- Pitarch, M.; Navarro-Peris, E.; Gonzalvez, J.; Corberan, J.M. Analysis and optimisation of different two-stage transcritical carbon dioxide cycles for heating applications. Int. J. Refrig. 2016, 70, 235–242. [Google Scholar] [CrossRef]
- EES Manual. Available online: Fchartsoftware.com/assets/downloads/ees_manual.pdf (accessed on 1 December 2019).
- Ortiz, T.M.; Li, D.; Groll, E.A. Evaluation of the Performance Potential of CO2 as a Refrigerant in Air-to-Air Air Conditioners and Heat Pumps: System Modelling and Analysis. In ARTI Final Report; No. 21CR/610-10030; Research Centre, Purdue University: West Lafayette, IN, USA, 2003. [Google Scholar]
- Llopis, R.; Nebot-Andrés, L.; Cabello, R.; Sánchez, D.; Catalán-Gil, J. Experimental evaluation of a CO2 transcritical refrigeration plant with dedicated mechanical subcooling. Int. J. Refrig. 2016, 69, 361–368. [Google Scholar] [CrossRef]


| Name of the Sub-Cycle | Feature | Abbreviation |
|---|---|---|
| Sub-cycle with heat recovery | With both intercooling and heat recovery | with HR |
| Sub-cycle without intercooling | With neither intercooling or heat recovery | without IC |
| Sub-cycle without heat recovery | With only intercooling | without HR |
| Name of the Sub-Cycles | PD | PM | ||
|---|---|---|---|---|
| Lower bound | Upper bound | Lower bound | Upper bound | |
| Sub-cycle with heat recovery | 7.4 MPa | 14 MPa | 5.1 MPa | 6.8 MPa |
| Sub-cycle without intercooling | 7.4 MPa | 14 MPa | 2.5 MPa | 6.8 MPa |
| Sub-cycle without heat recovery | 7.4 MPa | 14 MPa | 5.1 MPa | 6.8 MPa |
© 2019 by the authors. Licensee MDPI, Basel, Switzerland. This article is an open access article distributed under the terms and conditions of the Creative Commons Attribution (CC BY) license (http://creativecommons.org/licenses/by/4.0/).
Share and Cite
Ma, J.; Mhanna, A.; Juan, N.; Brands, M.; Fung, A.S. Effects of Intercooling and Inter-Stage Heat Recovery on the Performance of Two-Stage Transcritical CO2 Cycles for Residential Heating Applications. Energies 2019, 12, 4763. https://doi.org/10.3390/en12244763
Ma J, Mhanna A, Juan N, Brands M, Fung AS. Effects of Intercooling and Inter-Stage Heat Recovery on the Performance of Two-Stage Transcritical CO2 Cycles for Residential Heating Applications. Energies. 2019; 12(24):4763. https://doi.org/10.3390/en12244763
Chicago/Turabian StyleMa, Juanli, Ahmad Mhanna, Neil Juan, Monica Brands, and Alan S. Fung. 2019. "Effects of Intercooling and Inter-Stage Heat Recovery on the Performance of Two-Stage Transcritical CO2 Cycles for Residential Heating Applications" Energies 12, no. 24: 4763. https://doi.org/10.3390/en12244763