3.1. Effect of Reactor Pressure
Effect of reactor pressure on carbon conversion for the −150 + 106 µm particle size fraction at 1300 °C is shown in
Figure 3A. The average conversion varied between ≈43 ± 8.2 wt.% at 3.4 bar and ≈59 ± 8.2 wt.% for 21.7 bar pressure. Lower conversion for chars generated at 3.4 and 6.2 bar pressures can be attributed to 20% lower particle residence time (≈2.0 s) as compared to chars generated at higher pressures (≈2.5 s for chars generated at 11.3, 15.5, and 21.7 bar). Even though there is a difference in total conversion across the pressure range examined, the uncertainty of 8.2% around average conversion suggests that the pressure has no significant effect on conversion. It appears that at higher temperature, and in the presence of a reaction gas, the impact of pressure on conversion is limited. Zeng and Fletcher also showed that pressure has limited impact on conversion over a range of 2.5–15 bar [
13]. It is also noteworthy that chars had about ≈20% of volatiles on dry ash free basis (see
Table 3). While it is known that increase in pressure increases fluidity during initial stages of pyrolysis for a coal like Pittsburgh no.8 [
26], higher residual volatile matter appears to be unusual for sample with ≈50% conversion. Duplicate runs with the same sample yielded a similar amount of volatiles confirming that this is not due to any experimental error. The unusual observation of higher residual volatiles could be due to higher temperature (≥1100 °C), higher pressure (>1 bar), and lower residence time (2.0–2.5 s) in the reactor at which these chars were generated compared to minutes at atmospheric pressure and 950 °C used in American Society for Testing and Materials (ASTM) volatile matter determination. Higher pressure prevents the release of volatiles, and higher temperature increases the volatile generation both could have contributed to higher residual volatiles for the char generated from the HPHTFR.
If the hypothesis of pressure and temperature playing a dominant role on residual volatiles is true, chars from commercial gasifier with similar or longer residence time should also show significant residual volatile matter (on dry ash free basis). This hypothesis was supported by a char/slag sample collected from a particulate filter from a commercial gasifier that showed >50% volatiles (on dry ash free basis) with respect to the feed [
27]. Other commercial gasifier char samples analyzed in our laboratory also revealed a significant presence of volatiles (>40% of volatiles with respect to the feed) despite more than 5 s particle residence time. All these results from commercial gasifiers prove that residual volatile matter of ≈50% compared to feed in char after 2 s residence time is not an abnormal observation.
Char morphology is an important parameter for modeling char-CO
2 reactivity in an entrained-flow gasifier [
4]. Highly porous group-I chars tend to show higher reactivity under a pore diffusion controlled regime due to a higher effectiveness factor compared to less porous group-III chars. From this perspective, effect of pressure on char morphology is important in kinetic model development.
Figure 3B shows the morphology through groups of the chars generated at different pressures. The pressure has no statistically significant effect on group-I char formation as pressure was increased from 3.4 bar (48 ± 6.8 vol.%) to 11.3 bar (55 ± 6.8 vol.%). Correspondingly, group-II char formation decreased from ≈18 ± 3.5 vol.% at 3.4 bar to ≈5 ± 3.5 vol.% at 11.3 bar. The significant drop in group-II char concentration happened between 3.4 and 6.2 bar where the concentration of group-II char dropped to ≈3 ± 3.5 vol.%. Transformation of group-II char to group-I char can be attributed to increased fluidity with pressure. Increased fluidity of char at higher reactor pressure can be attributed to suppression of escape of tar precursors which otherwise would have evaporated at lower pressures [
26]. The volatiles (including tars) trapped within the particle expand to increase the particle diameter thereby thinning the wall. This led to generation of hollow group-I char. Interestingly, a further increase in pressure to 11.3 bar did not change the concentration of group-I char significantly. The caking coals like that of Pittsburgh No.8 generate a lot of fluidity [
26,
28] and quickly transform to balloon type cenospheres (i.e., group-I char) even at lower pressures (<5 bar), and further increase in pressure does not significantly alter the group-I char concentration.
Although group-I char concentration did not change much at elevated pressures, thermal swelling ratio increased from 1.39 to 1.76 even as pressure was increased from 3.4 to 15.5 bar. As the pressure was further increased to 21.7 bar, the thermal swelling ratio decreased to 1.69.
Figure 3C shows the effect of pressure on thermal swelling ratio. Earlier studies have indicated that the maximum swelling (both at low heating rate and high heating rate) for caking coals occurs in the 8–20 bar pressure range (external pressure) and then decreases with further increase in pressure [
13,
28,
29,
30,
31]. Increase in thermal swelling ratio with pressure and the decline after that can be explained based on the mechanism proposed by Yu et al. [
32]: During the devolatilization process, a considerable amount of volatiles are transported in as vapors and gases in the form of bubbles. Small bubbles are created during the initial stages of pyrolysis. At lower pressures, the bubbles merge to form larger bubbles, move to the exterior surface, and burst open. This occurs due to limited mass transfer resistance. As the external reactor pressure increases, the diffusion of volatiles out of the particle becomes slower due to lower pressure gradient. The volatiles trapped within the particles expand to increase the diameter thereby thinning the walls until a balance of forces is established with the exterior reactor pressure. The expansion with increase in pressure results in the generation of highly porous chars with increased thermal swelling ratio. Above a certain pressure, the external force becomes more than the internal pressure resulting in a reduction in swelling. Additionally, the volatile release through bubble transport is restricted and the blow holes are reduced resulting in a char structure with an early stage of bubble evolution (i.e., smaller bubbles). SEM micrographs, shown in
Figure 4, confirm that the pore evolution is in the earlier stages for the char generated for higher pressure char as compared to a lower pressure char.
Unlike morphology, surface area showed a twofold increase from 109 to 332 m
2/g as the pressure was increased from 3.4 to 11.3 bar (shown in
Table 3). With further increase in pressure to 15.5 bar, the surface area decreased to 289 m
2/g and reduced further to 170 m
2/g at 21.7 bar. Interestingly, the surface area for chars generated over a range of pressures, reported in this study was much higher than the surface area of Pittsburgh No.8 coal char reported by Zeng and Fletcher [
13]. Zeng and Fletcher generated char under pyrolysis conditions, while the current study used CO
2/N
2 to generate chars. The higher surface area is likely due to CO
2 reaction with char that created new surface area. Like surface area, a similar trend was also observed for pore volume, where it increased from 0.14 to 0.30 cc/g as pressure was increased from 3.4 to 11.3 bar and reduced to 0.19 cc/g with further increase in pressure up to 21.7 bar (shown in
Figure 3D). The rapid increase in surface area and pore volume with increase in pressure up to 11.3 bar can be attributed to the opening of pores of size <50 Å. Analysis of pore size distribution shown in
Figure 3E shows that the pore volume in the size <50 Å increased by ≈192% as the pressure was increased from 3.4 (0.042 cc/g) to 11.3 bar (0.123 cc/g). Correspondingly, the volume in the pores of size >100 Å increased from 0.078 to 0.116 cc/g. With further increase in pressure to 21.7 bar, the volume of the pores of size <50 Å decreased to 0.065 cc/g, while the volume of the pores of size >100 Å remained similar (i.e., 0.064 cc/g) to that of the char generated at 11.3 bar. The reduction in pore volume in the micropore region (i.e., <50 Å) at higher pressures (15.5 and 21.7 bar) can be attributed increased mass transfer resistance to volatile release at these pressures.
The effect of pressure on char-O
2 reactivity is shown in
Figure 5A. The reactivity was obtained on devolatilized chars in the HPTGA. The apparent reactivity was highest for the char generated at 6.2 bar (0.0188 min
−1), while the chars generated at other pressures showed similar reactivities ranging between 0.0115 (for 3.4 bar char) and 0.0142 min
−1 (21.7 bar char). Normalizing the apparent reactivity with the N
2 surface area (i.e., intrinsic reactivity) obtained on the chars in the HPTGA showed that the intrinsic reactivity ranged between 3.0 × 10
−5 and 5.3 × 10
−5 g m
−2 min
−1. The result shows that pressure has no clear effect on the intrinsic reactivity. The intrinsic reactivity range reported in this work is larger than the intrinsic reactivity range reported for chars generated at higher pressures in other studies [
10,
13,
15]. While the other investigations used CO
2 surface area to determine the intrinsic reactivity, this study used N
2 surface area.
3.2. Effect of Feed Particle Density
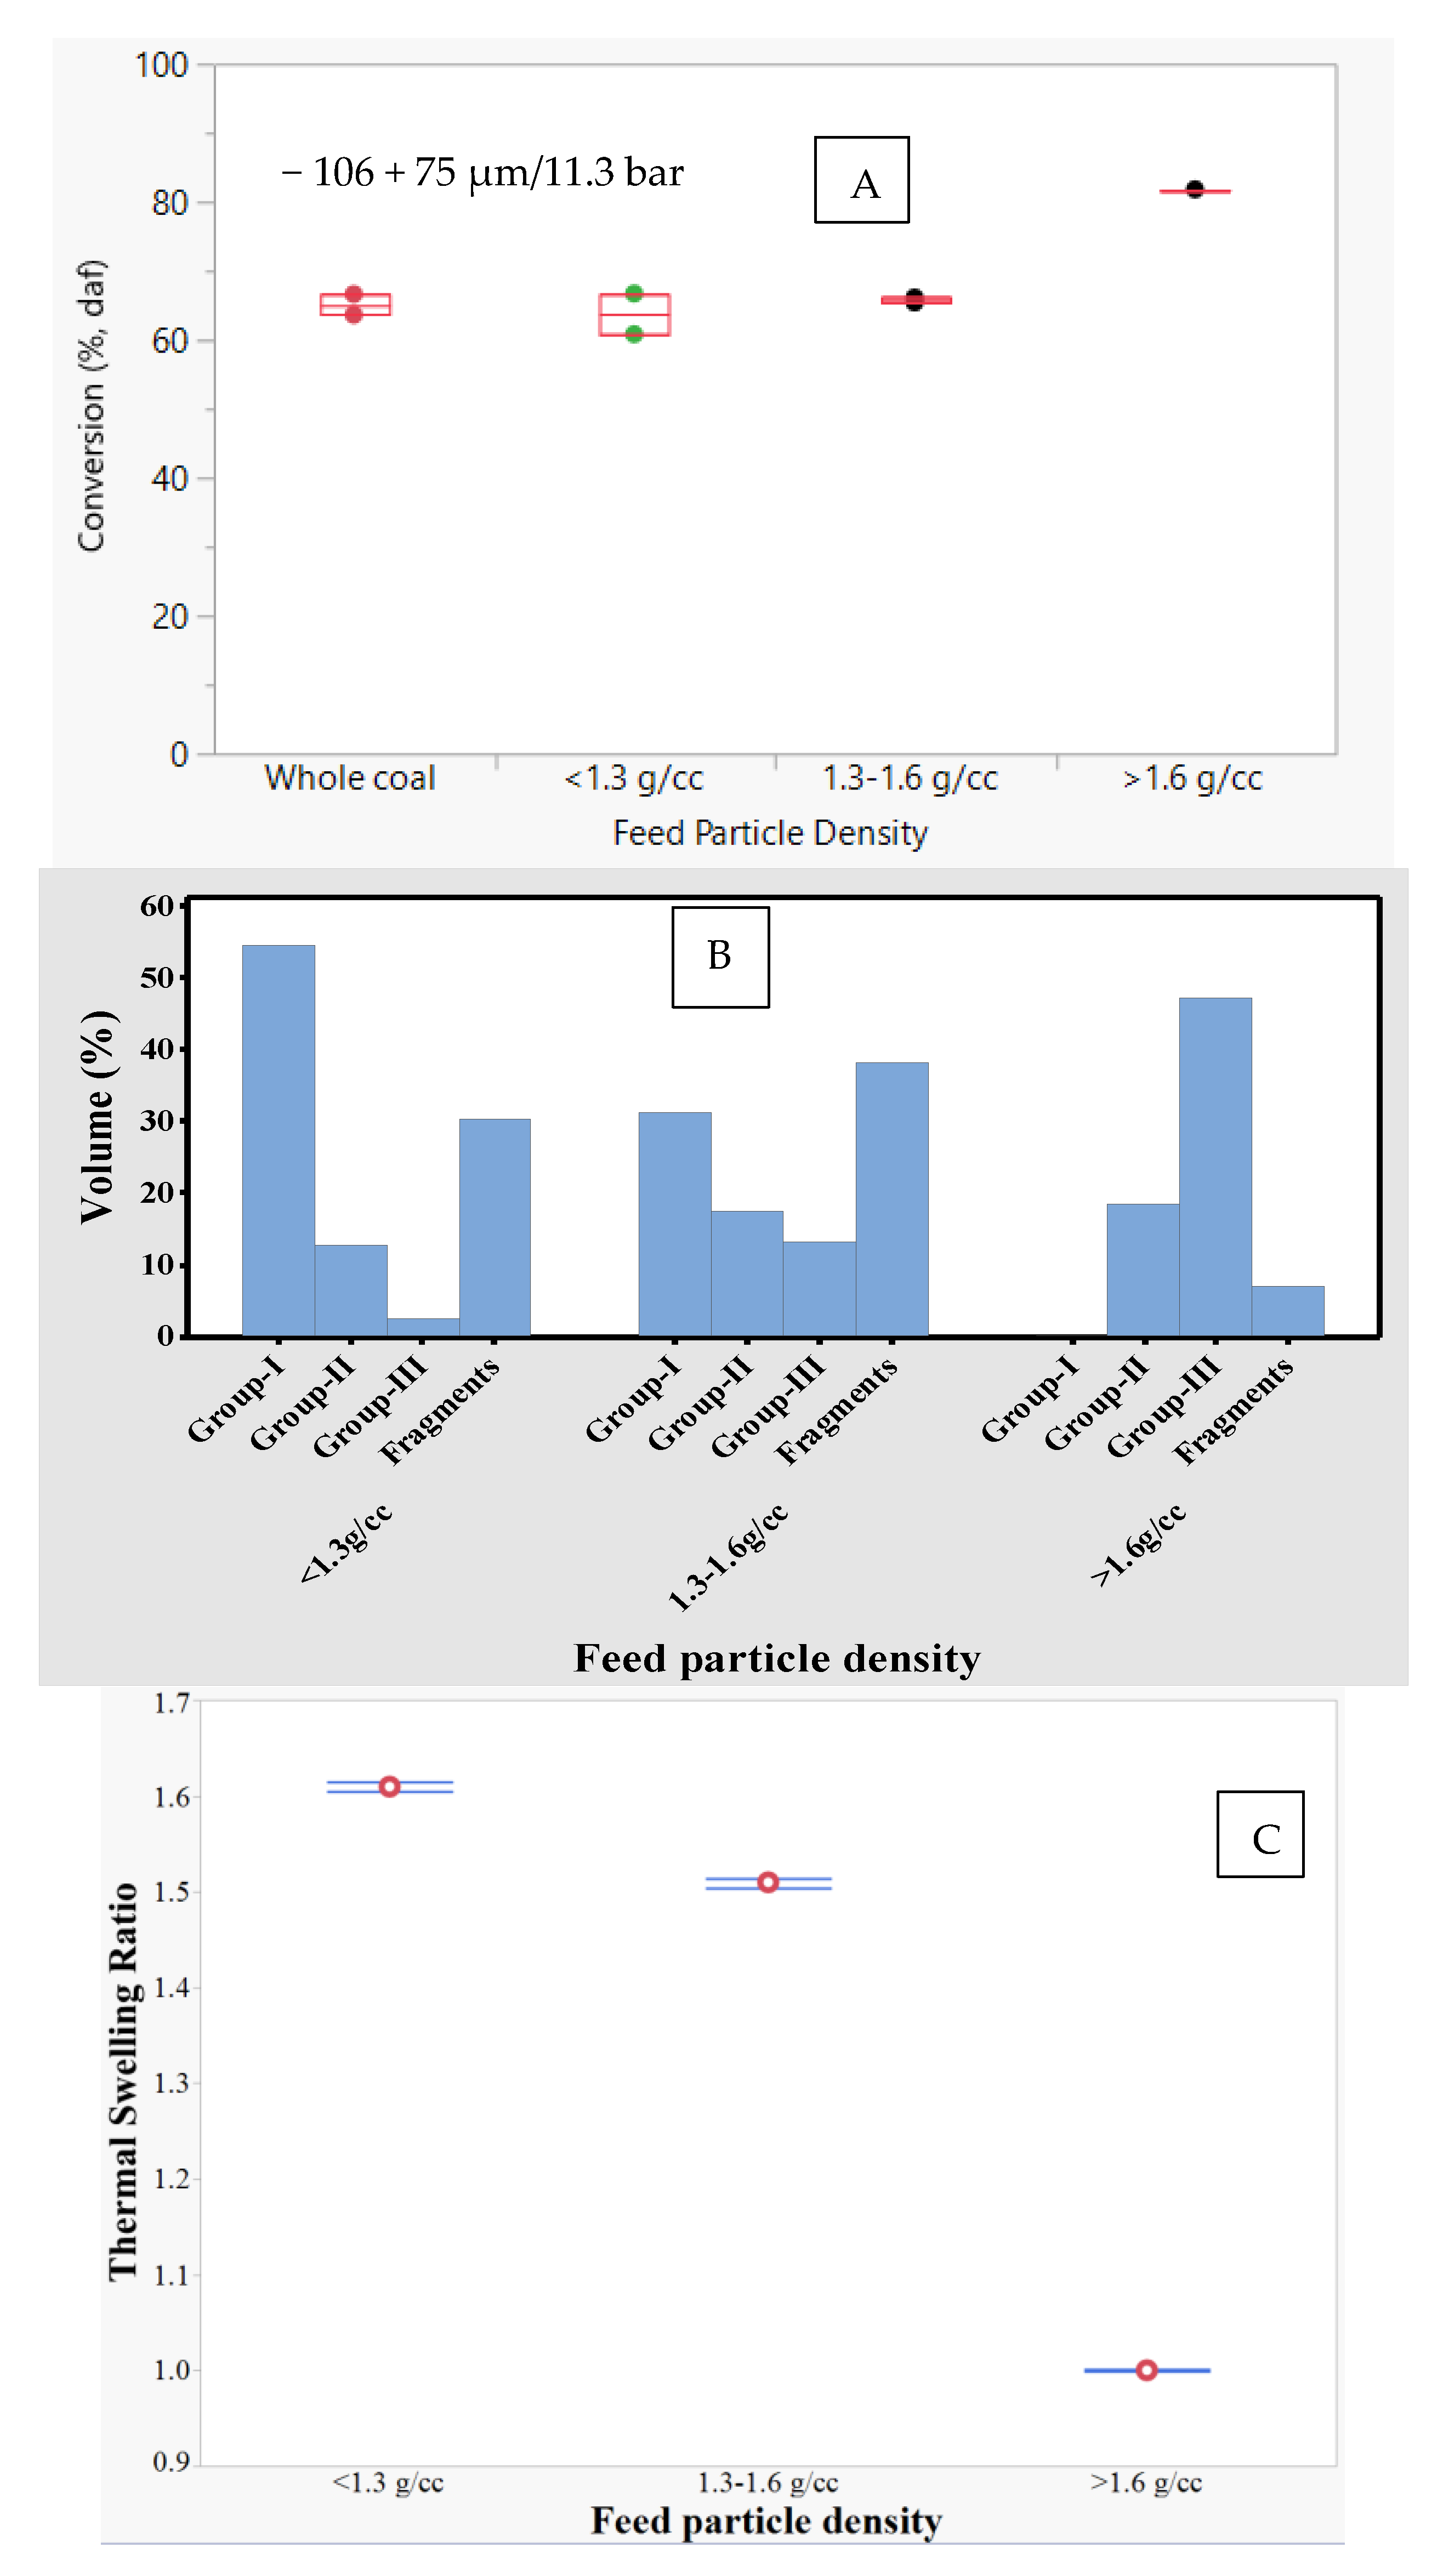
The effect of feed particle density was studied using three density fractions (i.e., <1.3, 1.3–1.6, and >1.6 g/cc) of the −106 + 75 µm sample size fraction. The total conversion on a dry-ash free basis of different feed density fractions at 1300 °C and 11.3 bar is shown in
Figure 6A. Interestingly, the conversion was highest (≈83%) for the >1.6 g/cc fraction, while the conversion for the 1.3–1.6 and >1.6 g/cc fractions were similar (≈65%). An earlier study with >1.6 g/cc fraction at 1500 °C/1 bar showed significant amount of meltphase formation that covered the carbonaceous matter [
33]. Although the amount of melt phase formation was expected to be much lower due to lower experimental temperature (i.e., 1300 °C) in this study, higher conversion was not expected. One of the reasons for higher conversion could be due to absence of highly ordered soot on the char surface. Presence of soot on the chars from low- and medium-density fractions seemed to have affected their gasification reactivity in HPHTFR. The HRTEM pictures presented in
Figure 7 confirmed the presence of soot for chars from low- and medium-density fractions. Soot was not observed for the sample generated from the high-density fraction. Absence of soot deposition could be due to variation in vitrinite content. Analysis of the density fractions of the Pittsburgh no.8 coal for maceral composition, reported elsewhere [
16], revealed that the highest density fraction had about 50 vol.% inertinite, while low- and medium-density fractions were rich (>75 vol.%) in liptinite and vitrinite combined. Vitrinite content is known to increase fluidity at higher pressures. The fluid (tar) tends to contain highly aromatic compounds which gets converted to soot due to polymerization reactions [
34,
35].
Table 3 and
Figure 6B–E show the thermal swelling ratio, morphology, surface area, and pore size distribution of chars for <1.3, 1.3–1.6, and >1.6 g/cc fractions. Increase in feed particle density decreased the thermal swelling ratio from 1.61 to 1.00, surface area from 327 to 11 m
2/g, group-I char concentration from 55% to 0%, and pore volume from 0.25 to 0.02 cc/g. Some of these results are in agreement with the observations made by Yu et al. [
17], who also showed that for Australian coals, both porosity and group-I char concentration decreased with increase in feed particle density. Variation in maceral content and inorganic matter concentration over various density fractions were shown to affect swelling [
36]. In the current study, higher vitrinite content (>70 vol.%) in low- and medium-density fractions implies higher fluidity, and consequently higher group-I char formation, surface area, and pore volume. Unlike vitrinite, inertinite does not develop much fluidity and hence does not generate high-porosity and high surface area char [
36]. Hence, the high-density fraction, with ≈50% inertinite, generated about 50% group-III char with no group-I char. Besides maceral content, the inorganic matter increased with feed particle density. It was suggested that ash grains in the char can reduce the fluidity of a particle and thereby preventing the entire particle from swelling [
30,
36,
37]. Absence of swelling means there is no substantial surface area or pore volume generated during gasification of the highest density fraction.
Figure 5B shows the apparent and intrinsic reactivities of chars. The apparent reactivity was highest for the char generated from the high-density fraction, while the chars generated from low- and medium-density fractions were relatively less reactive. Correspondingly, char surface area and pore volume decreased with increase in feed particle density. These imply that the char from the high-density fraction is structurally more reactive than that of chars from low- and medium-density fractions. The lower reactivity for the char from the low-density fraction could be due to increased structural ordering. The vitrinite content, which is known to cause fluidity and eventually structural ordering, increased with decrease in feed particle density. The reflectance microscopy analysis showed that the inertinite-derived section of the char was qualitatively found to be isotropic in nature with random reflectance of <5%, while the vitrinite-derived section of the char showed reflectance of >6.5%. Some particles from low- and medium-density fractions showed the presence of pyrolytic carbon (>10%). The higher reflectance is indicative of higher structural ordering. The random reflectance of the high-density fraction was not reported in
Table 3 due to the unavailability of vitrinite-derived portions in the char. The high degree of structural ordering seemed to have contributed to lower intrinsic reactivity for the char derived from the low-density fraction.
3.3. Effect of Temperature
The effect of temperature on conversion was investigated by generating chars from the −150 + 106 µm fraction at 11.3 bar and three different temperatures (1100 ± 13, 1300 ± 15, and 1400 ± 10 °C). These temperatures were chosen to cover the temperature range typically found in the second stage of a slurry-fed entrained flow gasifier [
38]. As
Figure 8A shows, the increase in temperature from 1100 to 1400 °C increased the conversion from 30 ± 8.2 to 70 ± 8.2 wt.%. Notably, the char generated at 1100 °C is in the early gasification stage (<50% conversion), while the chars generated at 1300 and 1400 °C were in the middle (50%–70% conversion) and late gasification (>70% conversion) stages, respectively.
Figure 8B,C shows the effect of temperature on morphology and thermal swelling ratio. As the temperature was increased, the thermal swelling ratio decreased marginally from 1.68 for 1100 °C char to 1.65 for 1300 °C char. The thermal swelling ratio is inversely proportional to the apparent density ratio of char to coal, and mass loss (shown in Equation (3)).
It can also be seen from
Figure 8B that fragmentation is significantly higher for char generated at 1300 °C. Gale et al. suggested that fragmentation can reduce thermal swelling ratio [
39]. As fragmentation increases, the char packing factor also increases and consequently the apparent density ratio of char to feed. Secondly, the conversion for 1300 °C char (≈58%) was much higher than that of 1100 °C char (≈30%). Despite higher conversion (ash content) and fragmentation, the thermal swelling ratio of the char generated at 1300 °C is not very different from the char generated at 1100 °C. This shows the thermal swelling ratio at given conversion increases with temperature up to 1300 °C. With further increase in temperature to 1400 °C, the thermal swelling ratio dropped substantially to 1.38. The decrease in thermal swelling ratio above 1300 °C can be attributed to increased conversion (or ash), and fragmentation. Increased fragmentation with temperature can mostly be attributed to pore enlargement and pore overlapping due to internal reaction with conversion causing thinning and ultimately breaking of the wall structure [
26].
Unlike thermal swelling ratio, temperature showed a significant effect on surface area and pore volume (shown in
Table 3 and
Figure 8E). The surface area and pore volume increased dramatically by a factor of 46 and 14, respectively, as temperature was increased from 1100 to 1300 °C. However, with further increase in temperature to 1400 °C, the surface area and pore volume decreased by ≈60% and ≈53% of 1300 °C char, respectively. It is important to remember that the conversion for the char generated at 1400 °C was above 70%. It is known that beyond a certain conversion (typically >60%), the pores of the chars collapse and merge, leading to lowered surface area and pore volume [
40]. Higher conversion and higher fragmentation for 1400 °C char seemed to have reduced the surface area and the pore volume.
Char generation temperature showed a significant effect on char reactivity, with apparent reactivity decreased by ≈59% from 23.7 × 10
−3 min
−1 for 1100 °C char to 9.6 × 10
−3 min
−1 for 1400 °C char (shown in
Figure 5C). Normalizing the apparent reactivity with the surface area also showed that there was a significant drop in intrinsic reactivity from 7.8 × 10
−5 gm
−2min
−1 for 1100 °C char to 3.0 × 10
−5 gm
−2min
−1 for 1300 °C char, and the intrinsic reactivity slightly increased to 3.7 × 10
−5 gm
−2min
−1 at 1400 °C. Previous studies also observed similar trends where the intrinsic reactivity decreased with increase in char generation temperature [
41,
42]. In this investigation, however, the intrinsic reactivities of chars generated at 1300 and 1400 °C are not very different. Tremel et al. also showed that above 2 s residence time, temperature does not significantly affect the intrinsic reactivity [
15].
The significant drop in reactivity at higher temperatures could be due to increased structural ordering. The chars were characterized for structural ordering through random reflectance. The random reflectance showed a significant increase from 6.86% ± 0.23% for 1100 °C char to 8.03% ± 0.45% for 1300 °C. However, further increase in temperature to 1400 °C did not increase the reflectance significantly (i.e., 8.16% ± 0.41%). Reflectance analysis showed that some of the particles, from 1300 and 1400 °C chars, had pyrolytic carbon with very high reflectance (>10%). Presence of pyrolytic carbon is an indication of graphitization. All these point to increased structural ordering and graphitization for the decline in reactivity for chars generated at 1300 and 1400 °C.
3.4. Effect of Feed Particle Size
The effect of initial coal particle size on conversion was studied on chars produced from four particle size fractions −106 + 75, −150 + 106, −212 + 150, and −425 + 212 µm—generated at 1300 °C and 11.3 bar. The conversion decreased from ≈65% to 38% as particle size increased from −106 + 75 to −425 + 212 µm (shown in
Figure 9A). The reduction in conversion with particle size can be attributed to increased diffusional resistance for reaction gas into char particles. Interestingly, the amount of residual volatile matter in the char also did not vary much with increase in feed particle size. Higher amount of volatile matter left in the char from the finest particle size fraction, despite higher conversion, suggests that the higher fluidity for that size fraction generated during pyrolysis.
Table 3 and
Figure 9B–E show the effect of initial particle size on thermal swelling ratio, surface area, and pore volume. As the feed particle size fraction increased from −106 + 75 to −425 + 212 µm, the char surface area and pore volume decreased from 333 to 119 m
2/g, and 0.30 to 0.08 cc/g, respectively. The difference in surface area and pore volume can be attributed to difference in organic composition. A study conducted by Hower showed that brittle microlithotypes, such as vitrite, are likely to partition to finer sizes, while hard-to-grind microlithotypes rich in inertinite and liptinite are likely to concentrate in the coarse-sized fractions (>150 µm) [
43]. The presence of higher concentration of non-caking inertinite as a part of multi-maceral microlithotype in a larger coal particle may have led to reduced fluidity and consequently reduction in group-I char concentration, surface area, and pore volume for coarse-sized fractions (i.e., −212 + 150 and −425 + 212 µm). Interestingly, the particle size marginally affected the char swelling ratio as it increased from 1.58 for the char from −425 + 212 µm fraction to 1.65 for the char from −150 + 106 µm fraction. Earlier studies under pyrolysis observed that swelling (or porosity) decreased with an increase in coal particle size [
17,
44,
45]. It is important to recognize that chars from the coarser size fractions are in early stages of conversion (<50%), while the chars from the fine-sized fractions (i.e., −106 + 75 and −150 + 106 µm) are in middle stages of conversion (50%–70%). Moreover, the extent of fragmentation of chars from the finer size fractions are much higher than the chars from the coarser size fractions. Fragmentation increases the packing factor, while the conversion is known to increase the density of chars and consequently reduce thermal swelling ratio. However, for a given conversion, it is likely that the particle size inversely affects the thermal swelling ratio.
The effects of initial feed particle size on apparent and intrinsic reactivities are shown in
Figure 5D. The apparent reactivity increased with particle size. The notable observation is that reactivities of chars generated from the fine-sized fractions were closer compared with reactivities of chars from the coarse-sized fractions. This trend is also visible in pore size distribution, and surface area (shown in
Table 3 and
Figure 9D). It appears that the organic composition (i.e., maceral composition) among fine-sized fractions are more similar compared to the maceral composition of the coarse-sized fractions. Lower surface areas and higher apparent reactivities for chars from the coarse-size fractions mean the chars are structurally more reactive. For the chars from the fine-sized fractions, there is a predominant effect of structural ordering leading to reorganization of carbon atoms which is reflected by the higher random reflectance (~8% for chars from −106 + 75 and −150 + 106 µm size fractions). The reorganization of carbon would only occur with the vitrinite-derived portion of the feed due to its ability to generate tars. Once the hydrogen is removed from the tars as volatiles, the tars undergo retrogressive reactions leading to increased structural ordering. Higher concentration of inertinite derivative in the char and limited fluidity (reflected by higher group-II concentration as shown in
Figure 9B) from the coarse-sized particle size distributions mean lower structural reordering. This explanation is supported by the lower random reflectance for the chars (shown in
Table 3) derived from the coarse-sized fractions (≈7% for chars from −212 + 150 and −425 + 212 µm size fractions).


